Cities with the Highest Percentage of Population Employed in Security & Protection in Vermont
RELATED REPORTS & OPTIONS
Security & Protection
Vermont
Compare Cities
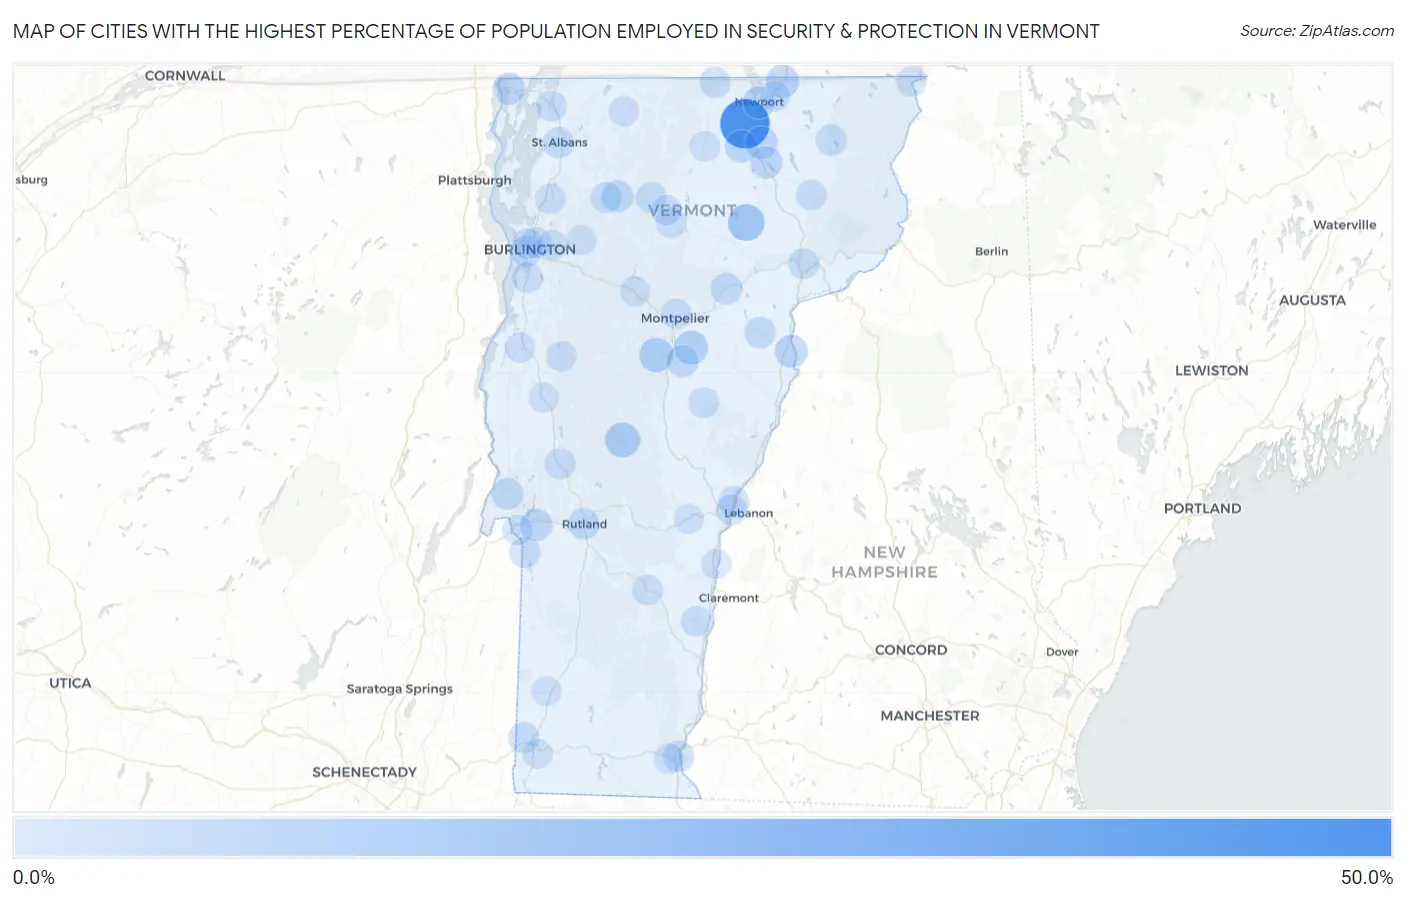
Map of Cities with the Highest Percentage of Population Employed in Security & Protection in Vermont
0.0%
50.0%
Cities with the Highest Percentage of Population Employed in Security & Protection in Vermont
| City | % Employed | vs State | vs National | |
| 1. | Coventry | 41.7% | 1.4%(+40.3)#1 | 2.1%(+39.5)#58 |
| 2. | Lyndon Center | 22.9% | 1.4%(+21.6)#2 | 2.1%(+20.8)#221 |
| 3. | Greensboro Bend | 13.7% | 1.4%(+12.3)#3 | 2.1%(+11.5)#596 |
| 4. | Danby | 13.1% | 1.4%(+11.8)#4 | 2.1%(+11.0)#646 |
| 5. | Rochester | 9.7% | 1.4%(+8.36)#5 | 2.1%(+7.56)#1,157 |
| 6. | Northfield | 8.5% | 1.4%(+7.17)#6 | 2.1%(+6.37)#1,484 |
| 7. | South Barre | 7.5% | 1.4%(+6.14)#7 | 2.1%(+5.34)#1,856 |
| 8. | Derby Line | 6.2% | 1.4%(+4.83)#8 | 2.1%(+4.04)#2,566 |
| 9. | Wells River | 5.9% | 1.4%(+4.58)#9 | 2.1%(+3.78)#2,769 |
| 10. | Irasburg | 5.0% | 1.4%(+3.65)#10 | 2.1%(+2.85)#3,697 |
| 11. | Castleton | 4.7% | 1.4%(+3.38)#11 | 2.1%(+2.59)#3,991 |
| 12. | Orleans | 4.6% | 1.4%(+3.26)#12 | 2.1%(+2.46)#4,163 |
| 13. | Barton | 4.6% | 1.4%(+3.25)#13 | 2.1%(+2.45)#4,178 |
| 14. | Newport | 4.2% | 1.4%(+2.83)#14 | 2.1%(+2.03)#4,780 |
| 15. | Alburgh | 4.1% | 1.4%(+2.78)#15 | 2.1%(+1.98)#4,867 |
| 16. | Williamstown | 3.6% | 1.4%(+2.28)#16 | 2.1%(+1.48)#5,859 |
| 17. | Jeffersonville | 3.5% | 1.4%(+2.14)#17 | 2.1%(+1.34)#6,146 |
| 18. | Benson | 3.4% | 1.4%(+2.06)#18 | 2.1%(+1.26)#6,351 |
| 19. | Marshfield | 3.2% | 1.4%(+1.89)#19 | 2.1%(+1.09)#6,763 |
| 20. | Sutton | 3.2% | 1.4%(+1.88)#20 | 2.1%(+1.08)#6,817 |
| 21. | Rutland | 2.9% | 1.4%(+1.54)#21 | 2.1%(+0.740)#7,862 |
| 22. | Groton | 2.8% | 1.4%(+1.44)#22 | 2.1%(+0.640)#8,192 |
| 23. | St Albans | 2.5% | 1.4%(+1.15)#23 | 2.1%(+0.348)#9,223 |
| 24. | Castleton Four Corners | 2.5% | 1.4%(+1.10)#24 | 2.1%(+0.304)#9,384 |
| 25. | Johnson | 2.4% | 1.4%(+1.06)#25 | 2.1%(+0.266)#9,524 |
| 26. | West Pawlet | 2.4% | 1.4%(+1.06)#26 | 2.1%(+0.261)#9,548 |
| 27. | Brandon | 2.3% | 1.4%(+0.922)#27 | 2.1%(+0.124)#10,113 |
| 28. | North Bennington | 2.2% | 1.4%(+0.879)#28 | 2.1%(+0.081)#10,299 |
| 29. | Cambridge | 2.2% | 1.4%(+0.871)#29 | 2.1%(+0.074)#10,347 |
| 30. | Island Pond | 2.2% | 1.4%(+0.864)#30 | 2.1%(+0.067)#10,371 |
| 31. | South Burlington | 2.2% | 1.4%(+0.843)#31 | 2.1%(+0.046)#10,468 |
| 32. | Brattleboro | 2.1% | 1.4%(+0.792)#32 | 2.1%(-0.006)#10,704 |
| 33. | Chittenden | 2.1% | 1.4%(+0.711)#33 | 2.1%(-0.087)#11,088 |
| 34. | Morrisville | 1.9% | 1.4%(+0.563)#34 | 2.1%(-0.235)#11,826 |
| 35. | Swanton | 1.9% | 1.4%(+0.558)#35 | 2.1%(-0.240)#11,847 |
| 36. | North Troy | 1.9% | 1.4%(+0.515)#36 | 2.1%(-0.283)#12,044 |
| 37. | Poultney | 1.7% | 1.4%(+0.366)#37 | 2.1%(-0.432)#12,783 |
| 38. | Chelsea | 1.6% | 1.4%(+0.253)#38 | 2.1%(-0.544)#13,385 |
| 39. | West Burke | 1.5% | 1.4%(+0.120)#39 | 2.1%(-0.678)#14,106 |
| 40. | White River Junction | 1.5% | 1.4%(+0.108)#40 | 2.1%(-0.690)#14,173 |
| 41. | Burlington | 1.5% | 1.4%(+0.102)#41 | 2.1%(-0.696)#14,214 |
| 42. | Springfield | 1.4% | 1.4%(+0.061)#42 | 2.1%(-0.736)#14,422 |
| 43. | Canaan | 1.4% | 1.4%(+0.038)#43 | 2.1%(-0.760)#14,551 |
| 44. | St Johnsbury | 1.4% | 1.4%(+0.006)#44 | 2.1%(-0.792)#14,736 |
| 45. | Hartford | 1.3% | 1.4%(-0.003)#45 | 2.1%(-0.801)#14,784 |
| 46. | Ludlow | 1.3% | 1.4%(-0.045)#46 | 2.1%(-0.843)#15,015 |
| 47. | Shelburne | 1.3% | 1.4%(-0.053)#47 | 2.1%(-0.850)#15,055 |
| 48. | Underhill Flats | 1.2% | 1.4%(-0.110)#48 | 2.1%(-0.908)#15,388 |
| 49. | Winooski | 1.1% | 1.4%(-0.228)#49 | 2.1%(-1.03)#16,005 |
| 50. | Lowell | 1.1% | 1.4%(-0.276)#50 | 2.1%(-1.07)#16,278 |
| 51. | Enosburg Falls | 1.0% | 1.4%(-0.303)#51 | 2.1%(-1.10)#16,444 |
| 52. | Derby Center | 1.00% | 1.4%(-0.356)#52 | 2.1%(-1.15)#16,730 |
| 53. | Fair Haven | 0.99% | 1.4%(-0.364)#53 | 2.1%(-1.16)#16,766 |
| 54. | Hyde Park | 0.94% | 1.4%(-0.412)#54 | 2.1%(-1.21)#17,006 |
| 55. | Milton | 0.93% | 1.4%(-0.420)#55 | 2.1%(-1.22)#17,057 |
| 56. | Essex Junction | 0.87% | 1.4%(-0.485)#56 | 2.1%(-1.28)#17,381 |
| 57. | Vergennes | 0.85% | 1.4%(-0.502)#57 | 2.1%(-1.30)#17,467 |
| 58. | Wilder | 0.85% | 1.4%(-0.504)#58 | 2.1%(-1.30)#17,480 |
| 59. | Bristol | 0.79% | 1.4%(-0.563)#59 | 2.1%(-1.36)#17,758 |
| 60. | Montpelier | 0.78% | 1.4%(-0.573)#60 | 2.1%(-1.37)#17,815 |
| 61. | Woodstock | 0.60% | 1.4%(-0.756)#61 | 2.1%(-1.55)#18,679 |
| 62. | Arlington | 0.56% | 1.4%(-0.792)#62 | 2.1%(-1.59)#18,828 |
| 63. | Middlebury | 0.52% | 1.4%(-0.826)#63 | 2.1%(-1.62)#18,976 |
| 64. | West Brattleboro | 0.48% | 1.4%(-0.867)#64 | 2.1%(-1.66)#19,109 |
| 65. | Waterbury | 0.46% | 1.4%(-0.886)#65 | 2.1%(-1.68)#19,204 |
| 66. | Windsor | 0.46% | 1.4%(-0.887)#66 | 2.1%(-1.68)#19,206 |
| 67. | Bennington | 0.46% | 1.4%(-0.892)#67 | 2.1%(-1.69)#19,232 |
| 68. | Jericho | 0.30% | 1.4%(-1.05)#68 | 2.1%(-1.85)#19,727 |
1
2Common Questions
What are the Top 10 Cities with the Highest Percentage of Population Employed in Security & Protection in Vermont?
Top 10 Cities with the Highest Percentage of Population Employed in Security & Protection in Vermont are:
#1
41.7%
#2
13.7%
#3
9.7%
#4
8.5%
#5
7.5%
#6
6.2%
#7
5.9%
#8
5.0%
#9
4.7%
#10
4.6%
What city has the Highest Percentage of Population Employed in Security & Protection in Vermont?
Coventry has the Highest Percentage of Population Employed in Security & Protection in Vermont with 41.7%.
What is the Percentage of Population Employed in Security & Protection in the State of Vermont?
Percentage of Population Employed in Security & Protection in Vermont is 1.4%.
What is the Percentage of Population Employed in Security & Protection in the United States?
Percentage of Population Employed in Security & Protection in the United States is 2.1%.