Cities with the Highest Percentage of Population Employed in Security & Protection in Oregon
RELATED REPORTS & OPTIONS
Security & Protection
Oregon
Compare Cities
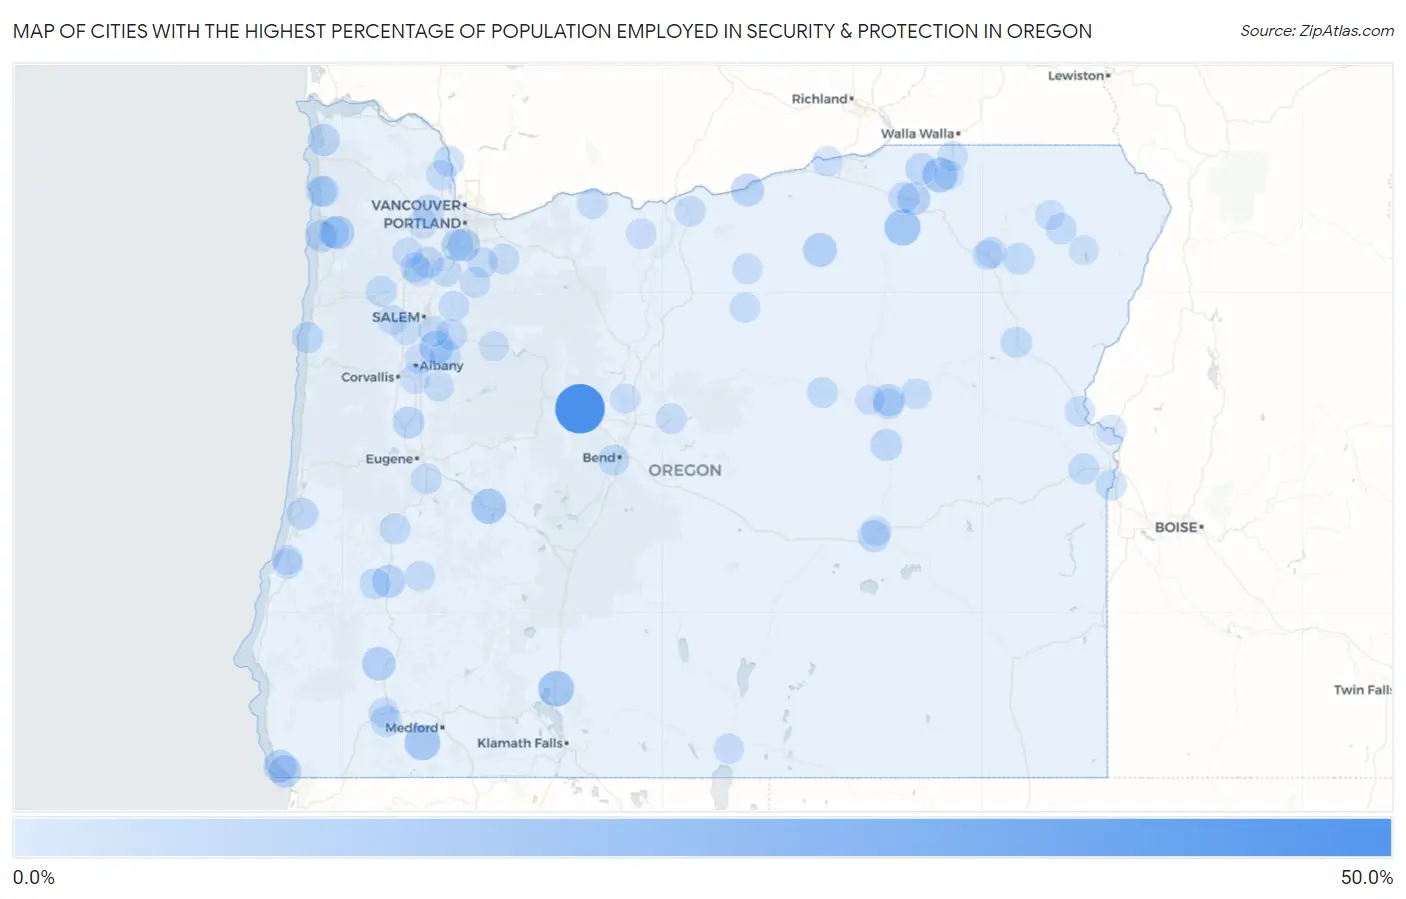
Map of Cities with the Highest Percentage of Population Employed in Security & Protection in Oregon
0.0%
50.0%
Cities with the Highest Percentage of Population Employed in Security & Protection in Oregon
| City | % Employed | vs State | vs National | |
| 1. | Black Butte Ranch | 50.0% | 1.7%(+48.3)#1 | 2.1%(+47.9)#27 |
| 2. | Pilot Rock | 16.5% | 1.7%(+14.9)#2 | 2.1%(+14.4)#406 |
| 3. | Chiloquin | 16.3% | 1.7%(+14.6)#3 | 2.1%(+14.1)#422 |
| 4. | Ruch | 15.6% | 1.7%(+13.9)#4 | 2.1%(+13.4)#457 |
| 5. | Neotsu | 15.0% | 1.7%(+13.3)#5 | 2.1%(+12.8)#488 |
| 6. | Oakridge | 14.3% | 1.7%(+12.7)#6 | 2.1%(+12.2)#535 |
| 7. | Athena | 14.0% | 1.7%(+12.4)#7 | 2.1%(+11.9)#565 |
| 8. | Bayshore | 13.9% | 1.7%(+12.2)#8 | 2.1%(+11.7)#576 |
| 9. | Heppner | 11.6% | 1.7%(+9.91)#9 | 2.1%(+9.41)#830 |
| 10. | Saunders Lake | 11.1% | 1.7%(+9.42)#10 | 2.1%(+8.92)#915 |
| 11. | Fairview | 11.0% | 1.7%(+9.30)#11 | 2.1%(+8.81)#932 |
| 12. | Marion | 10.8% | 1.7%(+9.16)#12 | 2.1%(+8.66)#950 |
| 13. | Glendale | 10.8% | 1.7%(+9.13)#13 | 2.1%(+8.64)#957 |
| 14. | Gopher Flats | 9.8% | 1.7%(+8.14)#14 | 2.1%(+7.64)#1,142 |
| 15. | Roseburg North | 9.6% | 1.7%(+7.95)#15 | 2.1%(+7.45)#1,178 |
| 16. | Brookings | 9.4% | 1.7%(+7.71)#16 | 2.1%(+7.22)#1,232 |
| 17. | Stafford | 9.4% | 1.7%(+7.71)#17 | 2.1%(+7.22)#1,233 |
| 18. | Arlington | 9.3% | 1.7%(+7.69)#18 | 2.1%(+7.19)#1,236 |
| 19. | Pleasant Valley | 9.1% | 1.7%(+7.44)#19 | 2.1%(+6.94)#1,293 |
| 20. | Harbor | 8.9% | 1.7%(+7.23)#20 | 2.1%(+6.74)#1,372 |
| 21. | Cheshire | 8.0% | 1.7%(+6.38)#21 | 2.1%(+5.89)#1,646 |
| 22. | Knappa | 8.0% | 1.7%(+6.37)#22 | 2.1%(+5.87)#1,651 |
| 23. | Rivergrove | 7.9% | 1.7%(+6.23)#23 | 2.1%(+5.74)#1,691 |
| 24. | Gearhart | 7.8% | 1.7%(+6.11)#24 | 2.1%(+5.62)#1,736 |
| 25. | John Day | 7.7% | 1.7%(+6.03)#25 | 2.1%(+5.53)#1,772 |
| 26. | Netarts | 7.4% | 1.7%(+5.78)#26 | 2.1%(+5.29)#1,885 |
| 27. | Harrisburg | 7.3% | 1.7%(+5.63)#27 | 2.1%(+5.13)#1,951 |
| 28. | Hines | 6.9% | 1.7%(+5.24)#28 | 2.1%(+4.75)#2,133 |
| 29. | Seneca | 6.9% | 1.7%(+5.24)#29 | 2.1%(+4.75)#2,141 |
| 30. | Reedsport | 6.9% | 1.7%(+5.21)#30 | 2.1%(+4.72)#2,152 |
| 31. | Helix | 6.7% | 1.7%(+5.01)#31 | 2.1%(+4.52)#2,261 |
| 32. | Dundee | 6.5% | 1.7%(+4.84)#32 | 2.1%(+4.34)#2,362 |
| 33. | Boring | 6.4% | 1.7%(+4.78)#33 | 2.1%(+4.28)#2,409 |
| 34. | Cove | 6.4% | 1.7%(+4.72)#34 | 2.1%(+4.23)#2,447 |
| 35. | Scio | 6.3% | 1.7%(+4.64)#35 | 2.1%(+4.15)#2,495 |
| 36. | Depoe Bay | 6.3% | 1.7%(+4.63)#36 | 2.1%(+4.14)#2,505 |
| 37. | Tillamook | 6.0% | 1.7%(+4.36)#37 | 2.1%(+3.87)#2,694 |
| 38. | Sublimity | 5.9% | 1.7%(+4.24)#38 | 2.1%(+3.75)#2,802 |
| 39. | New Hope | 5.7% | 1.7%(+4.05)#39 | 2.1%(+3.56)#2,963 |
| 40. | Baker City | 5.6% | 1.7%(+3.98)#40 | 2.1%(+3.49)#3,023 |
| 41. | Yoncalla | 5.6% | 1.7%(+3.93)#41 | 2.1%(+3.44)#3,074 |
| 42. | North Plains | 5.6% | 1.7%(+3.91)#42 | 2.1%(+3.42)#3,087 |
| 43. | Tetherow | 5.5% | 1.7%(+3.80)#43 | 2.1%(+3.31)#3,211 |
| 44. | Lostine | 5.4% | 1.7%(+3.75)#44 | 2.1%(+3.26)#3,254 |
| 45. | Pendleton | 5.4% | 1.7%(+3.72)#45 | 2.1%(+3.23)#3,282 |
| 46. | Sheridan | 5.2% | 1.7%(+3.50)#46 | 2.1%(+3.01)#3,525 |
| 47. | Nyssa | 5.1% | 1.7%(+3.47)#47 | 2.1%(+2.97)#3,564 |
| 48. | Columbia City | 5.1% | 1.7%(+3.43)#48 | 2.1%(+2.94)#3,600 |
| 49. | Elmira | 5.0% | 1.7%(+3.35)#49 | 2.1%(+2.85)#3,693 |
| 50. | Donald | 5.0% | 1.7%(+3.31)#50 | 2.1%(+2.82)#3,731 |
| 51. | Melrose | 4.8% | 1.7%(+3.20)#51 | 2.1%(+2.70)#3,869 |
| 52. | Bayside Gardens | 4.8% | 1.7%(+3.19)#52 | 2.1%(+2.69)#3,881 |
| 53. | Vale | 4.8% | 1.7%(+3.18)#53 | 2.1%(+2.68)#3,896 |
| 54. | Dayville | 4.8% | 1.7%(+3.15)#54 | 2.1%(+2.66)#3,921 |
| 55. | Wasco | 4.7% | 1.7%(+3.03)#55 | 2.1%(+2.54)#4,052 |
| 56. | Estacada | 4.7% | 1.7%(+3.03)#56 | 2.1%(+2.54)#4,058 |
| 57. | Molalla | 4.7% | 1.7%(+3.03)#57 | 2.1%(+2.53)#4,063 |
| 58. | Manzanita | 4.7% | 1.7%(+3.01)#58 | 2.1%(+2.52)#4,087 |
| 59. | Beavercreek | 4.6% | 1.7%(+2.99)#59 | 2.1%(+2.50)#4,109 |
| 60. | Creswell | 4.6% | 1.7%(+2.98)#60 | 2.1%(+2.49)#4,130 |
| 61. | Prairie City | 4.6% | 1.7%(+2.98)#61 | 2.1%(+2.48)#4,131 |
| 62. | Dayton | 4.6% | 1.7%(+2.91)#62 | 2.1%(+2.42)#4,221 |
| 63. | Odell | 4.5% | 1.7%(+2.86)#63 | 2.1%(+2.36)#4,306 |
| 64. | Turner | 4.5% | 1.7%(+2.81)#64 | 2.1%(+2.31)#4,377 |
| 65. | Falcon Heights | 4.4% | 1.7%(+2.77)#65 | 2.1%(+2.28)#4,430 |
| 66. | Canyon City | 4.4% | 1.7%(+2.75)#66 | 2.1%(+2.26)#4,455 |
| 67. | Glide | 4.4% | 1.7%(+2.74)#67 | 2.1%(+2.24)#4,480 |
| 68. | Prineville | 4.3% | 1.7%(+2.67)#68 | 2.1%(+2.18)#4,579 |
| 69. | Huntington | 4.2% | 1.7%(+2.55)#69 | 2.1%(+2.06)#4,749 |
| 70. | Island City | 4.2% | 1.7%(+2.50)#70 | 2.1%(+2.01)#4,824 |
| 71. | Fossil | 4.1% | 1.7%(+2.42)#71 | 2.1%(+1.92)#4,979 |
| 72. | Silverton | 4.1% | 1.7%(+2.40)#72 | 2.1%(+1.91)#4,994 |
| 73. | Dufur | 4.0% | 1.7%(+2.36)#73 | 2.1%(+1.86)#5,069 |
| 74. | Millersburg | 4.0% | 1.7%(+2.34)#74 | 2.1%(+1.85)#5,108 |
| 75. | Irrigon | 3.8% | 1.7%(+2.19)#75 | 2.1%(+1.69)#5,428 |
| 76. | Cornelius | 3.7% | 1.7%(+2.04)#76 | 2.1%(+1.54)#5,735 |
| 77. | La Grande | 3.7% | 1.7%(+2.02)#77 | 2.1%(+1.52)#5,775 |
| 78. | Redwood | 3.6% | 1.7%(+1.99)#78 | 2.1%(+1.50)#5,830 |
| 79. | Condon | 3.6% | 1.7%(+1.94)#79 | 2.1%(+1.44)#5,929 |
| 80. | Coos Bay | 3.6% | 1.7%(+1.91)#80 | 2.1%(+1.41)#5,995 |
| 81. | Annex | 3.6% | 1.7%(+1.90)#81 | 2.1%(+1.40)#6,007 |
| 82. | Warren | 3.5% | 1.7%(+1.88)#82 | 2.1%(+1.39)#6,037 |
| 83. | Lakeview | 3.5% | 1.7%(+1.83)#83 | 2.1%(+1.34)#6,156 |
| 84. | Yamhill | 3.5% | 1.7%(+1.82)#84 | 2.1%(+1.32)#6,194 |
| 85. | Burns | 3.4% | 1.7%(+1.79)#85 | 2.1%(+1.29)#6,273 |
| 86. | Tangent | 3.4% | 1.7%(+1.73)#86 | 2.1%(+1.23)#6,429 |
| 87. | Mount Vernon | 3.3% | 1.7%(+1.68)#87 | 2.1%(+1.18)#6,547 |
| 88. | Independence | 3.3% | 1.7%(+1.67)#88 | 2.1%(+1.17)#6,583 |
| 89. | Milton Freewater | 3.3% | 1.7%(+1.66)#89 | 2.1%(+1.17)#6,589 |
| 90. | South Lebanon | 3.3% | 1.7%(+1.61)#90 | 2.1%(+1.11)#6,713 |
| 91. | River Road | 3.3% | 1.7%(+1.60)#91 | 2.1%(+1.11)#6,727 |
| 92. | Lafayette | 3.2% | 1.7%(+1.59)#92 | 2.1%(+1.09)#6,770 |
| 93. | Crooked River Ranch | 3.2% | 1.7%(+1.54)#93 | 2.1%(+1.05)#6,872 |
| 94. | Dallas | 3.2% | 1.7%(+1.54)#94 | 2.1%(+1.05)#6,873 |
| 95. | Weston | 3.2% | 1.7%(+1.52)#95 | 2.1%(+1.03)#6,936 |
| 96. | Svensen | 3.1% | 1.7%(+1.40)#96 | 2.1%(+0.905)#7,306 |
| 97. | North Bend | 2.9% | 1.7%(+1.26)#97 | 2.1%(+0.764)#7,789 |
| 98. | Joseph | 2.9% | 1.7%(+1.25)#98 | 2.1%(+0.757)#7,805 |
| 99. | Wallowa | 2.8% | 1.7%(+1.19)#99 | 2.1%(+0.700)#7,993 |
| 100. | Gates | 2.8% | 1.7%(+1.19)#100 | 2.1%(+0.692)#8,017 |
Common Questions
What are the Top 10 Cities with the Highest Percentage of Population Employed in Security & Protection in Oregon?
Top 10 Cities with the Highest Percentage of Population Employed in Security & Protection in Oregon are:
#1
50.0%
#2
16.5%
#3
16.3%
#4
15.6%
#5
14.3%
#6
14.0%
#7
11.6%
#8
11.0%
#9
10.8%
#10
10.8%
What city has the Highest Percentage of Population Employed in Security & Protection in Oregon?
Black Butte Ranch has the Highest Percentage of Population Employed in Security & Protection in Oregon with 50.0%.
What is the Percentage of Population Employed in Security & Protection in the State of Oregon?
Percentage of Population Employed in Security & Protection in Oregon is 1.7%.
What is the Percentage of Population Employed in Security & Protection in the United States?
Percentage of Population Employed in Security & Protection in the United States is 2.1%.