Zip Codes with the Highest Percentage of Population Employed in Security & Protection in Rancho Santa Fe, CA
RELATED REPORTS & OPTIONS
Security & Protection
Rancho Santa Fe
Compare Zip Codes
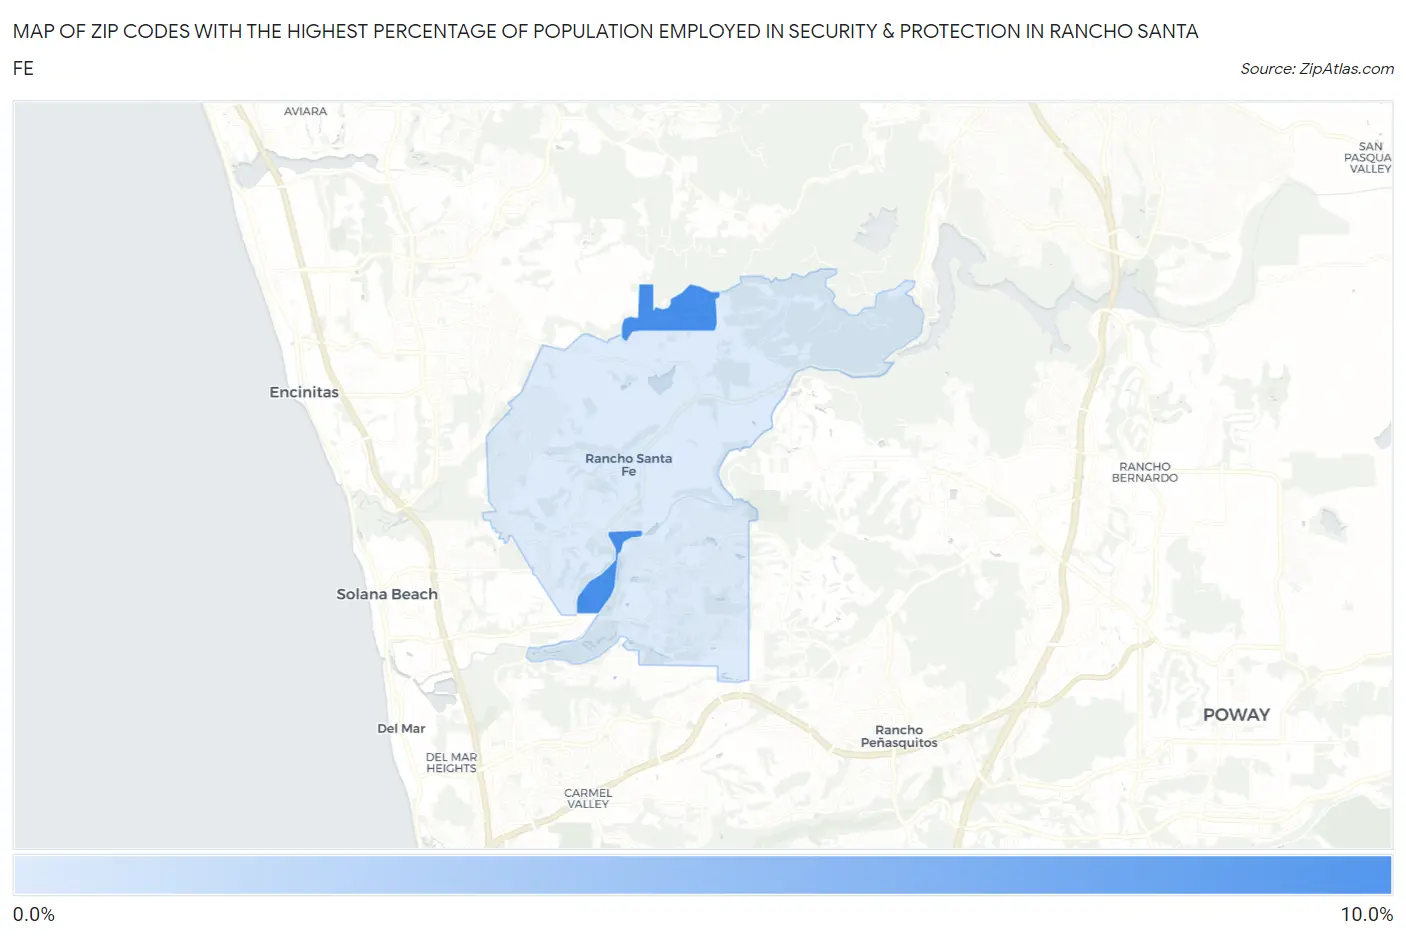
Map of Zip Codes with the Highest Percentage of Population Employed in Security & Protection in Rancho Santa Fe
0.59%
8.3%
Zip Codes with the Highest Percentage of Population Employed in Security & Protection in Rancho Santa Fe, CA
| Zip Code | % Employed | vs State | vs National | |
| 1. | 92091 | 8.3% | 2.1%(+6.25)#55 | 2.1%(+6.18)#1,060 |
| 2. | 92067 | 0.59% | 2.1%(-1.49)#1,323 | 2.1%(-1.55)#22,703 |
1
Common Questions
What are the Top Zip Codes with the Highest Percentage of Population Employed in Security & Protection in Rancho Santa Fe, CA?
Top Zip Codes with the Highest Percentage of Population Employed in Security & Protection in Rancho Santa Fe, CA are:
What zip code has the Highest Percentage of Population Employed in Security & Protection in Rancho Santa Fe, CA?
92091 has the Highest Percentage of Population Employed in Security & Protection in Rancho Santa Fe, CA with 8.3%.
What is the Percentage of Population Employed in Security & Protection in Rancho Santa Fe, CA?
Percentage of Population Employed in Security & Protection in Rancho Santa Fe is 1.7%.
What is the Percentage of Population Employed in Security & Protection in California?
Percentage of Population Employed in Security & Protection in California is 2.1%.
What is the Percentage of Population Employed in Security & Protection in the United States?
Percentage of Population Employed in Security & Protection in the United States is 2.1%.