West Bishop, CA Map & Demographics
West Bishop Map
West Bishop Overview
$45,657
PER CAPITA INCOME
$119,167
AVG FAMILY INCOME
$105,685
AVG HOUSEHOLD INCOME
7.3%
WAGE / INCOME GAP [ % ]
92.7¢/ $1
WAGE / INCOME GAP [ $ ]
0.38
INEQUALITY / GINI INDEX
2,430
TOTAL POPULATION
1,358
MALE POPULATION
1,072
FEMALE POPULATION
126.68
MALES / 100 FEMALES
78.94
FEMALES / 100 MALES
50.1
MEDIAN AGE
3.4
AVG FAMILY SIZE
2.8
AVG HOUSEHOLD SIZE
1,092
LABOR FORCE [ PEOPLE ]
56.5%
PERCENT IN LABOR FORCE
5.3%
UNEMPLOYMENT RATE
Income in West Bishop
Income Overview in West Bishop
Per Capita Income in West Bishop is $45,657, while median incomes of families and households are $119,167 and $105,685 respectively.
| Characteristic | Number | Measure |
| Per Capita Income | 2,430 | $45,657 |
| Median Family Income | 604 | $119,167 |
| Mean Family Income | 604 | $126,854 |
| Median Household Income | 881 | $105,685 |
| Mean Household Income | 881 | $112,561 |
| Income Deficit | 604 | $0 |
| Wage / Income Gap (%) | 2,430 | 7.28% |
| Wage / Income Gap ($) | 2,430 | 92.72¢ per $1 |
| Gini / Inequality Index | 2,430 | 0.38 |
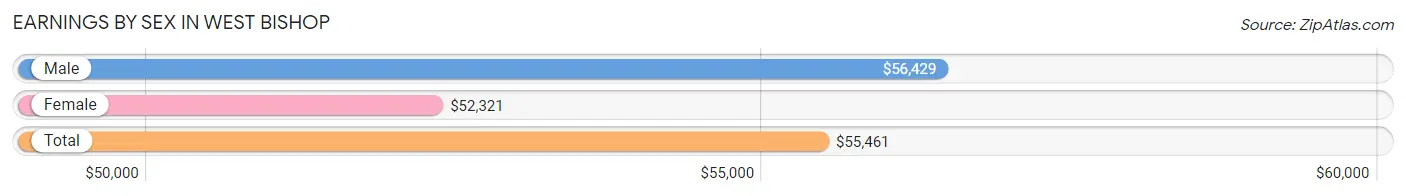
Earnings by Sex in West Bishop
Average Earnings in West Bishop are $55,461, $56,429 for men and $52,321 for women, a difference of 7.3%.
| Sex | Number | Average Earnings |
| Male | 618 (56.0%) | $56,429 |
| Female | 486 (44.0%) | $52,321 |
| Total | 1,104 (100.0%) | $55,461 |
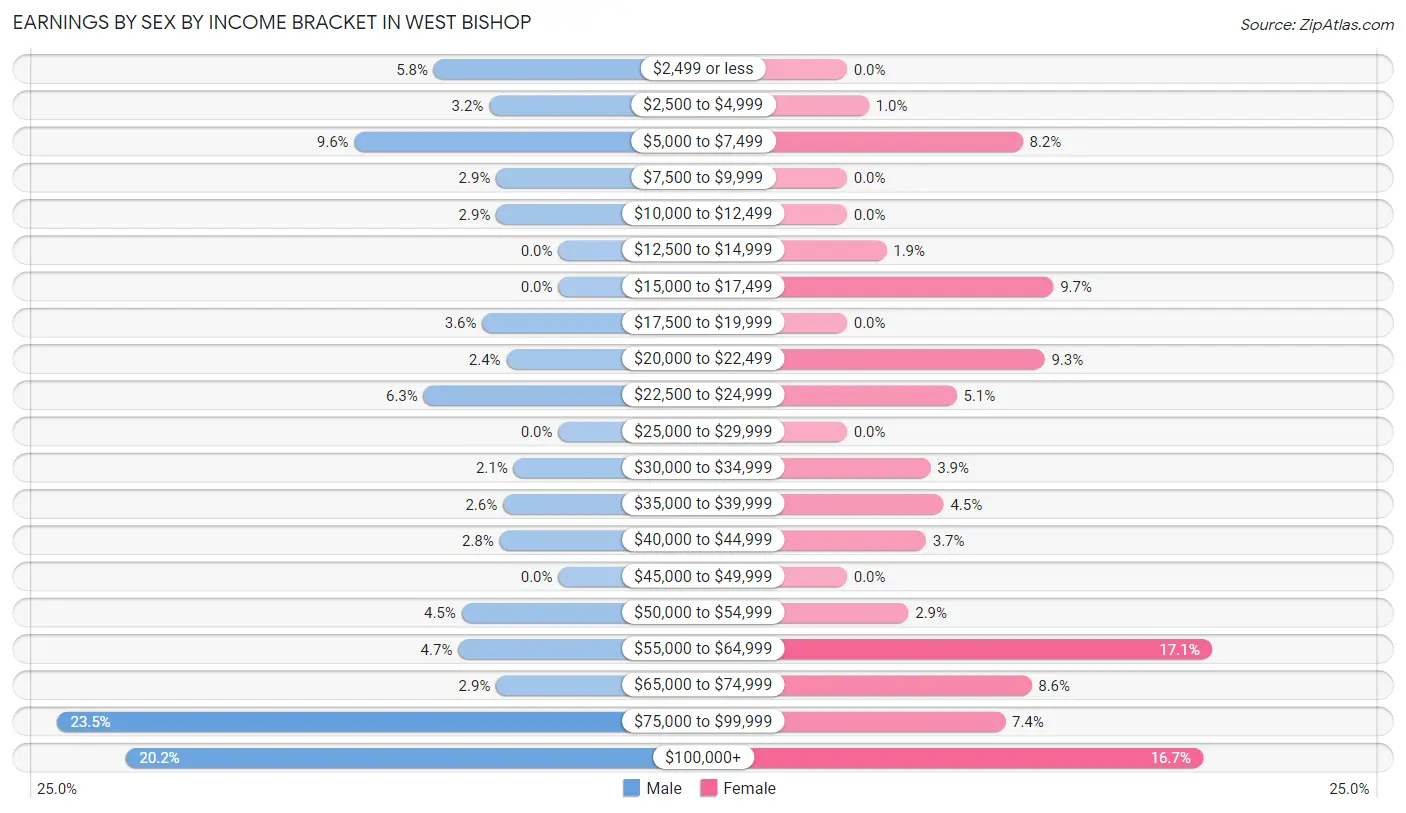
Earnings by Sex by Income Bracket in West Bishop
The most common earnings brackets in West Bishop are $75,000 to $99,999 for men (145 | 23.5%) and $55,000 to $64,999 for women (83 | 17.1%).
| Income | Male | Female |
| $2,499 or less | 36 (5.8%) | 0 (0.0%) |
| $2,500 to $4,999 | 20 (3.2%) | 5 (1.0%) |
| $5,000 to $7,499 | 59 (9.6%) | 40 (8.2%) |
| $7,500 to $9,999 | 18 (2.9%) | 0 (0.0%) |
| $10,000 to $12,499 | 18 (2.9%) | 0 (0.0%) |
| $12,500 to $14,999 | 0 (0.0%) | 9 (1.8%) |
| $15,000 to $17,499 | 0 (0.0%) | 47 (9.7%) |
| $17,500 to $19,999 | 22 (3.6%) | 0 (0.0%) |
| $20,000 to $22,499 | 15 (2.4%) | 45 (9.3%) |
| $22,500 to $24,999 | 39 (6.3%) | 25 (5.1%) |
| $25,000 to $29,999 | 0 (0.0%) | 0 (0.0%) |
| $30,000 to $34,999 | 13 (2.1%) | 19 (3.9%) |
| $35,000 to $39,999 | 16 (2.6%) | 22 (4.5%) |
| $40,000 to $44,999 | 17 (2.8%) | 18 (3.7%) |
| $45,000 to $49,999 | 0 (0.0%) | 0 (0.0%) |
| $50,000 to $54,999 | 28 (4.5%) | 14 (2.9%) |
| $55,000 to $64,999 | 29 (4.7%) | 83 (17.1%) |
| $65,000 to $74,999 | 18 (2.9%) | 42 (8.6%) |
| $75,000 to $99,999 | 145 (23.5%) | 36 (7.4%) |
| $100,000+ | 125 (20.2%) | 81 (16.7%) |
| Total | 618 (100.0%) | 486 (100.0%) |
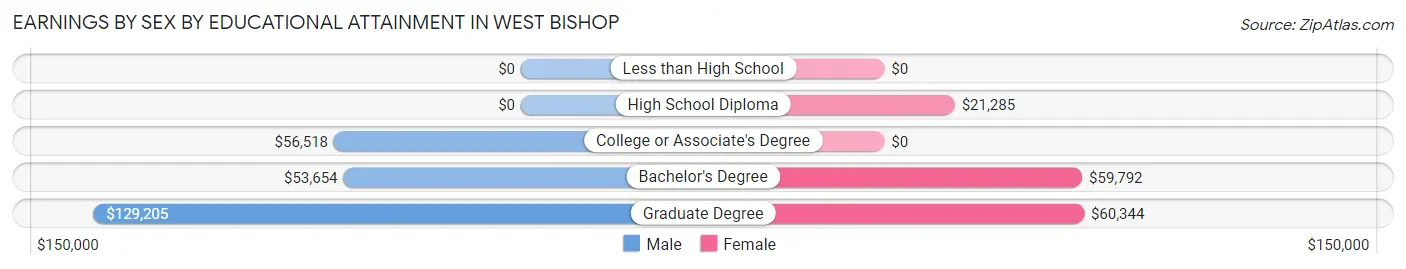
Earnings by Sex by Educational Attainment in West Bishop
Average earnings in West Bishop are $73,295 for men and $52,321 for women, a difference of 28.6%. Men with an educational attainment of graduate degree enjoy the highest average annual earnings of $129,205, while those with bachelor's degree education earn the least with $53,654. Women with an educational attainment of graduate degree earn the most with the average annual earnings of $60,344, while those with high school diploma education have the smallest earnings of $21,285.
| Educational Attainment | Male Income | Female Income |
| Less than High School | - | - |
| High School Diploma | - | - |
| College or Associate's Degree | $56,518 | $0 |
| Bachelor's Degree | $53,654 | $59,792 |
| Graduate Degree | $129,205 | $60,344 |
| Total | $73,295 | $52,321 |
Family Income in West Bishop
Family Income Brackets in West Bishop
According to the West Bishop family income data, there are 132 families falling into the $100,000 to $149,999 income range, which is the most common income bracket and makes up 21.8% of all families.
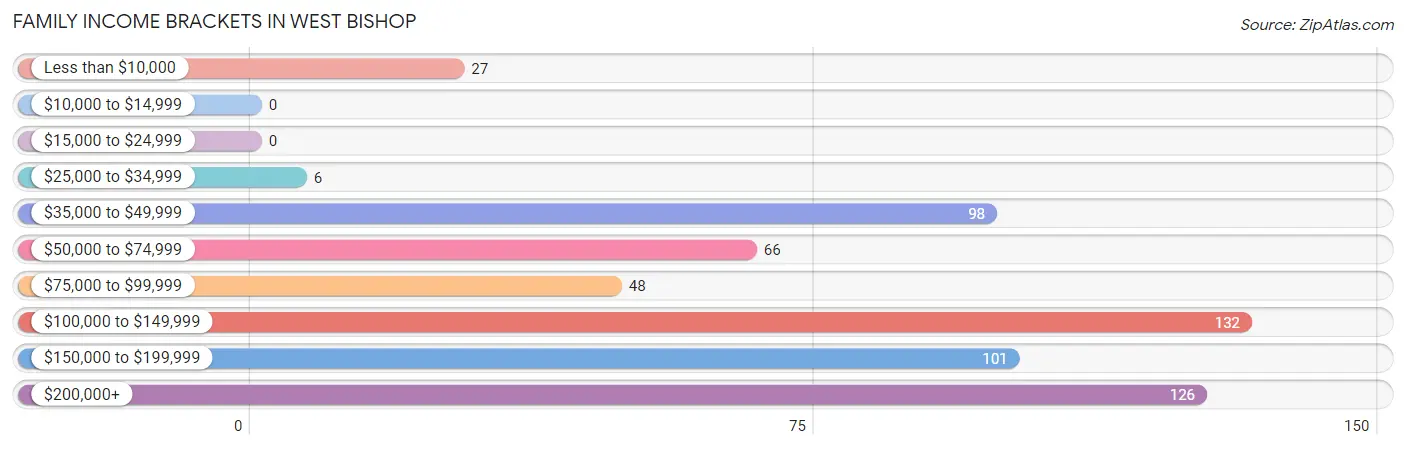
| Income Bracket | # Families | % Families |
| Less than $10,000 | 27 | 4.5% |
| $10,000 to $14,999 | 0 | 0.0% |
| $15,000 to $24,999 | 0 | 0.0% |
| $25,000 to $34,999 | 6 | 1.0% |
| $35,000 to $49,999 | 98 | 16.2% |
| $50,000 to $74,999 | 66 | 10.9% |
| $75,000 to $99,999 | 48 | 7.9% |
| $100,000 to $149,999 | 132 | 21.9% |
| $150,000 to $199,999 | 101 | 16.7% |
| $200,000+ | 126 | 20.9% |
Family Income by Famaliy Size in West Bishop
4-person families (112 | 18.5%) account for the highest median family income in West Bishop with $186,719 per family, while 2-person families (354 | 58.6%) have the highest median income of $56,435 per family member.
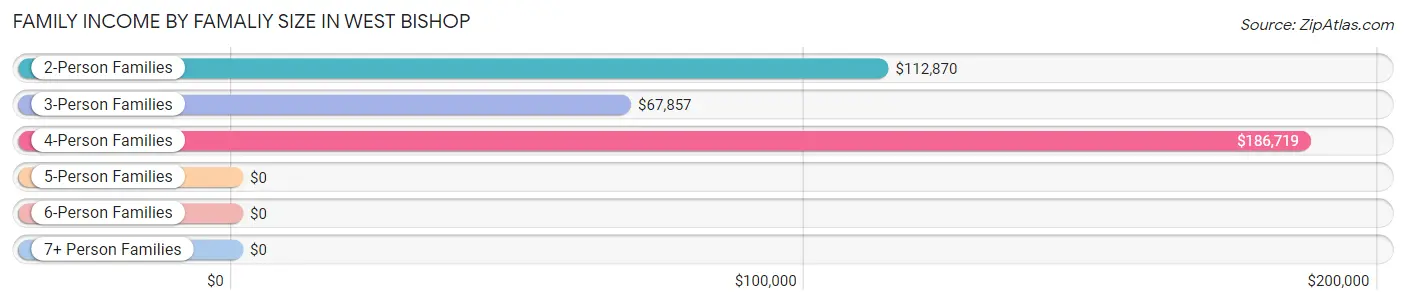
| Income Bracket | # Families | Median Income |
| 2-Person Families | 354 (58.6%) | $112,870 |
| 3-Person Families | 98 (16.2%) | $67,857 |
| 4-Person Families | 112 (18.5%) | $186,719 |
| 5-Person Families | 40 (6.6%) | $0 |
| 6-Person Families | 0 (0.0%) | $0 |
| 7+ Person Families | 0 (0.0%) | $0 |
| Total | 604 (100.0%) | $119,167 |
Family Income by Number of Earners in West Bishop
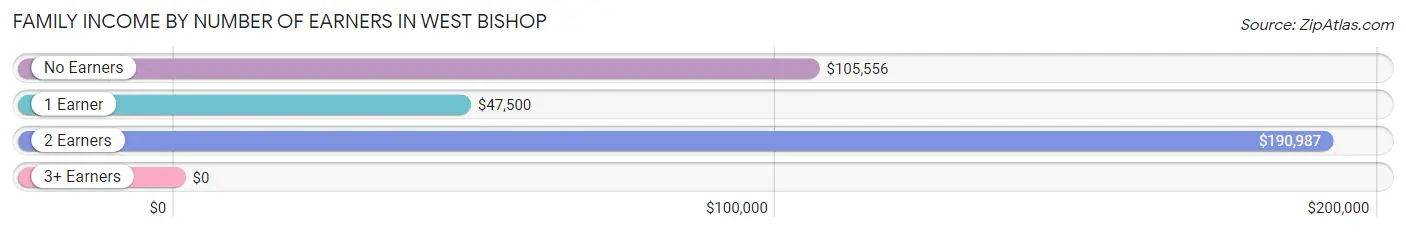
| Number of Earners | # Families | Median Income |
| No Earners | 180 (29.8%) | $105,556 |
| 1 Earner | 180 (29.8%) | $47,500 |
| 2 Earners | 215 (35.6%) | $190,987 |
| 3+ Earners | 29 (4.8%) | $0 |
| Total | 604 (100.0%) | $119,167 |
Household Income in West Bishop
Household Income Brackets in West Bishop
With 169 households falling in the category, the $100,000 to $149,999 income range is the most frequent in West Bishop, accounting for 19.2% of all households. In contrast, only 6 households (0.7%) fall into the $25,000 to $34,999 income bracket, making it the least populous group.
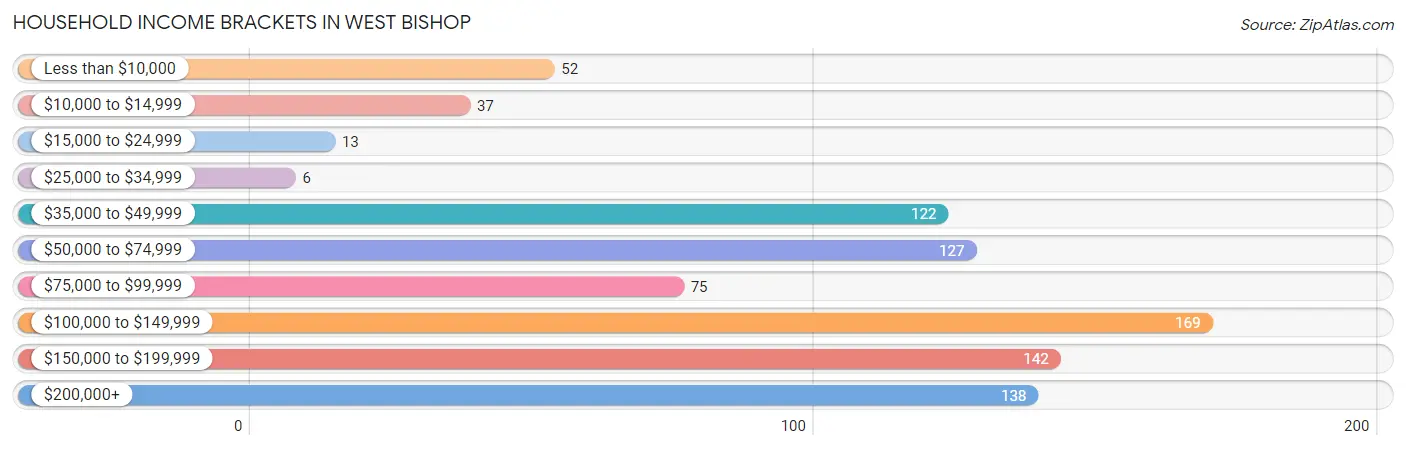
| Income Bracket | # Households | % Households |
| Less than $10,000 | 52 | 5.9% |
| $10,000 to $14,999 | 37 | 4.2% |
| $15,000 to $24,999 | 13 | 1.5% |
| $25,000 to $34,999 | 6 | 0.7% |
| $35,000 to $49,999 | 122 | 13.8% |
| $50,000 to $74,999 | 127 | 14.4% |
| $75,000 to $99,999 | 75 | 8.5% |
| $100,000 to $149,999 | 169 | 19.2% |
| $150,000 to $199,999 | 142 | 16.1% |
| $200,000+ | 138 | 15.7% |
Household Income by Householder Age in West Bishop
The median household income in West Bishop is $105,685, with the highest median household income of $185,547 found in the 25 to 44 years age bracket for the primary householder. A total of 156 households (17.7%) fall into this category.
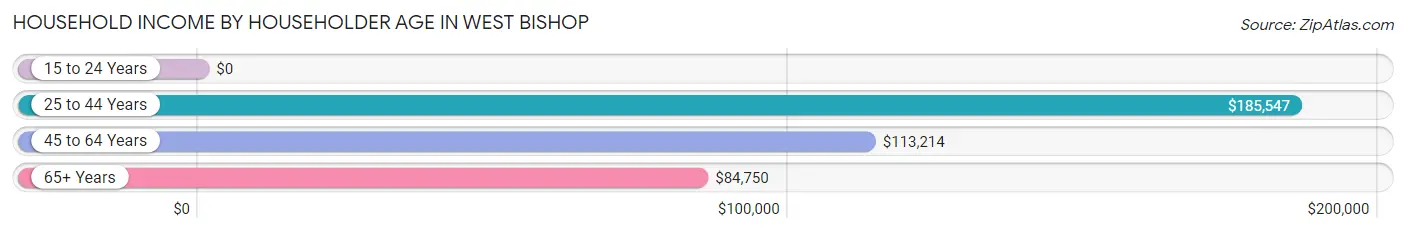
| Income Bracket | # Households | Median Income |
| 15 to 24 Years | 0 (0.0%) | $0 |
| 25 to 44 Years | 156 (17.7%) | $185,547 |
| 45 to 64 Years | 284 (32.2%) | $113,214 |
| 65+ Years | 441 (50.1%) | $84,750 |
| Total | 881 (100.0%) | $105,685 |
Poverty in West Bishop
Income Below Poverty by Sex and Age in West Bishop
With 8.9% poverty level for males and 3.5% for females among the residents of West Bishop, 75 year old and over males and 55 to 64 year old females are the most vulnerable to poverty, with 14 males (14.3%) and 22 females (12.2%) in their respective age groups living below the poverty level.
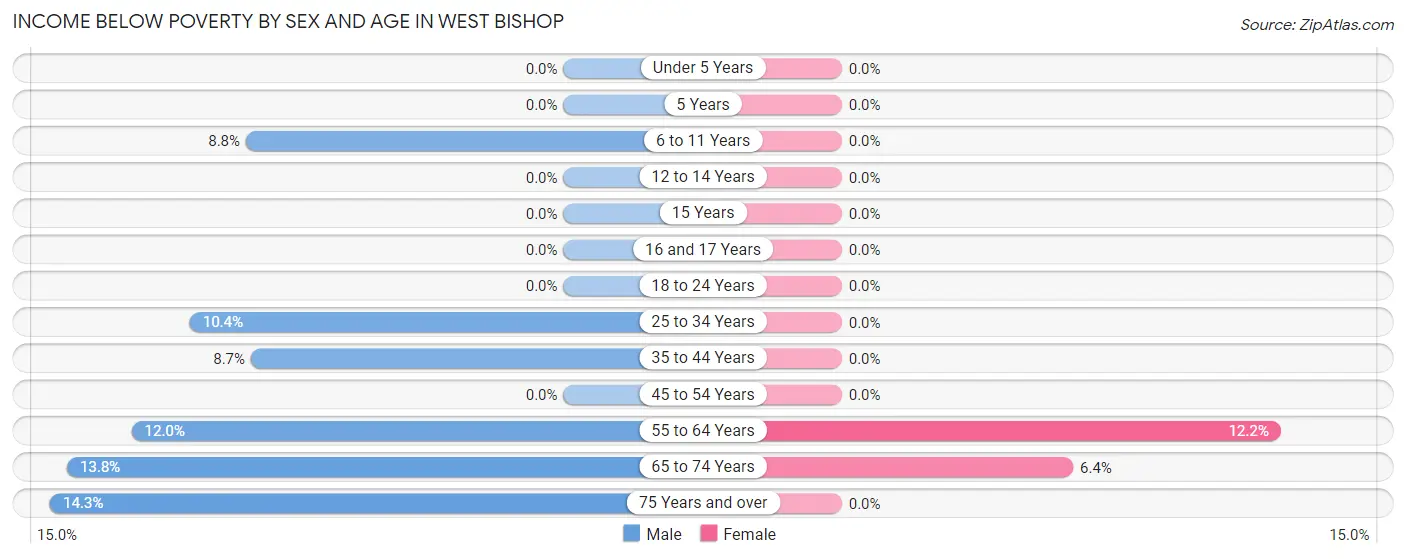
| Age Bracket | Male | Female |
| Under 5 Years | 0 (0.0%) | 0 (0.0%) |
| 5 Years | 0 (0.0%) | 0 (0.0%) |
| 6 to 11 Years | 13 (8.8%) | 0 (0.0%) |
| 12 to 14 Years | 0 (0.0%) | 0 (0.0%) |
| 15 Years | 0 (0.0%) | 0 (0.0%) |
| 16 and 17 Years | 0 (0.0%) | 0 (0.0%) |
| 18 to 24 Years | 0 (0.0%) | 0 (0.0%) |
| 25 to 34 Years | 18 (10.4%) | 0 (0.0%) |
| 35 to 44 Years | 14 (8.7%) | 0 (0.0%) |
| 45 to 54 Years | 0 (0.0%) | 0 (0.0%) |
| 55 to 64 Years | 28 (12.0%) | 22 (12.2%) |
| 65 to 74 Years | 34 (13.8%) | 15 (6.4%) |
| 75 Years and over | 14 (14.3%) | 0 (0.0%) |
| Total | 121 (8.9%) | 37 (3.5%) |
Income Above Poverty by Sex and Age in West Bishop
According to the poverty statistics in West Bishop, males aged under 5 years and females aged under 5 years are the age groups that are most secure financially, with 100.0% of males and 100.0% of females in these age groups living above the poverty line.
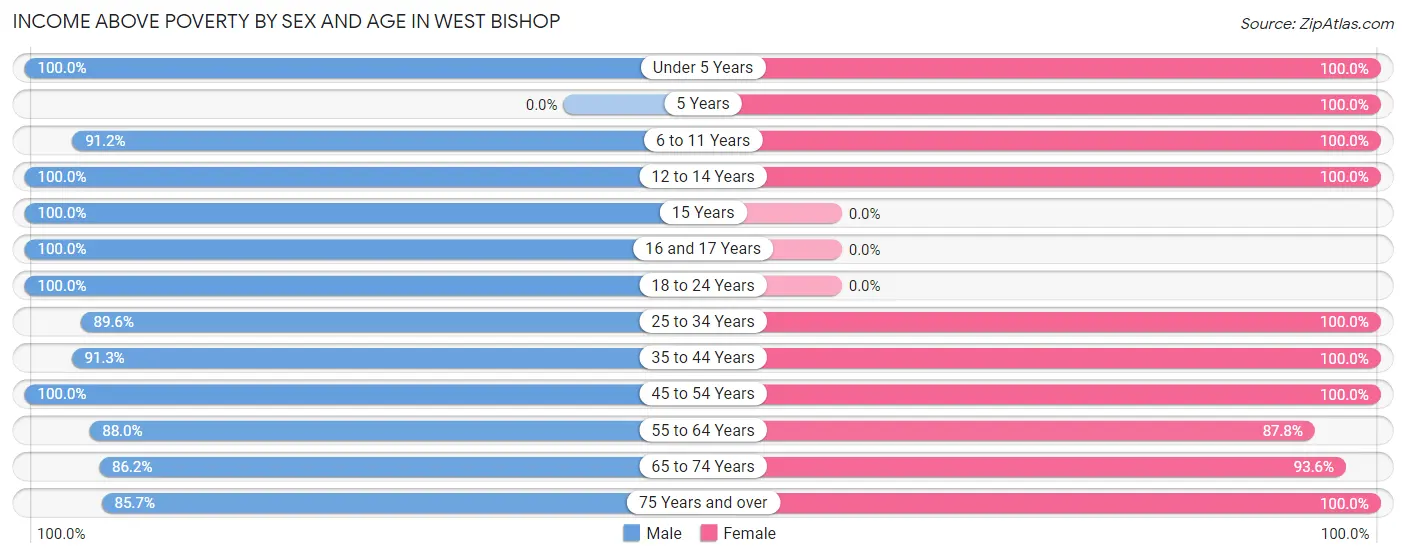
| Age Bracket | Male | Female |
| Under 5 Years | 34 (100.0%) | 43 (100.0%) |
| 5 Years | 0 (0.0%) | 22 (100.0%) |
| 6 to 11 Years | 134 (91.2%) | 95 (100.0%) |
| 12 to 14 Years | 72 (100.0%) | 45 (100.0%) |
| 15 Years | 40 (100.0%) | 0 (0.0%) |
| 16 and 17 Years | 54 (100.0%) | 0 (0.0%) |
| 18 to 24 Years | 47 (100.0%) | 0 (0.0%) |
| 25 to 34 Years | 155 (89.6%) | 16 (100.0%) |
| 35 to 44 Years | 147 (91.3%) | 154 (100.0%) |
| 45 to 54 Years | 53 (100.0%) | 106 (100.0%) |
| 55 to 64 Years | 205 (88.0%) | 158 (87.8%) |
| 65 to 74 Years | 212 (86.2%) | 218 (93.6%) |
| 75 Years and over | 84 (85.7%) | 178 (100.0%) |
| Total | 1,237 (91.1%) | 1,035 (96.6%) |
Income Below Poverty Among Married-Couple Families in West Bishop
The poverty statistics for married-couple families in West Bishop show that 3.7% or 19 of the total 518 families live below the poverty line. Families with no children have the highest poverty rate of 5.4%, comprising of 19 families. On the other hand, families with 1 or 2 children have the lowest poverty rate of 0.0%, which includes 0 families.
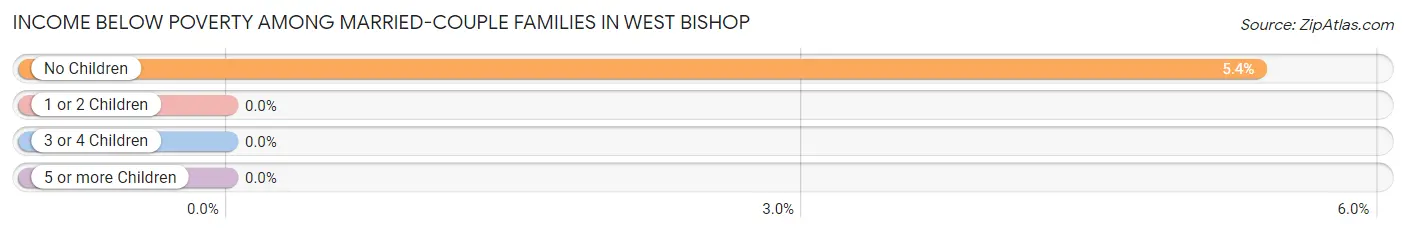
| Children | Above Poverty | Below Poverty |
| No Children | 335 (94.6%) | 19 (5.4%) |
| 1 or 2 Children | 131 (100.0%) | 0 (0.0%) |
| 3 or 4 Children | 33 (100.0%) | 0 (0.0%) |
| 5 or more Children | 0 (0.0%) | 0 (0.0%) |
| Total | 499 (96.3%) | 19 (3.7%) |
Income Below Poverty Among Single-Parent Households in West Bishop
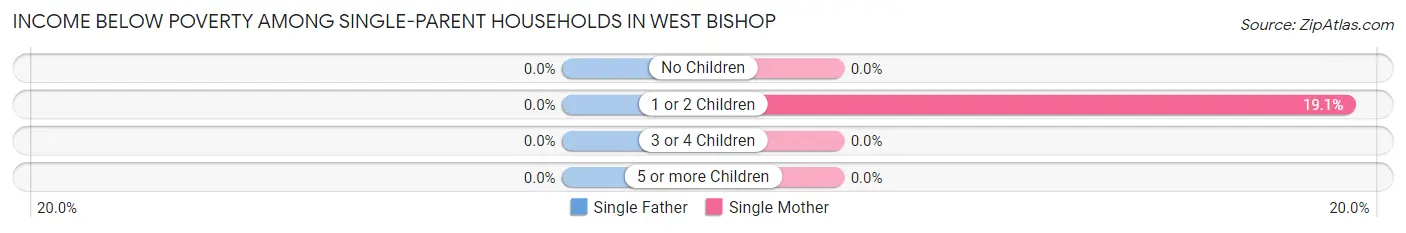
| Children | Single Father | Single Mother |
| No Children | 0 (0.0%) | 0 (0.0%) |
| 1 or 2 Children | 0 (0.0%) | 8 (19.1%) |
| 3 or 4 Children | 0 (0.0%) | 0 (0.0%) |
| 5 or more Children | 0 (0.0%) | 0 (0.0%) |
| Total | 0 (0.0%) | 8 (12.5%) |
Income Below Poverty Among Married-Couple vs Single-Parent Households in West Bishop
The poverty data for West Bishop shows that 19 of the married-couple family households (3.7%) and 8 of the single-parent households (9.3%) are living below the poverty level. Within the married-couple family households, those with no children have the highest poverty rate, with 19 households (5.4%) falling below the poverty line. Among the single-parent households, those with 1 or 2 children have the highest poverty rate, with 8 household (14.0%) living below poverty.
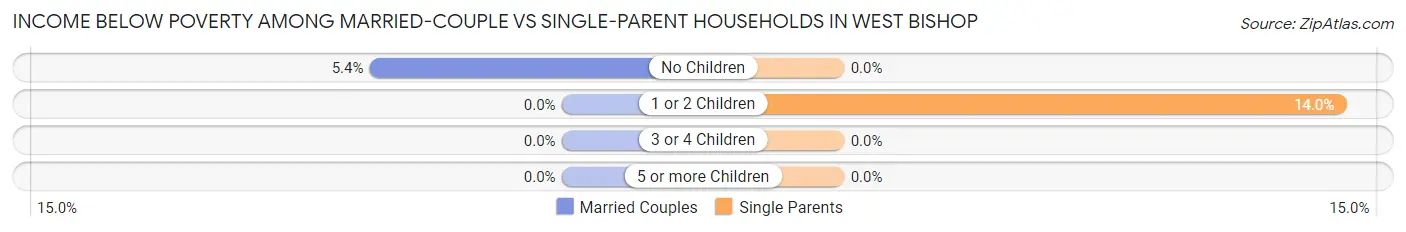
| Children | Married-Couple Families | Single-Parent Households |
| No Children | 19 (5.4%) | 0 (0.0%) |
| 1 or 2 Children | 0 (0.0%) | 8 (14.0%) |
| 3 or 4 Children | 0 (0.0%) | 0 (0.0%) |
| 5 or more Children | 0 (0.0%) | 0 (0.0%) |
| Total | 19 (3.7%) | 8 (9.3%) |
Race in West Bishop
The most populous races in West Bishop are White / Caucasian (2,135 | 87.9%), Two or more Races (253 | 10.4%), and Hispanic or Latino (205 | 8.4%).
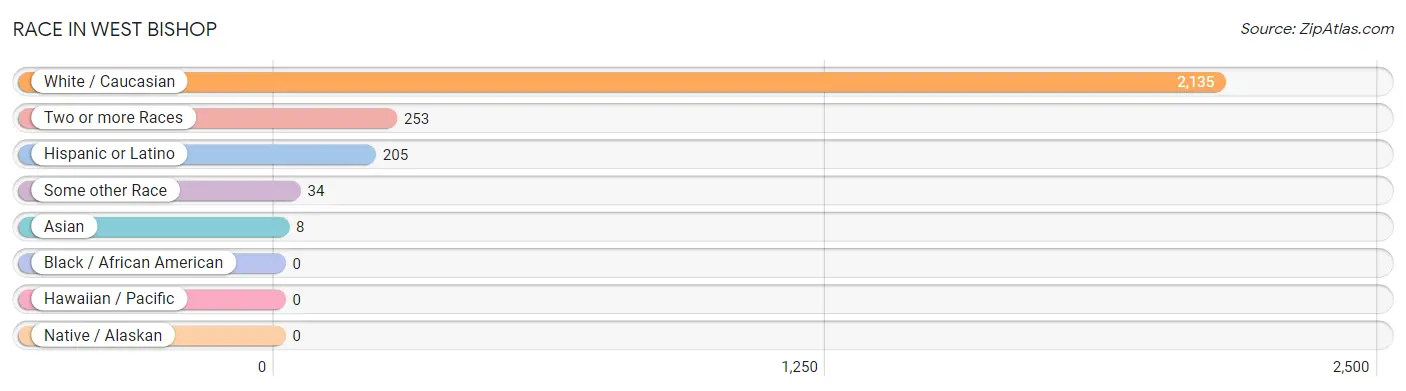
| Race | # Population | % Population |
| Asian | 8 | 0.3% |
| Black / African American | 0 | 0.0% |
| Hawaiian / Pacific | 0 | 0.0% |
| Hispanic or Latino | 205 | 8.4% |
| Native / Alaskan | 0 | 0.0% |
| White / Caucasian | 2,135 | 87.9% |
| Two or more Races | 253 | 10.4% |
| Some other Race | 34 | 1.4% |
| Total | 2,430 | 100.0% |
Ancestry in West Bishop
The most populous ancestries reported in West Bishop are German (487 | 20.0%), Italian (314 | 12.9%), English (290 | 11.9%), Swedish (157 | 6.5%), and Irish (150 | 6.2%), together accounting for 57.5% of all West Bishop residents.
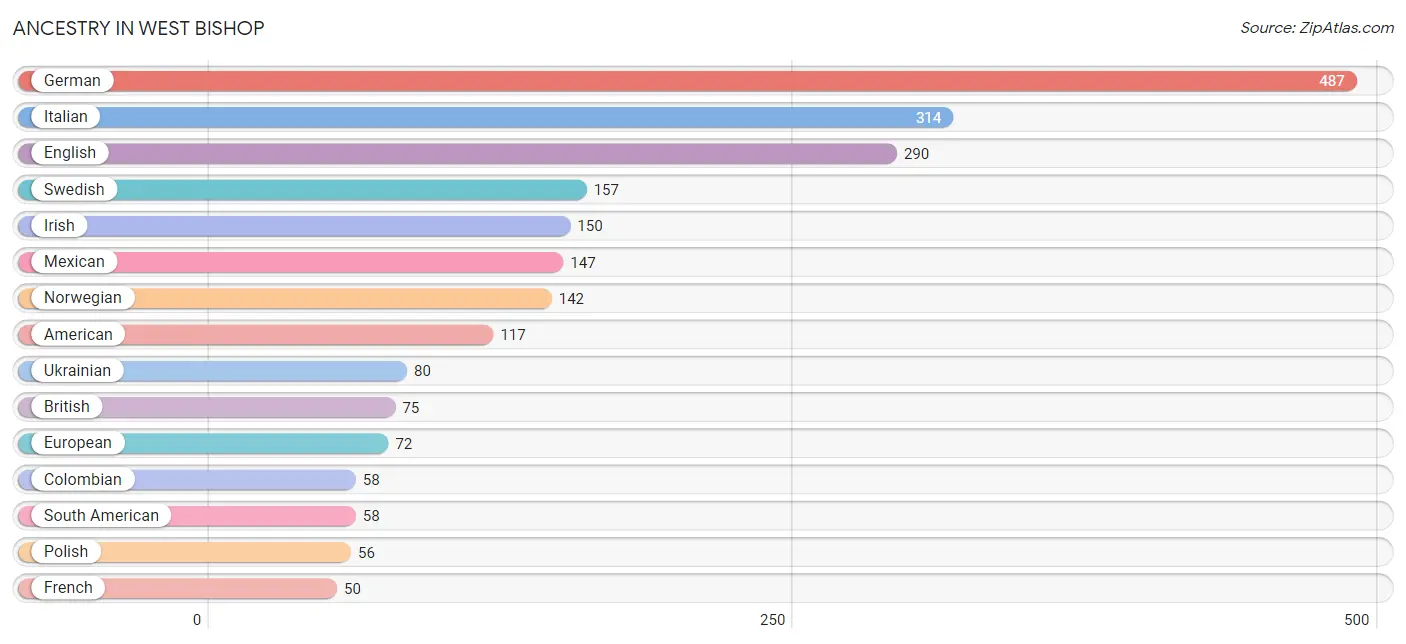
| Ancestry | # Population | % Population |
| American | 117 | 4.8% |
| Bangladeshi | 8 | 0.3% |
| British | 75 | 3.1% |
| Colombian | 58 | 2.4% |
| Czech | 32 | 1.3% |
| Czechoslovakian | 7 | 0.3% |
| Danish | 6 | 0.3% |
| Dutch | 37 | 1.5% |
| Eastern European | 37 | 1.5% |
| English | 290 | 11.9% |
| European | 72 | 3.0% |
| Finnish | 4 | 0.2% |
| French | 50 | 2.1% |
| German | 487 | 20.0% |
| Irish | 150 | 6.2% |
| Italian | 314 | 12.9% |
| Lithuanian | 8 | 0.3% |
| Mexican | 147 | 6.0% |
| Northern European | 44 | 1.8% |
| Norwegian | 142 | 5.8% |
| Polish | 56 | 2.3% |
| Portuguese | 24 | 1.0% |
| Scandinavian | 26 | 1.1% |
| Scotch-Irish | 12 | 0.5% |
| Scottish | 41 | 1.7% |
| Serbian | 9 | 0.4% |
| Slovak | 11 | 0.4% |
| South American | 58 | 2.4% |
| Swedish | 157 | 6.5% |
| Swiss | 8 | 0.3% |
| Ukrainian | 80 | 3.3% |
| Welsh | 38 | 1.6% |
| Yugoslavian | 44 | 1.8% | View All 33 Rows |
Immigrants in West Bishop
The most numerous immigrant groups reported in West Bishop came from Latin America (100 | 4.1%), Colombia (58 | 2.4%), South America (58 | 2.4%), Central America (42 | 1.7%), and Mexico (42 | 1.7%), together accounting for 12.4% of all West Bishop residents.
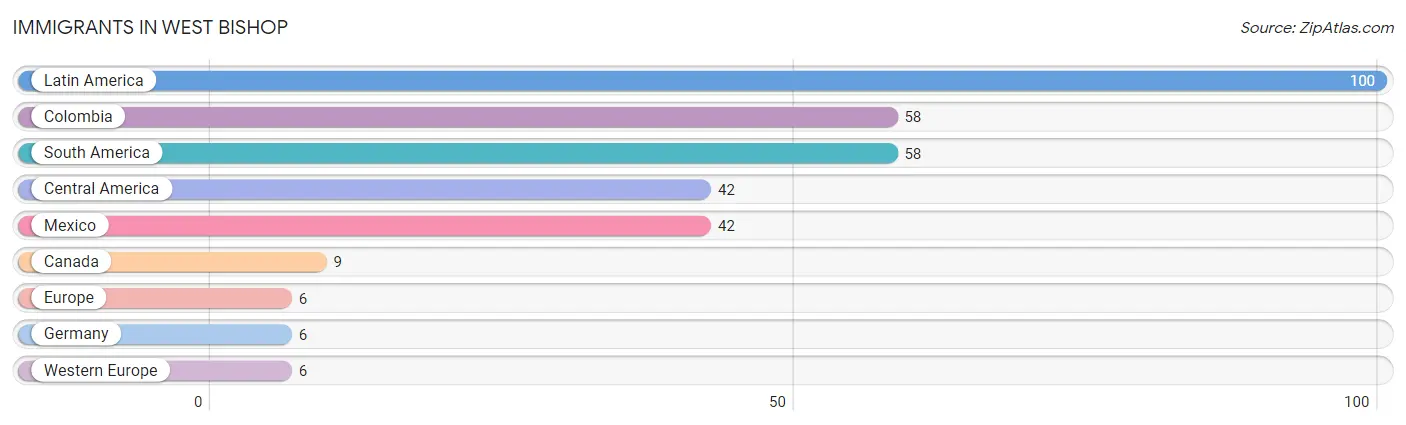
| Immigration Origin | # Population | % Population |
| Canada | 9 | 0.4% |
| Central America | 42 | 1.7% |
| Colombia | 58 | 2.4% |
| Europe | 6 | 0.3% |
| Germany | 6 | 0.3% |
| Latin America | 100 | 4.1% |
| Mexico | 42 | 1.7% |
| South America | 58 | 2.4% |
| Western Europe | 6 | 0.3% | View All 9 Rows |
Sex and Age in West Bishop
Sex and Age in West Bishop
The most populous age groups in West Bishop are 30 to 34 Years (152 | 11.2%) for men and 65 to 69 Years (184 | 17.2%) for women.
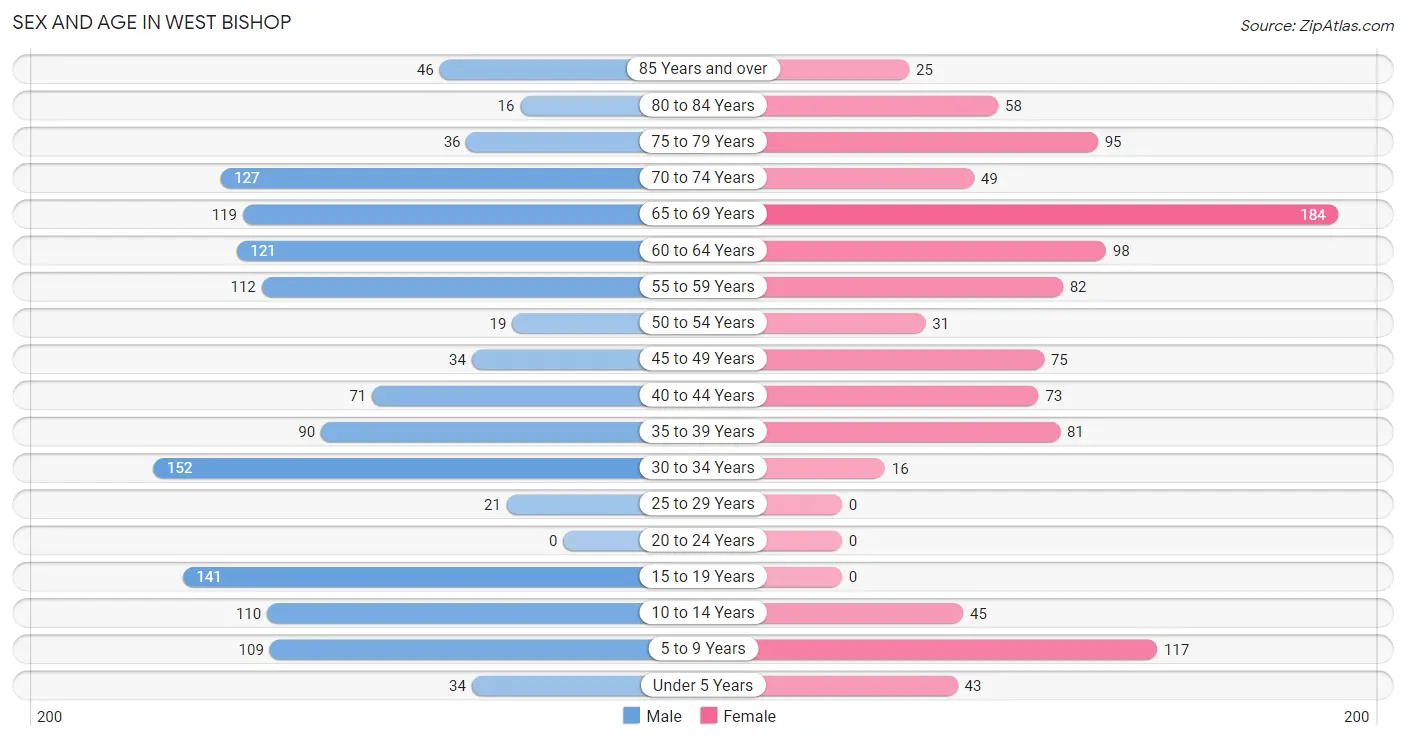
| Age Bracket | Male | Female |
| Under 5 Years | 34 (2.5%) | 43 (4.0%) |
| 5 to 9 Years | 109 (8.0%) | 117 (10.9%) |
| 10 to 14 Years | 110 (8.1%) | 45 (4.2%) |
| 15 to 19 Years | 141 (10.4%) | 0 (0.0%) |
| 20 to 24 Years | 0 (0.0%) | 0 (0.0%) |
| 25 to 29 Years | 21 (1.5%) | 0 (0.0%) |
| 30 to 34 Years | 152 (11.2%) | 16 (1.5%) |
| 35 to 39 Years | 90 (6.6%) | 81 (7.6%) |
| 40 to 44 Years | 71 (5.2%) | 73 (6.8%) |
| 45 to 49 Years | 34 (2.5%) | 75 (7.0%) |
| 50 to 54 Years | 19 (1.4%) | 31 (2.9%) |
| 55 to 59 Years | 112 (8.3%) | 82 (7.6%) |
| 60 to 64 Years | 121 (8.9%) | 98 (9.1%) |
| 65 to 69 Years | 119 (8.8%) | 184 (17.2%) |
| 70 to 74 Years | 127 (9.3%) | 49 (4.6%) |
| 75 to 79 Years | 36 (2.6%) | 95 (8.9%) |
| 80 to 84 Years | 16 (1.2%) | 58 (5.4%) |
| 85 Years and over | 46 (3.4%) | 25 (2.3%) |
| Total | 1,358 (100.0%) | 1,072 (100.0%) |
Families and Households in West Bishop
Median Family Size in West Bishop
The median family size in West Bishop is 3.38 persons per family, with single female/mother families (64 | 10.6%) accounting for the largest median family size of 3.8 persons per family. On the other hand, single male/father families (22 | 3.6%) represent the smallest median family size with 2.18 persons per family.
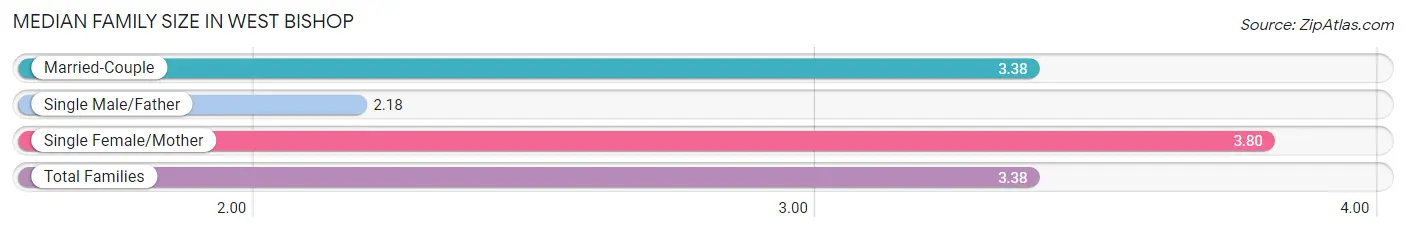
| Family Type | # Families | Family Size |
| Married-Couple | 518 (85.8%) | 3.38 |
| Single Male/Father | 22 (3.6%) | 2.18 |
| Single Female/Mother | 64 (10.6%) | 3.80 |
| Total Families | 604 (100.0%) | 3.38 |
Median Household Size in West Bishop
The median household size in West Bishop is 2.76 persons per household, with single female/mother households (64 | 7.3%) accounting for the largest median household size of 3.8 persons per household. non-family households (277 | 31.4%) represent the smallest median household size with 1.34 persons per household.
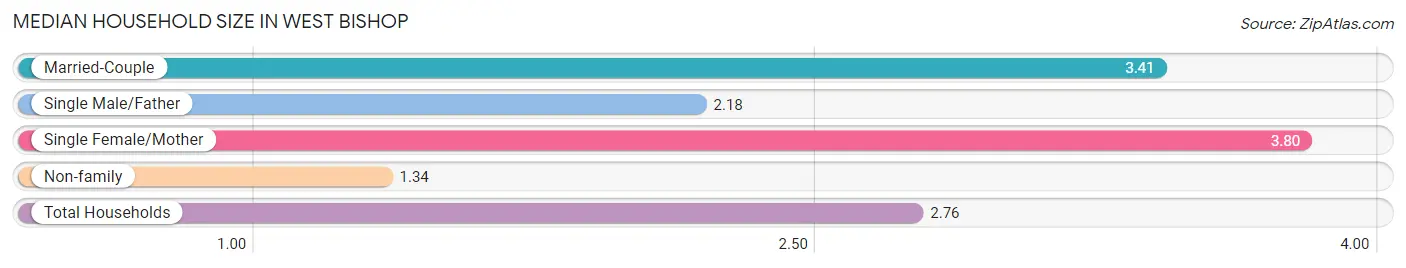
| Household Type | # Households | Household Size |
| Married-Couple | 518 (58.8%) | 3.41 |
| Single Male/Father | 22 (2.5%) | 2.18 |
| Single Female/Mother | 64 (7.3%) | 3.80 |
| Non-family | 277 (31.4%) | 1.34 |
| Total Households | 881 (100.0%) | 2.76 |
Household Size by Marriage Status in West Bishop
Out of a total of 881 households in West Bishop, 604 (68.6%) are family households, while 277 (31.4%) are nonfamily households. The most numerous type of family households are 2-person households, comprising 354, and the most common type of nonfamily households are 1-person households, comprising 219.
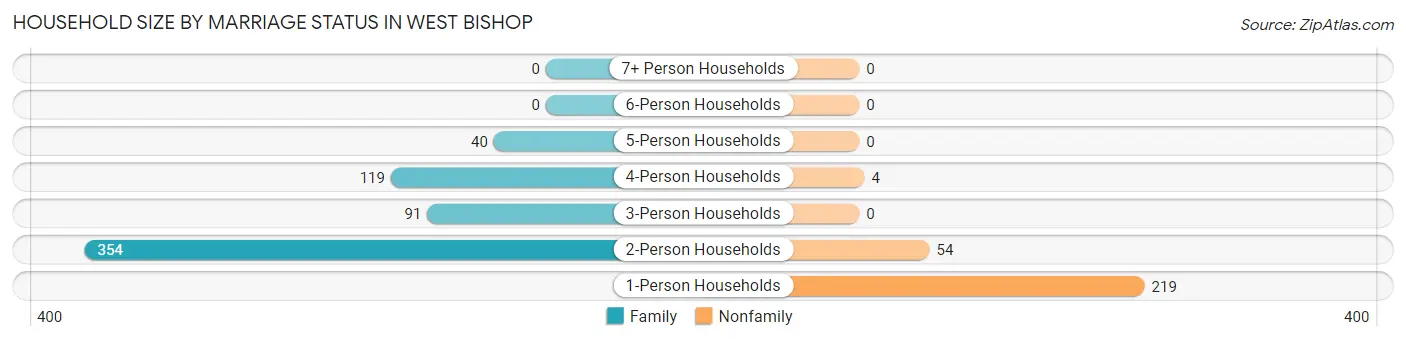
| Household Size | Family Households | Nonfamily Households |
| 1-Person Households | - | 219 (24.9%) |
| 2-Person Households | 354 (40.2%) | 54 (6.1%) |
| 3-Person Households | 91 (10.3%) | 0 (0.0%) |
| 4-Person Households | 119 (13.5%) | 4 (0.4%) |
| 5-Person Households | 40 (4.5%) | 0 (0.0%) |
| 6-Person Households | 0 (0.0%) | 0 (0.0%) |
| 7+ Person Households | 0 (0.0%) | 0 (0.0%) |
| Total | 604 (68.6%) | 277 (31.4%) |
Female Fertility in West Bishop
Fertility by Age in West Bishop
Average fertility rate in West Bishop is 15.0 births per 1,000 women. Women in the age bracket of 20 to 34 years have the highest fertility rate with 250.0 births per 1,000 women. Women in the age bracket of 20 to 34 years acount for 100.0% of all women with births.
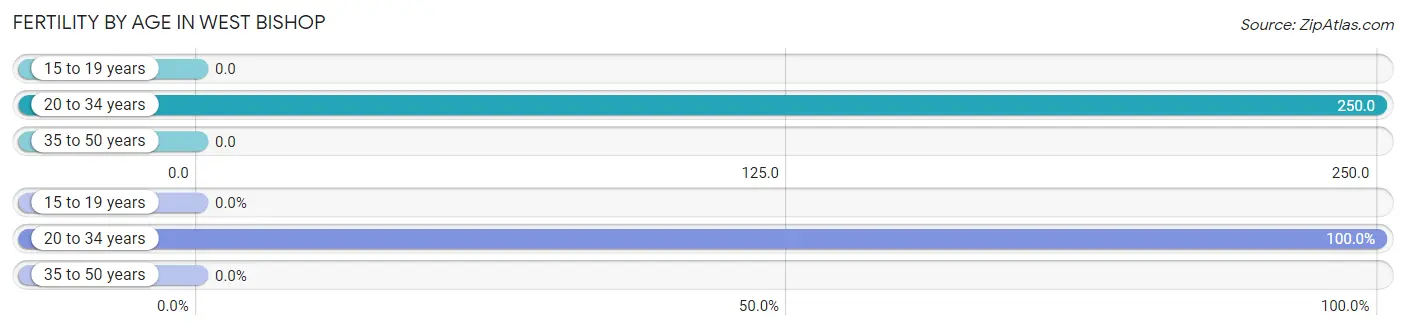
| Age Bracket | Women with Births | Births / 1,000 Women |
| 15 to 19 years | 0 (0.0%) | 0.0 |
| 20 to 34 years | 4 (100.0%) | 250.0 |
| 35 to 50 years | 0 (0.0%) | 0.0 |
| Total | 4 (100.0%) | 15.0 |
Fertility by Age by Marriage Status in West Bishop
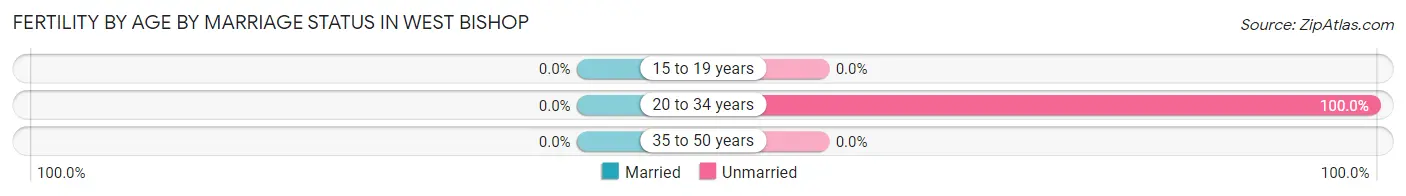
| Age Bracket | Married | Unmarried |
| 15 to 19 years | 0 (0.0%) | 0 (0.0%) |
| 20 to 34 years | 0 (0.0%) | 4 (100.0%) |
| 35 to 50 years | 0 (0.0%) | 0 (0.0%) |
| Total | 0 (0.0%) | 4 (100.0%) |
Fertility by Education in West Bishop
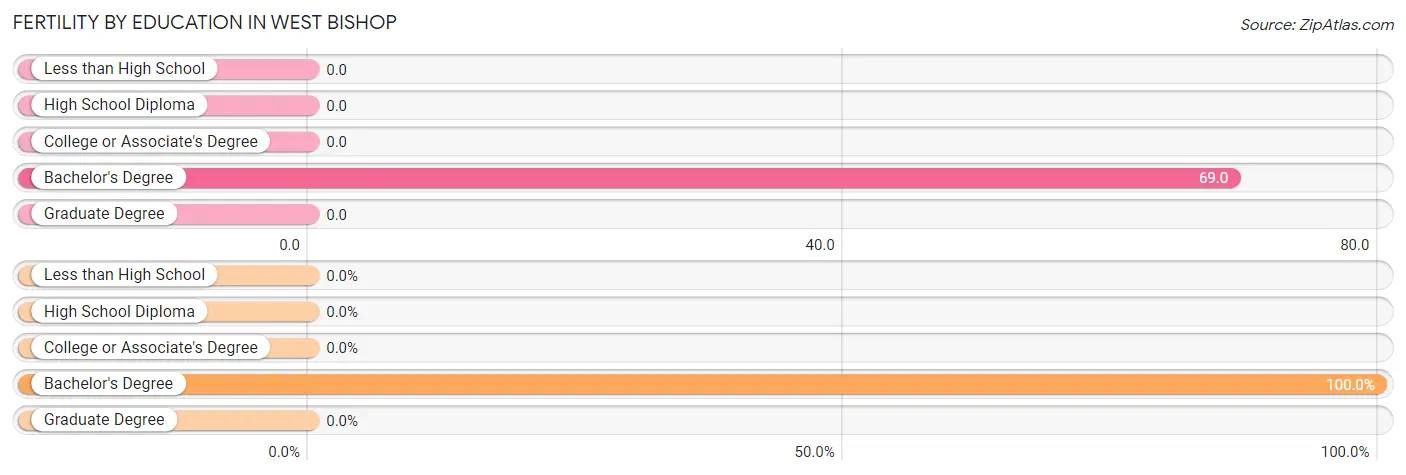
| Educational Attainment | Women with Births | Births / 1,000 Women |
| Less than High School | 0 (0.0%) | 0.0 |
| High School Diploma | 0 (0.0%) | 0.0 |
| College or Associate's Degree | 0 (0.0%) | 0.0 |
| Bachelor's Degree | 4 (100.0%) | 69.0 |
| Graduate Degree | 0 (0.0%) | 0.0 |
| Total | 4 (100.0%) | 15.0 |
Fertility by Education by Marriage Status in West Bishop
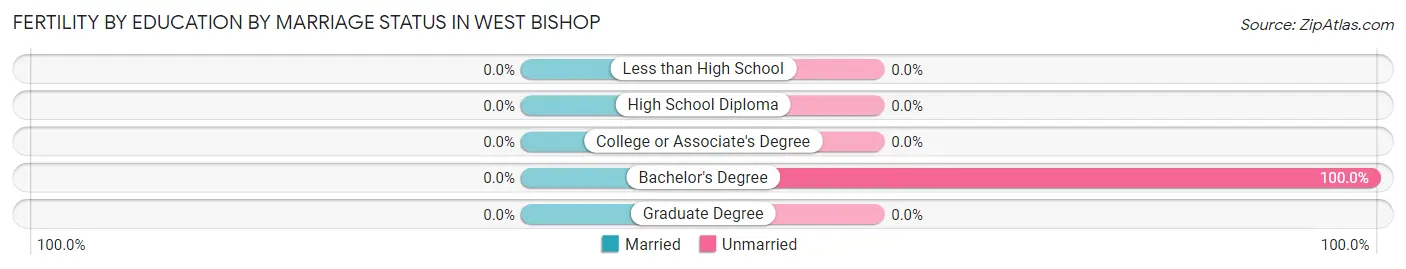
| Educational Attainment | Married | Unmarried |
| Less than High School | 0 (0.0%) | 0 (0.0%) |
| High School Diploma | 0 (0.0%) | 0 (0.0%) |
| College or Associate's Degree | 0 (0.0%) | 0 (0.0%) |
| Bachelor's Degree | 0 (0.0%) | 4 (100.0%) |
| Graduate Degree | 0 (0.0%) | 0 (0.0%) |
| Total | 0 (0.0%) | 4 (100.0%) |
Employment Characteristics in West Bishop
Employment by Class of Employer in West Bishop
Among the 1,009 employed individuals in West Bishop, private company employees (322 | 31.9%), local government employees (280 | 27.8%), and state government employees (152 | 15.1%) make up the most common classes of employment.
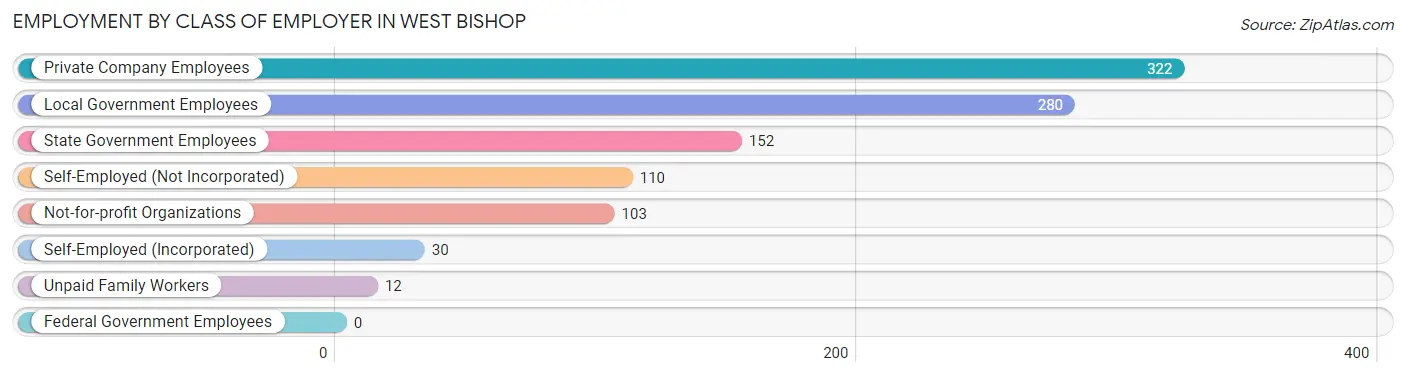
| Employer Class | # Employees | % Employees |
| Private Company Employees | 322 | 31.9% |
| Self-Employed (Incorporated) | 30 | 3.0% |
| Self-Employed (Not Incorporated) | 110 | 10.9% |
| Not-for-profit Organizations | 103 | 10.2% |
| Local Government Employees | 280 | 27.8% |
| State Government Employees | 152 | 15.1% |
| Federal Government Employees | 0 | 0.0% |
| Unpaid Family Workers | 12 | 1.2% |
| Total | 1,009 | 100.0% |
Employment Status by Age in West Bishop
According to the labor force statistics for West Bishop, out of the total population over 16 years of age (1,932), 56.5% or 1,092 individuals are in the labor force, with 5.3% or 58 of them unemployed. The age group with the highest labor force participation rate is 45 to 54 years, with 100.0% or 159 individuals in the labor force. Within the labor force, the 16 to 19 years age range has the highest percentage of unemployed individuals, with 21.3% or 17 of them being unemployed.
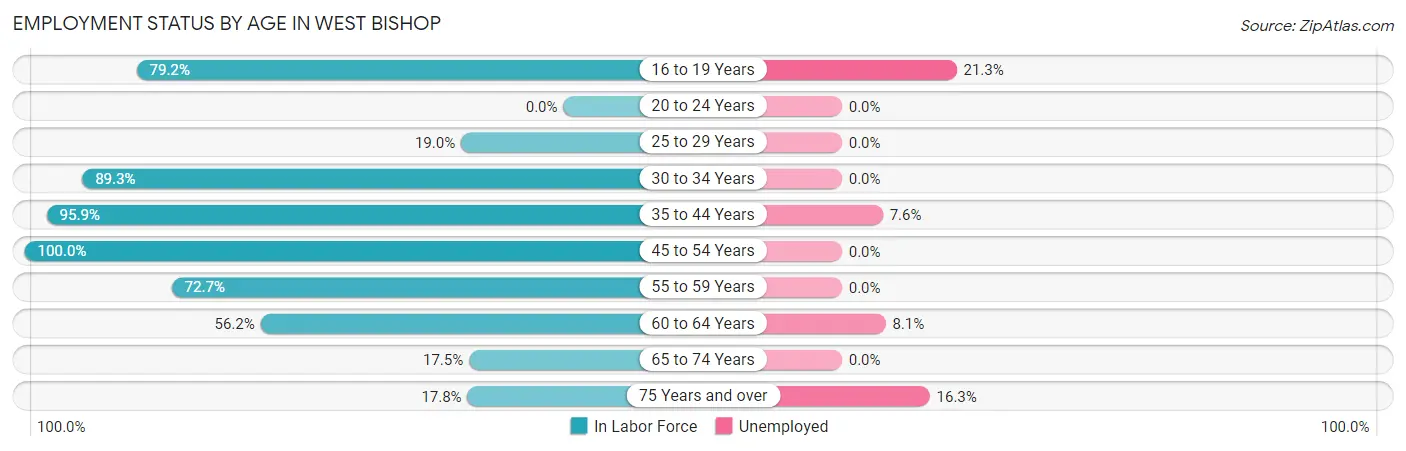
| Age Bracket | In Labor Force | Unemployed |
| 16 to 19 Years | 80 (79.2%) | 17 (21.3%) |
| 20 to 24 Years | 0 (0.0%) | 0 (0.0%) |
| 25 to 29 Years | 4 (19.0%) | 0 (0.0%) |
| 30 to 34 Years | 150 (89.3%) | 0 (0.0%) |
| 35 to 44 Years | 302 (95.9%) | 23 (7.6%) |
| 45 to 54 Years | 159 (100.0%) | 0 (0.0%) |
| 55 to 59 Years | 141 (72.7%) | 0 (0.0%) |
| 60 to 64 Years | 123 (56.2%) | 10 (8.1%) |
| 65 to 74 Years | 84 (17.5%) | 0 (0.0%) |
| 75 Years and over | 49 (17.8%) | 8 (16.3%) |
| Total | 1,092 (56.5%) | 58 (5.3%) |
Employment Status by Educational Attainment in West Bishop
According to labor force statistics for West Bishop, 81.7% of individuals (879) out of the total population between 25 and 64 years of age (1,076) are in the labor force, with 3.8% or 33 of them being unemployed. The group with the highest labor force participation rate are those with the educational attainment of bachelor's degree or higher, with 85.4% or 426 individuals in the labor force. Within the labor force, individuals with high school diploma education have the highest percentage of unemployment, with 7.2% or 14 of them being unemployed.
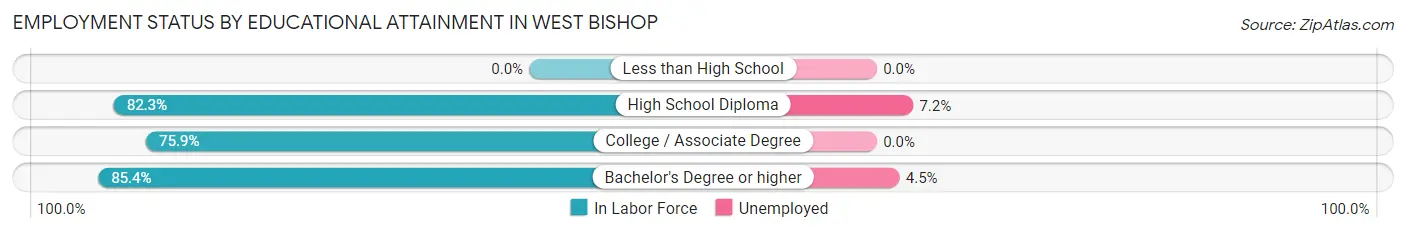
| Educational Attainment | In Labor Force | Unemployed |
| Less than High School | 0 (0.0%) | 0 (0.0%) |
| High School Diploma | 195 (82.3%) | 17 (7.2%) |
| College / Associate Degree | 258 (75.9%) | 0 (0.0%) |
| Bachelor's Degree or higher | 426 (85.4%) | 22 (4.5%) |
| Total | 879 (81.7%) | 41 (3.8%) |
Employment Occupations by Sex in West Bishop
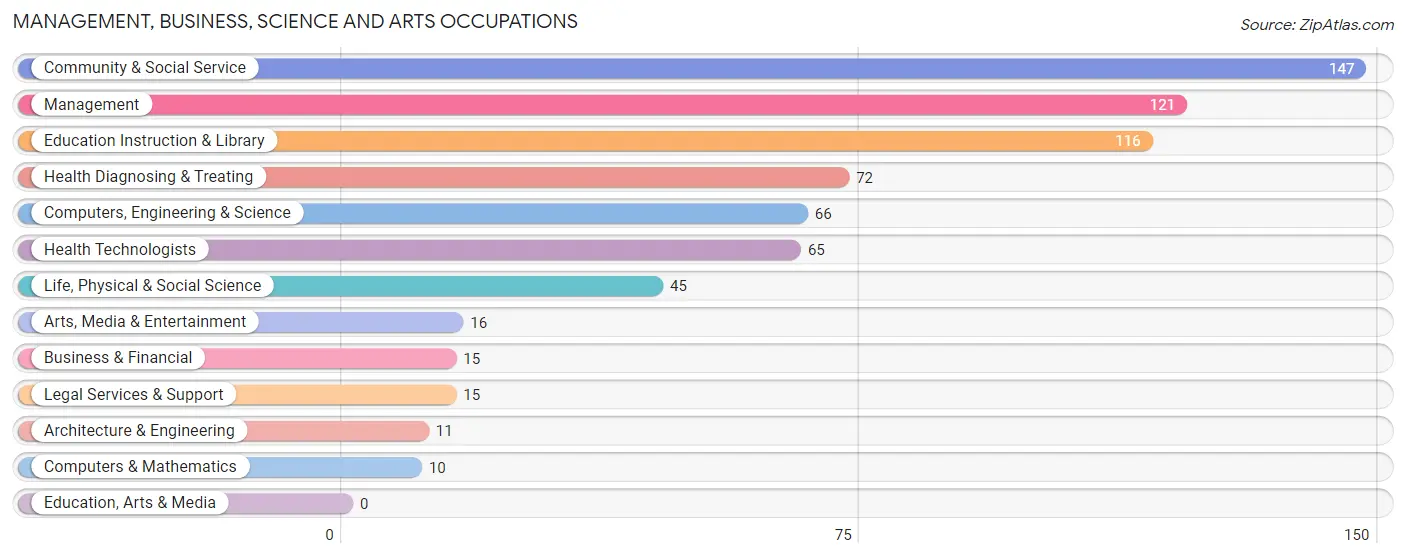
Management, Business, Science and Arts Occupations
The most common Management, Business, Science and Arts occupations in West Bishop are Community & Social Service (147 | 14.2%), Management (121 | 11.7%), Education Instruction & Library (116 | 11.2%), Health Diagnosing & Treating (72 | 7.0%), and Computers, Engineering & Science (66 | 6.4%).
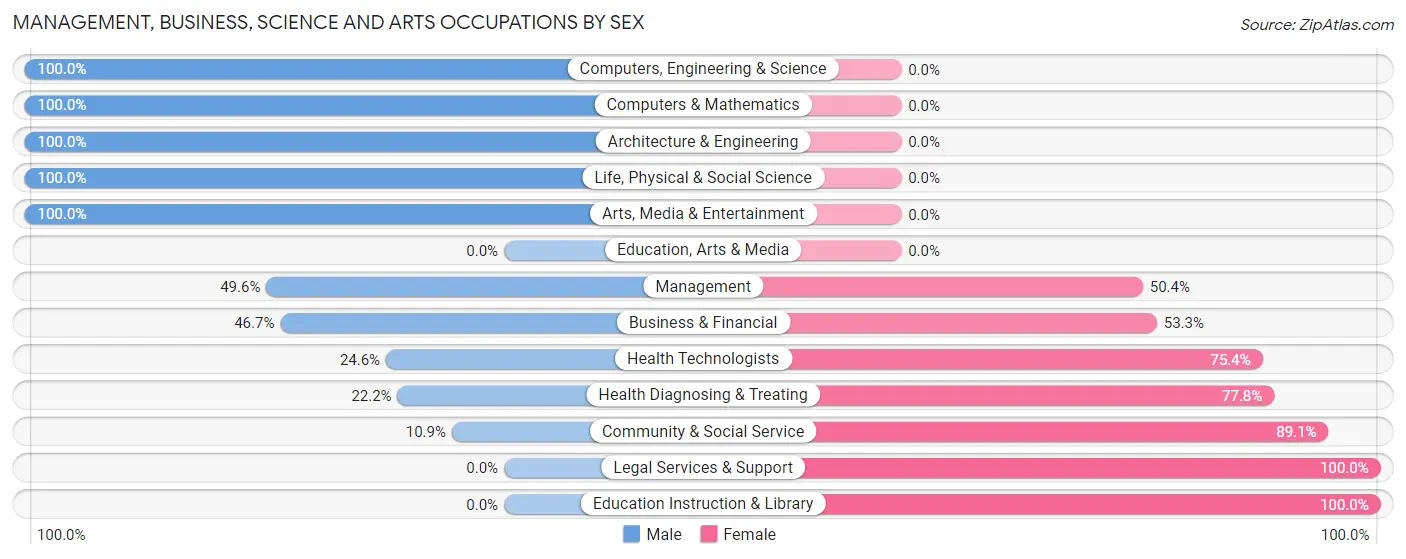
Management, Business, Science and Arts Occupations by Sex
Within the Management, Business, Science and Arts occupations in West Bishop, the most male-oriented occupations are Computers, Engineering & Science (100.0%), Computers & Mathematics (100.0%), and Architecture & Engineering (100.0%), while the most female-oriented occupations are Legal Services & Support (100.0%), Education Instruction & Library (100.0%), and Community & Social Service (89.1%).
| Occupation | Male | Female |
| Management | 60 (49.6%) | 61 (50.4%) |
| Business & Financial | 7 (46.7%) | 8 (53.3%) |
| Computers, Engineering & Science | 66 (100.0%) | 0 (0.0%) |
| Computers & Mathematics | 10 (100.0%) | 0 (0.0%) |
| Architecture & Engineering | 11 (100.0%) | 0 (0.0%) |
| Life, Physical & Social Science | 45 (100.0%) | 0 (0.0%) |
| Community & Social Service | 16 (10.9%) | 131 (89.1%) |
| Education, Arts & Media | 0 (0.0%) | 0 (0.0%) |
| Legal Services & Support | 0 (0.0%) | 15 (100.0%) |
| Education Instruction & Library | 0 (0.0%) | 116 (100.0%) |
| Arts, Media & Entertainment | 16 (100.0%) | 0 (0.0%) |
| Health Diagnosing & Treating | 16 (22.2%) | 56 (77.8%) |
| Health Technologists | 16 (24.6%) | 49 (75.4%) |
| Total (Category) | 165 (39.2%) | 256 (60.8%) |
| Total (Overall) | 580 (56.1%) | 454 (43.9%) |
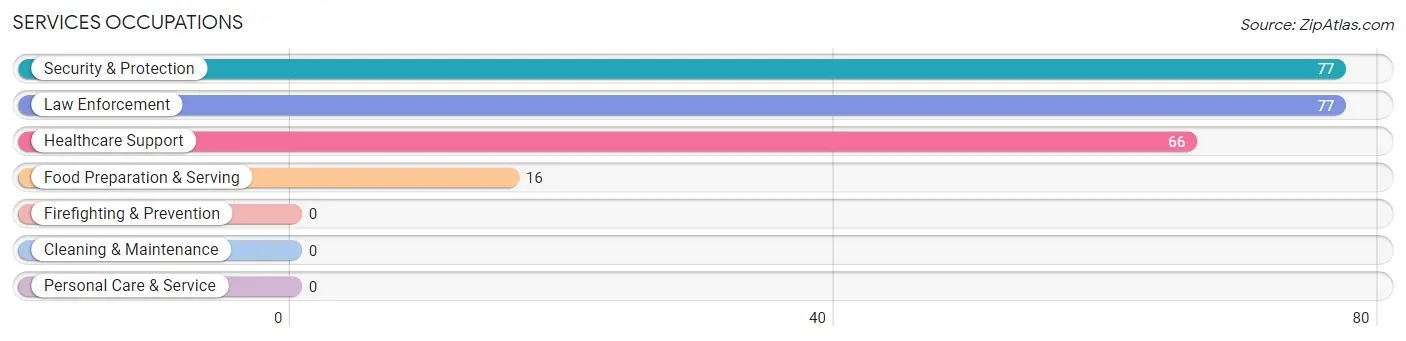
Services Occupations
The most common Services occupations in West Bishop are Security & Protection (77 | 7.4%), Law Enforcement (77 | 7.4%), Healthcare Support (66 | 6.4%), and Food Preparation & Serving (16 | 1.5%).
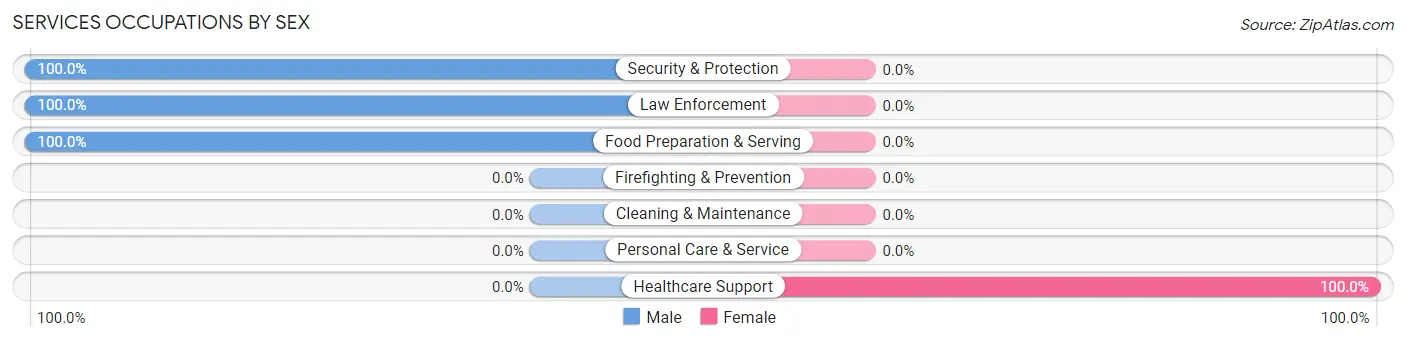
Services Occupations by Sex
| Occupation | Male | Female |
| Healthcare Support | 0 (0.0%) | 66 (100.0%) |
| Security & Protection | 77 (100.0%) | 0 (0.0%) |
| Firefighting & Prevention | 0 (0.0%) | 0 (0.0%) |
| Law Enforcement | 77 (100.0%) | 0 (0.0%) |
| Food Preparation & Serving | 16 (100.0%) | 0 (0.0%) |
| Cleaning & Maintenance | 0 (0.0%) | 0 (0.0%) |
| Personal Care & Service | 0 (0.0%) | 0 (0.0%) |
| Total (Category) | 93 (58.5%) | 66 (41.5%) |
| Total (Overall) | 580 (56.1%) | 454 (43.9%) |
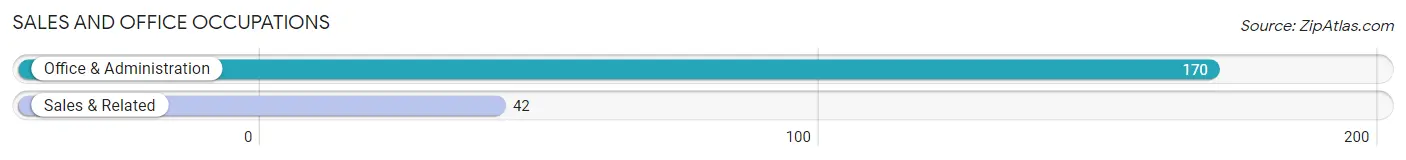
Sales and Office Occupations
The most common Sales and Office occupations in West Bishop are Office & Administration (170 | 16.4%), and Sales & Related (42 | 4.1%).
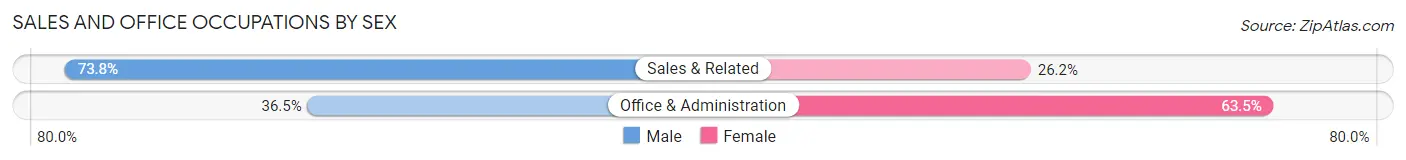
Sales and Office Occupations by Sex
| Occupation | Male | Female |
| Sales & Related | 31 (73.8%) | 11 (26.2%) |
| Office & Administration | 62 (36.5%) | 108 (63.5%) |
| Total (Category) | 93 (43.9%) | 119 (56.1%) |
| Total (Overall) | 580 (56.1%) | 454 (43.9%) |
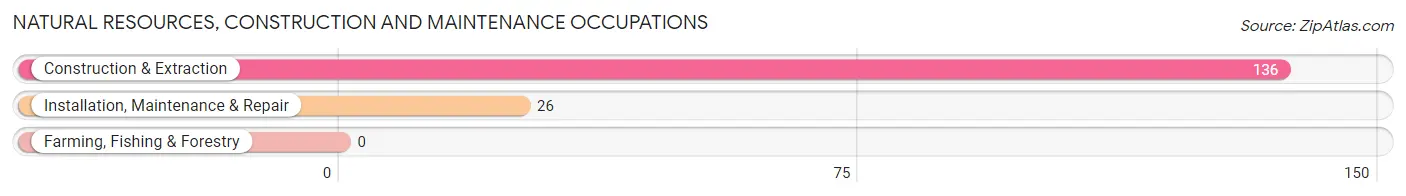
Natural Resources, Construction and Maintenance Occupations
The most common Natural Resources, Construction and Maintenance occupations in West Bishop are Construction & Extraction (136 | 13.2%), and Installation, Maintenance & Repair (26 | 2.5%).
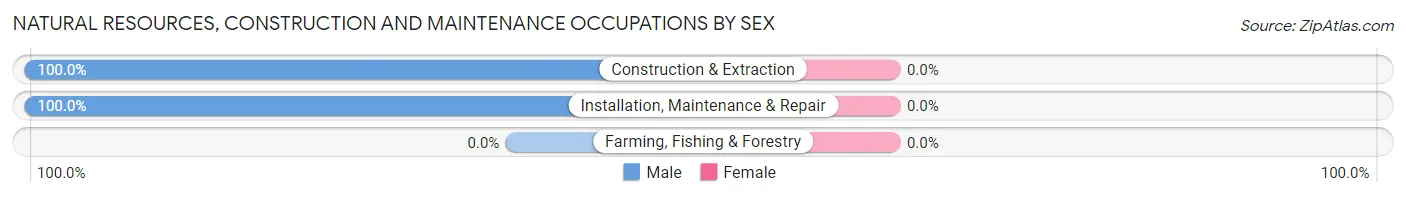
Natural Resources, Construction and Maintenance Occupations by Sex
| Occupation | Male | Female |
| Farming, Fishing & Forestry | 0 (0.0%) | 0 (0.0%) |
| Construction & Extraction | 136 (100.0%) | 0 (0.0%) |
| Installation, Maintenance & Repair | 26 (100.0%) | 0 (0.0%) |
| Total (Category) | 162 (100.0%) | 0 (0.0%) |
| Total (Overall) | 580 (56.1%) | 454 (43.9%) |
Production, Transportation and Moving Occupations
The most common Production, Transportation and Moving occupations in West Bishop are Material Moving (59 | 5.7%), Transportation (14 | 1.3%), and Production (7 | 0.7%).
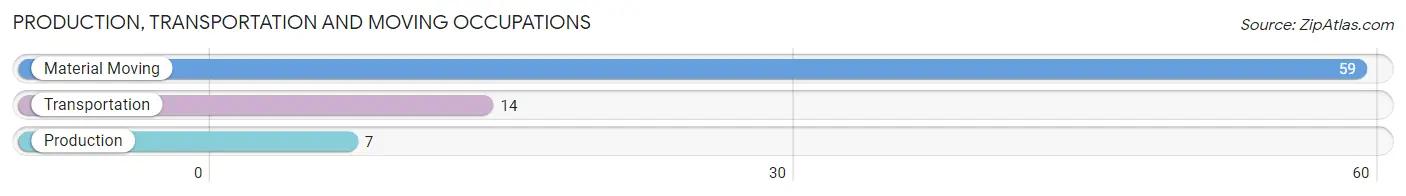
Production, Transportation and Moving Occupations by Sex
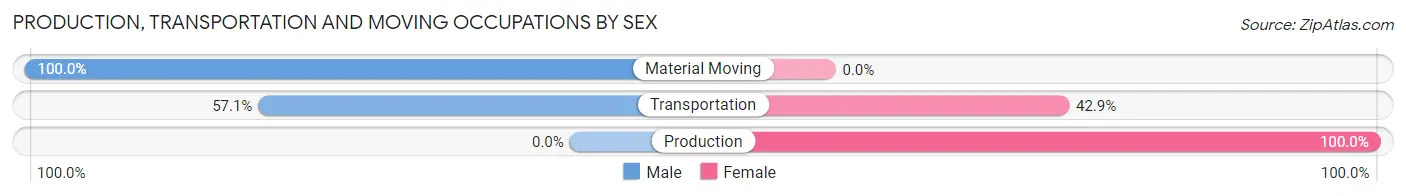
| Occupation | Male | Female |
| Production | 0 (0.0%) | 7 (100.0%) |
| Transportation | 8 (57.1%) | 6 (42.9%) |
| Material Moving | 59 (100.0%) | 0 (0.0%) |
| Total (Category) | 67 (83.8%) | 13 (16.3%) |
| Total (Overall) | 580 (56.1%) | 454 (43.9%) |
Employment Industries by Sex in West Bishop
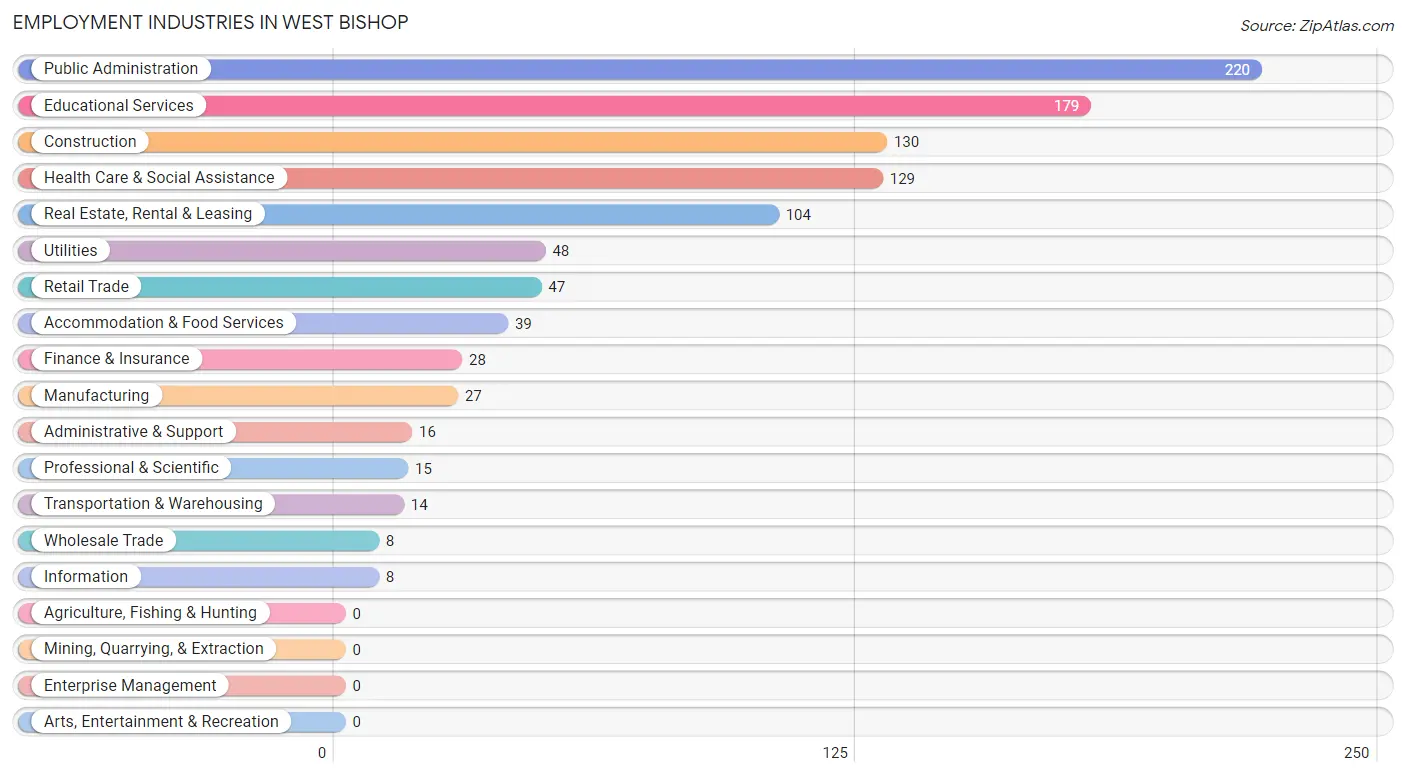
Employment Industries in West Bishop
The major employment industries in West Bishop include Public Administration (220 | 21.3%), Educational Services (179 | 17.3%), Construction (130 | 12.6%), Health Care & Social Assistance (129 | 12.5%), and Real Estate, Rental & Leasing (104 | 10.1%).
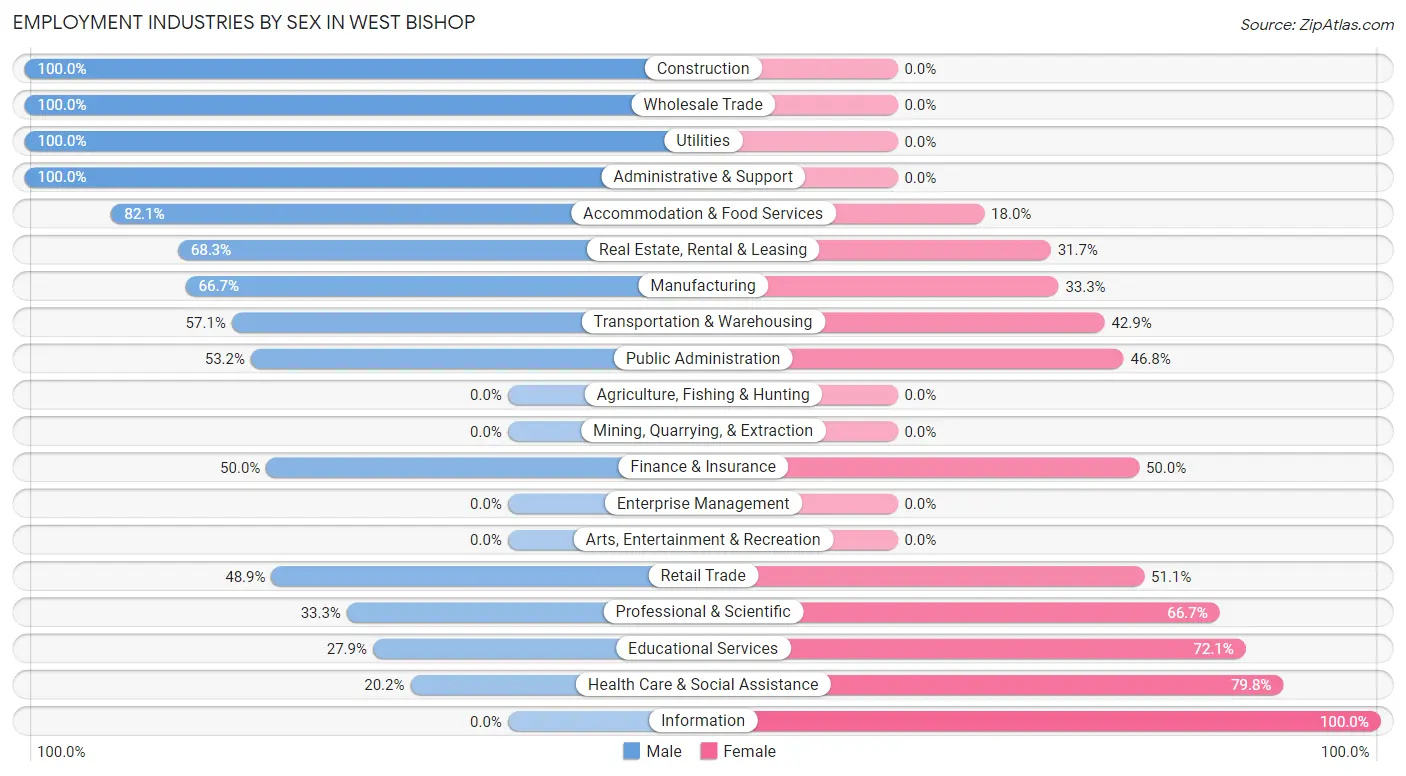
Employment Industries by Sex in West Bishop
The West Bishop industries that see more men than women are Construction (100.0%), Wholesale Trade (100.0%), and Utilities (100.0%), whereas the industries that tend to have a higher number of women are Information (100.0%), Health Care & Social Assistance (79.8%), and Educational Services (72.1%).
| Industry | Male | Female |
| Agriculture, Fishing & Hunting | 0 (0.0%) | 0 (0.0%) |
| Mining, Quarrying, & Extraction | 0 (0.0%) | 0 (0.0%) |
| Construction | 130 (100.0%) | 0 (0.0%) |
| Manufacturing | 18 (66.7%) | 9 (33.3%) |
| Wholesale Trade | 8 (100.0%) | 0 (0.0%) |
| Retail Trade | 23 (48.9%) | 24 (51.1%) |
| Transportation & Warehousing | 8 (57.1%) | 6 (42.9%) |
| Utilities | 48 (100.0%) | 0 (0.0%) |
| Information | 0 (0.0%) | 8 (100.0%) |
| Finance & Insurance | 14 (50.0%) | 14 (50.0%) |
| Real Estate, Rental & Leasing | 71 (68.3%) | 33 (31.7%) |
| Professional & Scientific | 5 (33.3%) | 10 (66.7%) |
| Enterprise Management | 0 (0.0%) | 0 (0.0%) |
| Administrative & Support | 16 (100.0%) | 0 (0.0%) |
| Educational Services | 50 (27.9%) | 129 (72.1%) |
| Health Care & Social Assistance | 26 (20.2%) | 103 (79.8%) |
| Arts, Entertainment & Recreation | 0 (0.0%) | 0 (0.0%) |
| Accommodation & Food Services | 32 (82.1%) | 7 (17.9%) |
| Public Administration | 117 (53.2%) | 103 (46.8%) |
| Total | 580 (56.1%) | 454 (43.9%) |
Education in West Bishop
School Enrollment in West Bishop
The most common levels of schooling among the 535 students in West Bishop are elementary school (242 | 45.2%), middle school (117 | 21.9%), and high school (94 | 17.6%).
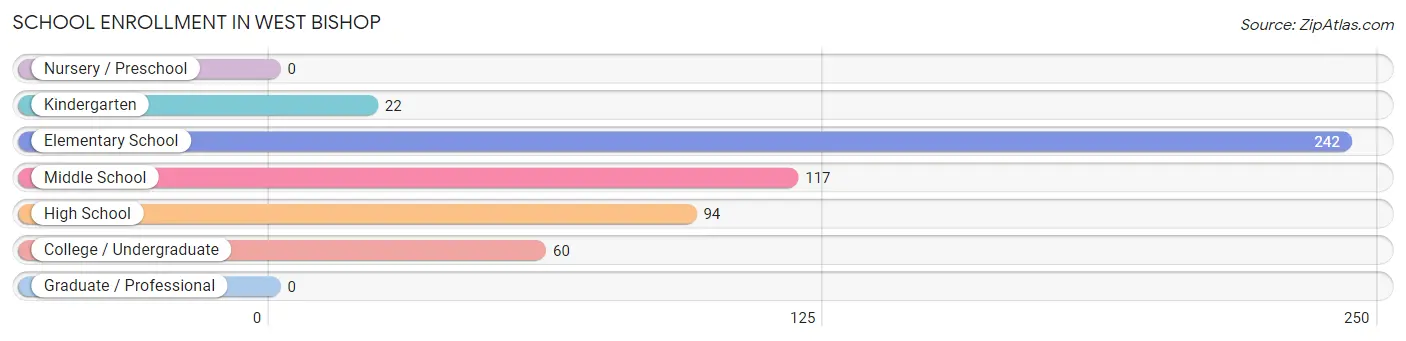
| School Level | # Students | % Students |
| Nursery / Preschool | 0 | 0.0% |
| Kindergarten | 22 | 4.1% |
| Elementary School | 242 | 45.2% |
| Middle School | 117 | 21.9% |
| High School | 94 | 17.6% |
| College / Undergraduate | 60 | 11.2% |
| Graduate / Professional | 0 | 0.0% |
| Total | 535 | 100.0% |
School Enrollment by Age by Funding Source in West Bishop
Out of a total of 535 students who are enrolled in schools in West Bishop, 176 (32.9%) attend a private institution, while the remaining 359 (67.1%) are enrolled in public schools. The age group of 10 to 14 year olds has the highest likelihood of being enrolled in private schools, with 101 (65.2% in the age bracket) enrolled. Conversely, the age group of 15 to 17 year olds has the lowest likelihood of being enrolled in a private school, with 94 (100.0% in the age bracket) attending a public institution.
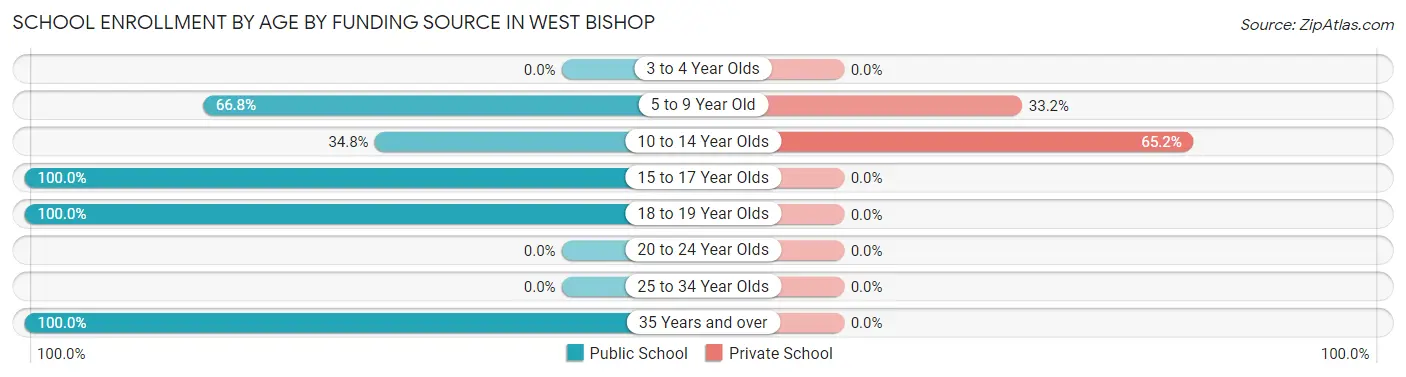
| Age Bracket | Public School | Private School |
| 3 to 4 Year Olds | 0 (0.0%) | 0 (0.0%) |
| 5 to 9 Year Old | 151 (66.8%) | 75 (33.2%) |
| 10 to 14 Year Olds | 54 (34.8%) | 101 (65.2%) |
| 15 to 17 Year Olds | 94 (100.0%) | 0 (0.0%) |
| 18 to 19 Year Olds | 47 (100.0%) | 0 (0.0%) |
| 20 to 24 Year Olds | 0 (0.0%) | 0 (0.0%) |
| 25 to 34 Year Olds | 0 (0.0%) | 0 (0.0%) |
| 35 Years and over | 13 (100.0%) | 0 (0.0%) |
| Total | 359 (67.1%) | 176 (32.9%) |
Educational Attainment by Field of Study in West Bishop
Bio, nature & agricultural (133 | 15.7%), science & technology (92 | 10.8%), engineering (91 | 10.7%), literature & languages (84 | 9.9%), and arts & humanities (84 | 9.9%) are the most common fields of study among 848 individuals in West Bishop who have obtained a bachelor's degree or higher.
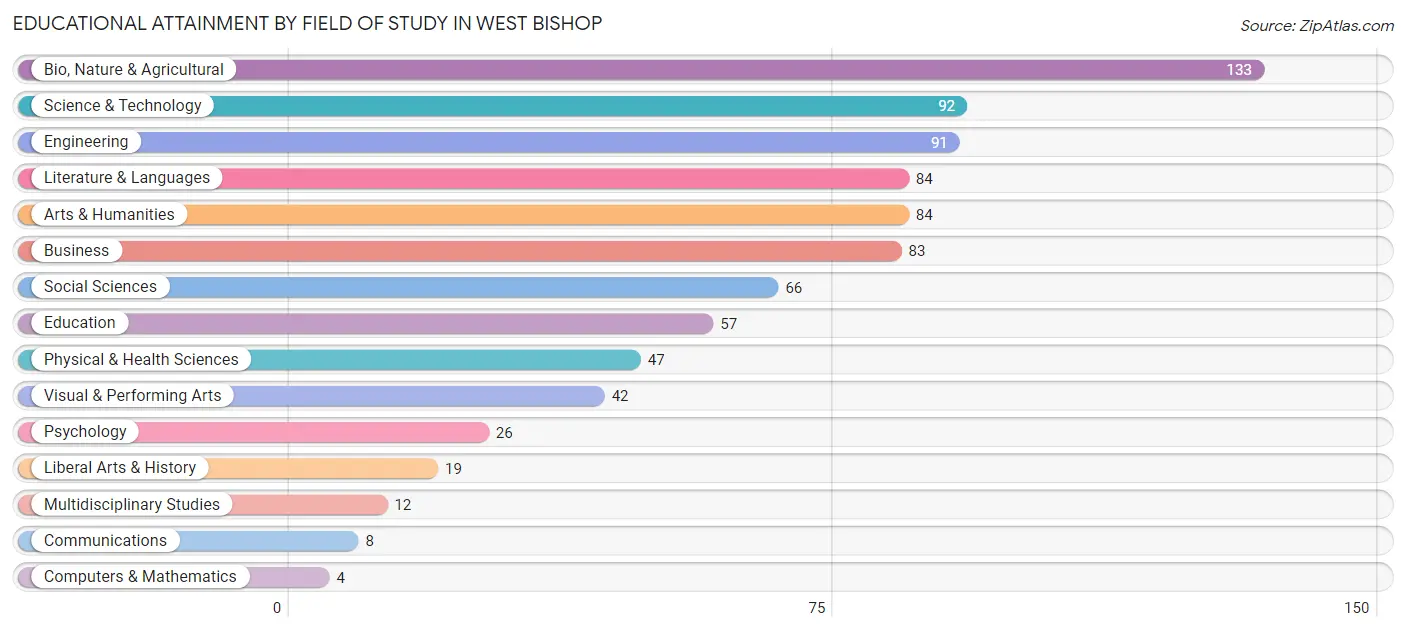
| Field of Study | # Graduates | % Graduates |
| Computers & Mathematics | 4 | 0.5% |
| Bio, Nature & Agricultural | 133 | 15.7% |
| Physical & Health Sciences | 47 | 5.5% |
| Psychology | 26 | 3.1% |
| Social Sciences | 66 | 7.8% |
| Engineering | 91 | 10.7% |
| Multidisciplinary Studies | 12 | 1.4% |
| Science & Technology | 92 | 10.8% |
| Business | 83 | 9.8% |
| Education | 57 | 6.7% |
| Literature & Languages | 84 | 9.9% |
| Liberal Arts & History | 19 | 2.2% |
| Visual & Performing Arts | 42 | 5.0% |
| Communications | 8 | 0.9% |
| Arts & Humanities | 84 | 9.9% |
| Total | 848 | 100.0% |
Transportation & Commute in West Bishop
Vehicle Availability by Sex in West Bishop
The most prevalent vehicle ownership categories in West Bishop are males with 4 vehicles (197, accounting for 34.9%) and females with 4 vehicles (126, making up 44.3%).
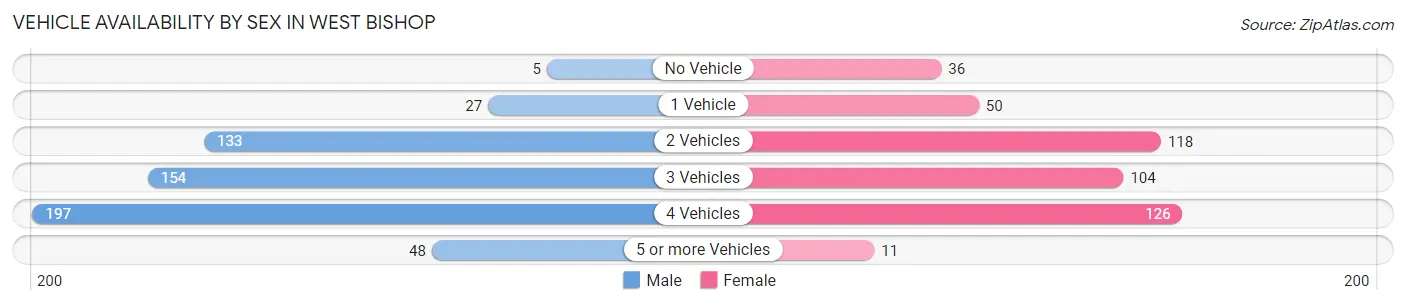
| Vehicles Available | Male | Female |
| No Vehicle | 5 (0.9%) | 36 (8.1%) |
| 1 Vehicle | 27 (4.8%) | 50 (11.2%) |
| 2 Vehicles | 133 (23.6%) | 118 (26.5%) |
| 3 Vehicles | 154 (27.3%) | 104 (23.4%) |
| 4 Vehicles | 197 (34.9%) | 126 (28.3%) |
| 5 or more Vehicles | 48 (8.5%) | 11 (2.5%) |
| Total | 564 (100.0%) | 445 (100.0%) |
Commute Time in West Bishop
The most frequently occuring commute durations in West Bishop are 5 to 9 minutes (252 commuters, 29.7%), 10 to 14 minutes (229 commuters, 27.0%), and 45 to 59 minutes (195 commuters, 23.0%).
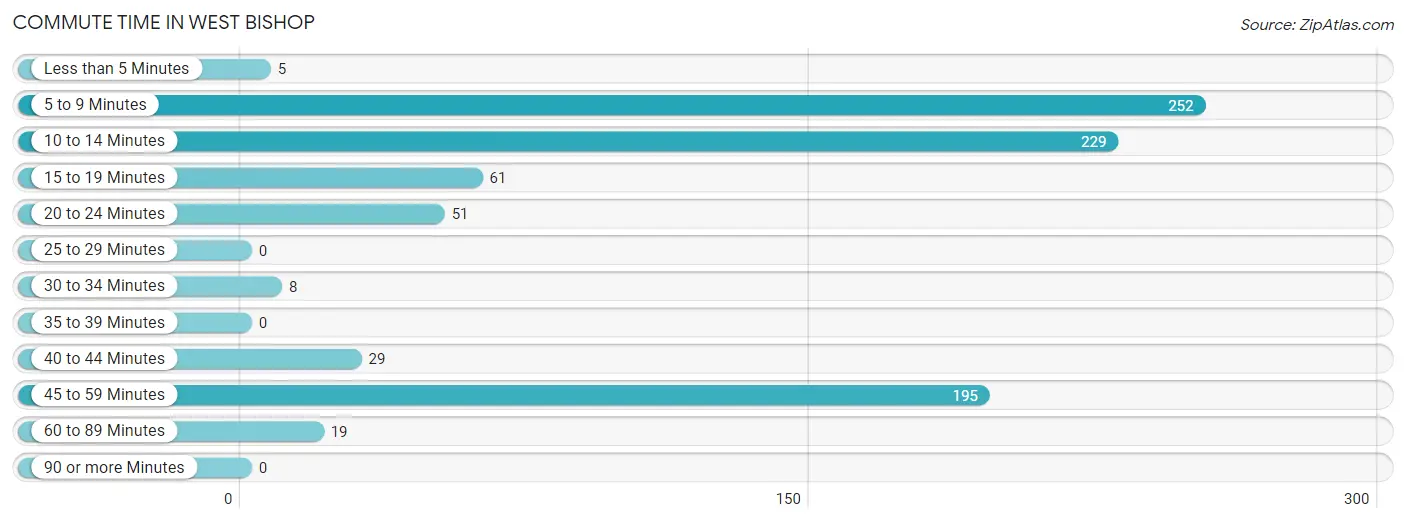
| Commute Time | # Commuters | % Commuters |
| Less than 5 Minutes | 5 | 0.6% |
| 5 to 9 Minutes | 252 | 29.7% |
| 10 to 14 Minutes | 229 | 27.0% |
| 15 to 19 Minutes | 61 | 7.2% |
| 20 to 24 Minutes | 51 | 6.0% |
| 25 to 29 Minutes | 0 | 0.0% |
| 30 to 34 Minutes | 8 | 0.9% |
| 35 to 39 Minutes | 0 | 0.0% |
| 40 to 44 Minutes | 29 | 3.4% |
| 45 to 59 Minutes | 195 | 23.0% |
| 60 to 89 Minutes | 19 | 2.2% |
| 90 or more Minutes | 0 | 0.0% |
Commute Time by Sex in West Bishop
The most common commute times in West Bishop are 45 to 59 minutes (170 commuters, 37.4%) for males and 5 to 9 minutes (175 commuters, 44.3%) for females.
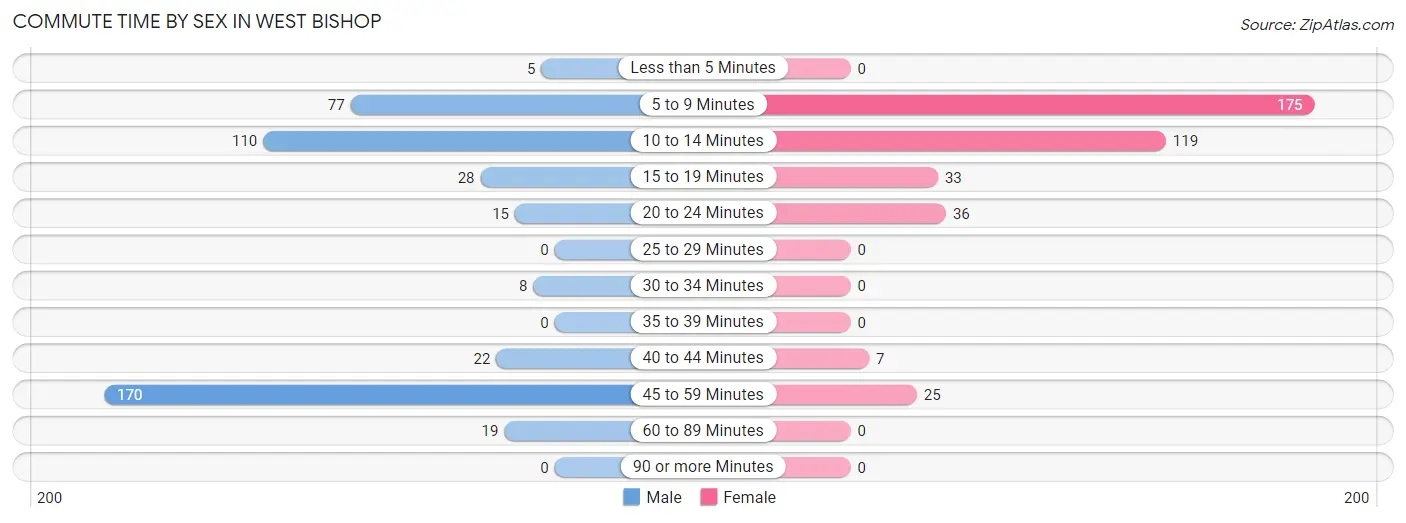
| Commute Time | Male | Female |
| Less than 5 Minutes | 5 (1.1%) | 0 (0.0%) |
| 5 to 9 Minutes | 77 (17.0%) | 175 (44.3%) |
| 10 to 14 Minutes | 110 (24.2%) | 119 (30.1%) |
| 15 to 19 Minutes | 28 (6.2%) | 33 (8.4%) |
| 20 to 24 Minutes | 15 (3.3%) | 36 (9.1%) |
| 25 to 29 Minutes | 0 (0.0%) | 0 (0.0%) |
| 30 to 34 Minutes | 8 (1.8%) | 0 (0.0%) |
| 35 to 39 Minutes | 0 (0.0%) | 0 (0.0%) |
| 40 to 44 Minutes | 22 (4.9%) | 7 (1.8%) |
| 45 to 59 Minutes | 170 (37.4%) | 25 (6.3%) |
| 60 to 89 Minutes | 19 (4.2%) | 0 (0.0%) |
| 90 or more Minutes | 0 (0.0%) | 0 (0.0%) |
Time of Departure to Work by Sex in West Bishop
The most frequent times of departure to work in West Bishop are 6:30 AM to 6:59 AM (139, 30.6%) for males and 7:30 AM to 7:59 AM (138, 34.9%) for females.
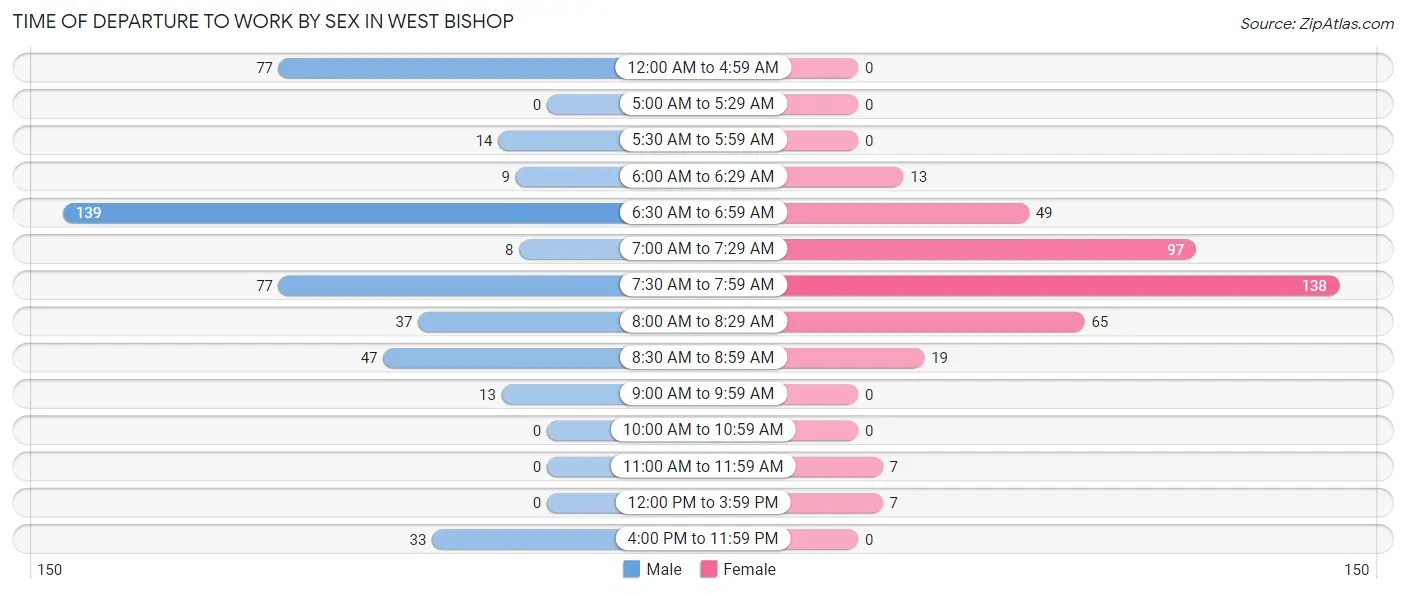
| Time of Departure | Male | Female |
| 12:00 AM to 4:59 AM | 77 (17.0%) | 0 (0.0%) |
| 5:00 AM to 5:29 AM | 0 (0.0%) | 0 (0.0%) |
| 5:30 AM to 5:59 AM | 14 (3.1%) | 0 (0.0%) |
| 6:00 AM to 6:29 AM | 9 (2.0%) | 13 (3.3%) |
| 6:30 AM to 6:59 AM | 139 (30.6%) | 49 (12.4%) |
| 7:00 AM to 7:29 AM | 8 (1.8%) | 97 (24.6%) |
| 7:30 AM to 7:59 AM | 77 (17.0%) | 138 (34.9%) |
| 8:00 AM to 8:29 AM | 37 (8.2%) | 65 (16.5%) |
| 8:30 AM to 8:59 AM | 47 (10.3%) | 19 (4.8%) |
| 9:00 AM to 9:59 AM | 13 (2.9%) | 0 (0.0%) |
| 10:00 AM to 10:59 AM | 0 (0.0%) | 0 (0.0%) |
| 11:00 AM to 11:59 AM | 0 (0.0%) | 7 (1.8%) |
| 12:00 PM to 3:59 PM | 0 (0.0%) | 7 (1.8%) |
| 4:00 PM to 11:59 PM | 33 (7.3%) | 0 (0.0%) |
| Total | 454 (100.0%) | 395 (100.0%) |
Housing Occupancy in West Bishop
Occupancy by Ownership in West Bishop
Of the total 881 dwellings in West Bishop, owner-occupied units account for 747 (84.8%), while renter-occupied units make up 134 (15.2%).
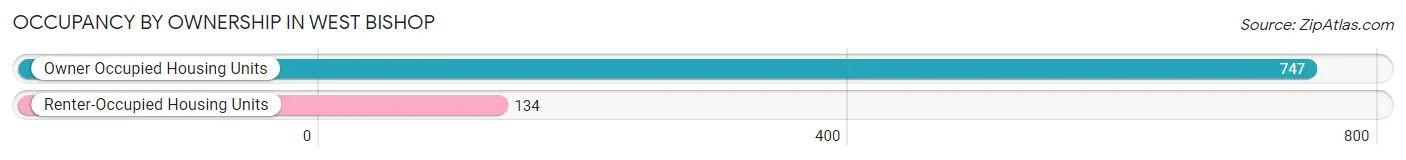
| Occupancy | # Housing Units | % Housing Units |
| Owner Occupied Housing Units | 747 | 84.8% |
| Renter-Occupied Housing Units | 134 | 15.2% |
| Total Occupied Housing Units | 881 | 100.0% |
Occupancy by Household Size in West Bishop
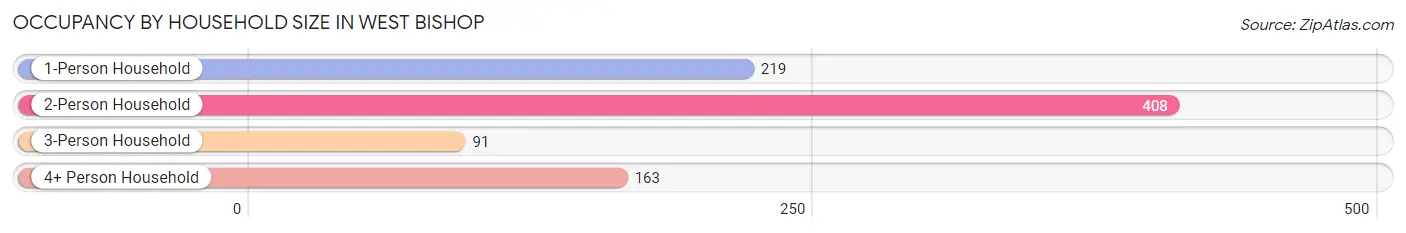
| Household Size | # Housing Units | % Housing Units |
| 1-Person Household | 219 | 24.9% |
| 2-Person Household | 408 | 46.3% |
| 3-Person Household | 91 | 10.3% |
| 4+ Person Household | 163 | 18.5% |
| Total Housing Units | 881 | 100.0% |
Occupancy by Ownership by Household Size in West Bishop
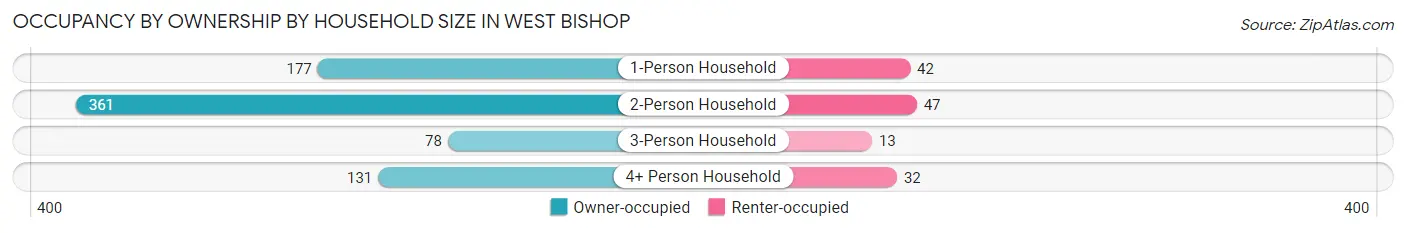
| Household Size | Owner-occupied | Renter-occupied |
| 1-Person Household | 177 (80.8%) | 42 (19.2%) |
| 2-Person Household | 361 (88.5%) | 47 (11.5%) |
| 3-Person Household | 78 (85.7%) | 13 (14.3%) |
| 4+ Person Household | 131 (80.4%) | 32 (19.6%) |
| Total Housing Units | 747 (84.8%) | 134 (15.2%) |
Occupancy by Educational Attainment in West Bishop
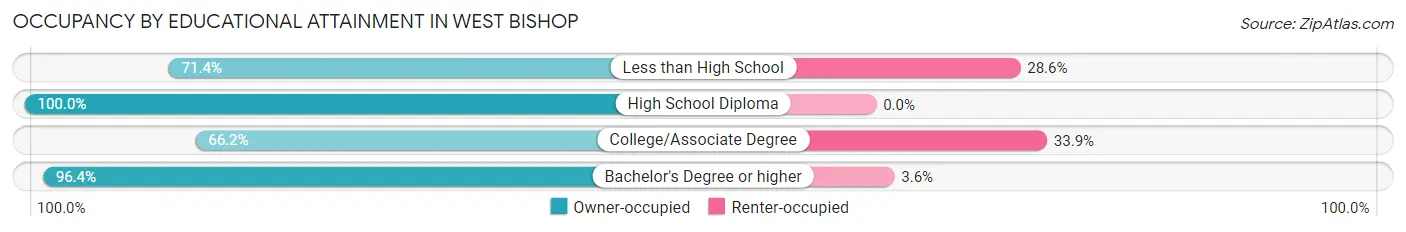
| Household Size | Owner-occupied | Renter-occupied |
| Less than High School | 20 (71.4%) | 8 (28.6%) |
| High School Diploma | 60 (100.0%) | 0 (0.0%) |
| College/Associate Degree | 213 (66.1%) | 109 (33.9%) |
| Bachelor's Degree or higher | 454 (96.4%) | 17 (3.6%) |
Occupancy by Age of Householder in West Bishop
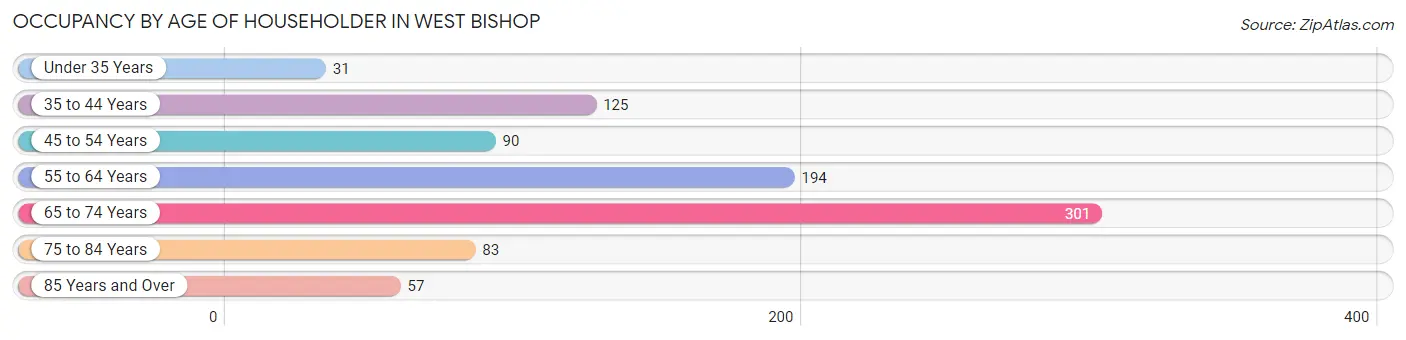
| Age Bracket | # Households | % Households |
| Under 35 Years | 31 | 3.5% |
| 35 to 44 Years | 125 | 14.2% |
| 45 to 54 Years | 90 | 10.2% |
| 55 to 64 Years | 194 | 22.0% |
| 65 to 74 Years | 301 | 34.2% |
| 75 to 84 Years | 83 | 9.4% |
| 85 Years and Over | 57 | 6.5% |
| Total | 881 | 100.0% |
Housing Finances in West Bishop
Median Income by Occupancy in West Bishop
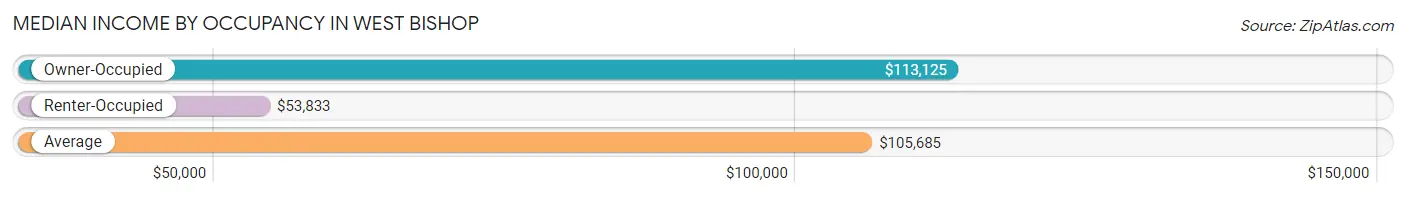
| Occupancy Type | # Households | Median Income |
| Owner-Occupied | 747 (84.8%) | $113,125 |
| Renter-Occupied | 134 (15.2%) | $53,833 |
| Average | 881 (100.0%) | $105,685 |
Occupancy by Householder Income Bracket in West Bishop
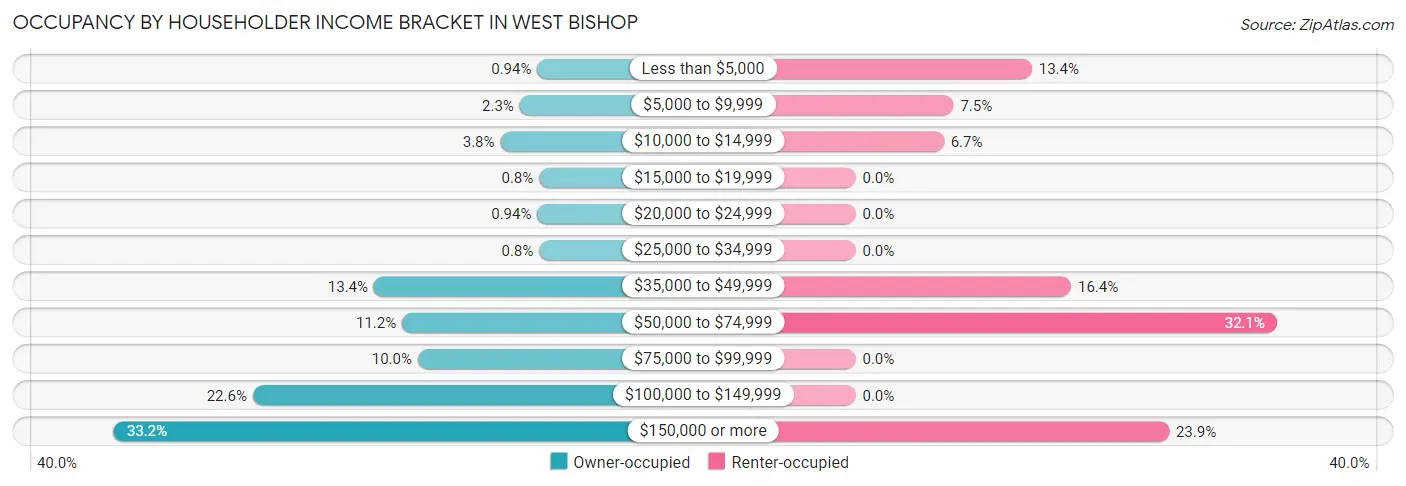
| Income Bracket | Owner-occupied | Renter-occupied |
| Less than $5,000 | 7 (0.9%) | 18 (13.4%) |
| $5,000 to $9,999 | 17 (2.3%) | 10 (7.5%) |
| $10,000 to $14,999 | 28 (3.7%) | 9 (6.7%) |
| $15,000 to $19,999 | 6 (0.8%) | 0 (0.0%) |
| $20,000 to $24,999 | 7 (0.9%) | 0 (0.0%) |
| $25,000 to $34,999 | 6 (0.8%) | 0 (0.0%) |
| $35,000 to $49,999 | 100 (13.4%) | 22 (16.4%) |
| $50,000 to $74,999 | 84 (11.2%) | 43 (32.1%) |
| $75,000 to $99,999 | 75 (10.0%) | 0 (0.0%) |
| $100,000 to $149,999 | 169 (22.6%) | 0 (0.0%) |
| $150,000 or more | 248 (33.2%) | 32 (23.9%) |
| Total | 747 (100.0%) | 134 (100.0%) |
Monthly Housing Cost Tiers in West Bishop
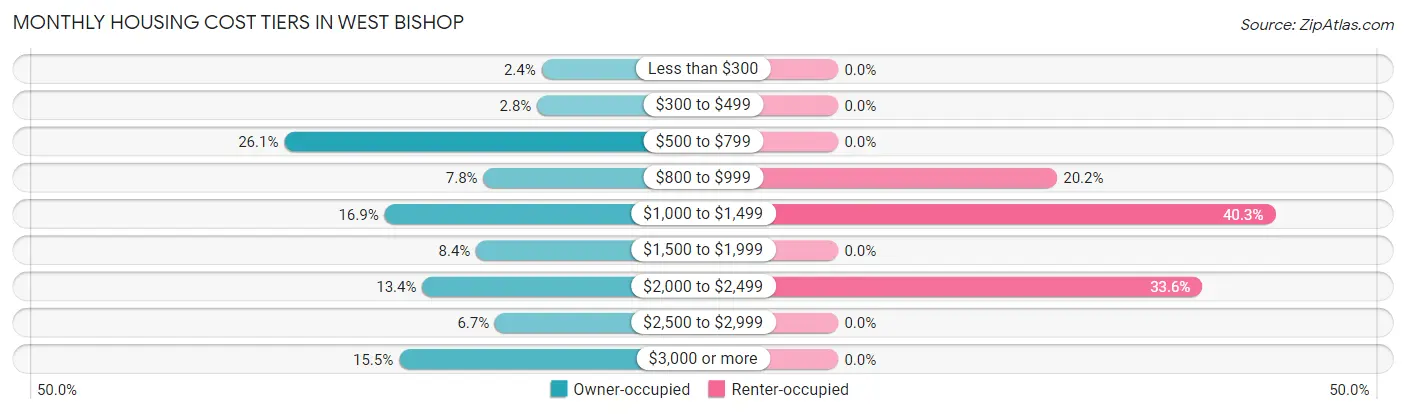
| Monthly Cost | Owner-occupied | Renter-occupied |
| Less than $300 | 18 (2.4%) | 0 (0.0%) |
| $300 to $499 | 21 (2.8%) | 0 (0.0%) |
| $500 to $799 | 195 (26.1%) | 0 (0.0%) |
| $800 to $999 | 58 (7.8%) | 27 (20.2%) |
| $1,000 to $1,499 | 126 (16.9%) | 54 (40.3%) |
| $1,500 to $1,999 | 63 (8.4%) | 0 (0.0%) |
| $2,000 to $2,499 | 100 (13.4%) | 45 (33.6%) |
| $2,500 to $2,999 | 50 (6.7%) | 0 (0.0%) |
| $3,000 or more | 116 (15.5%) | 0 (0.0%) |
| Total | 747 (100.0%) | 134 (100.0%) |
Physical Housing Characteristics in West Bishop
Housing Structures in West Bishop
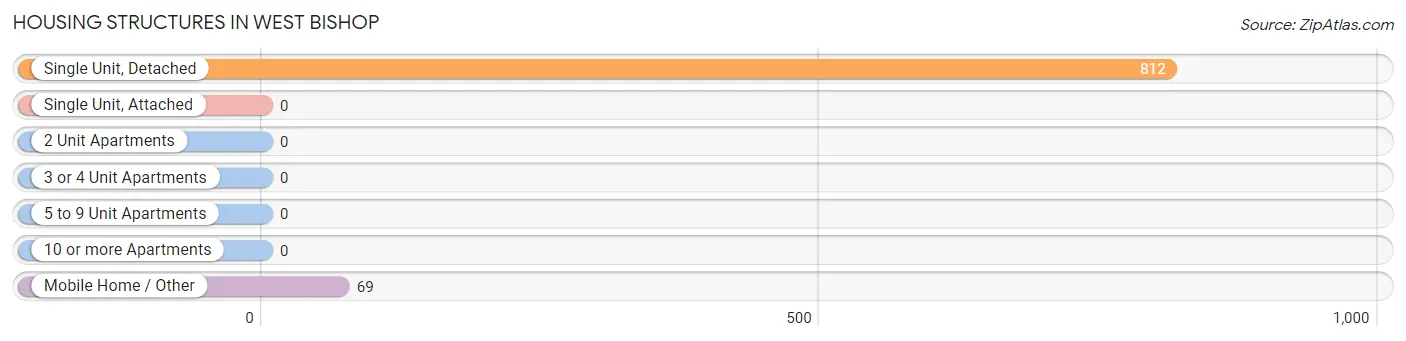
| Structure Type | # Housing Units | % Housing Units |
| Single Unit, Detached | 812 | 92.2% |
| Single Unit, Attached | 0 | 0.0% |
| 2 Unit Apartments | 0 | 0.0% |
| 3 or 4 Unit Apartments | 0 | 0.0% |
| 5 to 9 Unit Apartments | 0 | 0.0% |
| 10 or more Apartments | 0 | 0.0% |
| Mobile Home / Other | 69 | 7.8% |
| Total | 881 | 100.0% |
Housing Structures by Occupancy in West Bishop
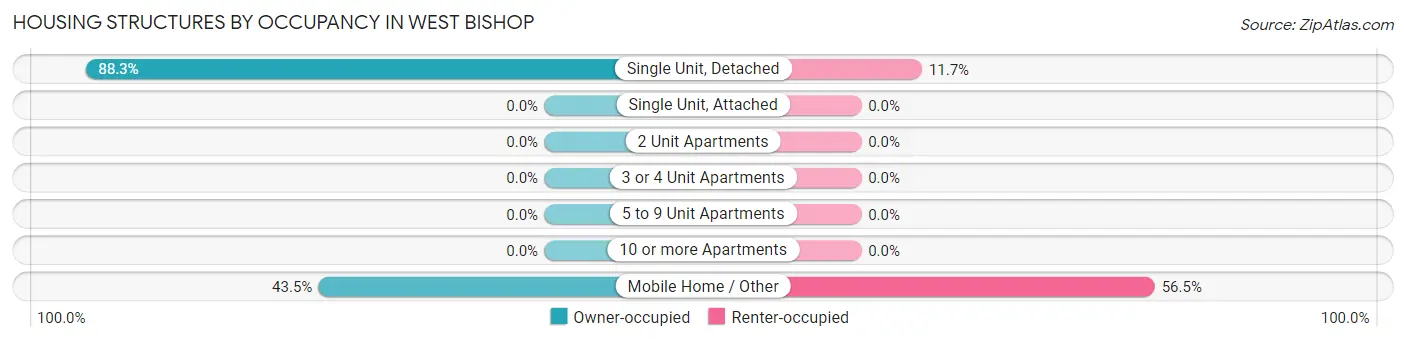
| Structure Type | Owner-occupied | Renter-occupied |
| Single Unit, Detached | 717 (88.3%) | 95 (11.7%) |
| Single Unit, Attached | 0 (0.0%) | 0 (0.0%) |
| 2 Unit Apartments | 0 (0.0%) | 0 (0.0%) |
| 3 or 4 Unit Apartments | 0 (0.0%) | 0 (0.0%) |
| 5 to 9 Unit Apartments | 0 (0.0%) | 0 (0.0%) |
| 10 or more Apartments | 0 (0.0%) | 0 (0.0%) |
| Mobile Home / Other | 30 (43.5%) | 39 (56.5%) |
| Total | 747 (84.8%) | 134 (15.2%) |
Housing Structures by Number of Rooms in West Bishop
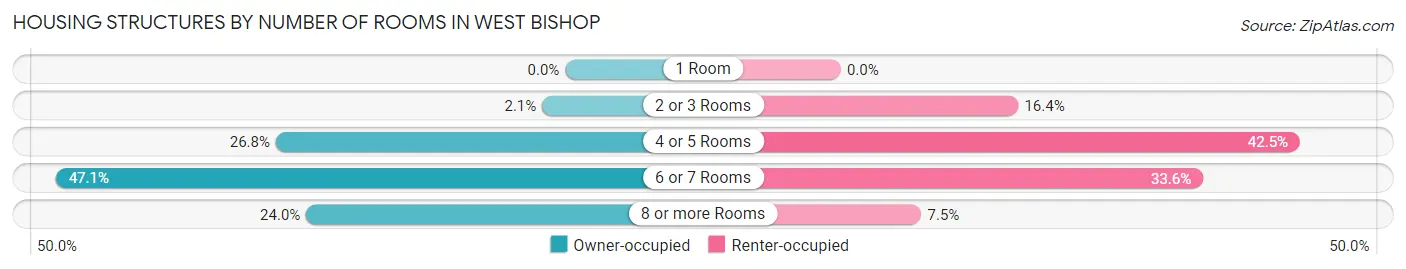
| Number of Rooms | Owner-occupied | Renter-occupied |
| 1 Room | 0 (0.0%) | 0 (0.0%) |
| 2 or 3 Rooms | 16 (2.1%) | 22 (16.4%) |
| 4 or 5 Rooms | 200 (26.8%) | 57 (42.5%) |
| 6 or 7 Rooms | 352 (47.1%) | 45 (33.6%) |
| 8 or more Rooms | 179 (24.0%) | 10 (7.5%) |
| Total | 747 (100.0%) | 134 (100.0%) |
Housing Structure by Heating Type in West Bishop
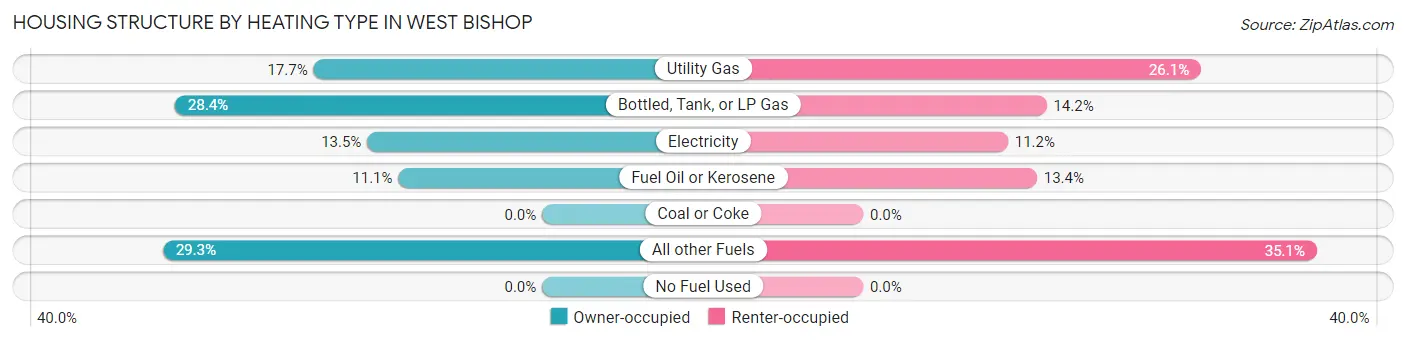
| Heating Type | Owner-occupied | Renter-occupied |
| Utility Gas | 132 (17.7%) | 35 (26.1%) |
| Bottled, Tank, or LP Gas | 212 (28.4%) | 19 (14.2%) |
| Electricity | 101 (13.5%) | 15 (11.2%) |
| Fuel Oil or Kerosene | 83 (11.1%) | 18 (13.4%) |
| Coal or Coke | 0 (0.0%) | 0 (0.0%) |
| All other Fuels | 219 (29.3%) | 47 (35.1%) |
| No Fuel Used | 0 (0.0%) | 0 (0.0%) |
| Total | 747 (100.0%) | 134 (100.0%) |
Household Vehicle Usage in West Bishop
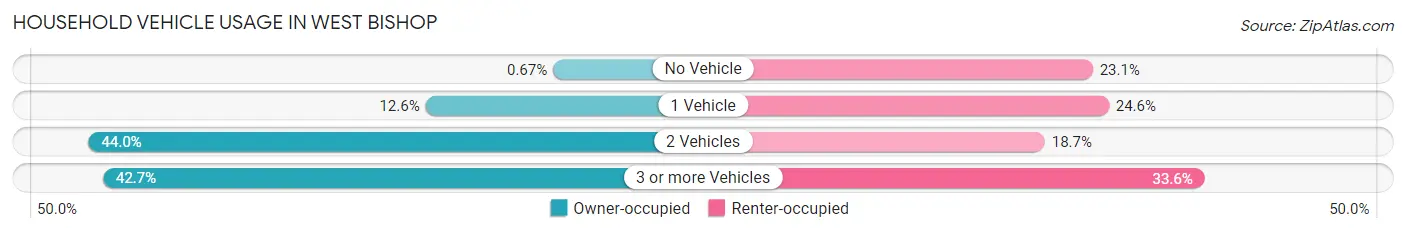
| Vehicles per Household | Owner-occupied | Renter-occupied |
| No Vehicle | 5 (0.7%) | 31 (23.1%) |
| 1 Vehicle | 94 (12.6%) | 33 (24.6%) |
| 2 Vehicles | 329 (44.0%) | 25 (18.7%) |
| 3 or more Vehicles | 319 (42.7%) | 45 (33.6%) |
| Total | 747 (100.0%) | 134 (100.0%) |
Real Estate & Mortgages in West Bishop
Real Estate and Mortgage Overview in West Bishop
| Characteristic | Without Mortgage | With Mortgage |
| Housing Units | 360 | 387 |
| Median Property Value | $544,600 | $540,400 |
| Median Household Income | $99,022 | $180 |
| Monthly Housing Costs | $746 | $116 |
| Real Estate Taxes | $3,274 | $0 |
Property Value by Mortgage Status in West Bishop
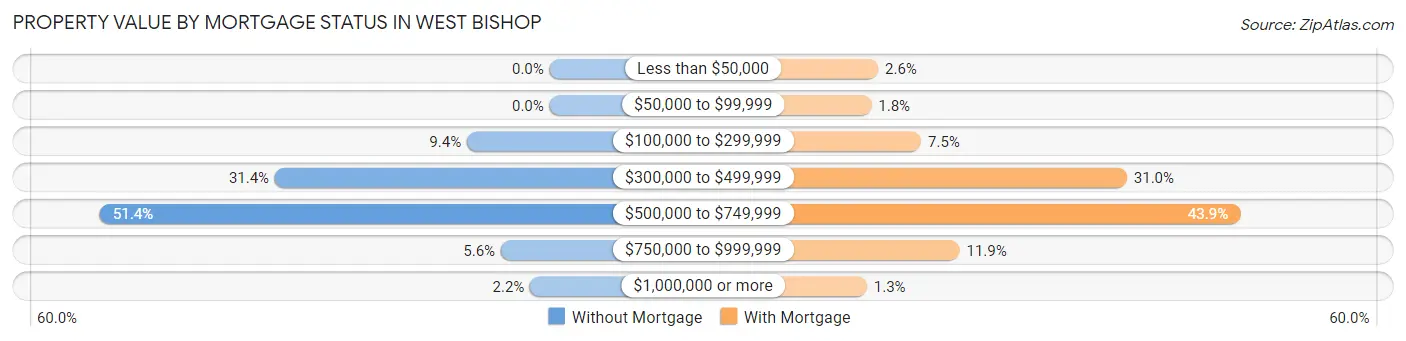
| Property Value | Without Mortgage | With Mortgage |
| Less than $50,000 | 0 (0.0%) | 10 (2.6%) |
| $50,000 to $99,999 | 0 (0.0%) | 7 (1.8%) |
| $100,000 to $299,999 | 34 (9.4%) | 29 (7.5%) |
| $300,000 to $499,999 | 113 (31.4%) | 120 (31.0%) |
| $500,000 to $749,999 | 185 (51.4%) | 170 (43.9%) |
| $750,000 to $999,999 | 20 (5.6%) | 46 (11.9%) |
| $1,000,000 or more | 8 (2.2%) | 5 (1.3%) |
| Total | 360 (100.0%) | 387 (100.0%) |
Household Income by Mortgage Status in West Bishop
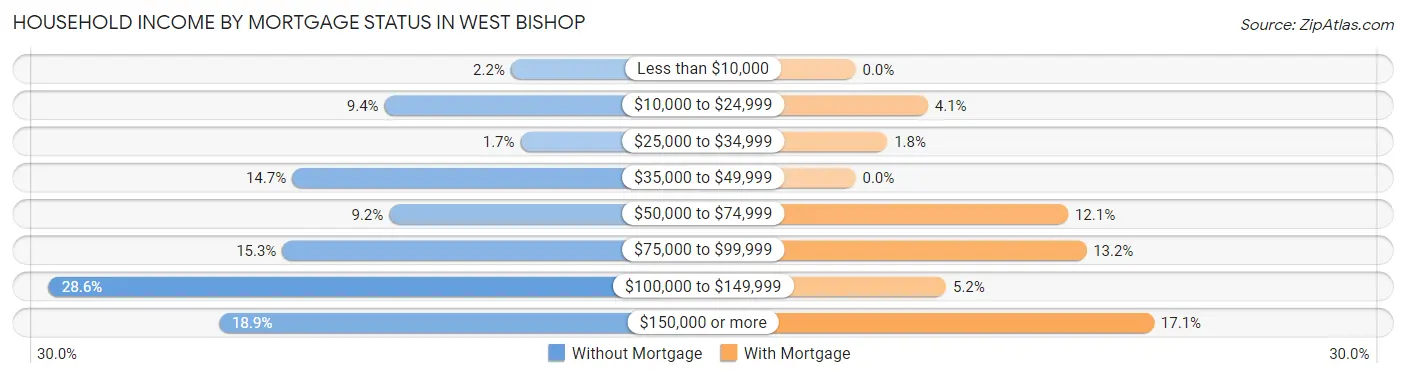
| Household Income | Without Mortgage | With Mortgage |
| Less than $10,000 | 8 (2.2%) | 0 (0.0%) |
| $10,000 to $24,999 | 34 (9.4%) | 16 (4.1%) |
| $25,000 to $34,999 | 6 (1.7%) | 7 (1.8%) |
| $35,000 to $49,999 | 53 (14.7%) | 0 (0.0%) |
| $50,000 to $74,999 | 33 (9.2%) | 47 (12.1%) |
| $75,000 to $99,999 | 55 (15.3%) | 51 (13.2%) |
| $100,000 to $149,999 | 103 (28.6%) | 20 (5.2%) |
| $150,000 or more | 68 (18.9%) | 66 (17.1%) |
| Total | 360 (100.0%) | 387 (100.0%) |
Property Value to Household Income Ratio in West Bishop
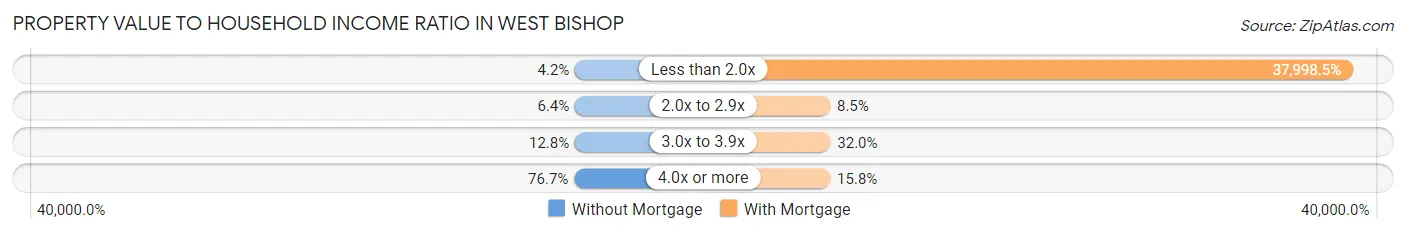
| Value-to-Income Ratio | Without Mortgage | With Mortgage |
| Less than 2.0x | 15 (4.2%) | 147,054 (37,998.5%) |
| 2.0x to 2.9x | 23 (6.4%) | 33 (8.5%) |
| 3.0x to 3.9x | 46 (12.8%) | 124 (32.0%) |
| 4.0x or more | 276 (76.7%) | 61 (15.8%) |
| Total | 360 (100.0%) | 387 (100.0%) |
Real Estate Taxes by Mortgage Status in West Bishop
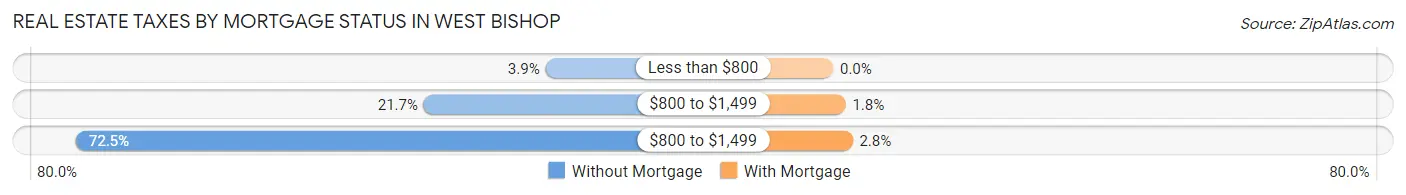
| Property Taxes | Without Mortgage | With Mortgage |
| Less than $800 | 14 (3.9%) | 0 (0.0%) |
| $800 to $1,499 | 78 (21.7%) | 7 (1.8%) |
| $800 to $1,499 | 261 (72.5%) | 11 (2.8%) |
| Total | 360 (100.0%) | 387 (100.0%) |
Health & Disability in West Bishop
Health Insurance Coverage by Age in West Bishop
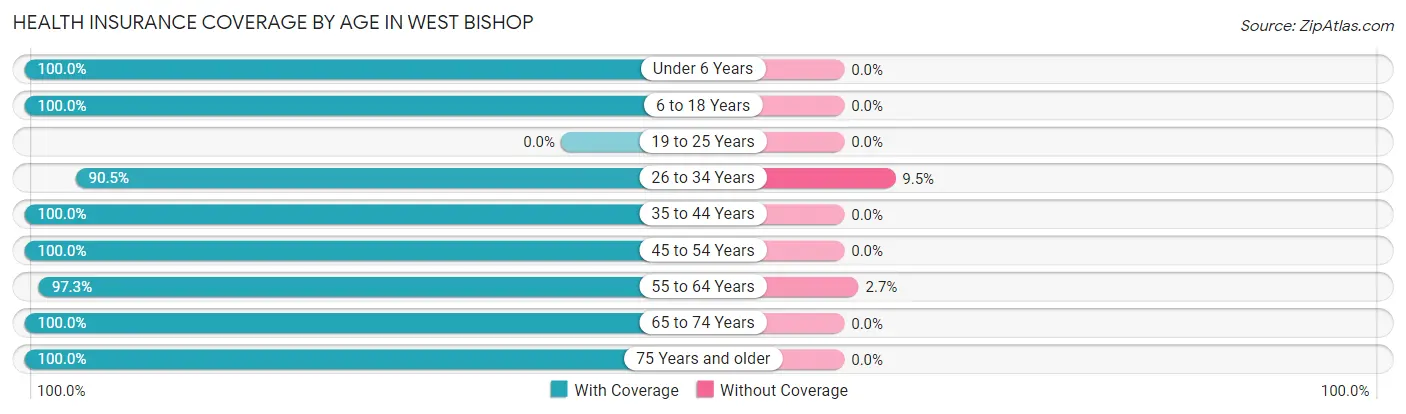
| Age Bracket | With Coverage | Without Coverage |
| Under 6 Years | 99 (100.0%) | 0 (0.0%) |
| 6 to 18 Years | 500 (100.0%) | 0 (0.0%) |
| 19 to 25 Years | 0 (0.0%) | 0 (0.0%) |
| 26 to 34 Years | 171 (90.5%) | 18 (9.5%) |
| 35 to 44 Years | 315 (100.0%) | 0 (0.0%) |
| 45 to 54 Years | 159 (100.0%) | 0 (0.0%) |
| 55 to 64 Years | 402 (97.3%) | 11 (2.7%) |
| 65 to 74 Years | 479 (100.0%) | 0 (0.0%) |
| 75 Years and older | 276 (100.0%) | 0 (0.0%) |
| Total | 2,401 (98.8%) | 29 (1.2%) |
Health Insurance Coverage by Citizenship Status in West Bishop
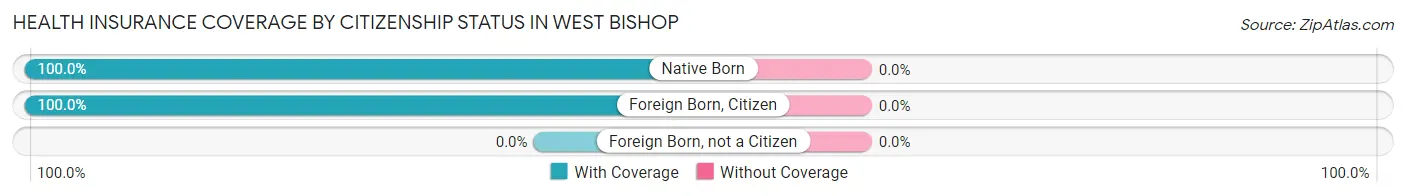
| Citizenship Status | With Coverage | Without Coverage |
| Native Born | 99 (100.0%) | 0 (0.0%) |
| Foreign Born, Citizen | 500 (100.0%) | 0 (0.0%) |
| Foreign Born, not a Citizen | 0 (0.0%) | 0 (0.0%) |
Health Insurance Coverage by Household Income in West Bishop
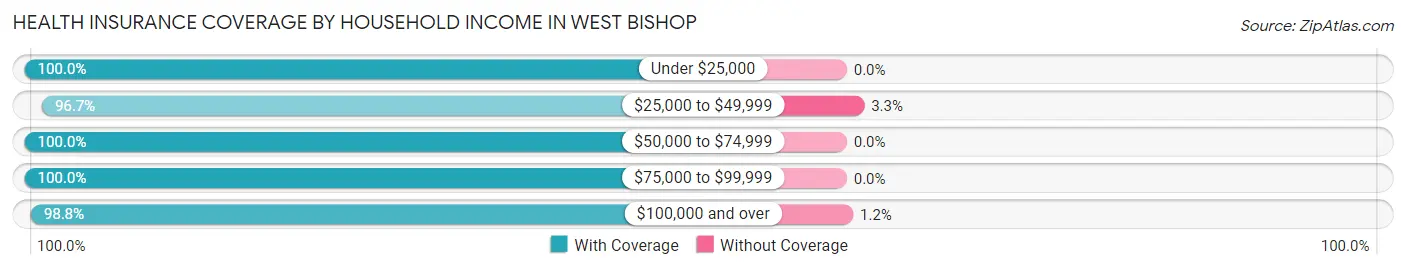
| Household Income | With Coverage | Without Coverage |
| Under $25,000 | 153 (100.0%) | 0 (0.0%) |
| $25,000 to $49,999 | 326 (96.7%) | 11 (3.3%) |
| $50,000 to $74,999 | 272 (100.0%) | 0 (0.0%) |
| $75,000 to $99,999 | 146 (100.0%) | 0 (0.0%) |
| $100,000 and over | 1,504 (98.8%) | 18 (1.2%) |
Public vs Private Health Insurance Coverage by Age in West Bishop
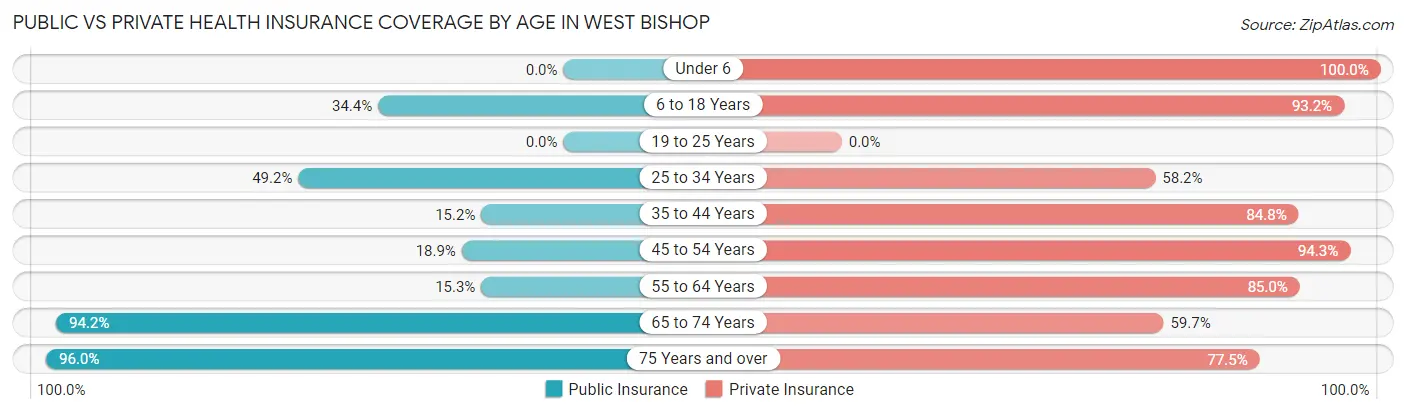
| Age Bracket | Public Insurance | Private Insurance |
| Under 6 | 0 (0.0%) | 99 (100.0%) |
| 6 to 18 Years | 172 (34.4%) | 466 (93.2%) |
| 19 to 25 Years | 0 (0.0%) | 0 (0.0%) |
| 25 to 34 Years | 93 (49.2%) | 110 (58.2%) |
| 35 to 44 Years | 48 (15.2%) | 267 (84.8%) |
| 45 to 54 Years | 30 (18.9%) | 150 (94.3%) |
| 55 to 64 Years | 63 (15.2%) | 351 (85.0%) |
| 65 to 74 Years | 451 (94.2%) | 286 (59.7%) |
| 75 Years and over | 265 (96.0%) | 214 (77.5%) |
| Total | 1,122 (46.2%) | 1,943 (80.0%) |
Disability Status by Sex by Age in West Bishop
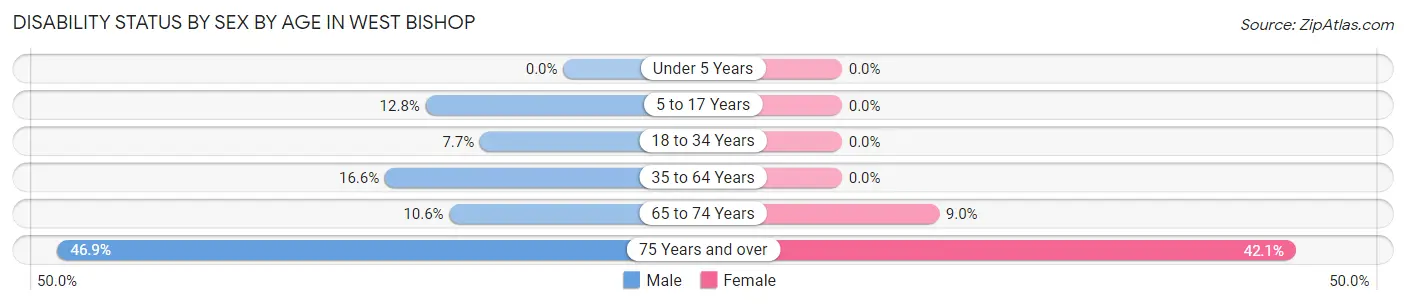
| Age Bracket | Male | Female |
| Under 5 Years | 0 (0.0%) | 0 (0.0%) |
| 5 to 17 Years | 40 (12.8%) | 0 (0.0%) |
| 18 to 34 Years | 17 (7.7%) | 0 (0.0%) |
| 35 to 64 Years | 74 (16.6%) | 0 (0.0%) |
| 65 to 74 Years | 26 (10.6%) | 21 (9.0%) |
| 75 Years and over | 46 (46.9%) | 75 (42.1%) |
Disability Class by Sex by Age in West Bishop
Disability Class: Hearing Difficulty
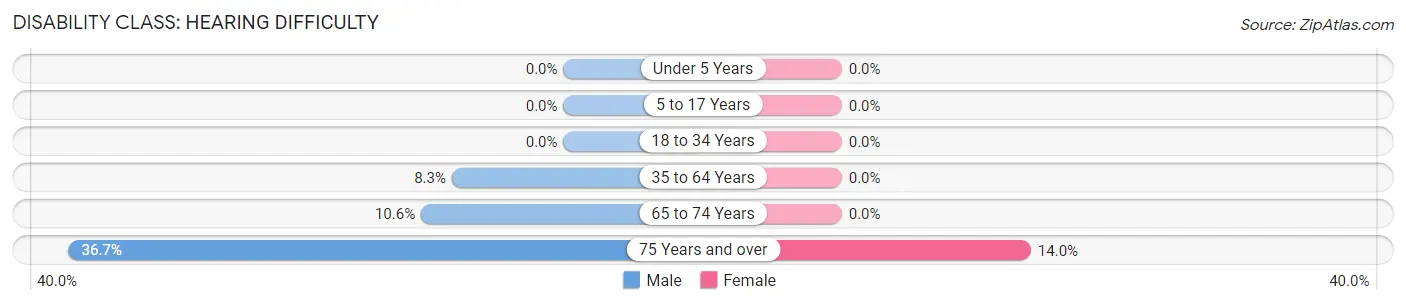
| Age Bracket | Male | Female |
| Under 5 Years | 0 (0.0%) | 0 (0.0%) |
| 5 to 17 Years | 0 (0.0%) | 0 (0.0%) |
| 18 to 34 Years | 0 (0.0%) | 0 (0.0%) |
| 35 to 64 Years | 37 (8.3%) | 0 (0.0%) |
| 65 to 74 Years | 26 (10.6%) | 0 (0.0%) |
| 75 Years and over | 36 (36.7%) | 25 (14.0%) |
Disability Class: Vision Difficulty
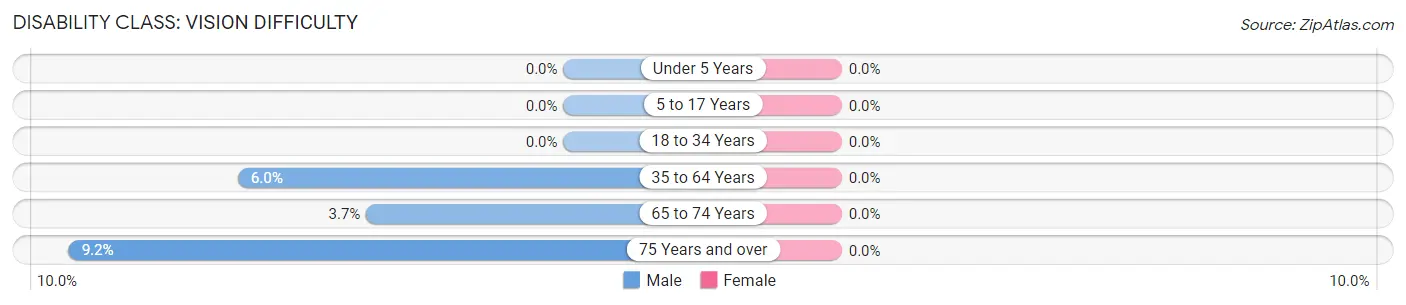
| Age Bracket | Male | Female |
| Under 5 Years | 0 (0.0%) | 0 (0.0%) |
| 5 to 17 Years | 0 (0.0%) | 0 (0.0%) |
| 18 to 34 Years | 0 (0.0%) | 0 (0.0%) |
| 35 to 64 Years | 27 (6.0%) | 0 (0.0%) |
| 65 to 74 Years | 9 (3.7%) | 0 (0.0%) |
| 75 Years and over | 9 (9.2%) | 0 (0.0%) |
Disability Class: Cognitive Difficulty
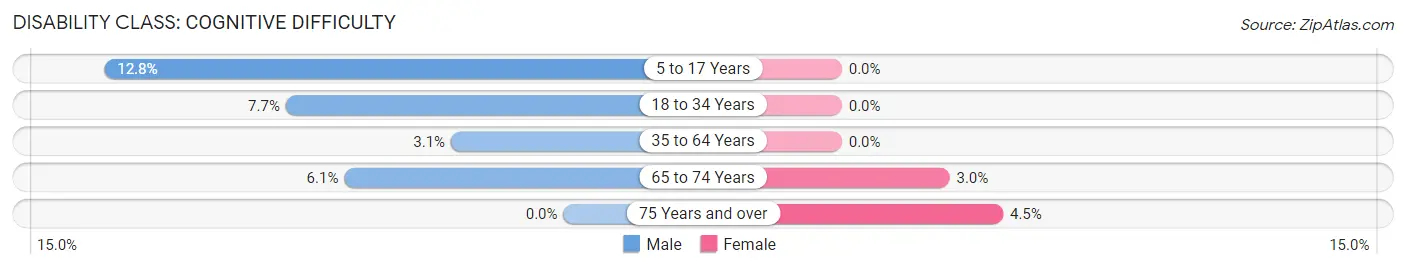
| Age Bracket | Male | Female |
| 5 to 17 Years | 40 (12.8%) | 0 (0.0%) |
| 18 to 34 Years | 17 (7.7%) | 0 (0.0%) |
| 35 to 64 Years | 14 (3.1%) | 0 (0.0%) |
| 65 to 74 Years | 15 (6.1%) | 7 (3.0%) |
| 75 Years and over | 0 (0.0%) | 8 (4.5%) |
Disability Class: Ambulatory Difficulty
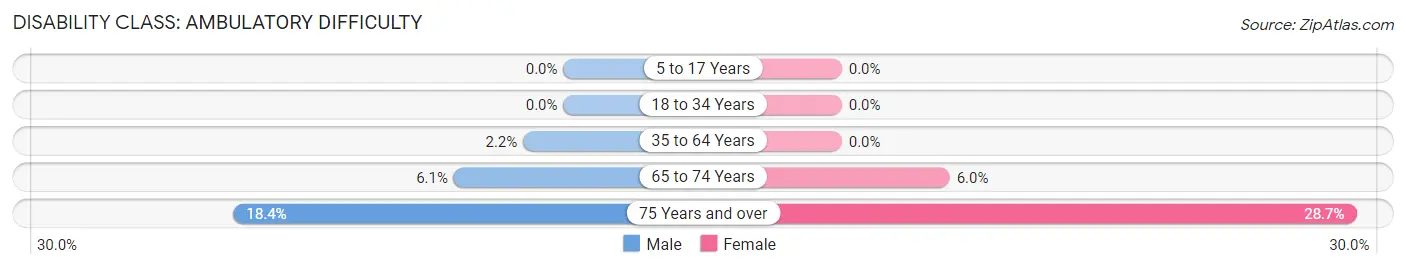
| Age Bracket | Male | Female |
| 5 to 17 Years | 0 (0.0%) | 0 (0.0%) |
| 18 to 34 Years | 0 (0.0%) | 0 (0.0%) |
| 35 to 64 Years | 10 (2.2%) | 0 (0.0%) |
| 65 to 74 Years | 15 (6.1%) | 14 (6.0%) |
| 75 Years and over | 18 (18.4%) | 51 (28.6%) |
Disability Class: Self-Care Difficulty
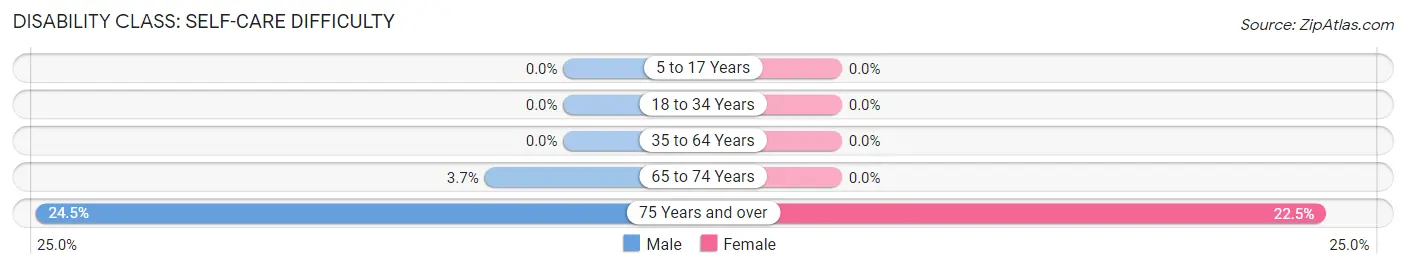
| Age Bracket | Male | Female |
| 5 to 17 Years | 0 (0.0%) | 0 (0.0%) |
| 18 to 34 Years | 0 (0.0%) | 0 (0.0%) |
| 35 to 64 Years | 0 (0.0%) | 0 (0.0%) |
| 65 to 74 Years | 9 (3.7%) | 0 (0.0%) |
| 75 Years and over | 24 (24.5%) | 40 (22.5%) |
Technology Access in West Bishop
Computing Device Access in West Bishop
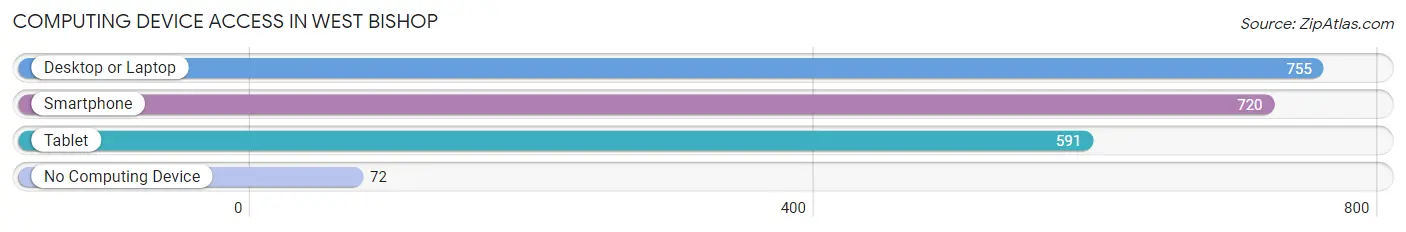
| Device Type | # Households | % Households |
| Desktop or Laptop | 755 | 85.7% |
| Smartphone | 720 | 81.7% |
| Tablet | 591 | 67.1% |
| No Computing Device | 72 | 8.2% |
| Total | 881 | 100.0% |
Internet Access in West Bishop
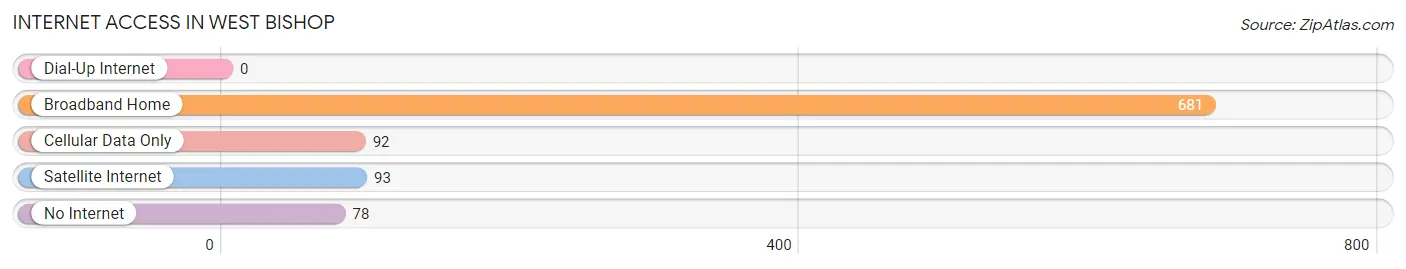
| Internet Type | # Households | % Households |
| Dial-Up Internet | 0 | 0.0% |
| Broadband Home | 681 | 77.3% |
| Cellular Data Only | 92 | 10.4% |
| Satellite Internet | 93 | 10.6% |
| No Internet | 78 | 8.8% |
| Total | 881 | 100.0% |
West Bishop Summary
Bishop, California is a small city located in the Eastern Sierra Nevada Mountains of Inyo County, California. It is the county seat of Inyo County and is the largest city in the county. Bishop is located at the northern end of the Owens Valley, near the California-Nevada border. The city is situated at an elevation of 4,150 feet (1,260 m) and is surrounded by the Sierra Nevada Mountains to the west and the White Mountains to the east.
History
The area around Bishop was first inhabited by the Paiute and Shoshone Native American tribes. The first Europeans to explore the area were members of the Spanish Portola expedition in 1772. The area was later explored by John C. Fremont in 1845.
In 1864, Bishop was founded by Samuel Bishop, a rancher from the Owens Valley. The town was named after him and was incorporated in 1891.
Geography
Bishop is located in the Owens Valley, at the northern end of the valley, near the California-Nevada border. The city is situated at an elevation of 4,150 feet (1,260 m) and is surrounded by the Sierra Nevada Mountains to the west and the White Mountains to the east. The city is located on the eastern side of the Sierra Nevada Mountains, and is approximately 200 miles (320 km) northeast of Los Angeles.
The city is located in a semi-arid desert climate, with hot summers and cold winters. The average annual precipitation is 8.5 inches (216 mm).
Economy
Bishop is the economic center of Inyo County. The city is home to a variety of businesses, including retail stores, restaurants, and hotels. The city is also home to a number of manufacturing and industrial businesses, including a large aluminum smelter.
The city is also a popular tourist destination, with many visitors coming to the area to enjoy the nearby mountains and lakes. The city is home to a number of outdoor recreation activities, including fishing, camping, hiking, and skiing.
Demographics
As of the 2010 census, Bishop had a population of 3,879. The racial makeup of the city was 75.3% White, 0.7% African American, 1.2% Native American, 0.7% Asian, 0.1% Pacific Islander, 19.2% from other races, and 3.0% from two or more races. Hispanic or Latino of any race were 33.2% of the population.
The median income for a household in the city was $37,917, and the median income for a family was $45,938. The per capita income for the city was $19,945. About 16.2% of families and 20.2% of the population were below the poverty line, including 28.2% of those under age 18 and 8.2% of those age 65 or over.
Common Questions
What is Per Capita Income in West Bishop?
Per Capita income in West Bishop is $45,657.
What is the Median Family Income in West Bishop?
Median Family Income in West Bishop is $119,167.
What is the Median Household income in West Bishop?
Median Household Income in West Bishop is $105,685.
What is Income or Wage Gap in West Bishop?
Income or Wage Gap in West Bishop is 7.3%.
Women in West Bishop earn 92.7 cents for every dollar earned by a man.
What is Inequality or Gini Index in West Bishop?
Inequality or Gini Index in West Bishop is 0.38.
What is the Total Population of West Bishop?
Total Population of West Bishop is 2,430.
What is the Total Male Population of West Bishop?
Total Male Population of West Bishop is 1,358.
What is the Total Female Population of West Bishop?
Total Female Population of West Bishop is 1,072.
What is the Ratio of Males per 100 Females in West Bishop?
There are 126.68 Males per 100 Females in West Bishop.
What is the Ratio of Females per 100 Males in West Bishop?
There are 78.94 Females per 100 Males in West Bishop.
What is the Median Population Age in West Bishop?
Median Population Age in West Bishop is 50.1 Years.
What is the Average Family Size in West Bishop
Average Family Size in West Bishop is 3.4 People.
What is the Average Household Size in West Bishop
Average Household Size in West Bishop is 2.8 People.
How Large is the Labor Force in West Bishop?
There are 1,092 People in the Labor Forcein in West Bishop.
What is the Percentage of People in the Labor Force in West Bishop?
56.5% of People are in the Labor Force in West Bishop.
What is the Unemployment Rate in West Bishop?
Unemployment Rate in West Bishop is 5.3%.