Oak Shores, CA Map & Demographics
Oak Shores Map
Oak Shores Overview
$68,817
PER CAPITA INCOME
$68,292
AVG HOUSEHOLD INCOME
0.55
INEQUALITY / GINI INDEX
159
TOTAL POPULATION
74
MALE POPULATION
85
FEMALE POPULATION
87.06
MALES / 100 FEMALES
114.86
FEMALES / 100 MALES
54.5
MEDIAN AGE
2.3
AVG FAMILY SIZE
1.9
AVG HOUSEHOLD SIZE
90
LABOR FORCE [ PEOPLE ]
64.3%
PERCENT IN LABOR FORCE
Income in Oak Shores
Income Overview in Oak Shores
| Characteristic | Number | Measure |
| Per Capita Income | 159 | $68,817 |
| Median Family Income | 49 | $0 |
| Mean Family Income | 49 | $187,331 |
| Median Household Income | 85 | $68,292 |
| Mean Household Income | 85 | $128,226 |
| Income Deficit | 49 | $0 |
| Wage / Income Gap (%) | 159 | 0.00% |
| Wage / Income Gap ($) | 159 | 100.00¢ per $1 |
| Gini / Inequality Index | 159 | 0.55 |
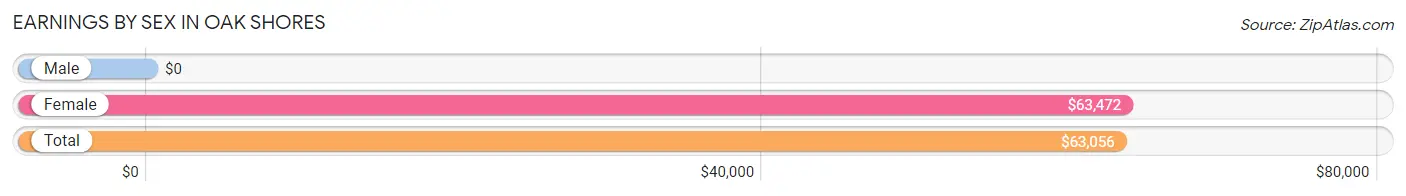
Earnings by Sex in Oak Shores
| Sex | Number | Average Earnings |
| Male | 49 (49.0%) | $0 |
| Female | 51 (51.0%) | $63,472 |
| Total | 100 (100.0%) | $63,056 |
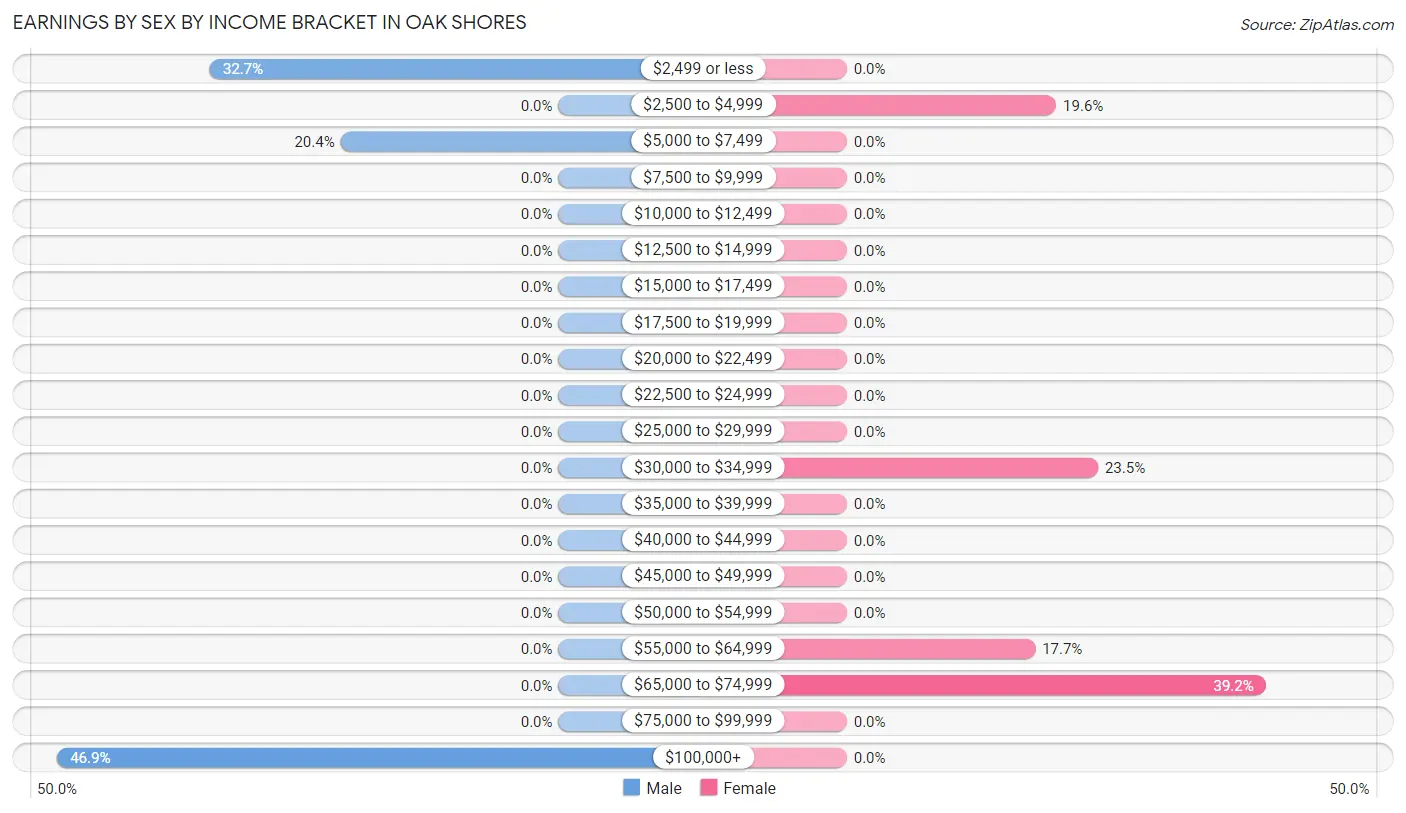
Earnings by Sex by Income Bracket in Oak Shores
The most common earnings brackets in Oak Shores are $100,000+ for men (23 | 46.9%) and $65,000 to $74,999 for women (20 | 39.2%).
| Income | Male | Female |
| $2,499 or less | 16 (32.7%) | 0 (0.0%) |
| $2,500 to $4,999 | 0 (0.0%) | 10 (19.6%) |
| $5,000 to $7,499 | 10 (20.4%) | 0 (0.0%) |
| $7,500 to $9,999 | 0 (0.0%) | 0 (0.0%) |
| $10,000 to $12,499 | 0 (0.0%) | 0 (0.0%) |
| $12,500 to $14,999 | 0 (0.0%) | 0 (0.0%) |
| $15,000 to $17,499 | 0 (0.0%) | 0 (0.0%) |
| $17,500 to $19,999 | 0 (0.0%) | 0 (0.0%) |
| $20,000 to $22,499 | 0 (0.0%) | 0 (0.0%) |
| $22,500 to $24,999 | 0 (0.0%) | 0 (0.0%) |
| $25,000 to $29,999 | 0 (0.0%) | 0 (0.0%) |
| $30,000 to $34,999 | 0 (0.0%) | 12 (23.5%) |
| $35,000 to $39,999 | 0 (0.0%) | 0 (0.0%) |
| $40,000 to $44,999 | 0 (0.0%) | 0 (0.0%) |
| $45,000 to $49,999 | 0 (0.0%) | 0 (0.0%) |
| $50,000 to $54,999 | 0 (0.0%) | 0 (0.0%) |
| $55,000 to $64,999 | 0 (0.0%) | 9 (17.6%) |
| $65,000 to $74,999 | 0 (0.0%) | 20 (39.2%) |
| $75,000 to $99,999 | 0 (0.0%) | 0 (0.0%) |
| $100,000+ | 23 (46.9%) | 0 (0.0%) |
| Total | 49 (100.0%) | 51 (100.0%) |
Earnings by Sex by Educational Attainment in Oak Shores
| Educational Attainment | Male Income | Female Income |
| Less than High School | - | - |
| High School Diploma | - | - |
| College or Associate's Degree | - | - |
| Bachelor's Degree | - | - |
| Graduate Degree | - | - |
| Total | - | - |
Family Income in Oak Shores
Family Income Brackets in Oak Shores
According to the Oak Shores family income data, there are 20 families falling into the $50,000 to $74,999 income range, which is the most common income bracket and makes up 40.8% of all families.
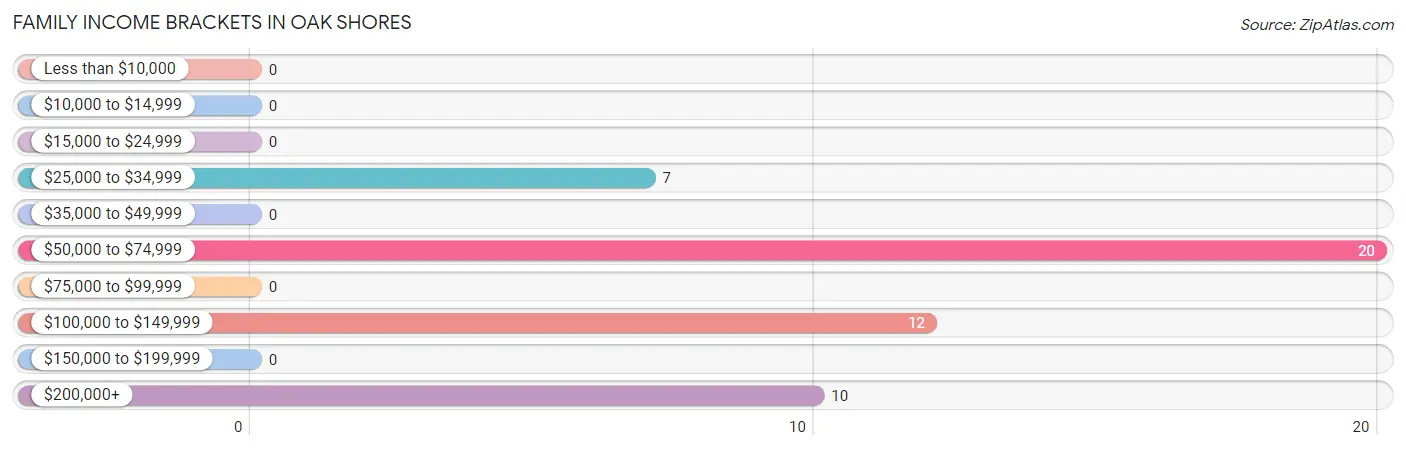
| Income Bracket | # Families | % Families |
| Less than $10,000 | 0 | 0.0% |
| $10,000 to $14,999 | 0 | 0.0% |
| $15,000 to $24,999 | 0 | 0.0% |
| $25,000 to $34,999 | 7 | 14.3% |
| $35,000 to $49,999 | 0 | 0.0% |
| $50,000 to $74,999 | 20 | 40.8% |
| $75,000 to $99,999 | 0 | 0.0% |
| $100,000 to $149,999 | 12 | 24.5% |
| $150,000 to $199,999 | 0 | 0.0% |
| $200,000+ | 10 | 20.4% |
Family Income by Famaliy Size in Oak Shores
| Income Bracket | # Families | Median Income |
| 2-Person Families | 39 (79.6%) | $0 |
| 3-Person Families | 0 (0.0%) | $0 |
| 4-Person Families | 10 (20.4%) | $0 |
| 5-Person Families | 0 (0.0%) | $0 |
| 6-Person Families | 0 (0.0%) | $0 |
| 7+ Person Families | 0 (0.0%) | $0 |
| Total | 49 (100.0%) | $0 |
Family Income by Number of Earners in Oak Shores
| Number of Earners | # Families | Median Income |
| No Earners | 7 (14.3%) | $0 |
| 1 Earner | 0 (0.0%) | $0 |
| 2 Earners | 42 (85.7%) | $0 |
| 3+ Earners | 0 (0.0%) | $0 |
| Total | 49 (100.0%) | $0 |
Household Income in Oak Shores
Household Income Brackets in Oak Shores
With 47 households falling in the category, the $50,000 to $74,999 income range is the most frequent in Oak Shores, accounting for 55.3% of all households.
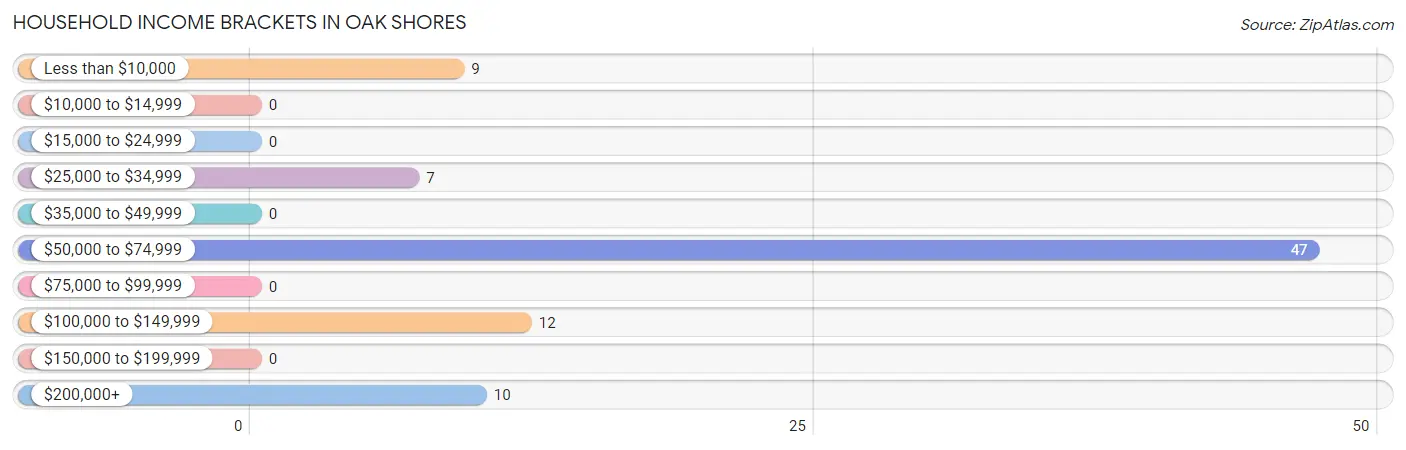
| Income Bracket | # Households | % Households |
| Less than $10,000 | 9 | 10.6% |
| $10,000 to $14,999 | 0 | 0.0% |
| $15,000 to $24,999 | 0 | 0.0% |
| $25,000 to $34,999 | 7 | 8.2% |
| $35,000 to $49,999 | 0 | 0.0% |
| $50,000 to $74,999 | 47 | 55.3% |
| $75,000 to $99,999 | 0 | 0.0% |
| $100,000 to $149,999 | 12 | 14.1% |
| $150,000 to $199,999 | 0 | 0.0% |
| $200,000+ | 10 | 11.8% |
Household Income by Householder Age in Oak Shores
| Income Bracket | # Households | Median Income |
| 15 to 24 Years | 0 (0.0%) | $0 |
| 25 to 44 Years | 20 (23.5%) | $0 |
| 45 to 64 Years | 39 (45.9%) | $0 |
| 65+ Years | 26 (30.6%) | $0 |
| Total | 85 (100.0%) | $68,292 |
Poverty in Oak Shores
Income Below Poverty by Sex and Age in Oak Shores
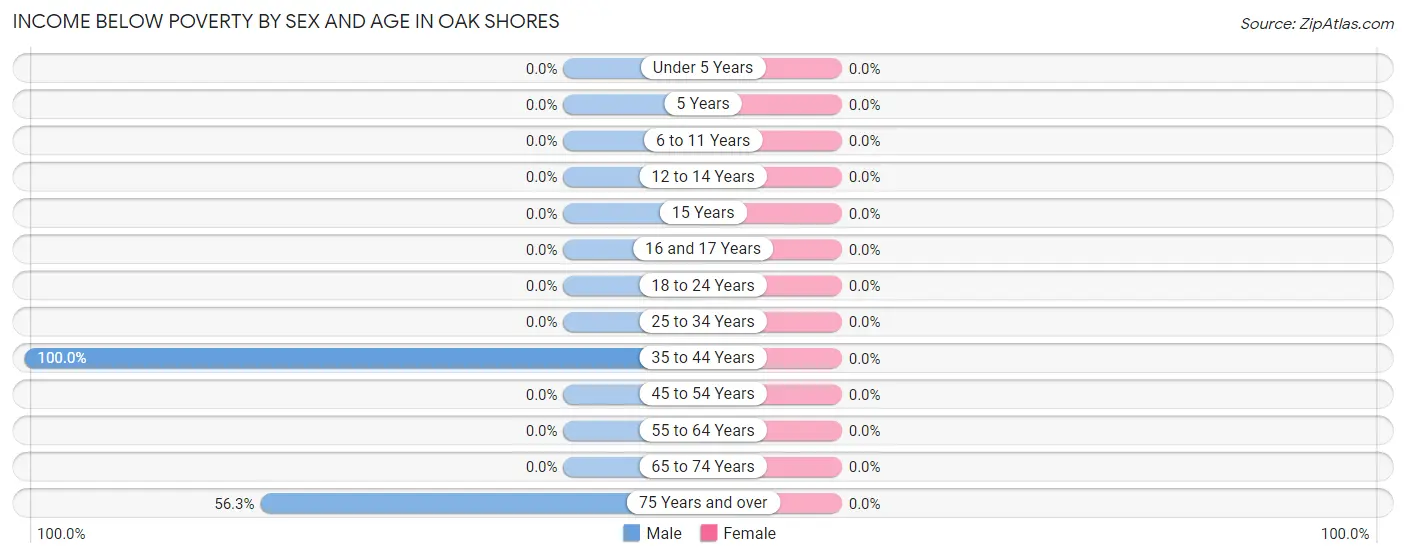
| Age Bracket | Male | Female |
| Under 5 Years | 0 (0.0%) | 0 (0.0%) |
| 5 Years | 0 (0.0%) | 0 (0.0%) |
| 6 to 11 Years | 0 (0.0%) | 0 (0.0%) |
| 12 to 14 Years | 0 (0.0%) | 0 (0.0%) |
| 15 Years | 0 (0.0%) | 0 (0.0%) |
| 16 and 17 Years | 0 (0.0%) | 0 (0.0%) |
| 18 to 24 Years | 0 (0.0%) | 0 (0.0%) |
| 25 to 34 Years | 0 (0.0%) | 0 (0.0%) |
| 35 to 44 Years | 10 (100.0%) | 0 (0.0%) |
| 45 to 54 Years | 0 (0.0%) | 0 (0.0%) |
| 55 to 64 Years | 0 (0.0%) | 0 (0.0%) |
| 65 to 74 Years | 0 (0.0%) | 0 (0.0%) |
| 75 Years and over | 9 (56.2%) | 0 (0.0%) |
| Total | 19 (25.7%) | 0 (0.0%) |
Income Above Poverty by Sex and Age in Oak Shores
According to the poverty statistics in Oak Shores, males aged 12 to 14 years and females aged 6 to 11 years are the age groups that are most secure financially, with 100.0% of males and 100.0% of females in these age groups living above the poverty line.
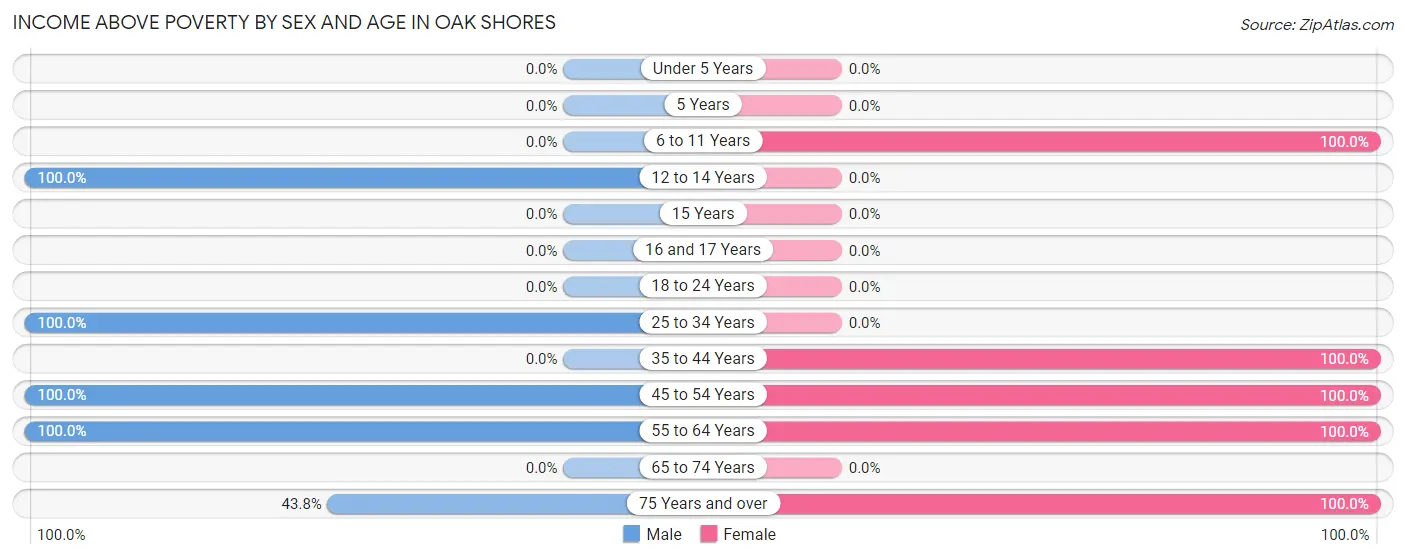
| Age Bracket | Male | Female |
| Under 5 Years | 0 (0.0%) | 0 (0.0%) |
| 5 Years | 0 (0.0%) | 0 (0.0%) |
| 6 to 11 Years | 0 (0.0%) | 10 (100.0%) |
| 12 to 14 Years | 9 (100.0%) | 0 (0.0%) |
| 15 Years | 0 (0.0%) | 0 (0.0%) |
| 16 and 17 Years | 0 (0.0%) | 0 (0.0%) |
| 18 to 24 Years | 0 (0.0%) | 0 (0.0%) |
| 25 to 34 Years | 16 (100.0%) | 0 (0.0%) |
| 35 to 44 Years | 0 (0.0%) | 19 (100.0%) |
| 45 to 54 Years | 10 (100.0%) | 12 (100.0%) |
| 55 to 64 Years | 13 (100.0%) | 27 (100.0%) |
| 65 to 74 Years | 0 (0.0%) | 0 (0.0%) |
| 75 Years and over | 7 (43.8%) | 17 (100.0%) |
| Total | 55 (74.3%) | 85 (100.0%) |
Income Below Poverty Among Married-Couple Families in Oak Shores
| Children | Above Poverty | Below Poverty |
| No Children | 19 (100.0%) | 0 (0.0%) |
| 1 or 2 Children | 10 (100.0%) | 0 (0.0%) |
| 3 or 4 Children | 0 (0.0%) | 0 (0.0%) |
| 5 or more Children | 0 (0.0%) | 0 (0.0%) |
| Total | 29 (100.0%) | 0 (0.0%) |
Income Below Poverty Among Single-Parent Households in Oak Shores
| Children | Single Father | Single Mother |
| No Children | 0 (0.0%) | 0 (0.0%) |
| 1 or 2 Children | 0 (0.0%) | 0 (0.0%) |
| 3 or 4 Children | 0 (0.0%) | 0 (0.0%) |
| 5 or more Children | 0 (0.0%) | 0 (0.0%) |
| Total | 0 (0.0%) | 0 (0.0%) |
Income Below Poverty Among Married-Couple vs Single-Parent Households in Oak Shores
| Children | Married-Couple Families | Single-Parent Households |
| No Children | 0 (0.0%) | 0 (0.0%) |
| 1 or 2 Children | 0 (0.0%) | 0 (0.0%) |
| 3 or 4 Children | 0 (0.0%) | 0 (0.0%) |
| 5 or more Children | 0 (0.0%) | 0 (0.0%) |
| Total | 0 (0.0%) | 0 (0.0%) |
Race in Oak Shores
The most populous races in Oak Shores are , and White / Caucasian (159 | 100.0%).
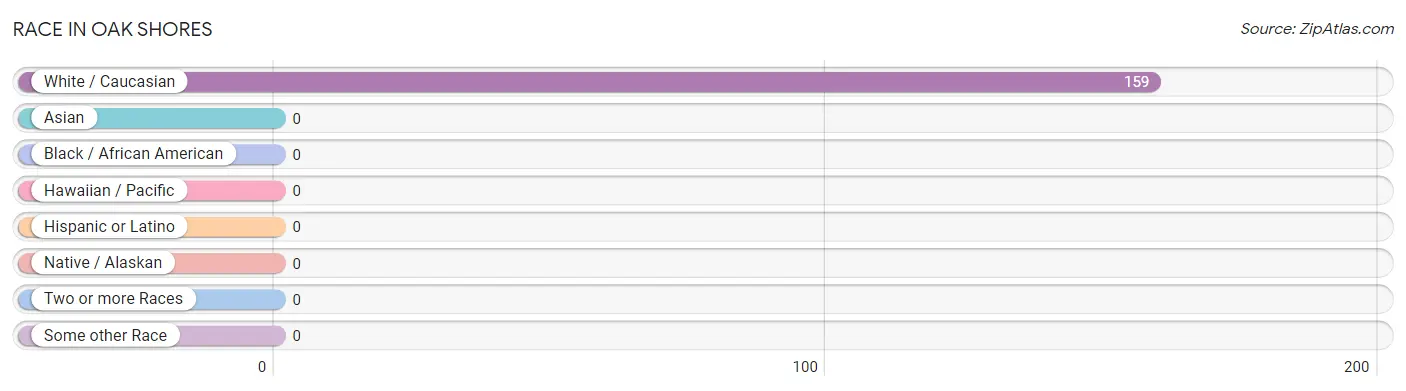
| Race | # Population | % Population |
| Asian | 0 | 0.0% |
| Black / African American | 0 | 0.0% |
| Hawaiian / Pacific | 0 | 0.0% |
| Hispanic or Latino | 0 | 0.0% |
| Native / Alaskan | 0 | 0.0% |
| White / Caucasian | 159 | 100.0% |
| Two or more Races | 0 | 0.0% |
| Some other Race | 0 | 0.0% |
| Total | 159 | 100.0% |
Ancestry in Oak Shores
The most populous ancestries reported in Oak Shores are English (52 | 32.7%), German (19 | 11.9%), American (7 | 4.4%), and Scottish (7 | 4.4%), together accounting for 53.4% of all Oak Shores residents.
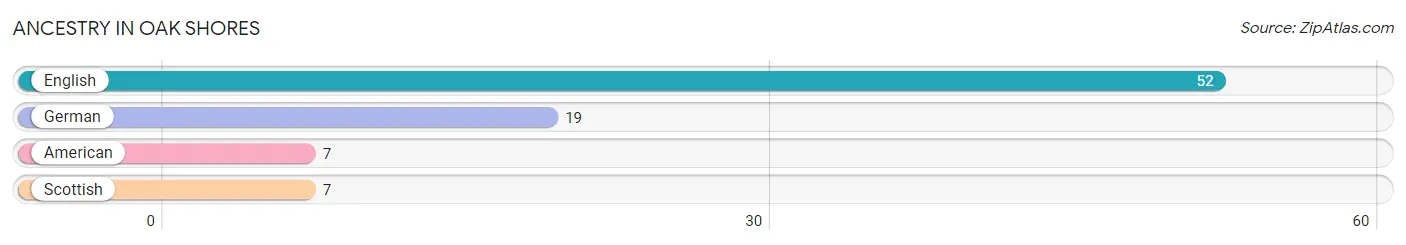
| Ancestry | # Population | % Population |
| American | 7 | 4.4% |
| English | 52 | 32.7% |
| German | 19 | 11.9% |
| Scottish | 7 | 4.4% | View All 4 Rows |
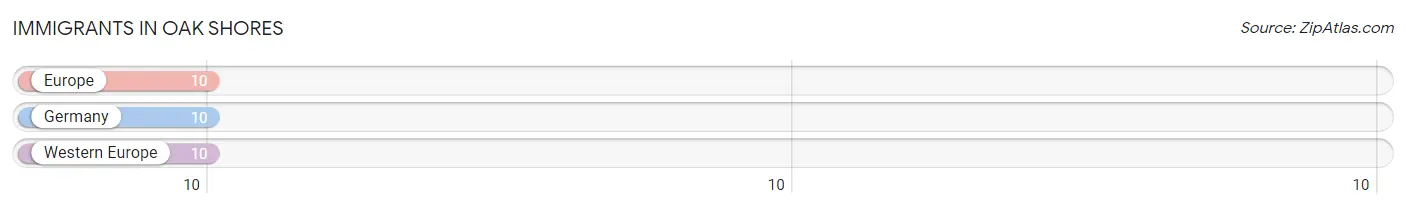
Immigrants in Oak Shores
The most numerous immigrant groups reported in Oak Shores came from Europe (10 | 6.3%), Germany (10 | 6.3%), and Western Europe (10 | 6.3%), together accounting for 18.9% of all Oak Shores residents.
| Immigration Origin | # Population | % Population |
| Europe | 10 | 6.3% |
| Germany | 10 | 6.3% |
| Western Europe | 10 | 6.3% | View All 3 Rows |
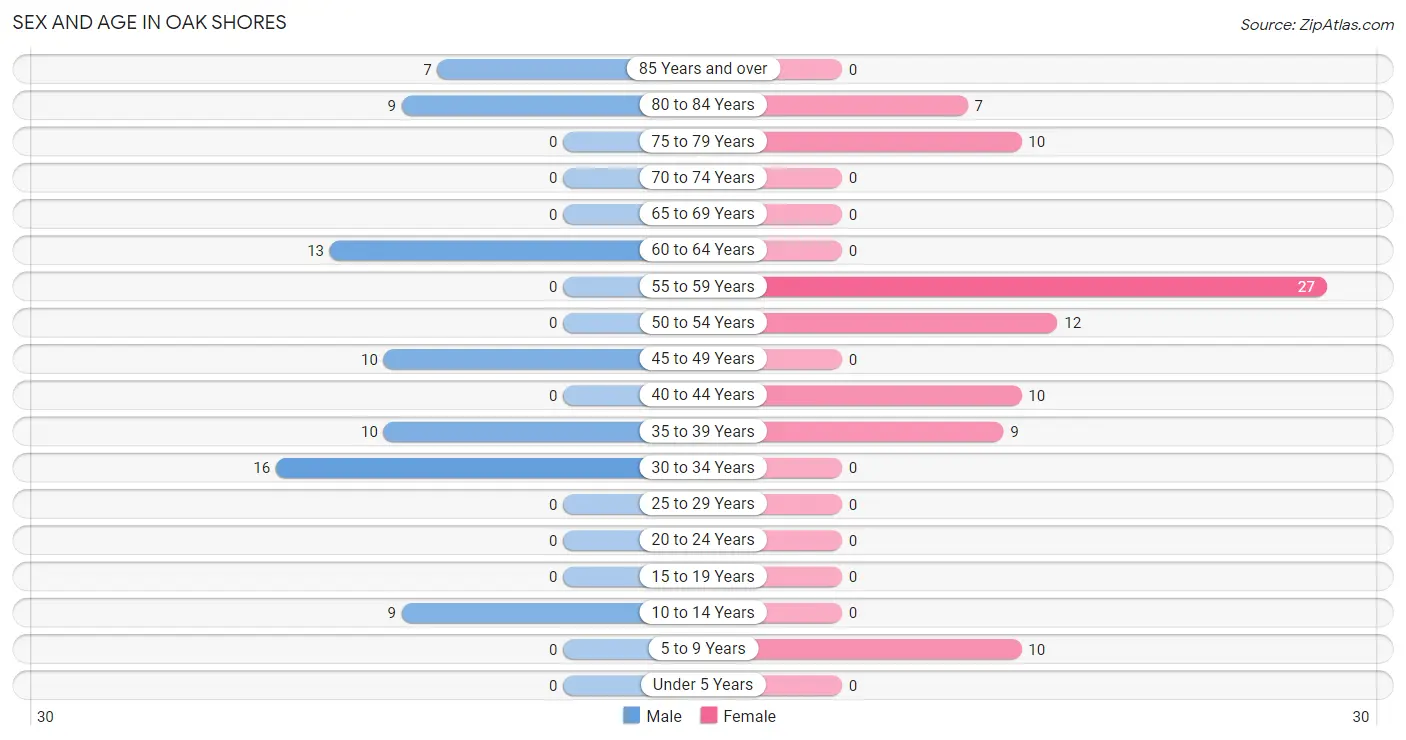
Sex and Age in Oak Shores
Sex and Age in Oak Shores
The most populous age groups in Oak Shores are 30 to 34 Years (16 | 21.6%) for men and 55 to 59 Years (27 | 31.8%) for women.
| Age Bracket | Male | Female |
| Under 5 Years | 0 (0.0%) | 0 (0.0%) |
| 5 to 9 Years | 0 (0.0%) | 10 (11.8%) |
| 10 to 14 Years | 9 (12.2%) | 0 (0.0%) |
| 15 to 19 Years | 0 (0.0%) | 0 (0.0%) |
| 20 to 24 Years | 0 (0.0%) | 0 (0.0%) |
| 25 to 29 Years | 0 (0.0%) | 0 (0.0%) |
| 30 to 34 Years | 16 (21.6%) | 0 (0.0%) |
| 35 to 39 Years | 10 (13.5%) | 9 (10.6%) |
| 40 to 44 Years | 0 (0.0%) | 10 (11.8%) |
| 45 to 49 Years | 10 (13.5%) | 0 (0.0%) |
| 50 to 54 Years | 0 (0.0%) | 12 (14.1%) |
| 55 to 59 Years | 0 (0.0%) | 27 (31.8%) |
| 60 to 64 Years | 13 (17.6%) | 0 (0.0%) |
| 65 to 69 Years | 0 (0.0%) | 0 (0.0%) |
| 70 to 74 Years | 0 (0.0%) | 0 (0.0%) |
| 75 to 79 Years | 0 (0.0%) | 10 (11.8%) |
| 80 to 84 Years | 9 (12.2%) | 7 (8.2%) |
| 85 Years and over | 7 (9.5%) | 0 (0.0%) |
| Total | 74 (100.0%) | 85 (100.0%) |
Families and Households in Oak Shores
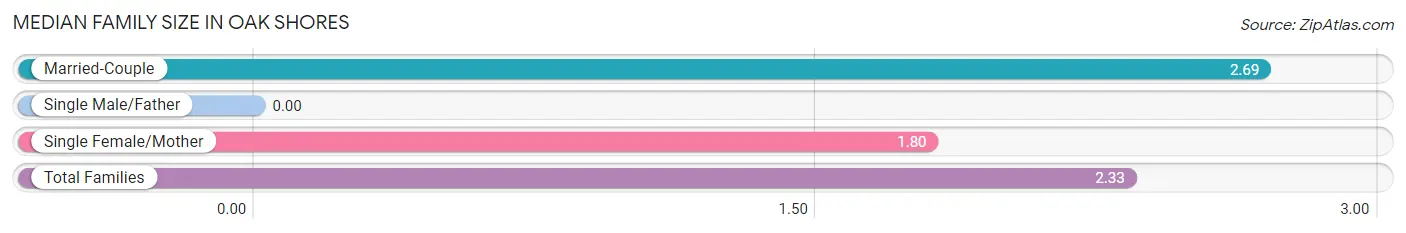
Median Family Size in Oak Shores
| Family Type | # Families | Family Size |
| Married-Couple | 29 (59.2%) | 2.69 |
| Single Male/Father | 0 (0.0%) | - |
| Single Female/Mother | 20 (40.8%) | 1.80 |
| Total Families | 49 (100.0%) | 2.33 |
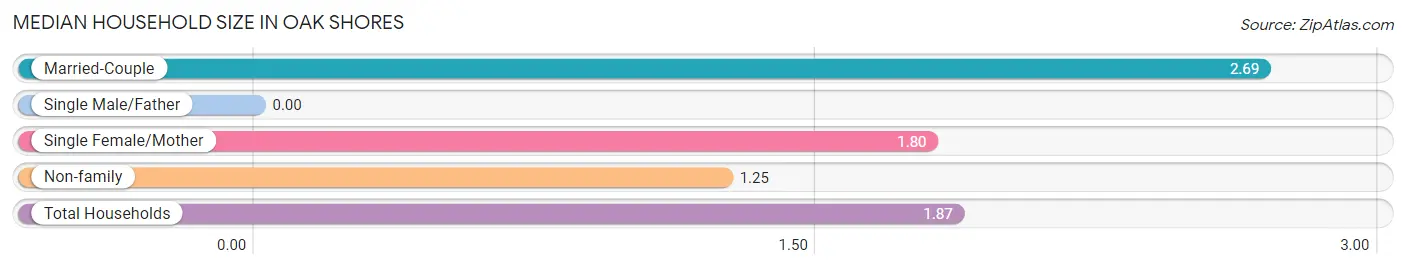
Median Household Size in Oak Shores
| Household Type | # Households | Household Size |
| Married-Couple | 29 (34.1%) | 2.69 |
| Single Male/Father | 0 (0.0%) | - |
| Single Female/Mother | 20 (23.5%) | 1.80 |
| Non-family | 36 (42.3%) | 1.25 |
| Total Households | 85 (100.0%) | 1.87 |
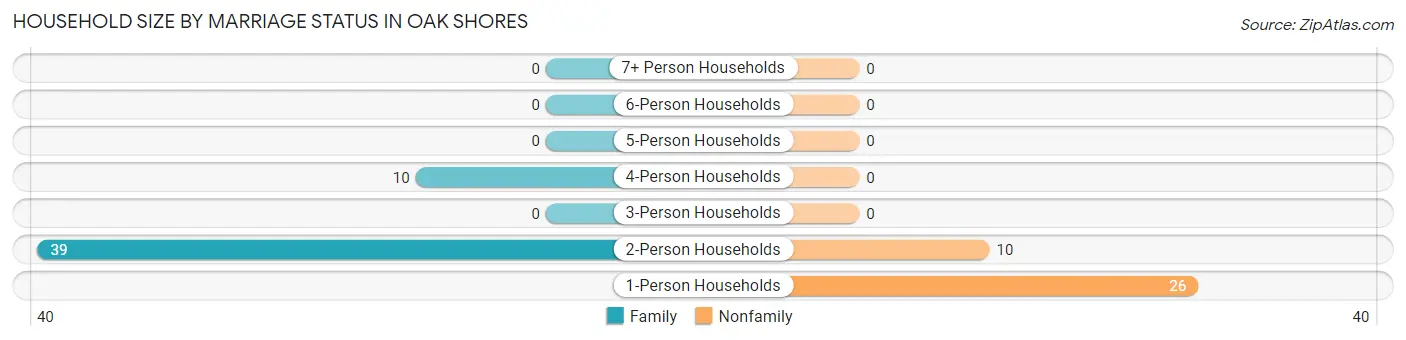
Household Size by Marriage Status in Oak Shores
Out of a total of 85 households in Oak Shores, 49 (57.7%) are family households, while 36 (42.3%) are nonfamily households. The most numerous type of family households are 2-person households, comprising 39, and the most common type of nonfamily households are 1-person households, comprising 26.
| Household Size | Family Households | Nonfamily Households |
| 1-Person Households | - | 26 (30.6%) |
| 2-Person Households | 39 (45.9%) | 10 (11.8%) |
| 3-Person Households | 0 (0.0%) | 0 (0.0%) |
| 4-Person Households | 10 (11.8%) | 0 (0.0%) |
| 5-Person Households | 0 (0.0%) | 0 (0.0%) |
| 6-Person Households | 0 (0.0%) | 0 (0.0%) |
| 7+ Person Households | 0 (0.0%) | 0 (0.0%) |
| Total | 49 (57.7%) | 36 (42.3%) |
Female Fertility in Oak Shores
Fertility by Age in Oak Shores
| Age Bracket | Women with Births | Births / 1,000 Women |
| 15 to 19 years | 0 (0.0%) | 0.0 |
| 20 to 34 years | 0 (0.0%) | 0.0 |
| 35 to 50 years | 0 (0.0%) | 0.0 |
| Total | 0 (0.0%) | 0.0 |
Fertility by Age by Marriage Status in Oak Shores
| Age Bracket | Married | Unmarried |
| 15 to 19 years | 0 (0.0%) | 0 (0.0%) |
| 20 to 34 years | 0 (0.0%) | 0 (0.0%) |
| 35 to 50 years | 0 (0.0%) | 0 (0.0%) |
| Total | 0 (0.0%) | 0 (0.0%) |
Fertility by Education in Oak Shores
| Educational Attainment | Women with Births | Births / 1,000 Women |
| Less than High School | 0 (0.0%) | 0.0 |
| High School Diploma | 0 (0.0%) | 0.0 |
| College or Associate's Degree | 0 (0.0%) | 0.0 |
| Bachelor's Degree | 0 (0.0%) | 0.0 |
| Graduate Degree | 0 (0.0%) | 0.0 |
| Total | 0 (0.0%) | 0.0 |
Fertility by Education by Marriage Status in Oak Shores
| Educational Attainment | Married | Unmarried |
| Less than High School | 0 (0.0%) | 0 (0.0%) |
| High School Diploma | 0 (0.0%) | 0 (0.0%) |
| College or Associate's Degree | 0 (0.0%) | 0 (0.0%) |
| Bachelor's Degree | 0 (0.0%) | 0 (0.0%) |
| Graduate Degree | 0 (0.0%) | 0 (0.0%) |
| Total | 0 (0.0%) | 0 (0.0%) |
Employment Characteristics in Oak Shores
Employment by Class of Employer in Oak Shores
Among the 90 employed individuals in Oak Shores, private company employees (61 | 67.8%), not-for-profit organizations (20 | 22.2%), and local government employees (9 | 10.0%) make up the most common classes of employment.
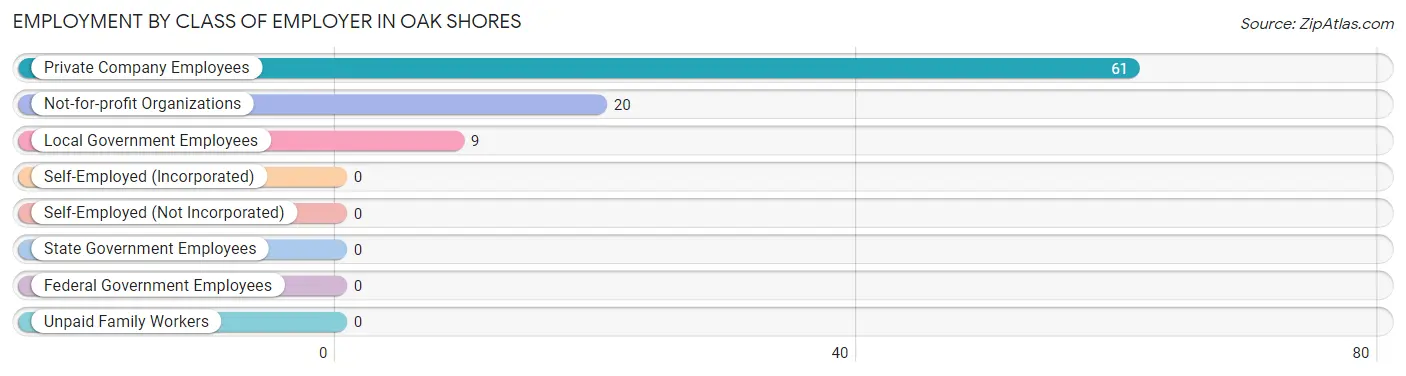
| Employer Class | # Employees | % Employees |
| Private Company Employees | 61 | 67.8% |
| Self-Employed (Incorporated) | 0 | 0.0% |
| Self-Employed (Not Incorporated) | 0 | 0.0% |
| Not-for-profit Organizations | 20 | 22.2% |
| Local Government Employees | 9 | 10.0% |
| State Government Employees | 0 | 0.0% |
| Federal Government Employees | 0 | 0.0% |
| Unpaid Family Workers | 0 | 0.0% |
| Total | 90 | 100.0% |
Employment Status by Age in Oak Shores
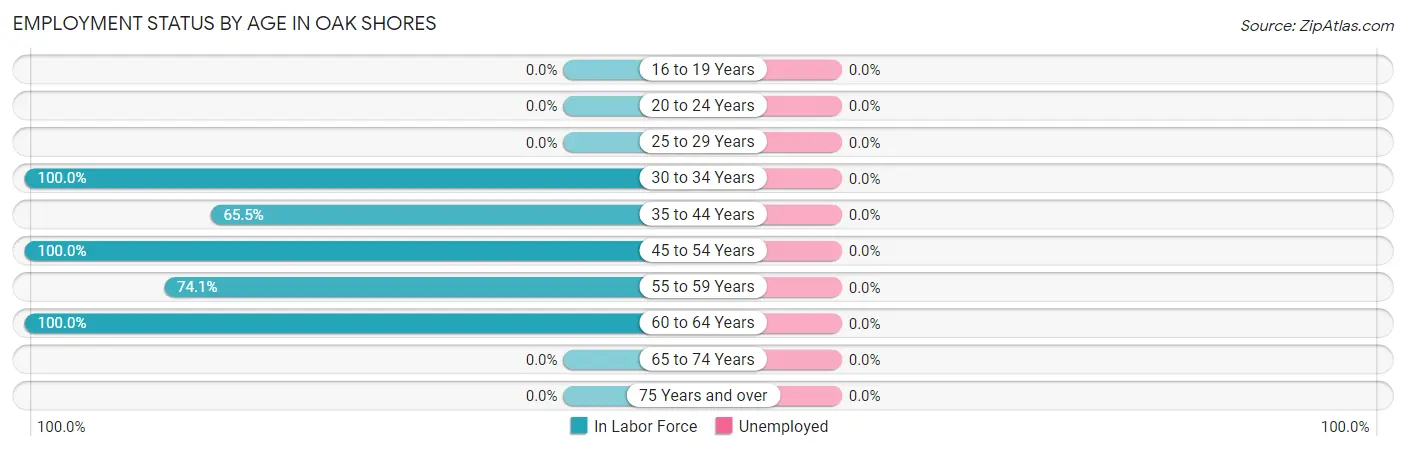
| Age Bracket | In Labor Force | Unemployed |
| 16 to 19 Years | 0 (0.0%) | 0 (0.0%) |
| 20 to 24 Years | 0 (0.0%) | 0 (0.0%) |
| 25 to 29 Years | 0 (0.0%) | 0 (0.0%) |
| 30 to 34 Years | 16 (100.0%) | 0 (0.0%) |
| 35 to 44 Years | 19 (65.5%) | 0 (0.0%) |
| 45 to 54 Years | 22 (100.0%) | 0 (0.0%) |
| 55 to 59 Years | 20 (74.1%) | 0 (0.0%) |
| 60 to 64 Years | 13 (100.0%) | 0 (0.0%) |
| 65 to 74 Years | 0 (0.0%) | 0 (0.0%) |
| 75 Years and over | 0 (0.0%) | 0 (0.0%) |
| Total | 90 (64.3%) | 0 (0.0%) |
Employment Status by Educational Attainment in Oak Shores
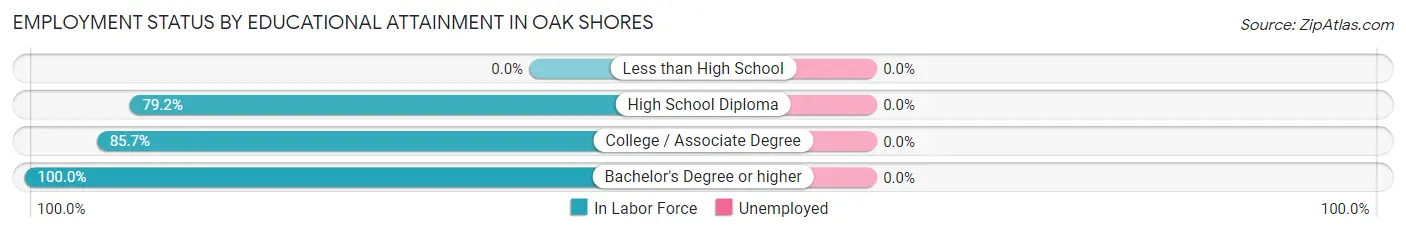
| Educational Attainment | In Labor Force | Unemployed |
| Less than High School | 0 (0.0%) | 0 (0.0%) |
| High School Diploma | 38 (79.2%) | 0 (0.0%) |
| College / Associate Degree | 42 (85.7%) | 0 (0.0%) |
| Bachelor's Degree or higher | 10 (100.0%) | 0 (0.0%) |
| Total | 90 (84.1%) | 0 (0.0%) |
Employment Occupations by Sex in Oak Shores
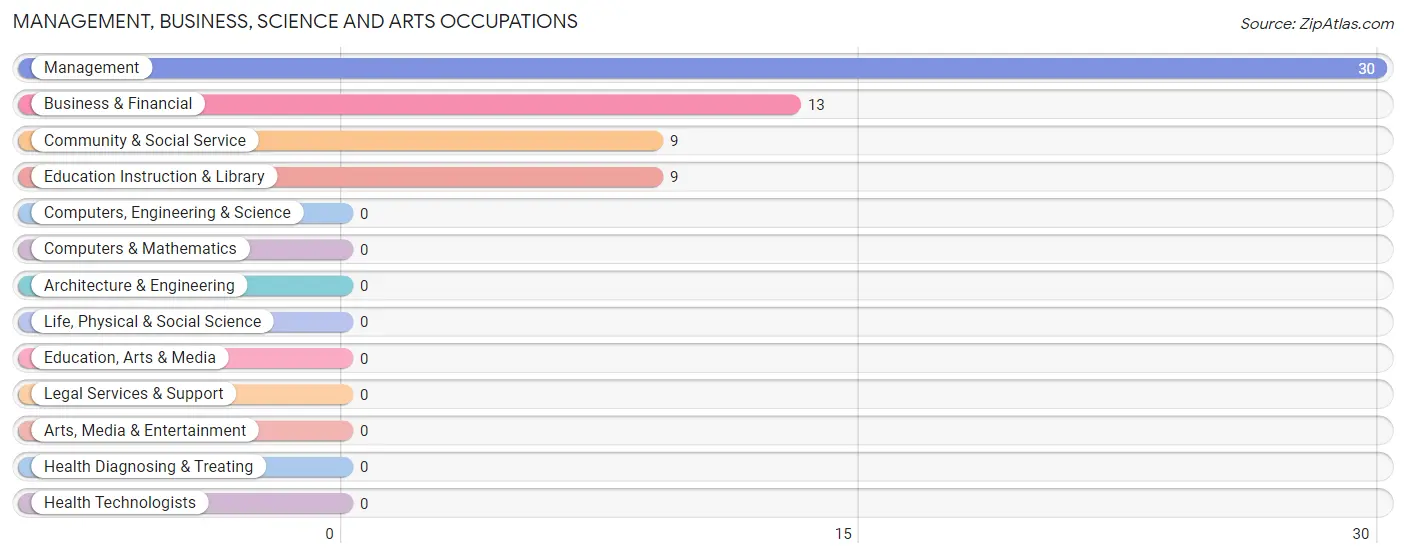
Management, Business, Science and Arts Occupations
The most common Management, Business, Science and Arts occupations in Oak Shores are Management (30 | 33.3%), Business & Financial (13 | 14.4%), Community & Social Service (9 | 10.0%), and Education Instruction & Library (9 | 10.0%).
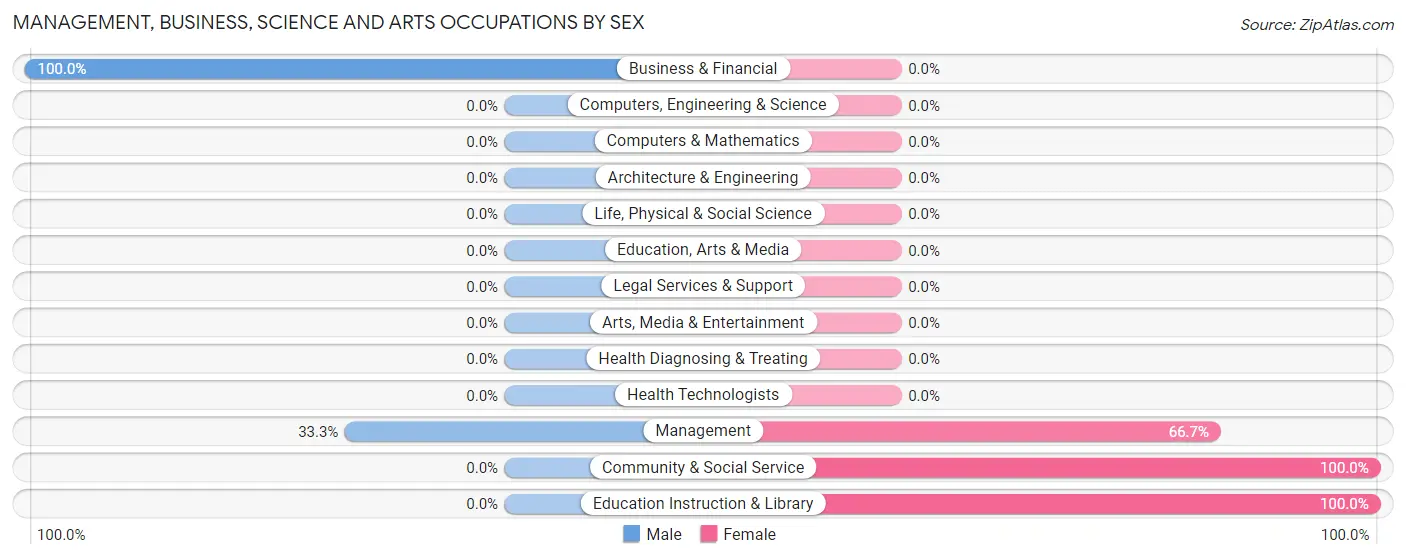
Management, Business, Science and Arts Occupations by Sex
Within the Management, Business, Science and Arts occupations in Oak Shores, the most male-oriented occupations are Business & Financial (100.0%), and Management (33.3%), while the most female-oriented occupations are Community & Social Service (100.0%), Education Instruction & Library (100.0%), and Management (66.7%).
| Occupation | Male | Female |
| Management | 10 (33.3%) | 20 (66.7%) |
| Business & Financial | 13 (100.0%) | 0 (0.0%) |
| Computers, Engineering & Science | 0 (0.0%) | 0 (0.0%) |
| Computers & Mathematics | 0 (0.0%) | 0 (0.0%) |
| Architecture & Engineering | 0 (0.0%) | 0 (0.0%) |
| Life, Physical & Social Science | 0 (0.0%) | 0 (0.0%) |
| Community & Social Service | 0 (0.0%) | 9 (100.0%) |
| Education, Arts & Media | 0 (0.0%) | 0 (0.0%) |
| Legal Services & Support | 0 (0.0%) | 0 (0.0%) |
| Education Instruction & Library | 0 (0.0%) | 9 (100.0%) |
| Arts, Media & Entertainment | 0 (0.0%) | 0 (0.0%) |
| Health Diagnosing & Treating | 0 (0.0%) | 0 (0.0%) |
| Health Technologists | 0 (0.0%) | 0 (0.0%) |
| Total (Category) | 23 (44.2%) | 29 (55.8%) |
| Total (Overall) | 39 (43.3%) | 51 (56.7%) |
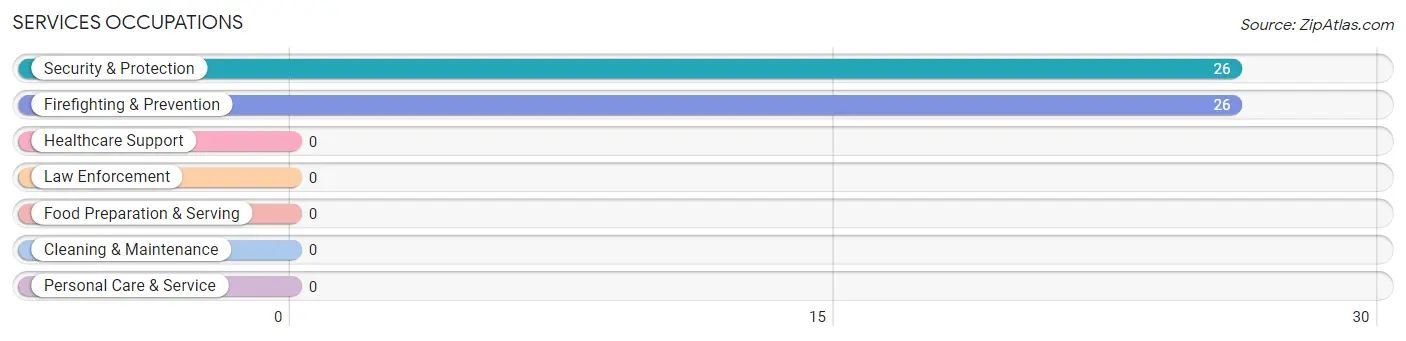
Services Occupations
The most common Services occupations in Oak Shores are Security & Protection (26 | 28.9%), and Firefighting & Prevention (26 | 28.9%).
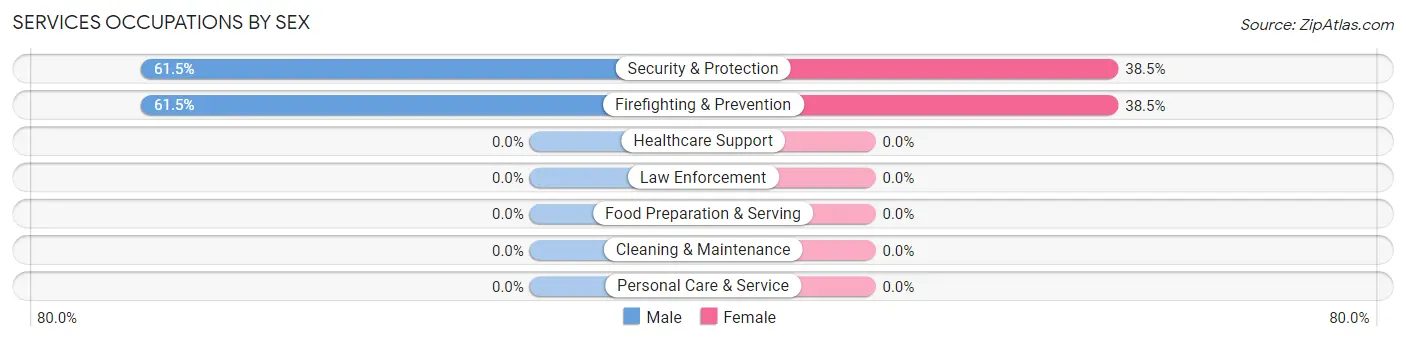
Services Occupations by Sex
Within the Services occupations in Oak Shores, the most male-oriented occupations are Security & Protection (61.5%), and Firefighting & Prevention (61.5%), while the most female-oriented occupations are Security & Protection (38.5%), and Firefighting & Prevention (38.5%).
| Occupation | Male | Female |
| Healthcare Support | 0 (0.0%) | 0 (0.0%) |
| Security & Protection | 16 (61.5%) | 10 (38.5%) |
| Firefighting & Prevention | 16 (61.5%) | 10 (38.5%) |
| Law Enforcement | 0 (0.0%) | 0 (0.0%) |
| Food Preparation & Serving | 0 (0.0%) | 0 (0.0%) |
| Cleaning & Maintenance | 0 (0.0%) | 0 (0.0%) |
| Personal Care & Service | 0 (0.0%) | 0 (0.0%) |
| Total (Category) | 16 (61.5%) | 10 (38.5%) |
| Total (Overall) | 39 (43.3%) | 51 (56.7%) |
Sales and Office Occupations
The most common Sales and Office occupations in Oak Shores are , and Office & Administration (12 | 13.3%).
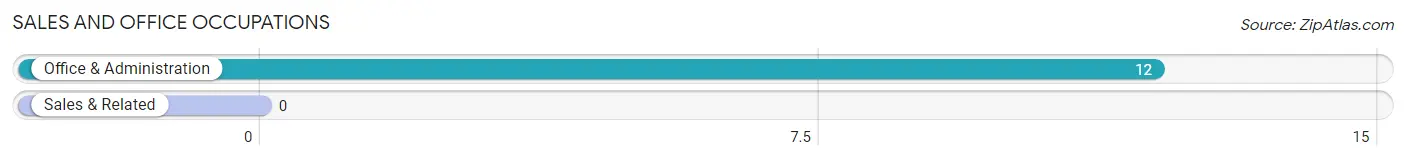
Sales and Office Occupations by Sex
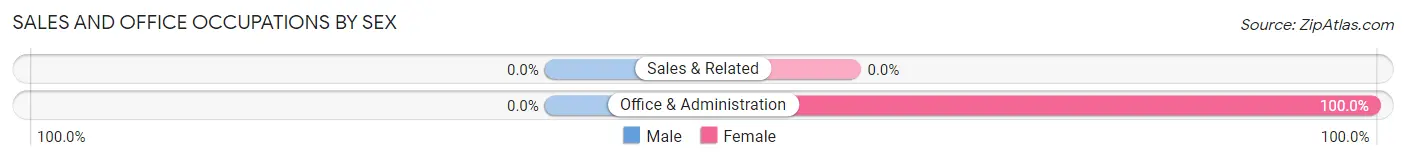
| Occupation | Male | Female |
| Sales & Related | 0 (0.0%) | 0 (0.0%) |
| Office & Administration | 0 (0.0%) | 12 (100.0%) |
| Total (Category) | 0 (0.0%) | 12 (100.0%) |
| Total (Overall) | 39 (43.3%) | 51 (56.7%) |
Natural Resources, Construction and Maintenance Occupations
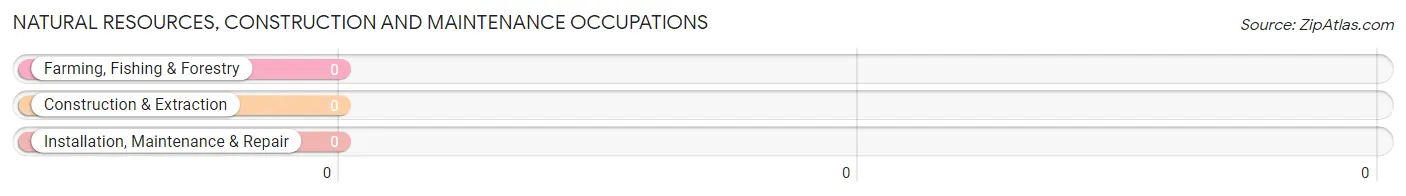
Natural Resources, Construction and Maintenance Occupations by Sex
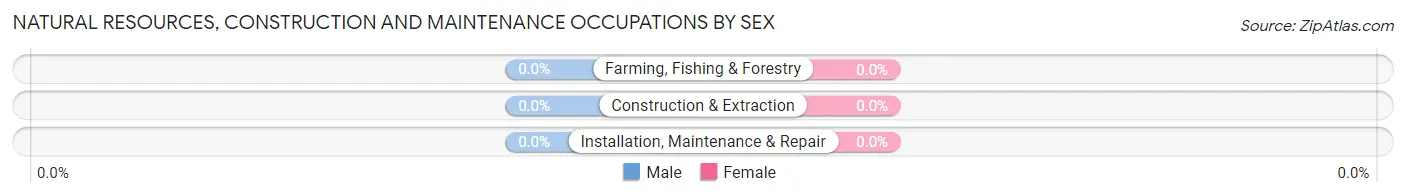
| Occupation | Male | Female |
| Farming, Fishing & Forestry | 0 (0.0%) | 0 (0.0%) |
| Construction & Extraction | 0 (0.0%) | 0 (0.0%) |
| Installation, Maintenance & Repair | 0 (0.0%) | 0 (0.0%) |
| Total (Category) | 0 (0.0%) | 0 (0.0%) |
| Total (Overall) | 39 (43.3%) | 51 (56.7%) |
Production, Transportation and Moving Occupations
Production, Transportation and Moving Occupations by Sex
| Occupation | Male | Female |
| Production | 0 (0.0%) | 0 (0.0%) |
| Transportation | 0 (0.0%) | 0 (0.0%) |
| Material Moving | 0 (0.0%) | 0 (0.0%) |
| Total (Category) | 0 (0.0%) | 0 (0.0%) |
| Total (Overall) | 39 (43.3%) | 51 (56.7%) |
Employment Industries by Sex in Oak Shores
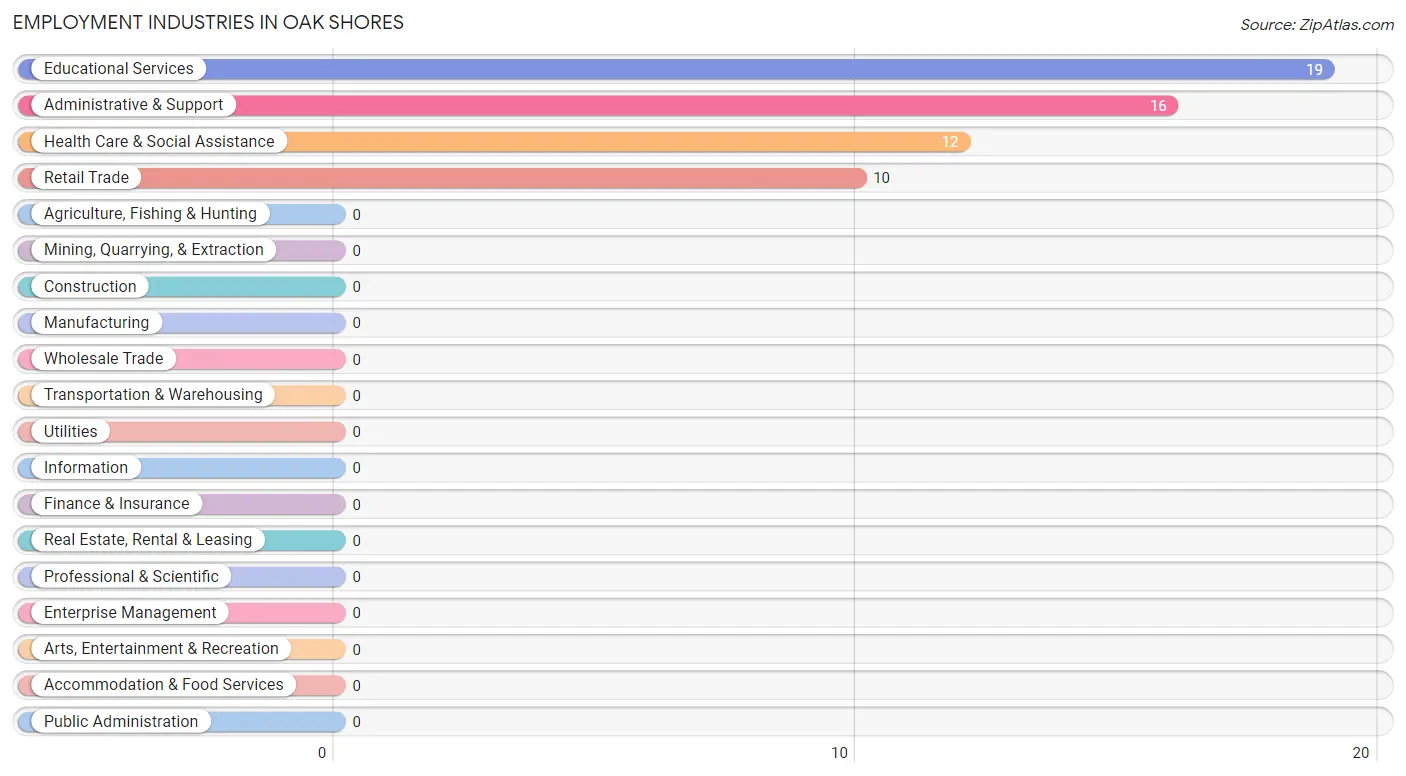
Employment Industries in Oak Shores
The major employment industries in Oak Shores include Educational Services (19 | 21.1%), Administrative & Support (16 | 17.8%), Health Care & Social Assistance (12 | 13.3%), and Retail Trade (10 | 11.1%).
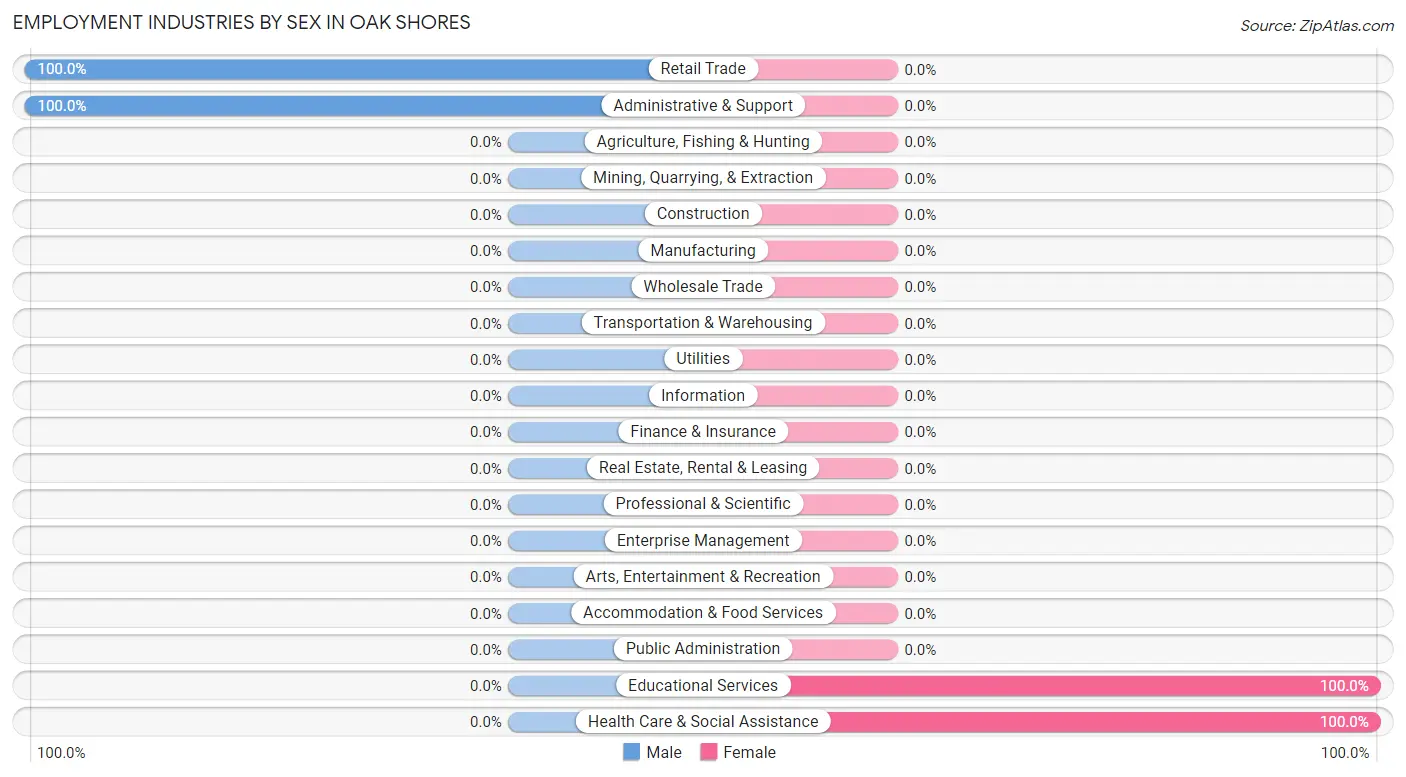
Employment Industries by Sex in Oak Shores
The Oak Shores industries that see more men than women are Retail Trade (100.0%), and Administrative & Support (100.0%), whereas the industries that tend to have a higher number of women are Educational Services (100.0%), and Health Care & Social Assistance (100.0%).
| Industry | Male | Female |
| Agriculture, Fishing & Hunting | 0 (0.0%) | 0 (0.0%) |
| Mining, Quarrying, & Extraction | 0 (0.0%) | 0 (0.0%) |
| Construction | 0 (0.0%) | 0 (0.0%) |
| Manufacturing | 0 (0.0%) | 0 (0.0%) |
| Wholesale Trade | 0 (0.0%) | 0 (0.0%) |
| Retail Trade | 10 (100.0%) | 0 (0.0%) |
| Transportation & Warehousing | 0 (0.0%) | 0 (0.0%) |
| Utilities | 0 (0.0%) | 0 (0.0%) |
| Information | 0 (0.0%) | 0 (0.0%) |
| Finance & Insurance | 0 (0.0%) | 0 (0.0%) |
| Real Estate, Rental & Leasing | 0 (0.0%) | 0 (0.0%) |
| Professional & Scientific | 0 (0.0%) | 0 (0.0%) |
| Enterprise Management | 0 (0.0%) | 0 (0.0%) |
| Administrative & Support | 16 (100.0%) | 0 (0.0%) |
| Educational Services | 0 (0.0%) | 19 (100.0%) |
| Health Care & Social Assistance | 0 (0.0%) | 12 (100.0%) |
| Arts, Entertainment & Recreation | 0 (0.0%) | 0 (0.0%) |
| Accommodation & Food Services | 0 (0.0%) | 0 (0.0%) |
| Public Administration | 0 (0.0%) | 0 (0.0%) |
| Total | 39 (43.3%) | 51 (56.7%) |
Education in Oak Shores
School Enrollment in Oak Shores
The most common levels of schooling among the 28 students in Oak Shores are elementary school (10 | 35.7%), middle school (9 | 32.1%), and high school (9 | 32.1%).
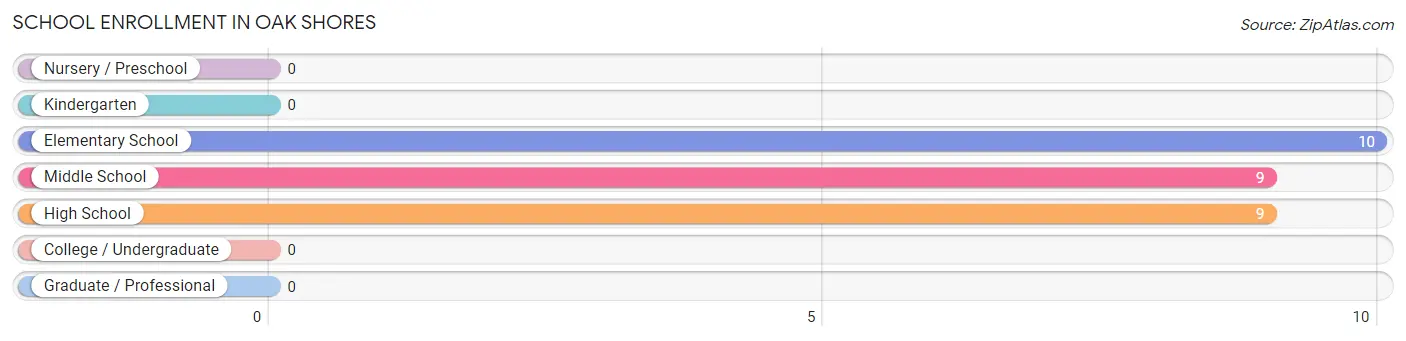
| School Level | # Students | % Students |
| Nursery / Preschool | 0 | 0.0% |
| Kindergarten | 0 | 0.0% |
| Elementary School | 10 | 35.7% |
| Middle School | 9 | 32.1% |
| High School | 9 | 32.1% |
| College / Undergraduate | 0 | 0.0% |
| Graduate / Professional | 0 | 0.0% |
| Total | 28 | 100.0% |
School Enrollment by Age by Funding Source in Oak Shores
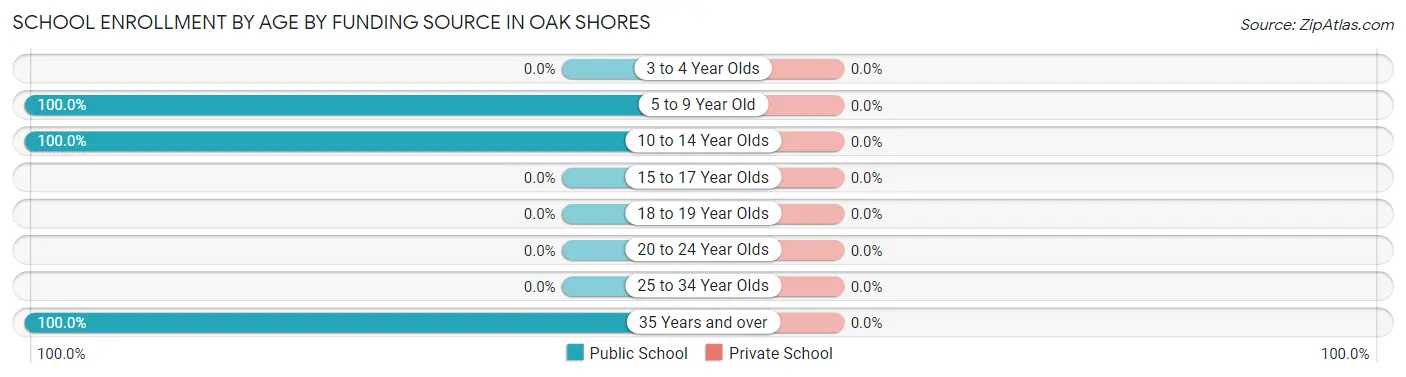
| Age Bracket | Public School | Private School |
| 3 to 4 Year Olds | 0 (0.0%) | 0 (0.0%) |
| 5 to 9 Year Old | 10 (100.0%) | 0 (0.0%) |
| 10 to 14 Year Olds | 9 (100.0%) | 0 (0.0%) |
| 15 to 17 Year Olds | 0 (0.0%) | 0 (0.0%) |
| 18 to 19 Year Olds | 0 (0.0%) | 0 (0.0%) |
| 20 to 24 Year Olds | 0 (0.0%) | 0 (0.0%) |
| 25 to 34 Year Olds | 0 (0.0%) | 0 (0.0%) |
| 35 Years and over | 9 (100.0%) | 0 (0.0%) |
| Total | 28 (100.0%) | 0 (0.0%) |
Educational Attainment by Field of Study in Oak Shores
, and business (10 | 100.0%) are the most common fields of study among 10 individuals in Oak Shores who have obtained a bachelor's degree or higher.
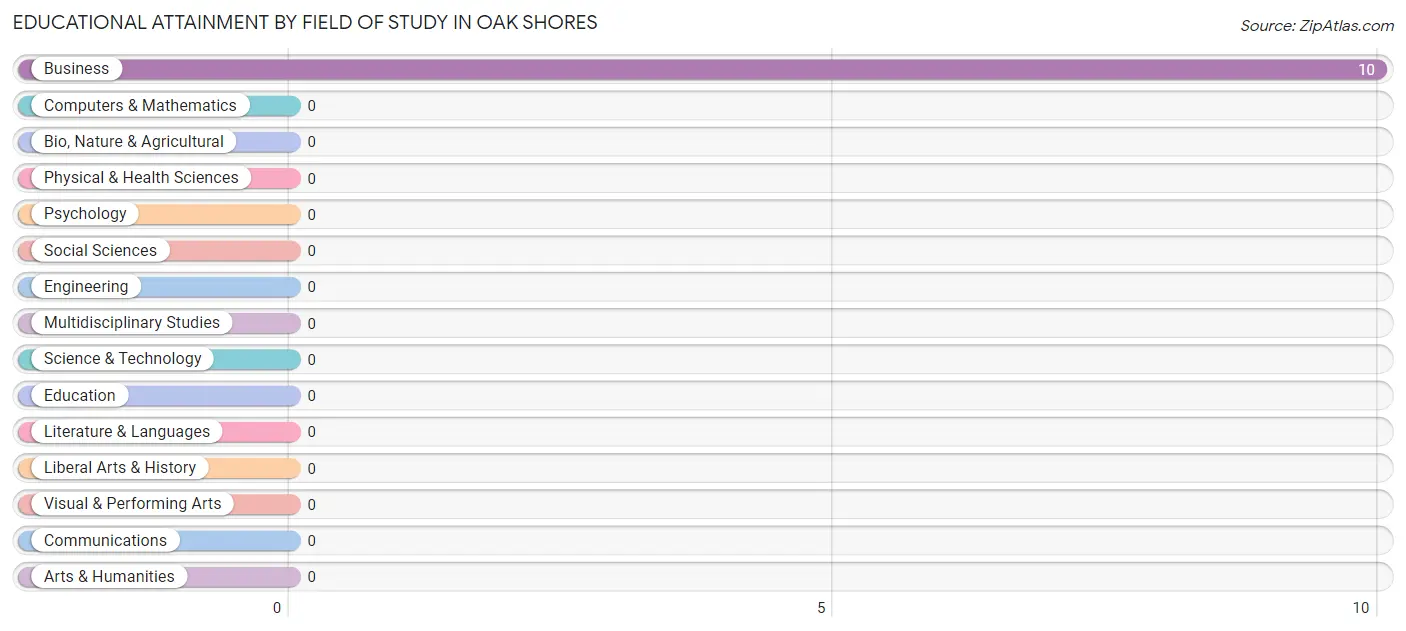
| Field of Study | # Graduates | % Graduates |
| Computers & Mathematics | 0 | 0.0% |
| Bio, Nature & Agricultural | 0 | 0.0% |
| Physical & Health Sciences | 0 | 0.0% |
| Psychology | 0 | 0.0% |
| Social Sciences | 0 | 0.0% |
| Engineering | 0 | 0.0% |
| Multidisciplinary Studies | 0 | 0.0% |
| Science & Technology | 0 | 0.0% |
| Business | 10 | 100.0% |
| Education | 0 | 0.0% |
| Literature & Languages | 0 | 0.0% |
| Liberal Arts & History | 0 | 0.0% |
| Visual & Performing Arts | 0 | 0.0% |
| Communications | 0 | 0.0% |
| Arts & Humanities | 0 | 0.0% |
| Total | 10 | 100.0% |
Transportation & Commute in Oak Shores
Vehicle Availability by Sex in Oak Shores
The most prevalent vehicle ownership categories in Oak Shores are males with 2 vehicles (16, accounting for 41.0%) and females with 2 vehicles (29, making up 31.4%).
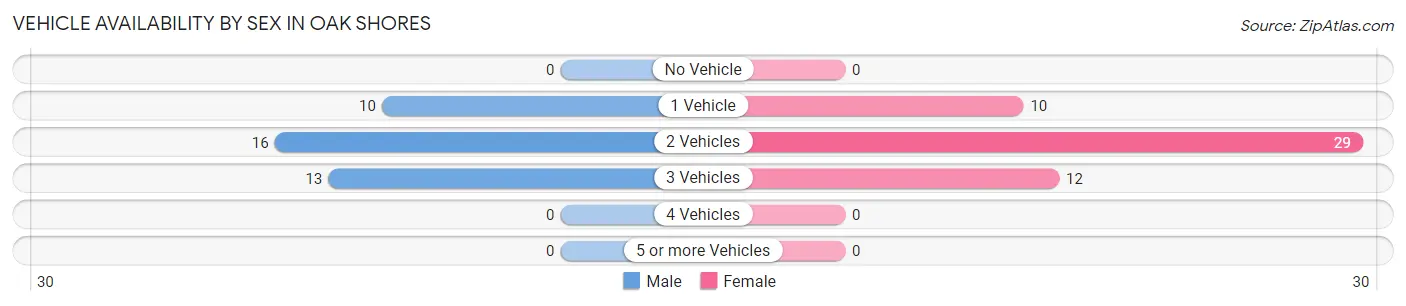
| Vehicles Available | Male | Female |
| No Vehicle | 0 (0.0%) | 0 (0.0%) |
| 1 Vehicle | 10 (25.6%) | 10 (19.6%) |
| 2 Vehicles | 16 (41.0%) | 29 (56.9%) |
| 3 Vehicles | 13 (33.3%) | 12 (23.5%) |
| 4 Vehicles | 0 (0.0%) | 0 (0.0%) |
| 5 or more Vehicles | 0 (0.0%) | 0 (0.0%) |
| Total | 39 (100.0%) | 51 (100.0%) |
Commute Time in Oak Shores
The most frequently occuring commute durations in Oak Shores are 90 or more minutes (36 commuters, 40.0%), 60 to 89 minutes (13 commuters, 14.4%), and 45 to 59 minutes (12 commuters, 13.3%).
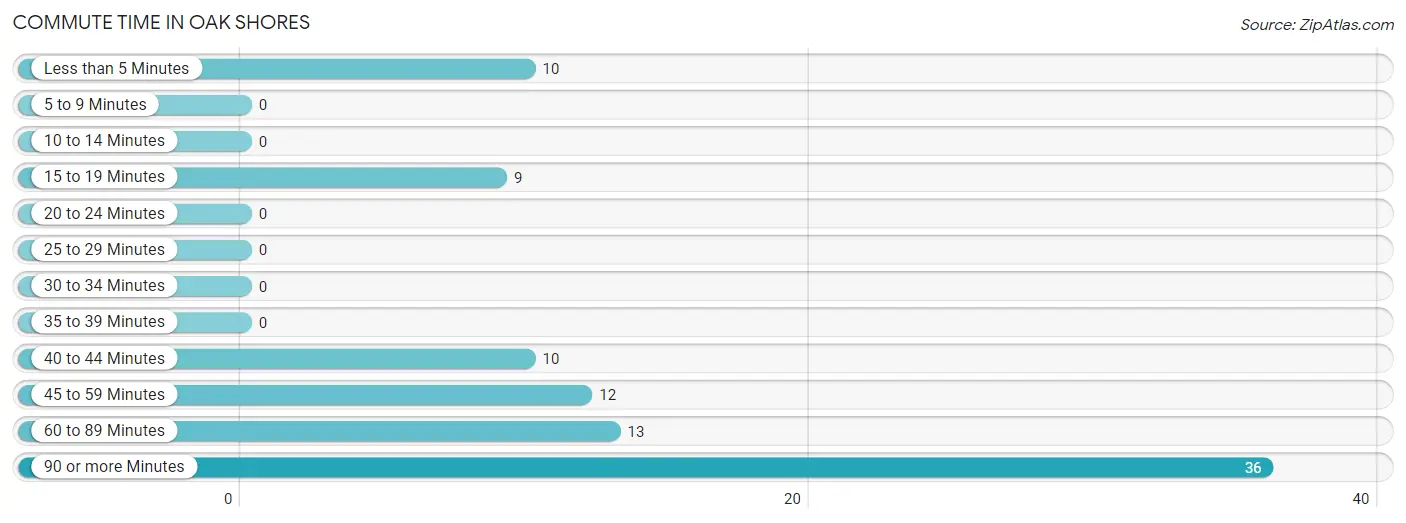
| Commute Time | # Commuters | % Commuters |
| Less than 5 Minutes | 10 | 11.1% |
| 5 to 9 Minutes | 0 | 0.0% |
| 10 to 14 Minutes | 0 | 0.0% |
| 15 to 19 Minutes | 9 | 10.0% |
| 20 to 24 Minutes | 0 | 0.0% |
| 25 to 29 Minutes | 0 | 0.0% |
| 30 to 34 Minutes | 0 | 0.0% |
| 35 to 39 Minutes | 0 | 0.0% |
| 40 to 44 Minutes | 10 | 11.1% |
| 45 to 59 Minutes | 12 | 13.3% |
| 60 to 89 Minutes | 13 | 14.4% |
| 90 or more Minutes | 36 | 40.0% |
Commute Time by Sex in Oak Shores
The most common commute times in Oak Shores are 90 or more minutes (16 commuters, 41.0%) for males and 90 or more minutes (20 commuters, 39.2%) for females.
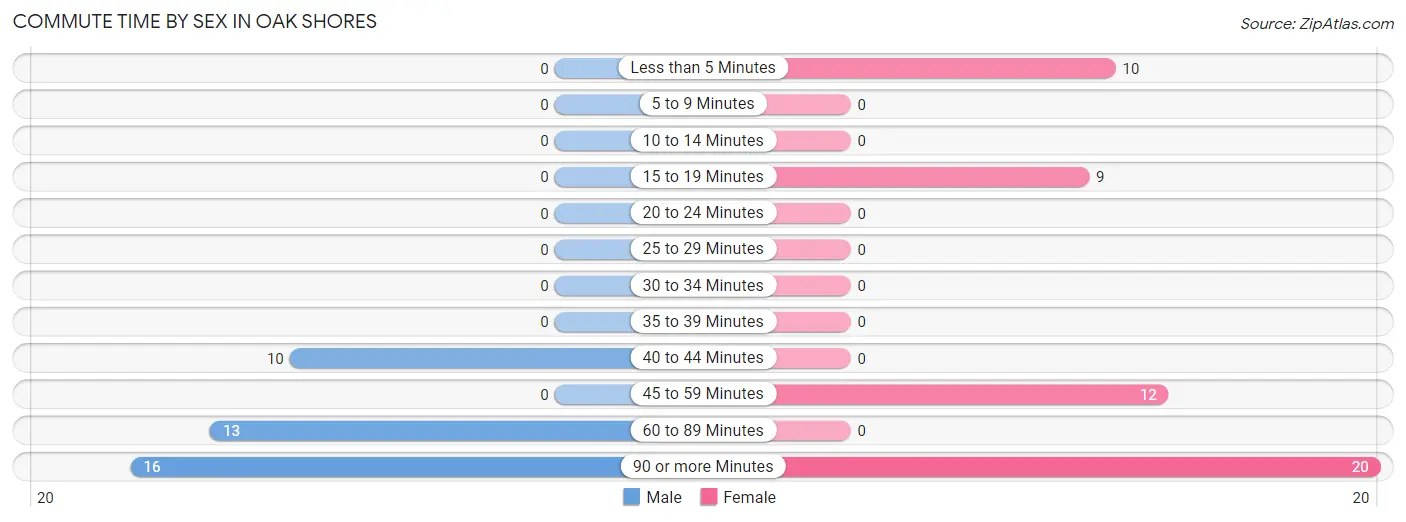
| Commute Time | Male | Female |
| Less than 5 Minutes | 0 (0.0%) | 10 (19.6%) |
| 5 to 9 Minutes | 0 (0.0%) | 0 (0.0%) |
| 10 to 14 Minutes | 0 (0.0%) | 0 (0.0%) |
| 15 to 19 Minutes | 0 (0.0%) | 9 (17.6%) |
| 20 to 24 Minutes | 0 (0.0%) | 0 (0.0%) |
| 25 to 29 Minutes | 0 (0.0%) | 0 (0.0%) |
| 30 to 34 Minutes | 0 (0.0%) | 0 (0.0%) |
| 35 to 39 Minutes | 0 (0.0%) | 0 (0.0%) |
| 40 to 44 Minutes | 10 (25.6%) | 0 (0.0%) |
| 45 to 59 Minutes | 0 (0.0%) | 12 (23.5%) |
| 60 to 89 Minutes | 13 (33.3%) | 0 (0.0%) |
| 90 or more Minutes | 16 (41.0%) | 20 (39.2%) |
Time of Departure to Work by Sex in Oak Shores
The most frequent times of departure to work in Oak Shores are 7:00 AM to 7:29 AM (16, 41.0%) for males and 7:30 AM to 7:59 AM (21, 41.2%) for females.
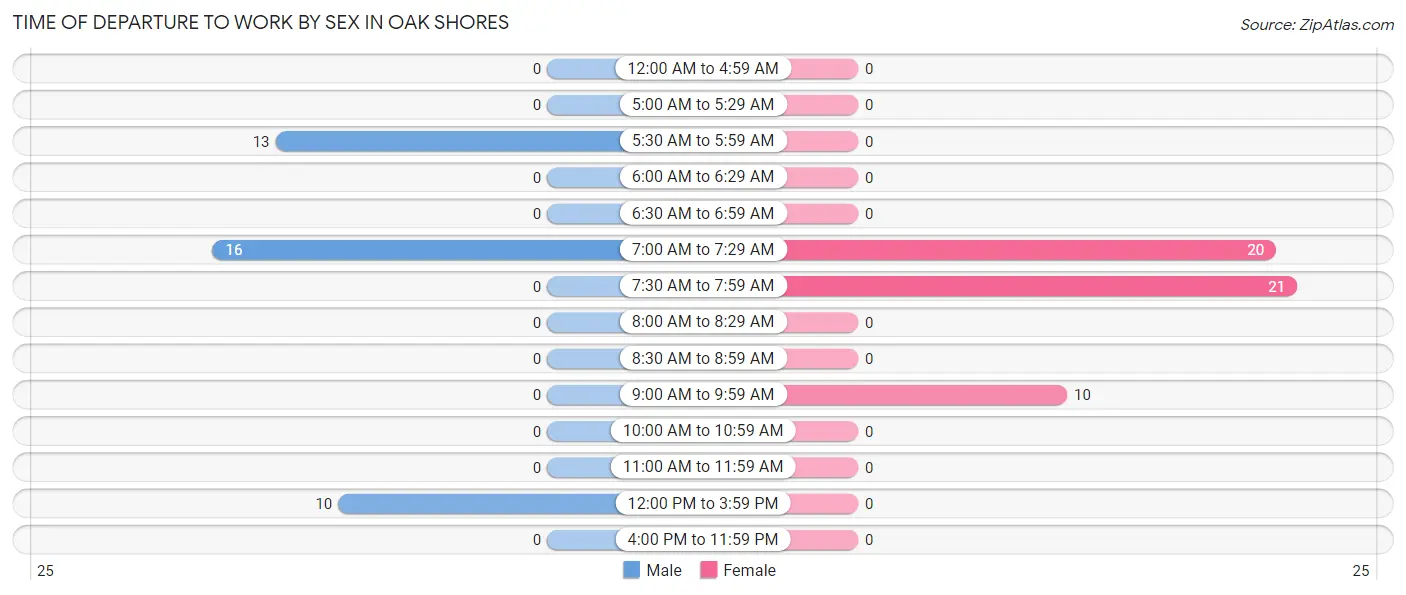
| Time of Departure | Male | Female |
| 12:00 AM to 4:59 AM | 0 (0.0%) | 0 (0.0%) |
| 5:00 AM to 5:29 AM | 0 (0.0%) | 0 (0.0%) |
| 5:30 AM to 5:59 AM | 13 (33.3%) | 0 (0.0%) |
| 6:00 AM to 6:29 AM | 0 (0.0%) | 0 (0.0%) |
| 6:30 AM to 6:59 AM | 0 (0.0%) | 0 (0.0%) |
| 7:00 AM to 7:29 AM | 16 (41.0%) | 20 (39.2%) |
| 7:30 AM to 7:59 AM | 0 (0.0%) | 21 (41.2%) |
| 8:00 AM to 8:29 AM | 0 (0.0%) | 0 (0.0%) |
| 8:30 AM to 8:59 AM | 0 (0.0%) | 0 (0.0%) |
| 9:00 AM to 9:59 AM | 0 (0.0%) | 10 (19.6%) |
| 10:00 AM to 10:59 AM | 0 (0.0%) | 0 (0.0%) |
| 11:00 AM to 11:59 AM | 0 (0.0%) | 0 (0.0%) |
| 12:00 PM to 3:59 PM | 10 (25.6%) | 0 (0.0%) |
| 4:00 PM to 11:59 PM | 0 (0.0%) | 0 (0.0%) |
| Total | 39 (100.0%) | 51 (100.0%) |
Housing Occupancy in Oak Shores
Occupancy by Ownership in Oak Shores
Of the total 85 dwellings in Oak Shores, owner-occupied units account for 66 (77.6%), while renter-occupied units make up 19 (22.4%).
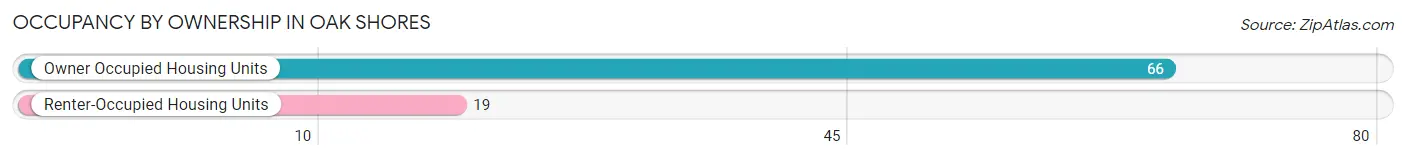
| Occupancy | # Housing Units | % Housing Units |
| Owner Occupied Housing Units | 66 | 77.6% |
| Renter-Occupied Housing Units | 19 | 22.4% |
| Total Occupied Housing Units | 85 | 100.0% |
Occupancy by Household Size in Oak Shores
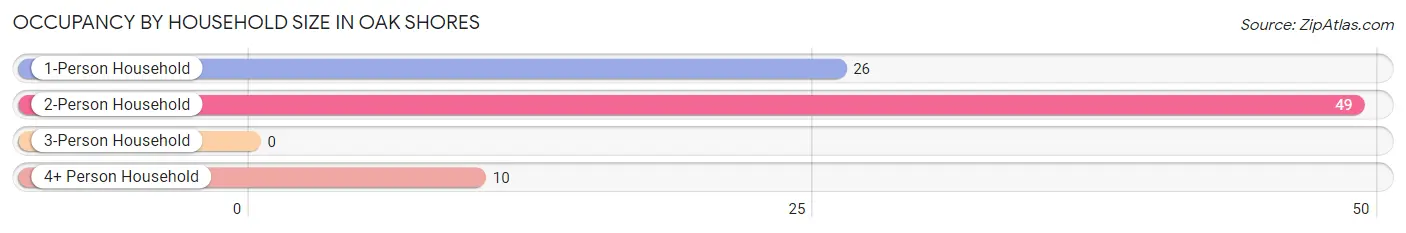
| Household Size | # Housing Units | % Housing Units |
| 1-Person Household | 26 | 30.6% |
| 2-Person Household | 49 | 57.7% |
| 3-Person Household | 0 | 0.0% |
| 4+ Person Household | 10 | 11.8% |
| Total Housing Units | 85 | 100.0% |
Occupancy by Ownership by Household Size in Oak Shores
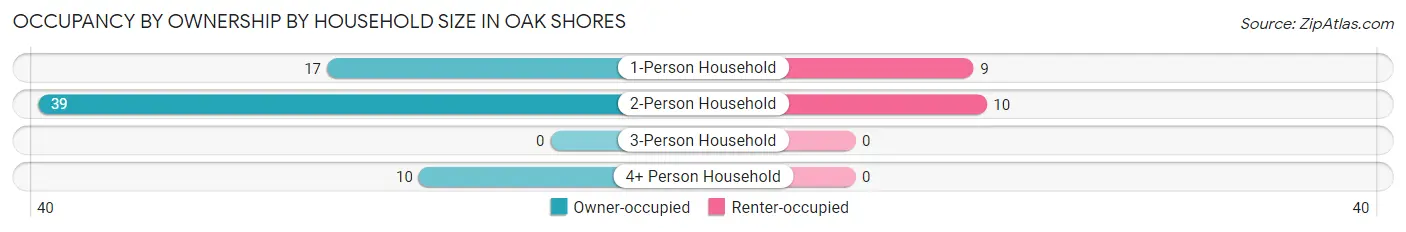
| Household Size | Owner-occupied | Renter-occupied |
| 1-Person Household | 17 (65.4%) | 9 (34.6%) |
| 2-Person Household | 39 (79.6%) | 10 (20.4%) |
| 3-Person Household | 0 (0.0%) | 0 (0.0%) |
| 4+ Person Household | 10 (100.0%) | 0 (0.0%) |
| Total Housing Units | 66 (77.6%) | 19 (22.4%) |
Occupancy by Educational Attainment in Oak Shores
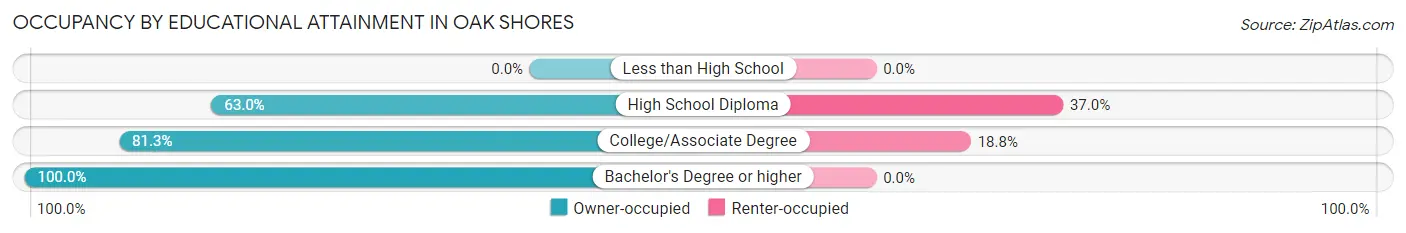
| Household Size | Owner-occupied | Renter-occupied |
| Less than High School | 0 (0.0%) | 0 (0.0%) |
| High School Diploma | 17 (63.0%) | 10 (37.0%) |
| College/Associate Degree | 39 (81.2%) | 9 (18.8%) |
| Bachelor's Degree or higher | 10 (100.0%) | 0 (0.0%) |
Occupancy by Age of Householder in Oak Shores
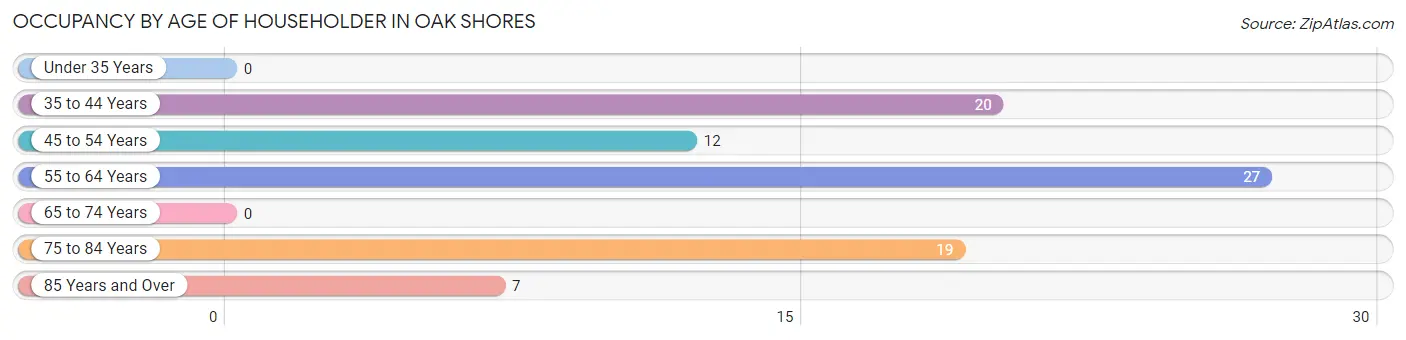
| Age Bracket | # Households | % Households |
| Under 35 Years | 0 | 0.0% |
| 35 to 44 Years | 20 | 23.5% |
| 45 to 54 Years | 12 | 14.1% |
| 55 to 64 Years | 27 | 31.8% |
| 65 to 74 Years | 0 | 0.0% |
| 75 to 84 Years | 19 | 22.4% |
| 85 Years and Over | 7 | 8.2% |
| Total | 85 | 100.0% |
Housing Finances in Oak Shores
Median Income by Occupancy in Oak Shores
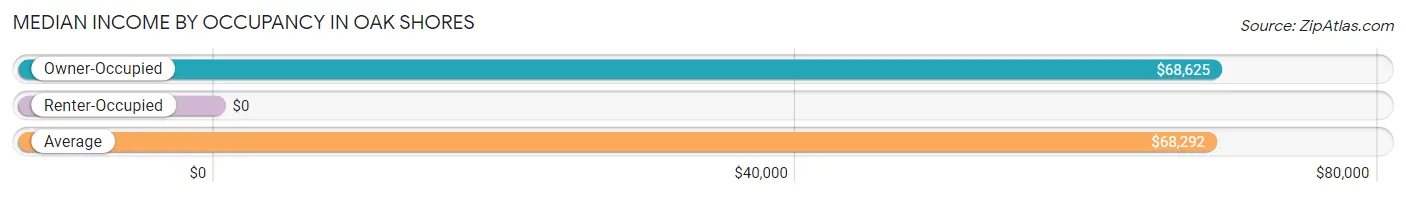
| Occupancy Type | # Households | Median Income |
| Owner-Occupied | 66 (77.6%) | $68,625 |
| Renter-Occupied | 19 (22.4%) | $0 |
| Average | 85 (100.0%) | $68,292 |
Occupancy by Householder Income Bracket in Oak Shores
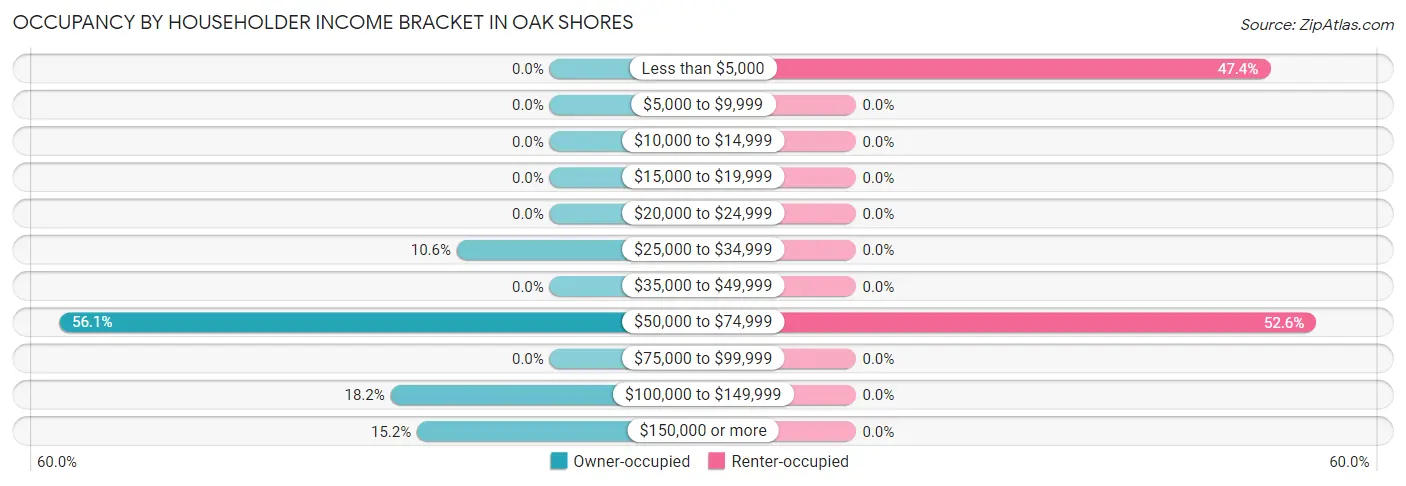
| Income Bracket | Owner-occupied | Renter-occupied |
| Less than $5,000 | 0 (0.0%) | 9 (47.4%) |
| $5,000 to $9,999 | 0 (0.0%) | 0 (0.0%) |
| $10,000 to $14,999 | 0 (0.0%) | 0 (0.0%) |
| $15,000 to $19,999 | 0 (0.0%) | 0 (0.0%) |
| $20,000 to $24,999 | 0 (0.0%) | 0 (0.0%) |
| $25,000 to $34,999 | 7 (10.6%) | 0 (0.0%) |
| $35,000 to $49,999 | 0 (0.0%) | 0 (0.0%) |
| $50,000 to $74,999 | 37 (56.1%) | 10 (52.6%) |
| $75,000 to $99,999 | 0 (0.0%) | 0 (0.0%) |
| $100,000 to $149,999 | 12 (18.2%) | 0 (0.0%) |
| $150,000 or more | 10 (15.1%) | 0 (0.0%) |
| Total | 66 (100.0%) | 19 (100.0%) |
Monthly Housing Cost Tiers in Oak Shores
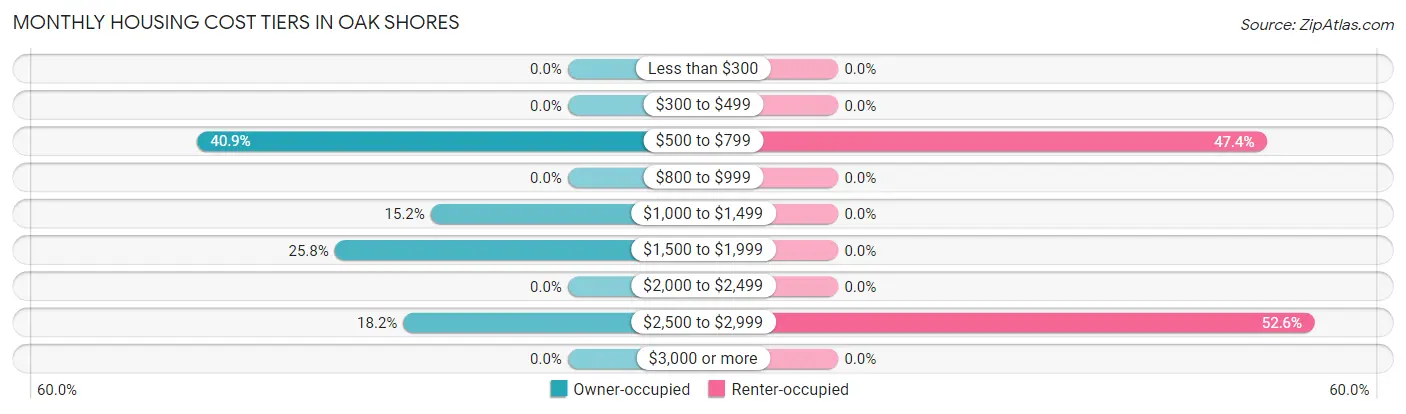
| Monthly Cost | Owner-occupied | Renter-occupied |
| Less than $300 | 0 (0.0%) | 0 (0.0%) |
| $300 to $499 | 0 (0.0%) | 0 (0.0%) |
| $500 to $799 | 27 (40.9%) | 9 (47.4%) |
| $800 to $999 | 0 (0.0%) | 0 (0.0%) |
| $1,000 to $1,499 | 10 (15.1%) | 0 (0.0%) |
| $1,500 to $1,999 | 17 (25.8%) | 0 (0.0%) |
| $2,000 to $2,499 | 0 (0.0%) | 0 (0.0%) |
| $2,500 to $2,999 | 12 (18.2%) | 10 (52.6%) |
| $3,000 or more | 0 (0.0%) | 0 (0.0%) |
| Total | 66 (100.0%) | 19 (100.0%) |
Physical Housing Characteristics in Oak Shores
Housing Structures in Oak Shores
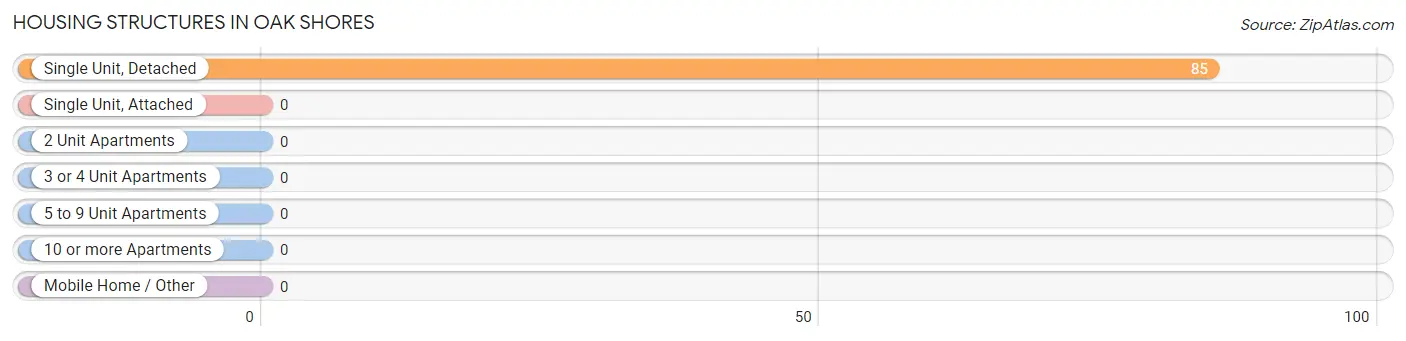
| Structure Type | # Housing Units | % Housing Units |
| Single Unit, Detached | 85 | 100.0% |
| Single Unit, Attached | 0 | 0.0% |
| 2 Unit Apartments | 0 | 0.0% |
| 3 or 4 Unit Apartments | 0 | 0.0% |
| 5 to 9 Unit Apartments | 0 | 0.0% |
| 10 or more Apartments | 0 | 0.0% |
| Mobile Home / Other | 0 | 0.0% |
| Total | 85 | 100.0% |
Housing Structures by Occupancy in Oak Shores
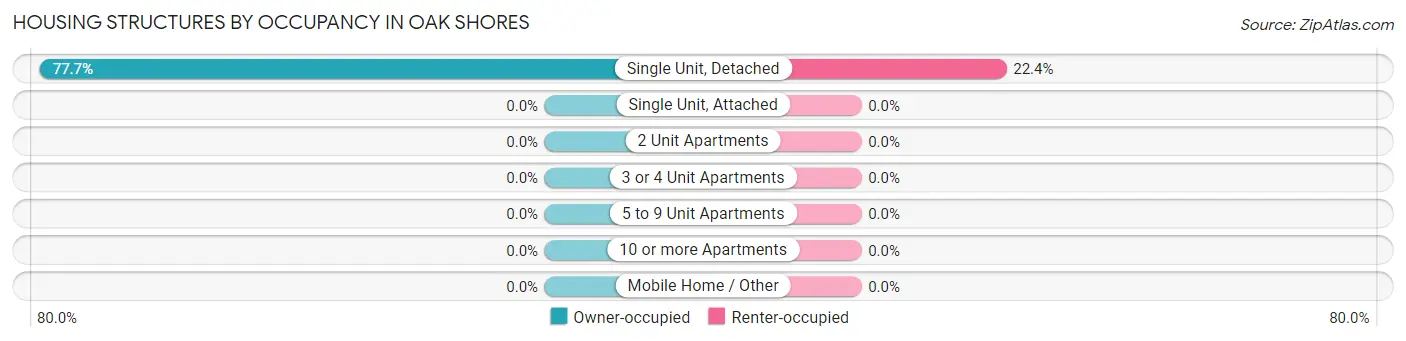
| Structure Type | Owner-occupied | Renter-occupied |
| Single Unit, Detached | 66 (77.6%) | 19 (22.4%) |
| Single Unit, Attached | 0 (0.0%) | 0 (0.0%) |
| 2 Unit Apartments | 0 (0.0%) | 0 (0.0%) |
| 3 or 4 Unit Apartments | 0 (0.0%) | 0 (0.0%) |
| 5 to 9 Unit Apartments | 0 (0.0%) | 0 (0.0%) |
| 10 or more Apartments | 0 (0.0%) | 0 (0.0%) |
| Mobile Home / Other | 0 (0.0%) | 0 (0.0%) |
| Total | 66 (77.6%) | 19 (22.4%) |
Housing Structures by Number of Rooms in Oak Shores
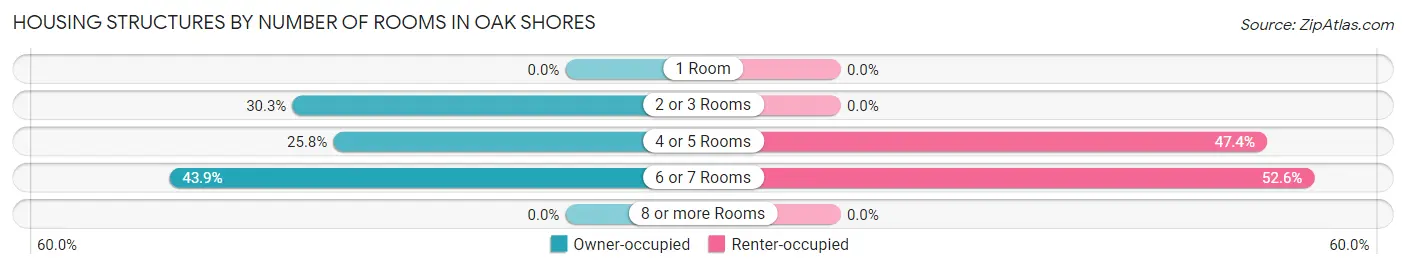
| Number of Rooms | Owner-occupied | Renter-occupied |
| 1 Room | 0 (0.0%) | 0 (0.0%) |
| 2 or 3 Rooms | 20 (30.3%) | 0 (0.0%) |
| 4 or 5 Rooms | 17 (25.8%) | 9 (47.4%) |
| 6 or 7 Rooms | 29 (43.9%) | 10 (52.6%) |
| 8 or more Rooms | 0 (0.0%) | 0 (0.0%) |
| Total | 66 (100.0%) | 19 (100.0%) |
Housing Structure by Heating Type in Oak Shores
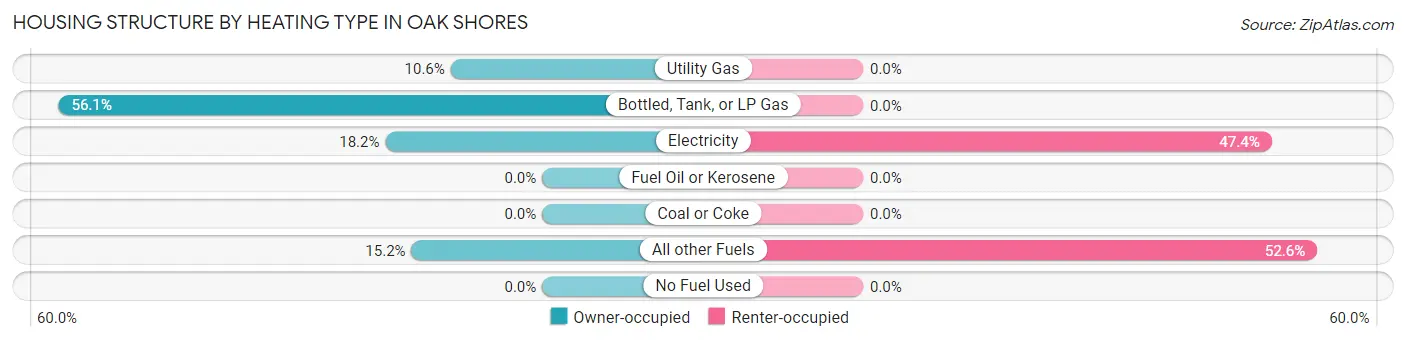
| Heating Type | Owner-occupied | Renter-occupied |
| Utility Gas | 7 (10.6%) | 0 (0.0%) |
| Bottled, Tank, or LP Gas | 37 (56.1%) | 0 (0.0%) |
| Electricity | 12 (18.2%) | 9 (47.4%) |
| Fuel Oil or Kerosene | 0 (0.0%) | 0 (0.0%) |
| Coal or Coke | 0 (0.0%) | 0 (0.0%) |
| All other Fuels | 10 (15.1%) | 10 (52.6%) |
| No Fuel Used | 0 (0.0%) | 0 (0.0%) |
| Total | 66 (100.0%) | 19 (100.0%) |
Household Vehicle Usage in Oak Shores
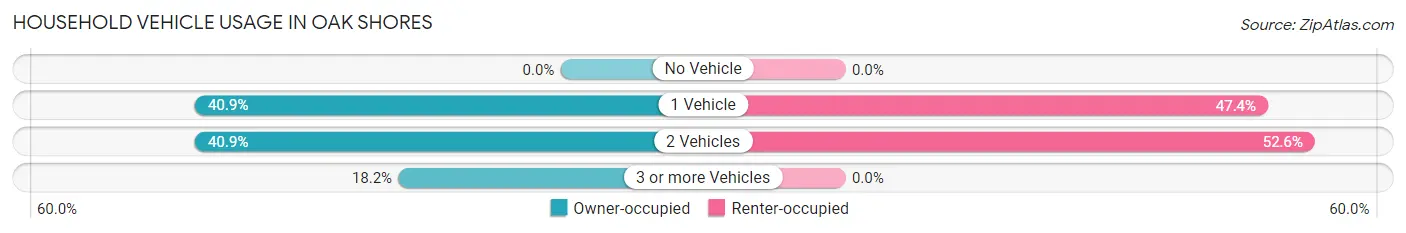
| Vehicles per Household | Owner-occupied | Renter-occupied |
| No Vehicle | 0 (0.0%) | 0 (0.0%) |
| 1 Vehicle | 27 (40.9%) | 9 (47.4%) |
| 2 Vehicles | 27 (40.9%) | 10 (52.6%) |
| 3 or more Vehicles | 12 (18.2%) | 0 (0.0%) |
| Total | 66 (100.0%) | 19 (100.0%) |
Real Estate & Mortgages in Oak Shores
Real Estate and Mortgage Overview in Oak Shores
| Characteristic | Without Mortgage | With Mortgage |
| Housing Units | 44 | 22 |
| Median Property Value | $373,300 | $0 |
| Median Household Income | $62,000 | $10 |
| Monthly Housing Costs | $681 | $0 |
| Real Estate Taxes | $3,444 | $0 |
Property Value by Mortgage Status in Oak Shores
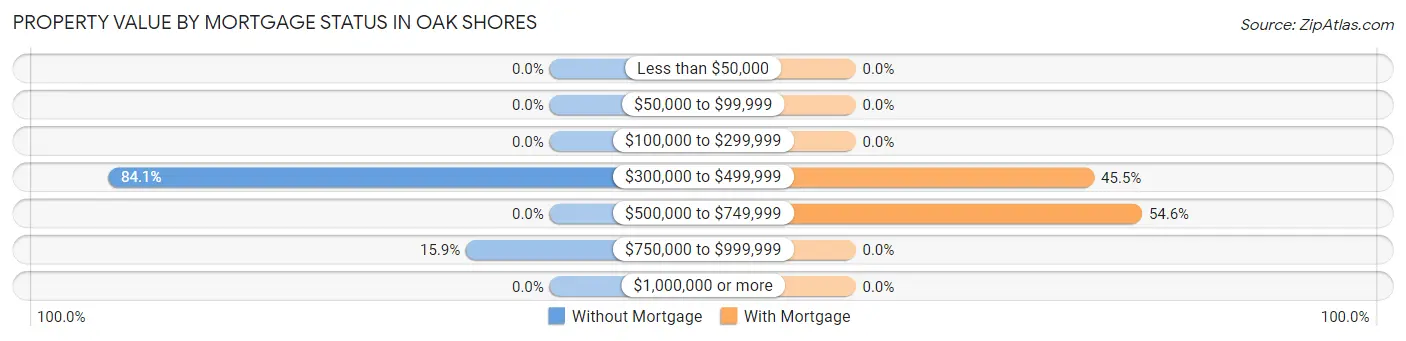
| Property Value | Without Mortgage | With Mortgage |
| Less than $50,000 | 0 (0.0%) | 0 (0.0%) |
| $50,000 to $99,999 | 0 (0.0%) | 0 (0.0%) |
| $100,000 to $299,999 | 0 (0.0%) | 0 (0.0%) |
| $300,000 to $499,999 | 37 (84.1%) | 10 (45.5%) |
| $500,000 to $749,999 | 0 (0.0%) | 12 (54.5%) |
| $750,000 to $999,999 | 7 (15.9%) | 0 (0.0%) |
| $1,000,000 or more | 0 (0.0%) | 0 (0.0%) |
| Total | 44 (100.0%) | 22 (100.0%) |
Household Income by Mortgage Status in Oak Shores
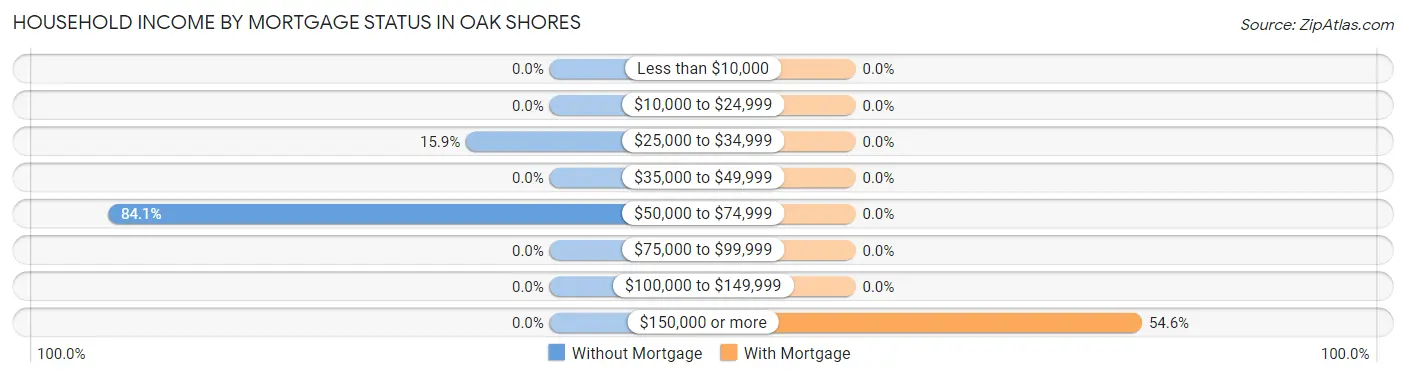
| Household Income | Without Mortgage | With Mortgage |
| Less than $10,000 | 0 (0.0%) | 0 (0.0%) |
| $10,000 to $24,999 | 0 (0.0%) | 0 (0.0%) |
| $25,000 to $34,999 | 7 (15.9%) | 0 (0.0%) |
| $35,000 to $49,999 | 0 (0.0%) | 0 (0.0%) |
| $50,000 to $74,999 | 37 (84.1%) | 0 (0.0%) |
| $75,000 to $99,999 | 0 (0.0%) | 0 (0.0%) |
| $100,000 to $149,999 | 0 (0.0%) | 0 (0.0%) |
| $150,000 or more | 0 (0.0%) | 12 (54.5%) |
| Total | 44 (100.0%) | 22 (100.0%) |
Property Value to Household Income Ratio in Oak Shores
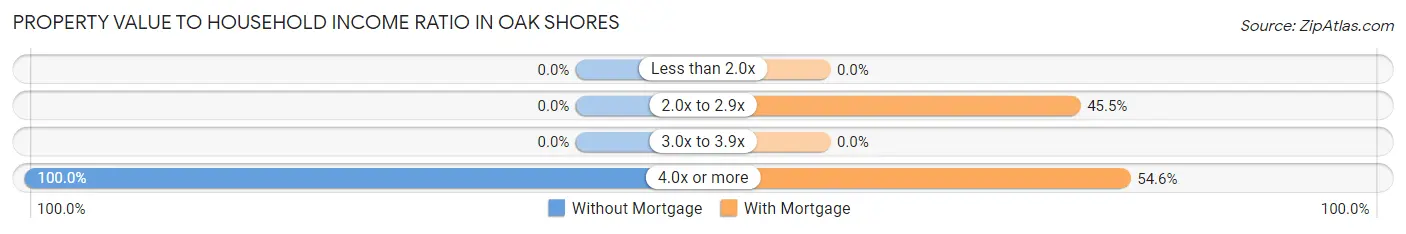
| Value-to-Income Ratio | Without Mortgage | With Mortgage |
| Less than 2.0x | 0 (0.0%) | 0 (0.0%) |
| 2.0x to 2.9x | 0 (0.0%) | 10 (45.5%) |
| 3.0x to 3.9x | 0 (0.0%) | 0 (0.0%) |
| 4.0x or more | 44 (100.0%) | 12 (54.5%) |
| Total | 44 (100.0%) | 22 (100.0%) |
Real Estate Taxes by Mortgage Status in Oak Shores
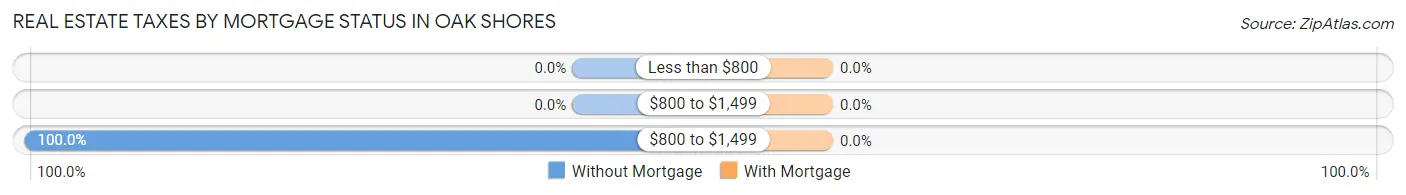
| Property Taxes | Without Mortgage | With Mortgage |
| Less than $800 | 0 (0.0%) | 0 (0.0%) |
| $800 to $1,499 | 0 (0.0%) | 0 (0.0%) |
| $800 to $1,499 | 44 (100.0%) | 0 (0.0%) |
| Total | 44 (100.0%) | 22 (100.0%) |
Health & Disability in Oak Shores
Health Insurance Coverage by Age in Oak Shores
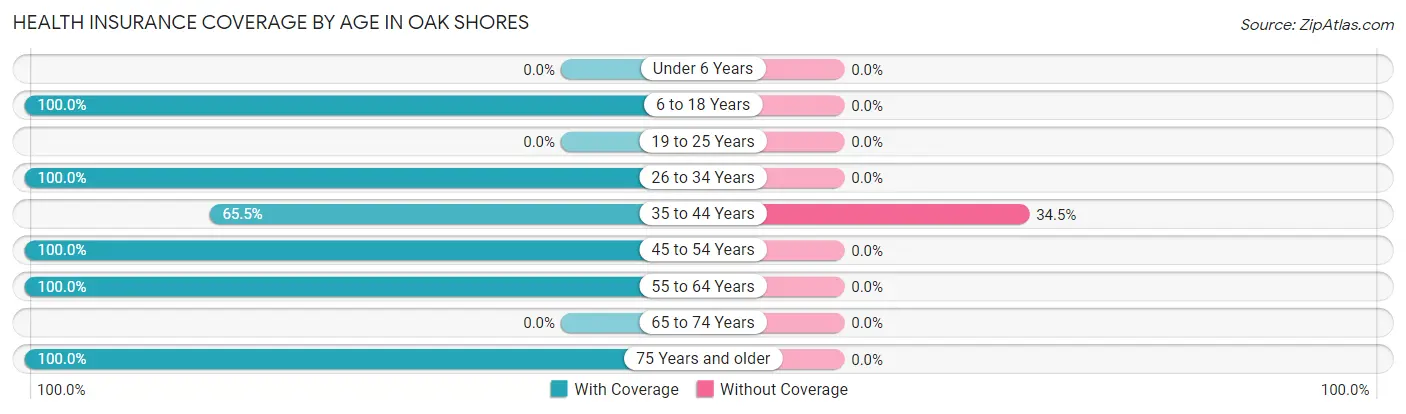
| Age Bracket | With Coverage | Without Coverage |
| Under 6 Years | 0 (0.0%) | 0 (0.0%) |
| 6 to 18 Years | 19 (100.0%) | 0 (0.0%) |
| 19 to 25 Years | 0 (0.0%) | 0 (0.0%) |
| 26 to 34 Years | 16 (100.0%) | 0 (0.0%) |
| 35 to 44 Years | 19 (65.5%) | 10 (34.5%) |
| 45 to 54 Years | 22 (100.0%) | 0 (0.0%) |
| 55 to 64 Years | 40 (100.0%) | 0 (0.0%) |
| 65 to 74 Years | 0 (0.0%) | 0 (0.0%) |
| 75 Years and older | 33 (100.0%) | 0 (0.0%) |
| Total | 149 (93.7%) | 10 (6.3%) |
Health Insurance Coverage by Citizenship Status in Oak Shores
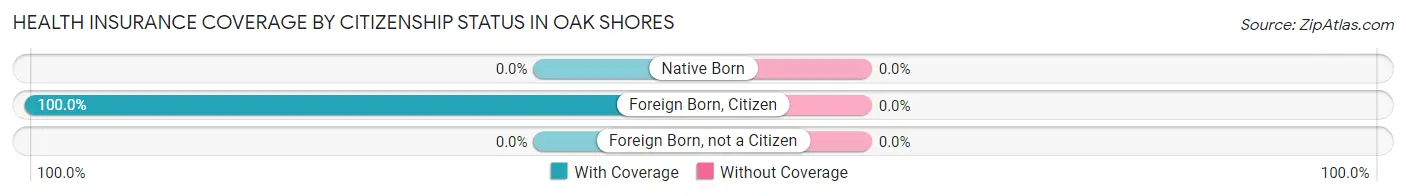
| Citizenship Status | With Coverage | Without Coverage |
| Native Born | 0 (0.0%) | 0 (0.0%) |
| Foreign Born, Citizen | 19 (100.0%) | 0 (0.0%) |
| Foreign Born, not a Citizen | 0 (0.0%) | 0 (0.0%) |
Health Insurance Coverage by Household Income in Oak Shores
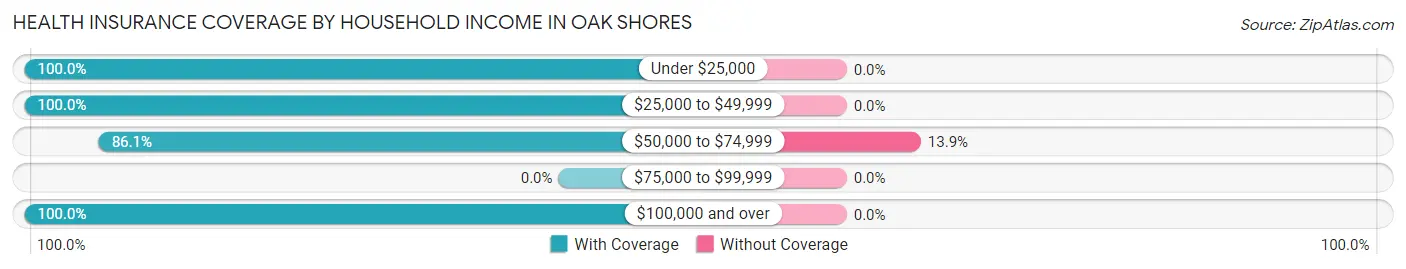
| Household Income | With Coverage | Without Coverage |
| Under $25,000 | 9 (100.0%) | 0 (0.0%) |
| $25,000 to $49,999 | 14 (100.0%) | 0 (0.0%) |
| $50,000 to $74,999 | 62 (86.1%) | 10 (13.9%) |
| $75,000 to $99,999 | 0 (0.0%) | 0 (0.0%) |
| $100,000 and over | 64 (100.0%) | 0 (0.0%) |
Public vs Private Health Insurance Coverage by Age in Oak Shores
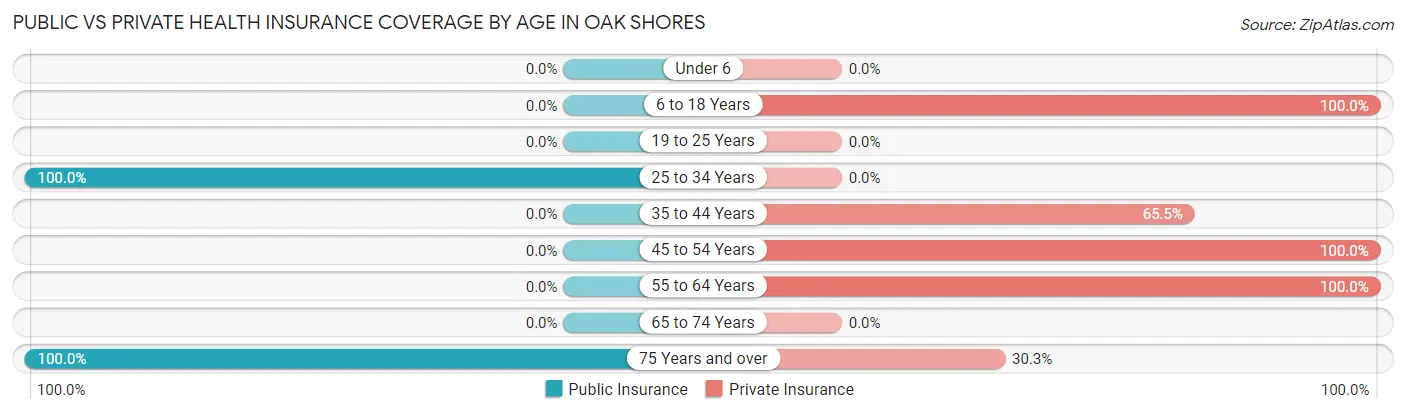
| Age Bracket | Public Insurance | Private Insurance |
| Under 6 | 0 (0.0%) | 0 (0.0%) |
| 6 to 18 Years | 0 (0.0%) | 19 (100.0%) |
| 19 to 25 Years | 0 (0.0%) | 0 (0.0%) |
| 25 to 34 Years | 16 (100.0%) | 0 (0.0%) |
| 35 to 44 Years | 0 (0.0%) | 19 (65.5%) |
| 45 to 54 Years | 0 (0.0%) | 22 (100.0%) |
| 55 to 64 Years | 0 (0.0%) | 40 (100.0%) |
| 65 to 74 Years | 0 (0.0%) | 0 (0.0%) |
| 75 Years and over | 33 (100.0%) | 10 (30.3%) |
| Total | 49 (30.8%) | 110 (69.2%) |
Disability Status by Sex by Age in Oak Shores
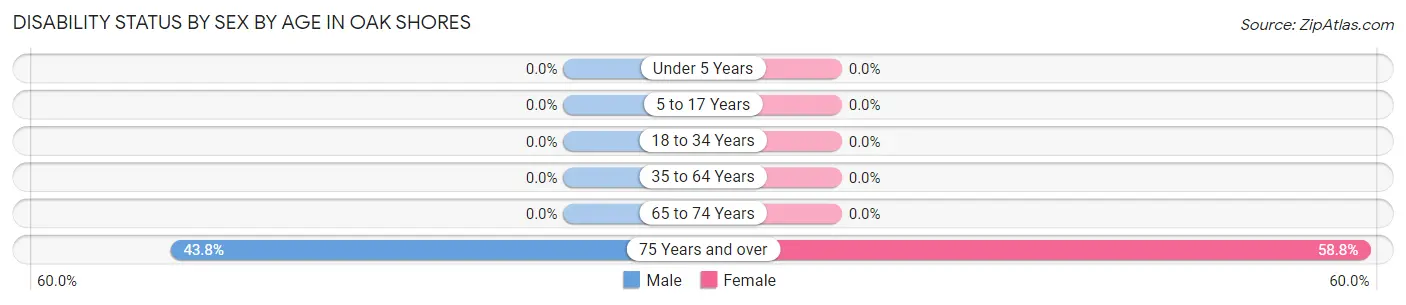
| Age Bracket | Male | Female |
| Under 5 Years | 0 (0.0%) | 0 (0.0%) |
| 5 to 17 Years | 0 (0.0%) | 0 (0.0%) |
| 18 to 34 Years | 0 (0.0%) | 0 (0.0%) |
| 35 to 64 Years | 0 (0.0%) | 0 (0.0%) |
| 65 to 74 Years | 0 (0.0%) | 0 (0.0%) |
| 75 Years and over | 7 (43.8%) | 10 (58.8%) |
Disability Class by Sex by Age in Oak Shores
Disability Class: Hearing Difficulty
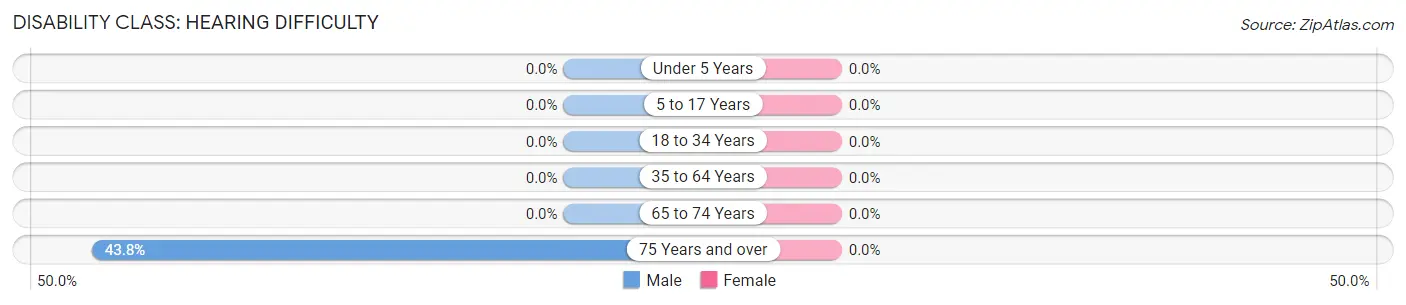
| Age Bracket | Male | Female |
| Under 5 Years | 0 (0.0%) | 0 (0.0%) |
| 5 to 17 Years | 0 (0.0%) | 0 (0.0%) |
| 18 to 34 Years | 0 (0.0%) | 0 (0.0%) |
| 35 to 64 Years | 0 (0.0%) | 0 (0.0%) |
| 65 to 74 Years | 0 (0.0%) | 0 (0.0%) |
| 75 Years and over | 7 (43.8%) | 0 (0.0%) |
Disability Class: Vision Difficulty
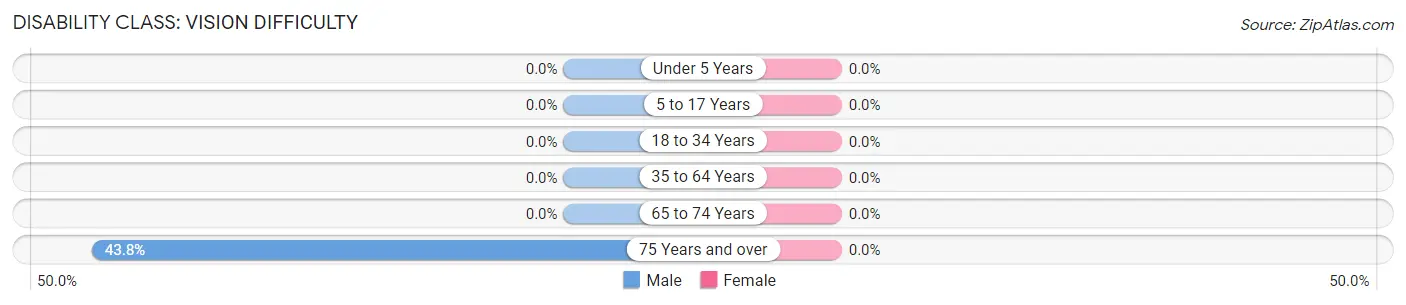
| Age Bracket | Male | Female |
| Under 5 Years | 0 (0.0%) | 0 (0.0%) |
| 5 to 17 Years | 0 (0.0%) | 0 (0.0%) |
| 18 to 34 Years | 0 (0.0%) | 0 (0.0%) |
| 35 to 64 Years | 0 (0.0%) | 0 (0.0%) |
| 65 to 74 Years | 0 (0.0%) | 0 (0.0%) |
| 75 Years and over | 7 (43.8%) | 0 (0.0%) |
Disability Class: Cognitive Difficulty
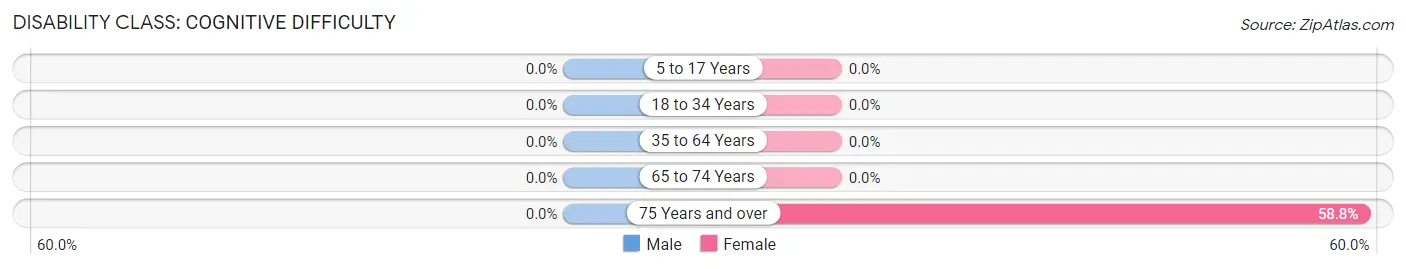
| Age Bracket | Male | Female |
| 5 to 17 Years | 0 (0.0%) | 0 (0.0%) |
| 18 to 34 Years | 0 (0.0%) | 0 (0.0%) |
| 35 to 64 Years | 0 (0.0%) | 0 (0.0%) |
| 65 to 74 Years | 0 (0.0%) | 0 (0.0%) |
| 75 Years and over | 0 (0.0%) | 10 (58.8%) |
Disability Class: Ambulatory Difficulty
| Age Bracket | Male | Female |
| 5 to 17 Years | 0 (0.0%) | 0 (0.0%) |
| 18 to 34 Years | 0 (0.0%) | 0 (0.0%) |
| 35 to 64 Years | 0 (0.0%) | 0 (0.0%) |
| 65 to 74 Years | 0 (0.0%) | 0 (0.0%) |
| 75 Years and over | 0 (0.0%) | 0 (0.0%) |
Disability Class: Self-Care Difficulty
| Age Bracket | Male | Female |
| 5 to 17 Years | 0 (0.0%) | 0 (0.0%) |
| 18 to 34 Years | 0 (0.0%) | 0 (0.0%) |
| 35 to 64 Years | 0 (0.0%) | 0 (0.0%) |
| 65 to 74 Years | 0 (0.0%) | 0 (0.0%) |
| 75 Years and over | 0 (0.0%) | 0 (0.0%) |
Technology Access in Oak Shores
Computing Device Access in Oak Shores
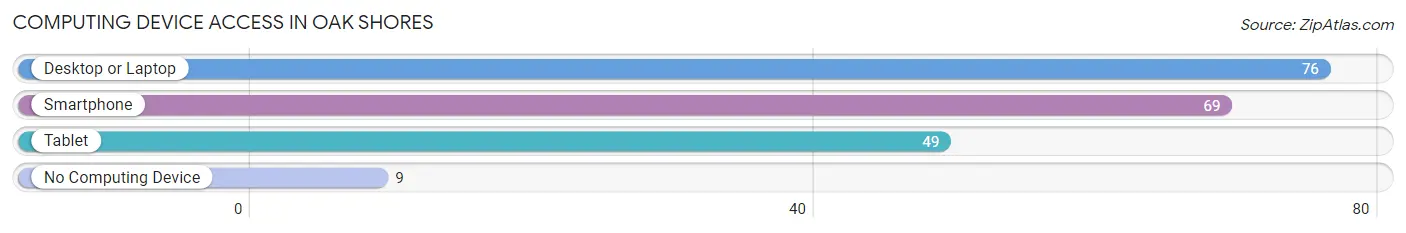
| Device Type | # Households | % Households |
| Desktop or Laptop | 76 | 89.4% |
| Smartphone | 69 | 81.2% |
| Tablet | 49 | 57.7% |
| No Computing Device | 9 | 10.6% |
| Total | 85 | 100.0% |
Internet Access in Oak Shores
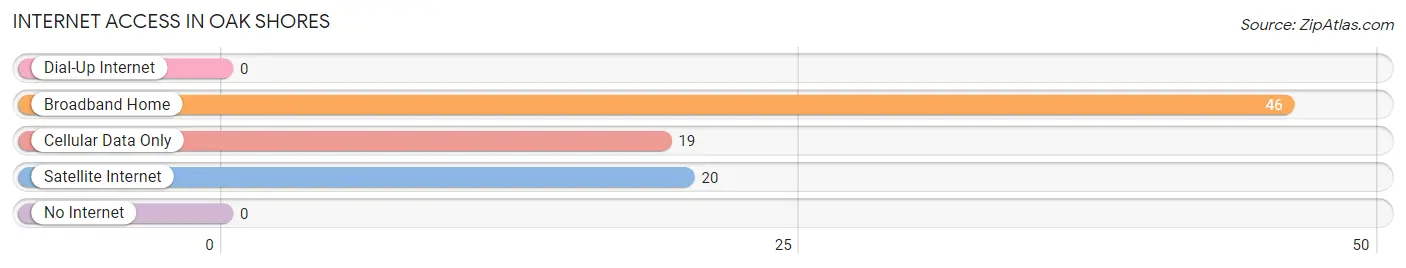
| Internet Type | # Households | % Households |
| Dial-Up Internet | 0 | 0.0% |
| Broadband Home | 46 | 54.1% |
| Cellular Data Only | 19 | 22.4% |
| Satellite Internet | 20 | 23.5% |
| No Internet | 0 | 0.0% |
| Total | 85 | 100.0% |
Oak Shores Summary
Oak Shores is a small unincorporated community located in San Luis Obispo County, California. It is situated on the northern shore of Lake Nacimiento, a reservoir created by the Monterey County Water Authority in 1957. The community is located approximately 25 miles east of San Luis Obispo and is part of the larger Paso Robles-Atascadero-Paso Robles Metropolitan Statistical Area.
History
Oak Shores was originally inhabited by the Salinan Indians, who were the original inhabitants of the area. The Salinan Indians were a peaceful tribe that lived in the area for thousands of years before the arrival of Europeans. The first Europeans to settle in the area were Spanish missionaries, who established the Mission San Miguel Arcangel in 1797. The mission was abandoned in 1834, and the area was subsequently settled by ranchers and farmers.
In the early 1900s, the area was developed as a resort community. The first resort was built in 1910, and the area quickly became a popular destination for vacationers. The area was also home to several small fishing villages, which were popular with anglers.
In 1957, the Monterey County Water Authority created Lake Nacimiento, which flooded much of the area. The lake was created to provide water for the growing population of the Central Coast. The lake also provided recreational opportunities for the residents of Oak Shores.
Geography
Oak Shores is located on the northern shore of Lake Nacimiento, a reservoir created by the Monterey County Water Authority in 1957. The lake is approximately 8,000 acres in size and is the largest lake in San Luis Obispo County. The lake is surrounded by rolling hills and oak-studded valleys. The area is also home to several small creeks and streams, which provide a habitat for a variety of wildlife.
The climate in Oak Shores is mild and temperate. The average temperature in the summer is around 75 degrees Fahrenheit, and the average temperature in the winter is around 55 degrees Fahrenheit. The area receives an average of 15 inches of rain per year.
Economy
Oak Shores is primarily a residential community, and the local economy is largely based on tourism. The area is home to several resorts, campgrounds, and marinas, which attract visitors from all over the Central Coast. The area is also home to several wineries, which produce a variety of wines.
The area is also home to several small businesses, including restaurants, convenience stores, and gas stations. The local economy is also supported by the nearby military base, Camp Roberts.
Demographics
As of the 2010 census, the population of Oak Shores was 1,845. The population is primarily white (90.2%), with a small Hispanic population (7.2%). The median household income is $50,000, and the median age is 44. The area is home to a large number of retirees, as well as a growing number of young families.
Common Questions
What is Per Capita Income in Oak Shores?
Per Capita income in Oak Shores is $68,817.
What is the Median Household income in Oak Shores?
Median Household Income in Oak Shores is $68,292.
What is Inequality or Gini Index in Oak Shores?
Inequality or Gini Index in Oak Shores is 0.55.
What is the Total Population of Oak Shores?
Total Population of Oak Shores is 159.
What is the Total Male Population of Oak Shores?
Total Male Population of Oak Shores is 74.
What is the Total Female Population of Oak Shores?
Total Female Population of Oak Shores is 85.
What is the Ratio of Males per 100 Females in Oak Shores?
There are 87.06 Males per 100 Females in Oak Shores.
What is the Ratio of Females per 100 Males in Oak Shores?
There are 114.86 Females per 100 Males in Oak Shores.
What is the Median Population Age in Oak Shores?
Median Population Age in Oak Shores is 54.5 Years.
What is the Average Family Size in Oak Shores
Average Family Size in Oak Shores is 2.3 People.
What is the Average Household Size in Oak Shores
Average Household Size in Oak Shores is 1.9 People.
How Large is the Labor Force in Oak Shores?
There are 90 People in the Labor Forcein in Oak Shores.
What is the Percentage of People in the Labor Force in Oak Shores?
64.3% of People are in the Labor Force in Oak Shores.