Snelling, CA Map & Demographics
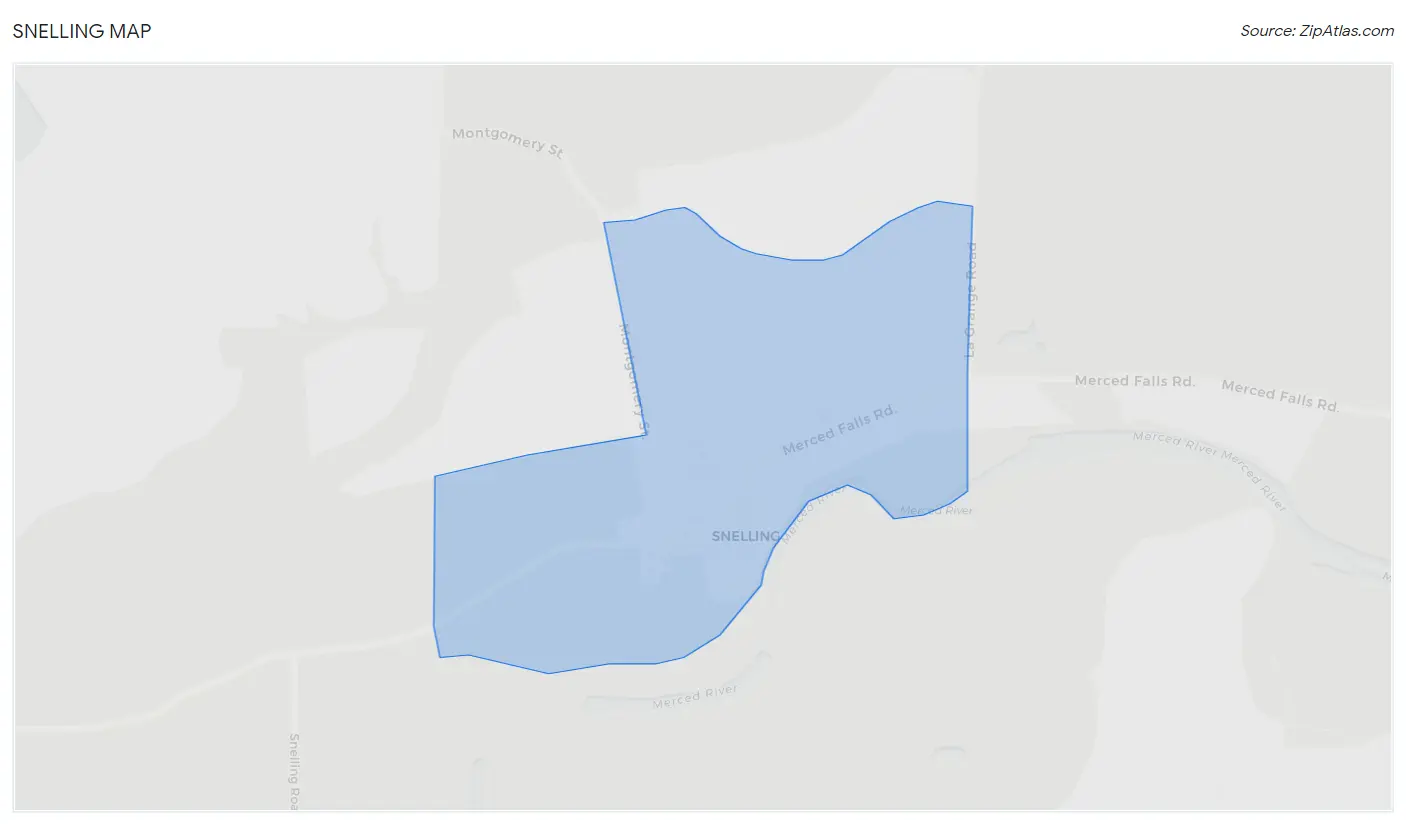
Snelling Map
Snelling Overview
$24,144
PER CAPITA INCOME
$67,708
AVG FAMILY INCOME
$44,861
AVG HOUSEHOLD INCOME
0.33
INEQUALITY / GINI INDEX
178
TOTAL POPULATION
117
MALE POPULATION
61
FEMALE POPULATION
191.80
MALES / 100 FEMALES
52.14
FEMALES / 100 MALES
40.1
MEDIAN AGE
3.3
AVG FAMILY SIZE
2.4
AVG HOUSEHOLD SIZE
68
LABOR FORCE [ PEOPLE ]
47.9%
PERCENT IN LABOR FORCE
13.2%
UNEMPLOYMENT RATE
Snelling Zip Codes
Snelling Area Codes
Income in Snelling
Income Overview in Snelling
Per Capita Income in Snelling is $24,144, while median incomes of families and households are $67,708 and $44,861 respectively.
| Characteristic | Number | Measure |
| Per Capita Income | 178 | $24,144 |
| Median Family Income | 41 | $67,708 |
| Mean Family Income | 41 | $70,885 |
| Median Household Income | 73 | $44,861 |
| Mean Household Income | 73 | $55,267 |
| Income Deficit | 41 | $0 |
| Wage / Income Gap (%) | 178 | 0.00% |
| Wage / Income Gap ($) | 178 | 100.00¢ per $1 |
| Gini / Inequality Index | 178 | 0.33 |
Earnings by Sex in Snelling
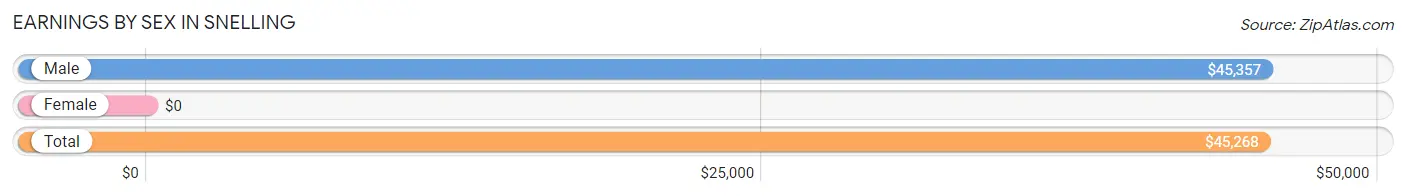
| Sex | Number | Average Earnings |
| Male | 52 (80.0%) | $45,357 |
| Female | 13 (20.0%) | $0 |
| Total | 65 (100.0%) | $45,268 |
Earnings by Sex by Income Bracket in Snelling
The most common earnings brackets in Snelling are $40,000 to $44,999 for men (15 | 28.8%) and $75,000 to $99,999 for women (6 | 46.2%).
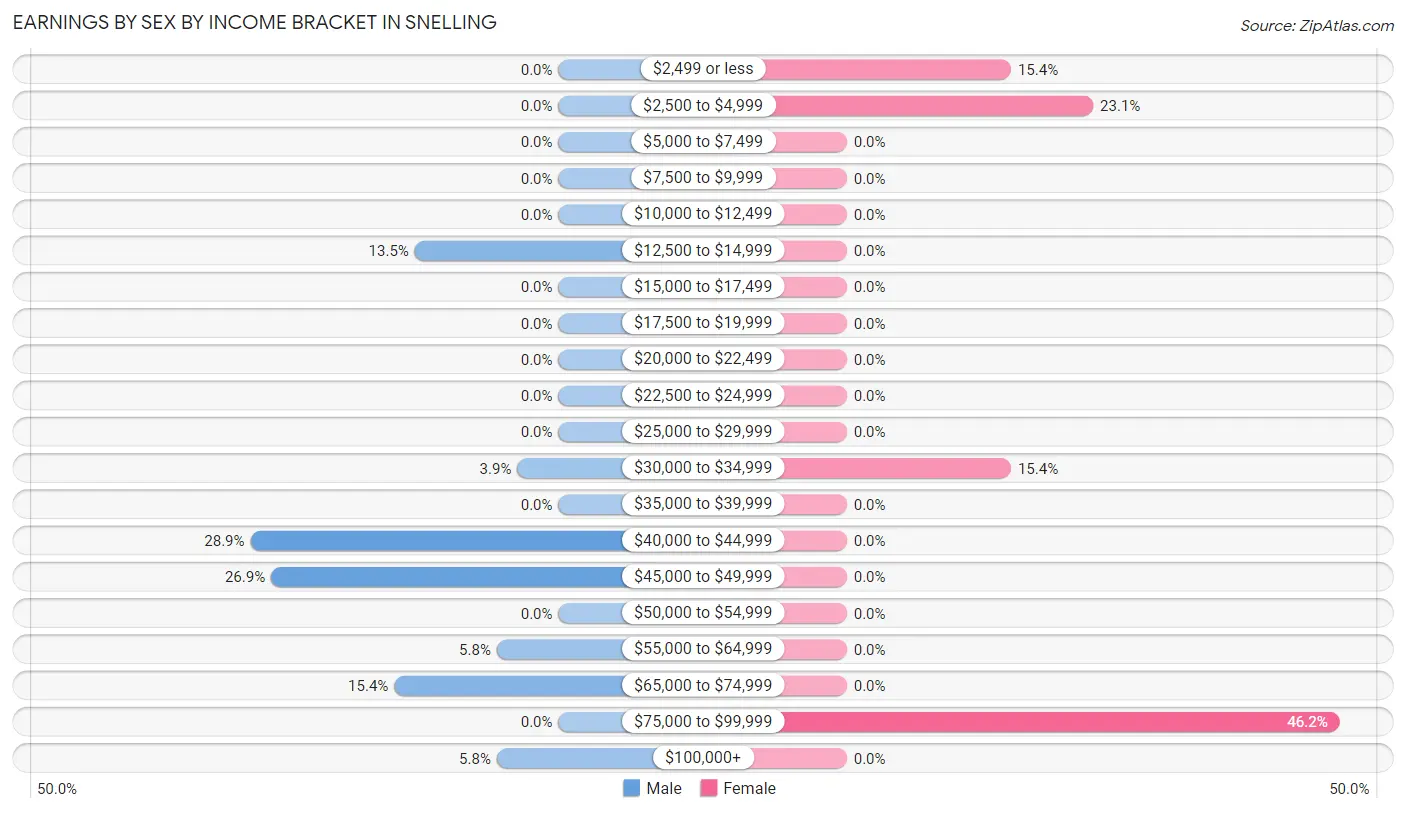
| Income | Male | Female |
| $2,499 or less | 0 (0.0%) | 2 (15.4%) |
| $2,500 to $4,999 | 0 (0.0%) | 3 (23.1%) |
| $5,000 to $7,499 | 0 (0.0%) | 0 (0.0%) |
| $7,500 to $9,999 | 0 (0.0%) | 0 (0.0%) |
| $10,000 to $12,499 | 0 (0.0%) | 0 (0.0%) |
| $12,500 to $14,999 | 7 (13.5%) | 0 (0.0%) |
| $15,000 to $17,499 | 0 (0.0%) | 0 (0.0%) |
| $17,500 to $19,999 | 0 (0.0%) | 0 (0.0%) |
| $20,000 to $22,499 | 0 (0.0%) | 0 (0.0%) |
| $22,500 to $24,999 | 0 (0.0%) | 0 (0.0%) |
| $25,000 to $29,999 | 0 (0.0%) | 0 (0.0%) |
| $30,000 to $34,999 | 2 (3.8%) | 2 (15.4%) |
| $35,000 to $39,999 | 0 (0.0%) | 0 (0.0%) |
| $40,000 to $44,999 | 15 (28.8%) | 0 (0.0%) |
| $45,000 to $49,999 | 14 (26.9%) | 0 (0.0%) |
| $50,000 to $54,999 | 0 (0.0%) | 0 (0.0%) |
| $55,000 to $64,999 | 3 (5.8%) | 0 (0.0%) |
| $65,000 to $74,999 | 8 (15.4%) | 0 (0.0%) |
| $75,000 to $99,999 | 0 (0.0%) | 6 (46.2%) |
| $100,000+ | 3 (5.8%) | 0 (0.0%) |
| Total | 52 (100.0%) | 13 (100.0%) |
Earnings by Sex by Educational Attainment in Snelling
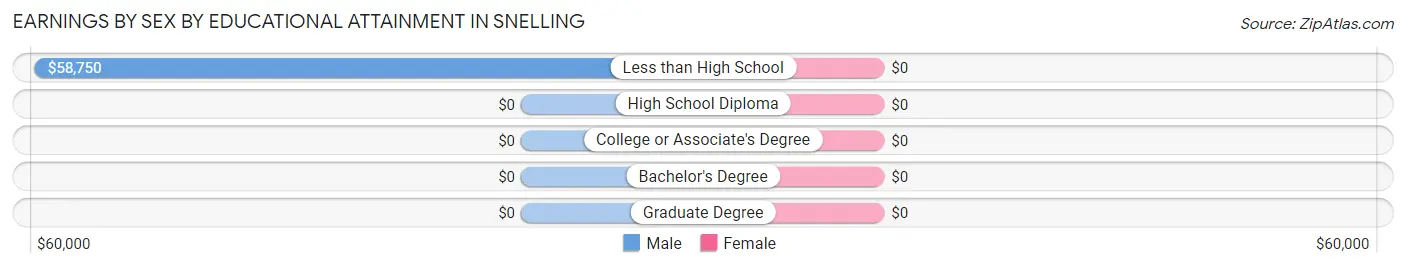
| Educational Attainment | Male Income | Female Income |
| Less than High School | $58,750 | $0 |
| High School Diploma | - | - |
| College or Associate's Degree | - | - |
| Bachelor's Degree | - | - |
| Graduate Degree | - | - |
| Total | $44,643 | $0 |
Family Income in Snelling
Family Income Brackets in Snelling
According to the Snelling family income data, there are 20 families falling into the $35,000 to $49,999 income range, which is the most common income bracket and makes up 48.8% of all families.
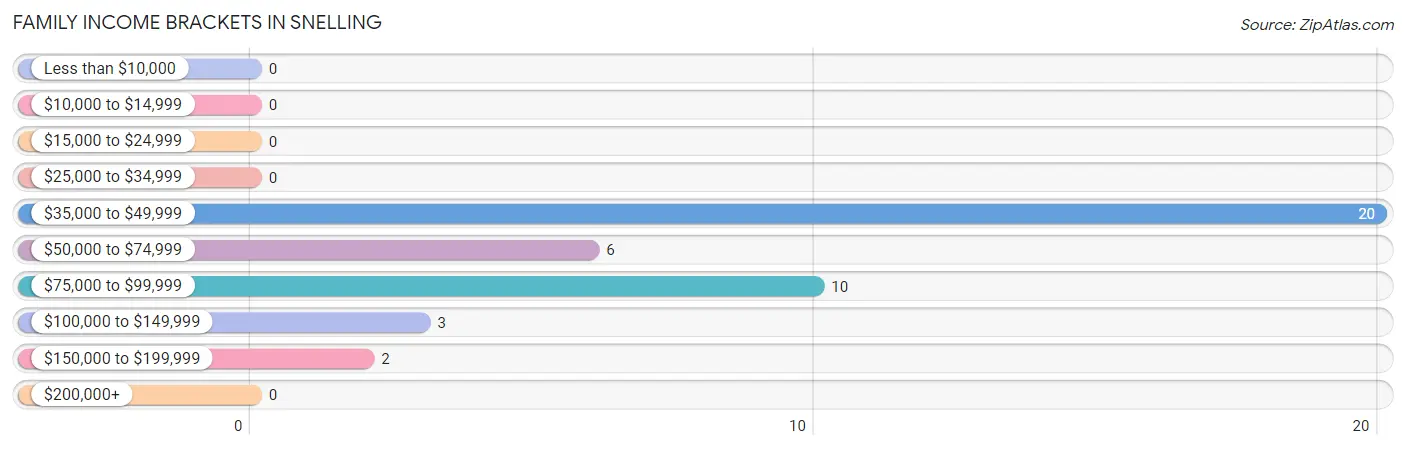
| Income Bracket | # Families | % Families |
| Less than $10,000 | 0 | 0.0% |
| $10,000 to $14,999 | 0 | 0.0% |
| $15,000 to $24,999 | 0 | 0.0% |
| $25,000 to $34,999 | 0 | 0.0% |
| $35,000 to $49,999 | 20 | 48.8% |
| $50,000 to $74,999 | 6 | 14.6% |
| $75,000 to $99,999 | 10 | 24.4% |
| $100,000 to $149,999 | 3 | 7.3% |
| $150,000 to $199,999 | 2 | 4.9% |
| $200,000+ | 0 | 0.0% |
Family Income by Famaliy Size in Snelling
2-person families (23 | 56.1%) account for the highest median family income in Snelling with $87,708 per family, while 2-person families (23 | 56.1%) have the highest median income of $43,854 per family member.
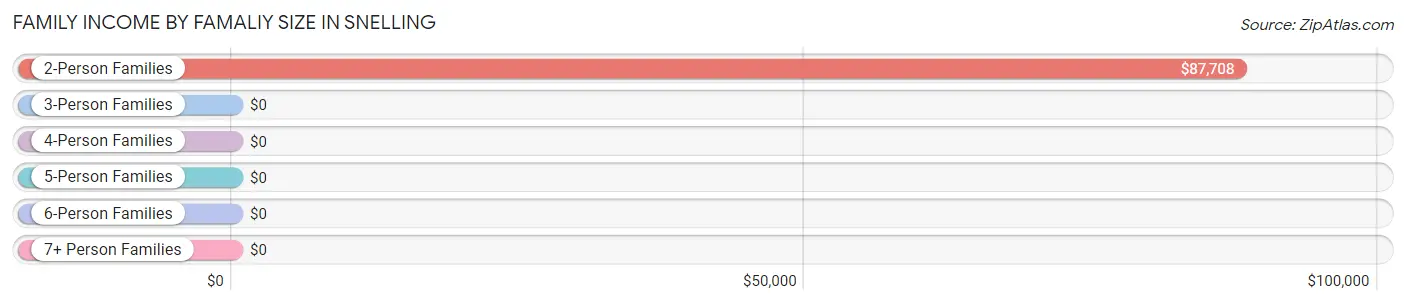
| Income Bracket | # Families | Median Income |
| 2-Person Families | 23 (56.1%) | $87,708 |
| 3-Person Families | 11 (26.8%) | $0 |
| 4-Person Families | 0 (0.0%) | $0 |
| 5-Person Families | 0 (0.0%) | $0 |
| 6-Person Families | 7 (17.1%) | $0 |
| 7+ Person Families | 0 (0.0%) | $0 |
| Total | 41 (100.0%) | $67,708 |
Family Income by Number of Earners in Snelling
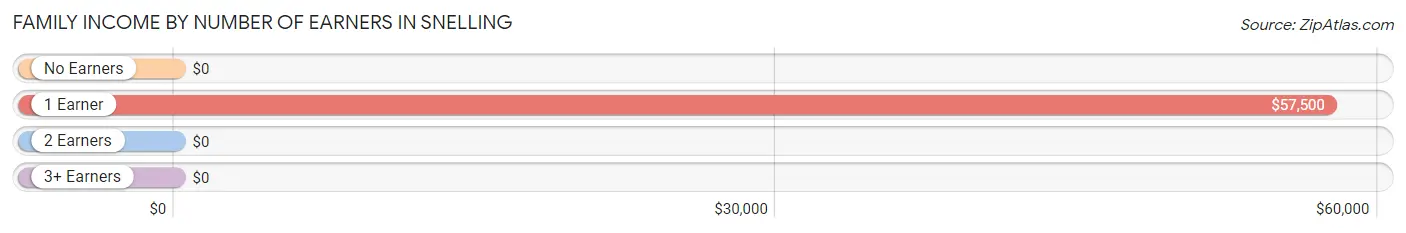
| Number of Earners | # Families | Median Income |
| No Earners | 5 (12.2%) | $0 |
| 1 Earner | 30 (73.2%) | $57,500 |
| 2 Earners | 6 (14.6%) | $0 |
| 3+ Earners | 0 (0.0%) | $0 |
| Total | 41 (100.0%) | $67,708 |
Household Income in Snelling
Household Income Brackets in Snelling
With 29 households falling in the category, the $35,000 to $49,999 income range is the most frequent in Snelling, accounting for 39.7% of all households.
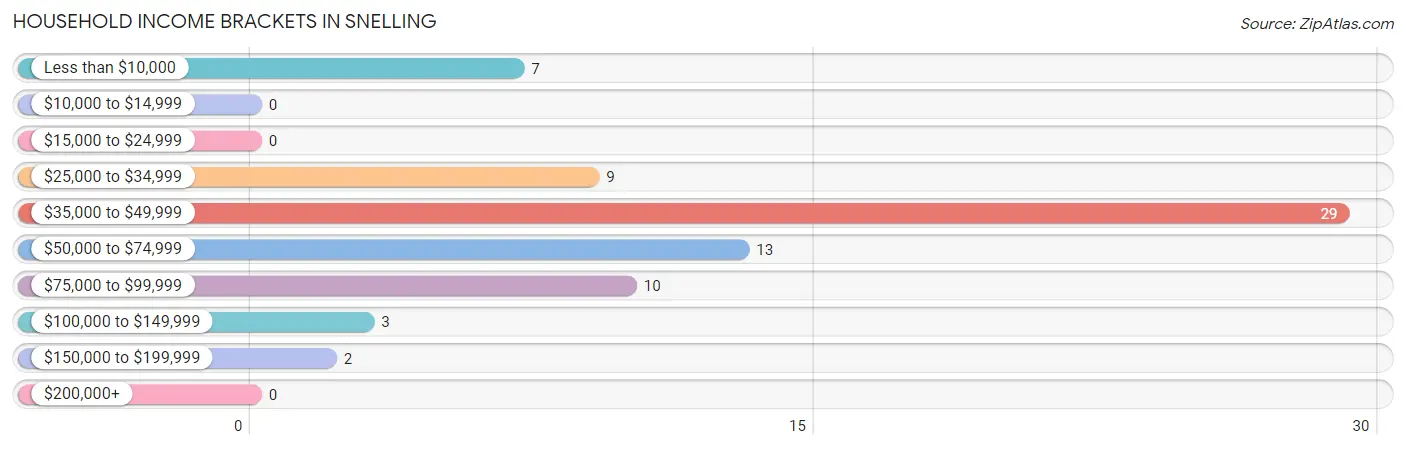
| Income Bracket | # Households | % Households |
| Less than $10,000 | 7 | 9.6% |
| $10,000 to $14,999 | 0 | 0.0% |
| $15,000 to $24,999 | 0 | 0.0% |
| $25,000 to $34,999 | 9 | 12.3% |
| $35,000 to $49,999 | 29 | 39.7% |
| $50,000 to $74,999 | 13 | 17.8% |
| $75,000 to $99,999 | 10 | 13.7% |
| $100,000 to $149,999 | 3 | 4.1% |
| $150,000 to $199,999 | 2 | 2.7% |
| $200,000+ | 0 | 0.0% |
Household Income by Householder Age in Snelling
The median household income in Snelling is $44,861, with the highest median household income of $44,464 found in the 45 to 64 years age bracket for the primary householder. A total of 21 households (28.8%) fall into this category. Meanwhile, the 15 to 24 years age bracket for the primary householder has the lowest median household income of $0, with 6 households (8.2%) in this group.
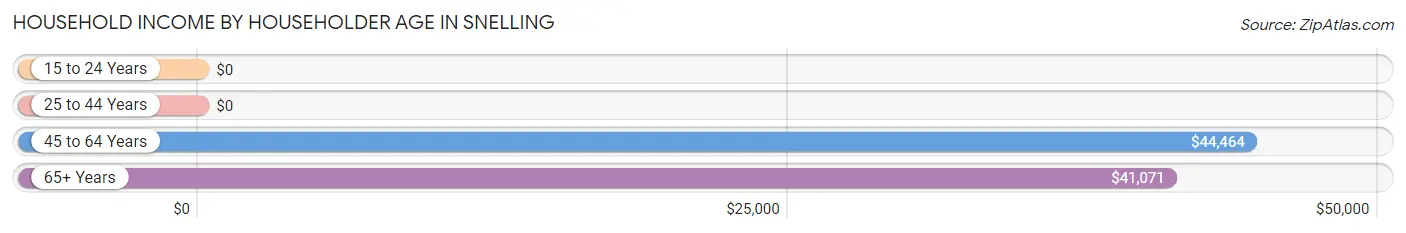
| Income Bracket | # Households | Median Income |
| 15 to 24 Years | 6 (8.2%) | $0 |
| 25 to 44 Years | 22 (30.1%) | $0 |
| 45 to 64 Years | 21 (28.8%) | $44,464 |
| 65+ Years | 24 (32.9%) | $41,071 |
| Total | 73 (100.0%) | $44,861 |
Poverty in Snelling
Income Below Poverty by Sex and Age in Snelling
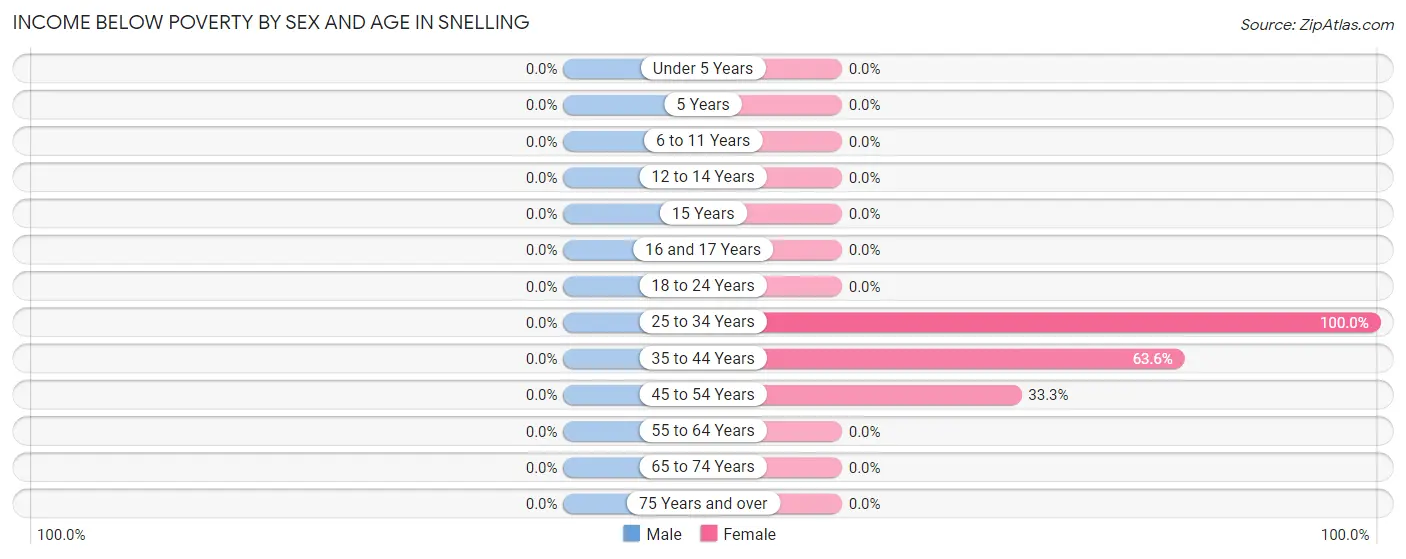
| Age Bracket | Male | Female |
| Under 5 Years | 0 (0.0%) | 0 (0.0%) |
| 5 Years | 0 (0.0%) | 0 (0.0%) |
| 6 to 11 Years | 0 (0.0%) | 0 (0.0%) |
| 12 to 14 Years | 0 (0.0%) | 0 (0.0%) |
| 15 Years | 0 (0.0%) | 0 (0.0%) |
| 16 and 17 Years | 0 (0.0%) | 0 (0.0%) |
| 18 to 24 Years | 0 (0.0%) | 0 (0.0%) |
| 25 to 34 Years | 0 (0.0%) | 6 (100.0%) |
| 35 to 44 Years | 0 (0.0%) | 7 (63.6%) |
| 45 to 54 Years | 0 (0.0%) | 3 (33.3%) |
| 55 to 64 Years | 0 (0.0%) | 0 (0.0%) |
| 65 to 74 Years | 0 (0.0%) | 0 (0.0%) |
| 75 Years and over | 0 (0.0%) | 0 (0.0%) |
| Total | 0 (0.0%) | 16 (26.2%) |
Income Above Poverty by Sex and Age in Snelling
According to the poverty statistics in Snelling, males aged under 5 years and females aged 16 and 17 years are the age groups that are most secure financially, with 100.0% of males and 100.0% of females in these age groups living above the poverty line.
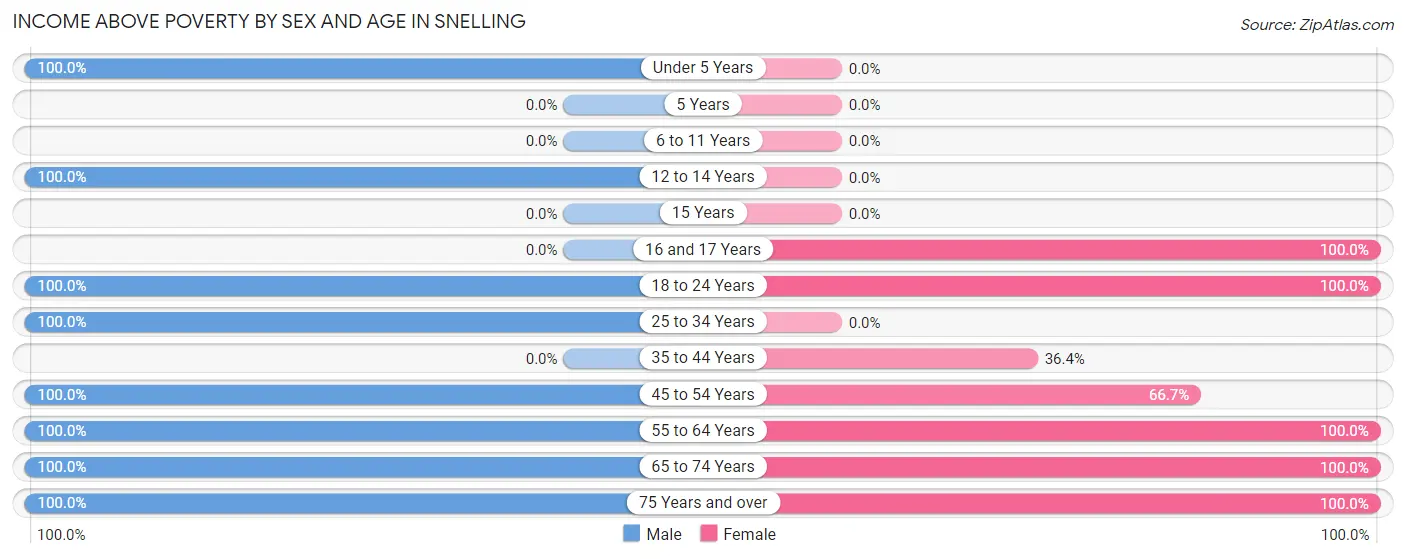
| Age Bracket | Male | Female |
| Under 5 Years | 28 (100.0%) | 0 (0.0%) |
| 5 Years | 0 (0.0%) | 0 (0.0%) |
| 6 to 11 Years | 0 (0.0%) | 0 (0.0%) |
| 12 to 14 Years | 5 (100.0%) | 0 (0.0%) |
| 15 Years | 0 (0.0%) | 0 (0.0%) |
| 16 and 17 Years | 0 (0.0%) | 7 (100.0%) |
| 18 to 24 Years | 19 (100.0%) | 9 (100.0%) |
| 25 to 34 Years | 11 (100.0%) | 0 (0.0%) |
| 35 to 44 Years | 0 (0.0%) | 4 (36.4%) |
| 45 to 54 Years | 18 (100.0%) | 6 (66.7%) |
| 55 to 64 Years | 15 (100.0%) | 11 (100.0%) |
| 65 to 74 Years | 9 (100.0%) | 6 (100.0%) |
| 75 Years and over | 9 (100.0%) | 2 (100.0%) |
| Total | 114 (100.0%) | 45 (73.8%) |
Income Below Poverty Among Married-Couple Families in Snelling
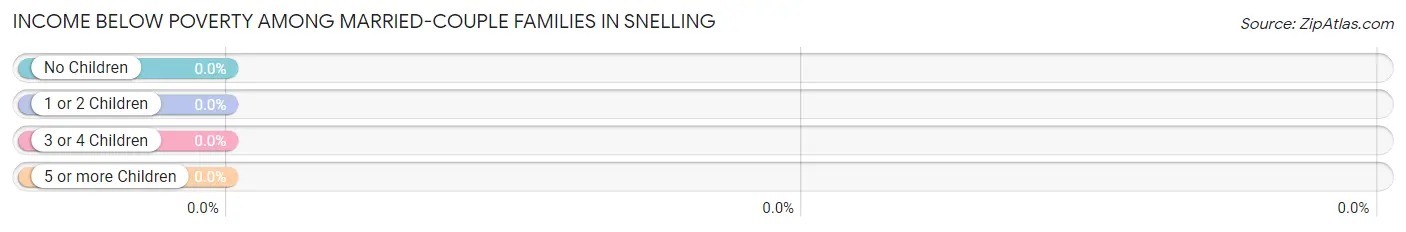
| Children | Above Poverty | Below Poverty |
| No Children | 13 (100.0%) | 0 (0.0%) |
| 1 or 2 Children | 10 (100.0%) | 0 (0.0%) |
| 3 or 4 Children | 0 (0.0%) | 0 (0.0%) |
| 5 or more Children | 0 (0.0%) | 0 (0.0%) |
| Total | 23 (100.0%) | 0 (0.0%) |
Income Below Poverty Among Single-Parent Households in Snelling
| Children | Single Father | Single Mother |
| No Children | 0 (0.0%) | 0 (0.0%) |
| 1 or 2 Children | 0 (0.0%) | 0 (0.0%) |
| 3 or 4 Children | 0 (0.0%) | 0 (0.0%) |
| 5 or more Children | 0 (0.0%) | 0 (0.0%) |
| Total | 0 (0.0%) | 0 (0.0%) |
Income Below Poverty Among Married-Couple vs Single-Parent Households in Snelling
| Children | Married-Couple Families | Single-Parent Households |
| No Children | 0 (0.0%) | 0 (0.0%) |
| 1 or 2 Children | 0 (0.0%) | 0 (0.0%) |
| 3 or 4 Children | 0 (0.0%) | 0 (0.0%) |
| 5 or more Children | 0 (0.0%) | 0 (0.0%) |
| Total | 0 (0.0%) | 0 (0.0%) |
Race in Snelling
The most populous races in Snelling are White / Caucasian (115 | 64.6%), Hispanic or Latino (92 | 51.7%), and Some other Race (63 | 35.4%).
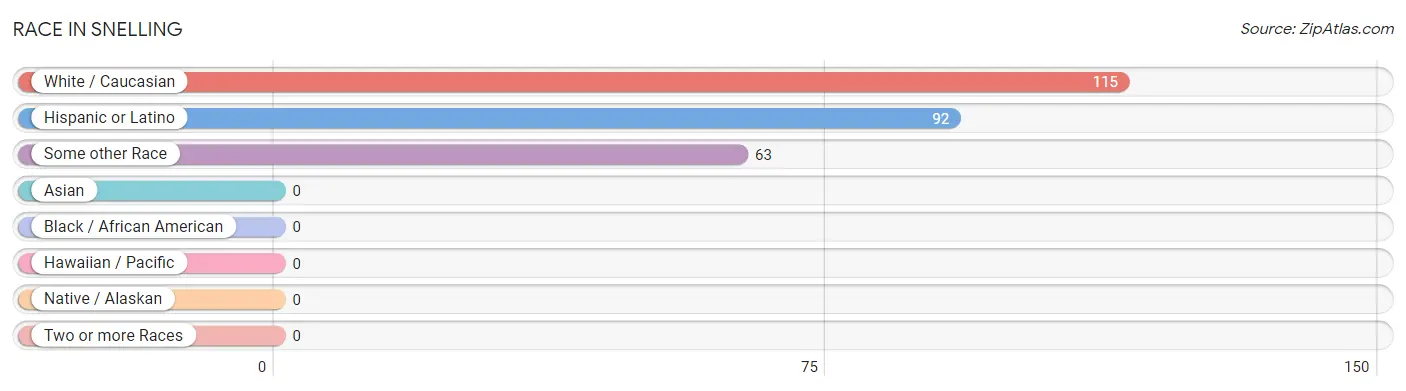
| Race | # Population | % Population |
| Asian | 0 | 0.0% |
| Black / African American | 0 | 0.0% |
| Hawaiian / Pacific | 0 | 0.0% |
| Hispanic or Latino | 92 | 51.7% |
| Native / Alaskan | 0 | 0.0% |
| White / Caucasian | 115 | 64.6% |
| Two or more Races | 0 | 0.0% |
| Some other Race | 63 | 35.4% |
| Total | 178 | 100.0% |
Ancestry in Snelling
The most populous ancestries reported in Snelling are Mexican (89 | 50.0%), German (25 | 14.0%), European (16 | 9.0%), Portuguese (16 | 9.0%), and English (15 | 8.4%), together accounting for 90.4% of all Snelling residents.
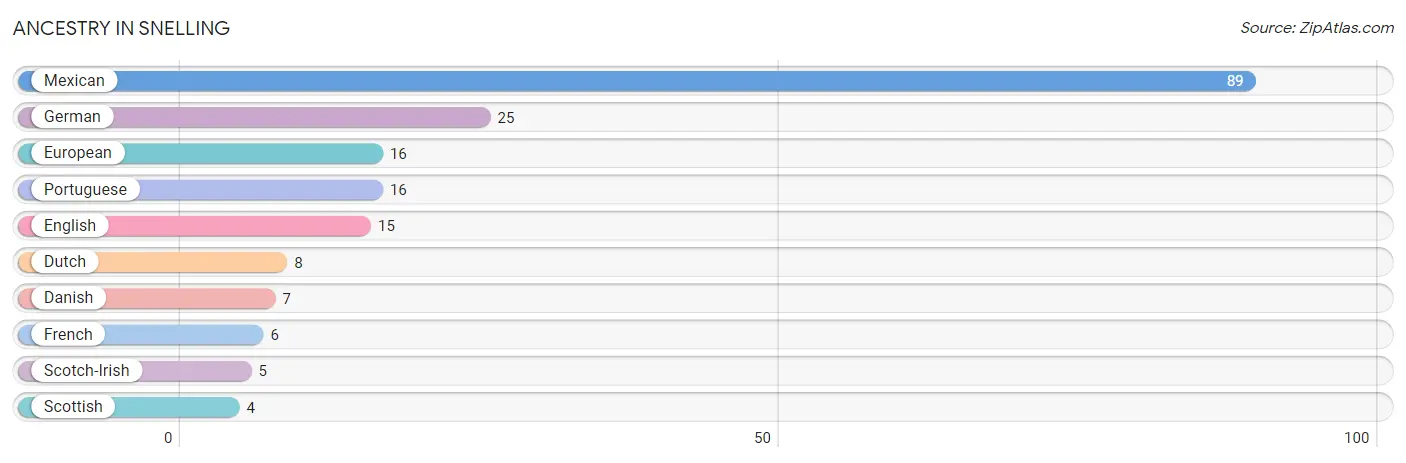
| Ancestry | # Population | % Population |
| Danish | 7 | 3.9% |
| Dutch | 8 | 4.5% |
| English | 15 | 8.4% |
| European | 16 | 9.0% |
| French | 6 | 3.4% |
| German | 25 | 14.0% |
| Mexican | 89 | 50.0% |
| Portuguese | 16 | 9.0% |
| Scotch-Irish | 5 | 2.8% |
| Scottish | 4 | 2.2% | View All 10 Rows |
Immigrants in Snelling
The most numerous immigrant groups reported in Snelling came from Central America (14 | 7.9%), Latin America (14 | 7.9%), and Mexico (14 | 7.9%), together accounting for 23.6% of all Snelling residents.
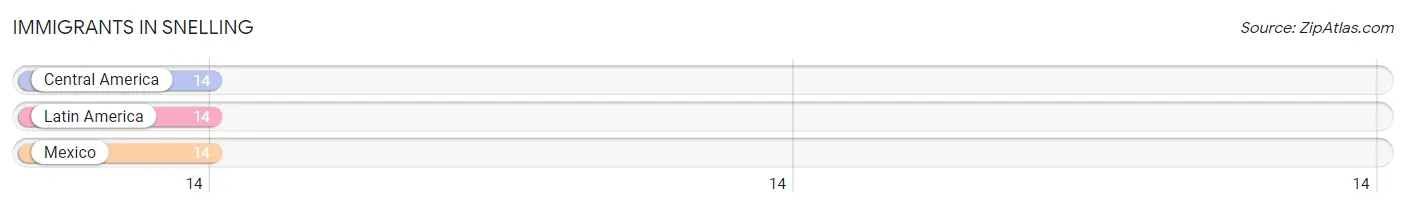
| Immigration Origin | # Population | % Population |
| Central America | 14 | 7.9% |
| Latin America | 14 | 7.9% |
| Mexico | 14 | 7.9% | View All 3 Rows |
Sex and Age in Snelling
Sex and Age in Snelling
The most populous age groups in Snelling are Under 5 Years (28 | 23.9%) for men and 40 to 44 Years (11 | 18.0%) for women.
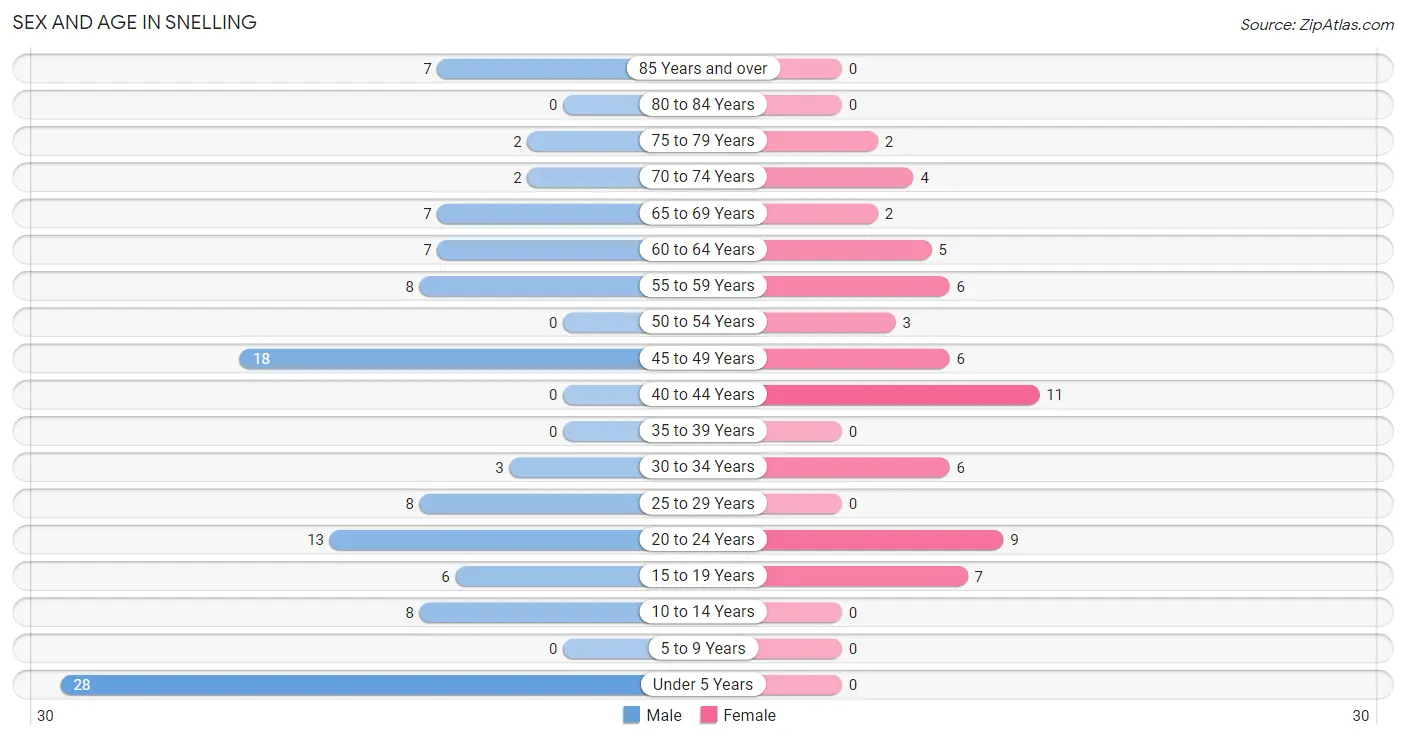
| Age Bracket | Male | Female |
| Under 5 Years | 28 (23.9%) | 0 (0.0%) |
| 5 to 9 Years | 0 (0.0%) | 0 (0.0%) |
| 10 to 14 Years | 8 (6.8%) | 0 (0.0%) |
| 15 to 19 Years | 6 (5.1%) | 7 (11.5%) |
| 20 to 24 Years | 13 (11.1%) | 9 (14.7%) |
| 25 to 29 Years | 8 (6.8%) | 0 (0.0%) |
| 30 to 34 Years | 3 (2.6%) | 6 (9.8%) |
| 35 to 39 Years | 0 (0.0%) | 0 (0.0%) |
| 40 to 44 Years | 0 (0.0%) | 11 (18.0%) |
| 45 to 49 Years | 18 (15.4%) | 6 (9.8%) |
| 50 to 54 Years | 0 (0.0%) | 3 (4.9%) |
| 55 to 59 Years | 8 (6.8%) | 6 (9.8%) |
| 60 to 64 Years | 7 (6.0%) | 5 (8.2%) |
| 65 to 69 Years | 7 (6.0%) | 2 (3.3%) |
| 70 to 74 Years | 2 (1.7%) | 4 (6.6%) |
| 75 to 79 Years | 2 (1.7%) | 2 (3.3%) |
| 80 to 84 Years | 0 (0.0%) | 0 (0.0%) |
| 85 Years and over | 7 (6.0%) | 0 (0.0%) |
| Total | 117 (100.0%) | 61 (100.0%) |
Families and Households in Snelling
Median Family Size in Snelling
The median family size in Snelling is 3.27 persons per family, with married-couple families (23 | 56.1%) accounting for the largest median family size of 3.83 persons per family. On the other hand, single female/mother families (4 | 9.8%) represent the smallest median family size with 2.25 persons per family.
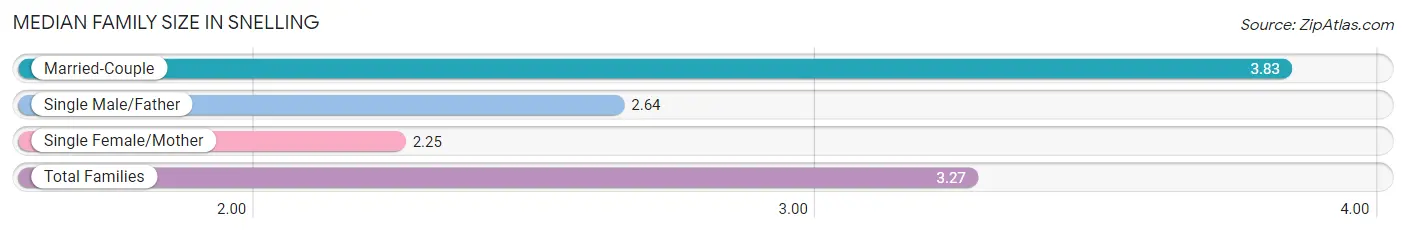
| Family Type | # Families | Family Size |
| Married-Couple | 23 (56.1%) | 3.83 |
| Single Male/Father | 14 (34.2%) | 2.64 |
| Single Female/Mother | 4 (9.8%) | 2.25 |
| Total Families | 41 (100.0%) | 3.27 |
Median Household Size in Snelling
The median household size in Snelling is 2.44 persons per household, with married-couple households (23 | 31.5%) accounting for the largest median household size of 3.83 persons per household. non-family households (32 | 43.8%) represent the smallest median household size with 1.19 persons per household.
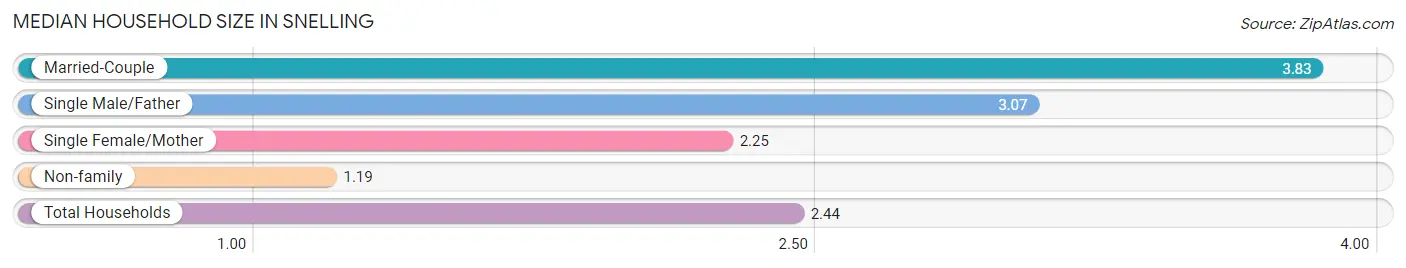
| Household Type | # Households | Household Size |
| Married-Couple | 23 (31.5%) | 3.83 |
| Single Male/Father | 14 (19.2%) | 3.07 |
| Single Female/Mother | 4 (5.5%) | 2.25 |
| Non-family | 32 (43.8%) | 1.19 |
| Total Households | 73 (100.0%) | 2.44 |
Household Size by Marriage Status in Snelling
Out of a total of 73 households in Snelling, 41 (56.2%) are family households, while 32 (43.8%) are nonfamily households. The most numerous type of family households are 2-person households, comprising 23, and the most common type of nonfamily households are 1-person households, comprising 29.
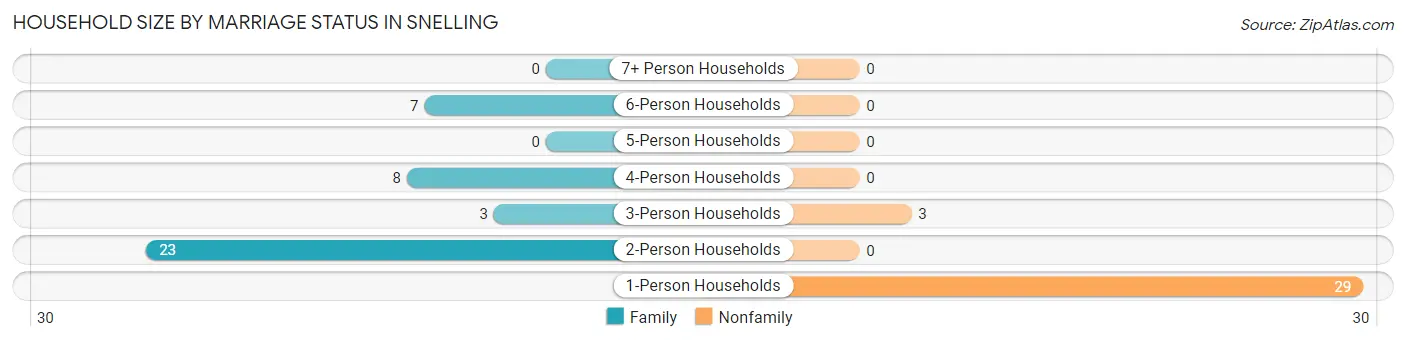
| Household Size | Family Households | Nonfamily Households |
| 1-Person Households | - | 29 (39.7%) |
| 2-Person Households | 23 (31.5%) | 0 (0.0%) |
| 3-Person Households | 3 (4.1%) | 3 (4.1%) |
| 4-Person Households | 8 (11.0%) | 0 (0.0%) |
| 5-Person Households | 0 (0.0%) | 0 (0.0%) |
| 6-Person Households | 7 (9.6%) | 0 (0.0%) |
| 7+ Person Households | 0 (0.0%) | 0 (0.0%) |
| Total | 41 (56.2%) | 32 (43.8%) |
Female Fertility in Snelling
Fertility by Age in Snelling
Average fertility rate in Snelling is 154.0 births per 1,000 women. Women in the age bracket of 20 to 34 years have the highest fertility rate with 400.0 births per 1,000 women. Women in the age bracket of 20 to 34 years acount for 100.0% of all women with births.
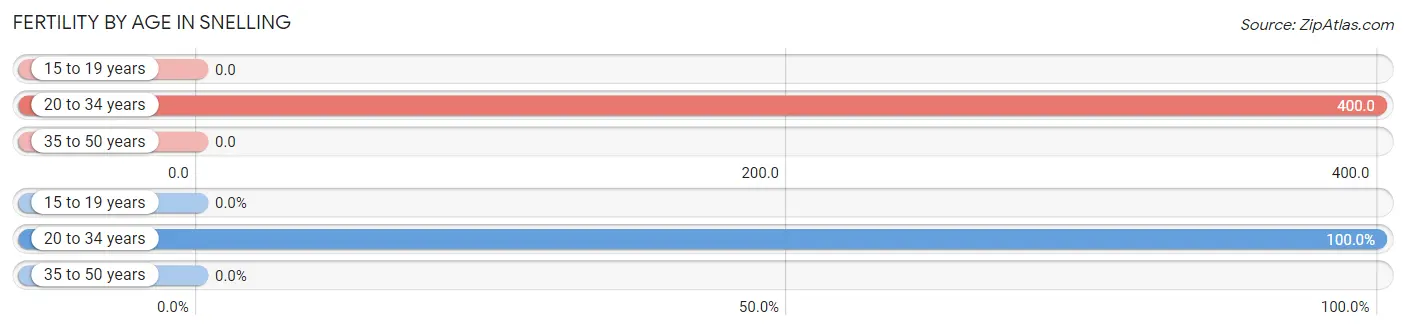
| Age Bracket | Women with Births | Births / 1,000 Women |
| 15 to 19 years | 0 (0.0%) | 0.0 |
| 20 to 34 years | 6 (100.0%) | 400.0 |
| 35 to 50 years | 0 (0.0%) | 0.0 |
| Total | 6 (100.0%) | 154.0 |
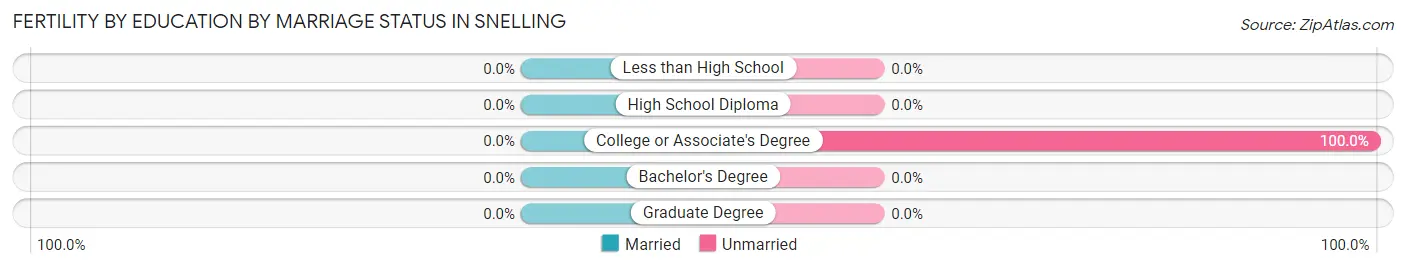
Fertility by Age by Marriage Status in Snelling
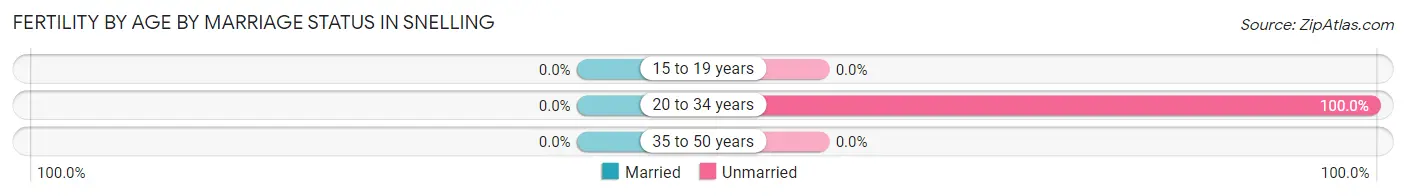
| Age Bracket | Married | Unmarried |
| 15 to 19 years | 0 (0.0%) | 0 (0.0%) |
| 20 to 34 years | 0 (0.0%) | 6 (100.0%) |
| 35 to 50 years | 0 (0.0%) | 0 (0.0%) |
| Total | 0 (0.0%) | 6 (100.0%) |
Fertility by Education in Snelling
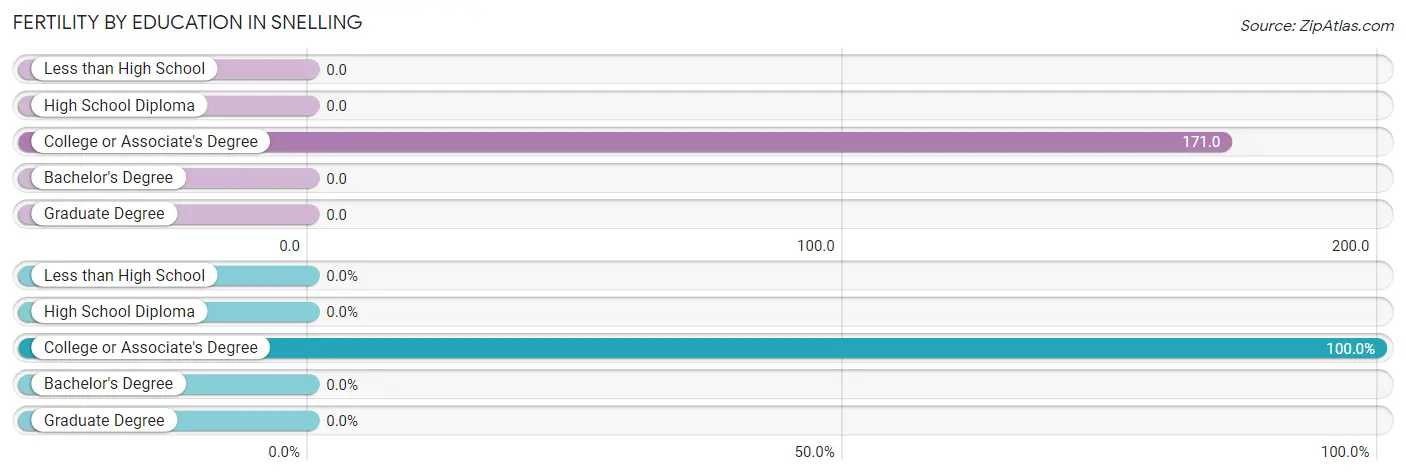
| Educational Attainment | Women with Births | Births / 1,000 Women |
| Less than High School | 0 (0.0%) | 0.0 |
| High School Diploma | 0 (0.0%) | 0.0 |
| College or Associate's Degree | 6 (100.0%) | 171.0 |
| Bachelor's Degree | 0 (0.0%) | 0.0 |
| Graduate Degree | 0 (0.0%) | 0.0 |
| Total | 6 (100.0%) | 154.0 |
Fertility by Education by Marriage Status in Snelling
| Educational Attainment | Married | Unmarried |
| Less than High School | 0 (0.0%) | 0 (0.0%) |
| High School Diploma | 0 (0.0%) | 0 (0.0%) |
| College or Associate's Degree | 0 (0.0%) | 6 (100.0%) |
| Bachelor's Degree | 0 (0.0%) | 0 (0.0%) |
| Graduate Degree | 0 (0.0%) | 0 (0.0%) |
| Total | 0 (0.0%) | 6 (100.0%) |
Employment Characteristics in Snelling
Employment by Class of Employer in Snelling
Among the 59 employed individuals in Snelling, private company employees (28 | 47.5%), local government employees (11 | 18.6%), and self-employed (not incorporated) (9 | 15.2%) make up the most common classes of employment.
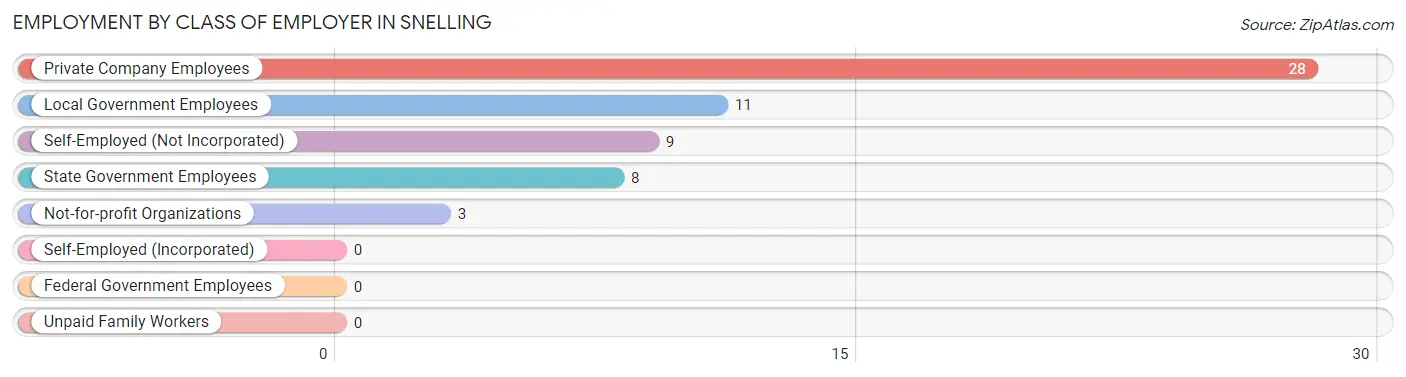
| Employer Class | # Employees | % Employees |
| Private Company Employees | 28 | 47.5% |
| Self-Employed (Incorporated) | 0 | 0.0% |
| Self-Employed (Not Incorporated) | 9 | 15.2% |
| Not-for-profit Organizations | 3 | 5.1% |
| Local Government Employees | 11 | 18.6% |
| State Government Employees | 8 | 13.6% |
| Federal Government Employees | 0 | 0.0% |
| Unpaid Family Workers | 0 | 0.0% |
| Total | 59 | 100.0% |
Employment Status by Age in Snelling
According to the labor force statistics for Snelling, out of the total population over 16 years of age (142), 47.9% or 68 individuals are in the labor force, with 13.2% or 9 of them unemployed. The age group with the highest labor force participation rate is 25 to 29 years, with 100.0% or 8 individuals in the labor force. Within the labor force, the 35 to 44 years age range has the highest percentage of unemployed individuals, with 63.6% or 7 of them being unemployed.
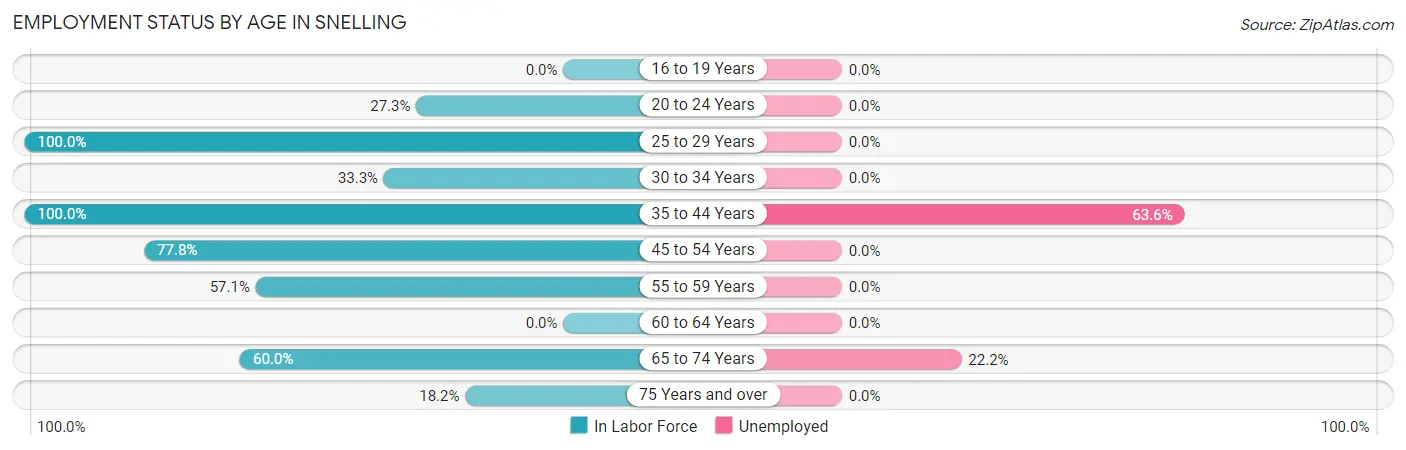
| Age Bracket | In Labor Force | Unemployed |
| 16 to 19 Years | 0 (0.0%) | 0 (0.0%) |
| 20 to 24 Years | 6 (27.3%) | 0 (0.0%) |
| 25 to 29 Years | 8 (100.0%) | 0 (0.0%) |
| 30 to 34 Years | 3 (33.3%) | 0 (0.0%) |
| 35 to 44 Years | 11 (100.0%) | 7 (63.6%) |
| 45 to 54 Years | 21 (77.8%) | 0 (0.0%) |
| 55 to 59 Years | 8 (57.1%) | 0 (0.0%) |
| 60 to 64 Years | 0 (0.0%) | 0 (0.0%) |
| 65 to 74 Years | 9 (60.0%) | 2 (22.2%) |
| 75 Years and over | 2 (18.2%) | 0 (0.0%) |
| Total | 68 (47.9%) | 9 (13.2%) |
Employment Status by Educational Attainment in Snelling
According to labor force statistics for Snelling, 63.0% of individuals (51) out of the total population between 25 and 64 years of age (81) are in the labor force, with 13.7% or 7 of them being unemployed. The group with the highest labor force participation rate are those with the educational attainment of high school diploma, with 100.0% or 7 individuals in the labor force. Within the labor force, individuals with college / associate degree education have the highest percentage of unemployment, with 38.9% or 7 of them being unemployed.
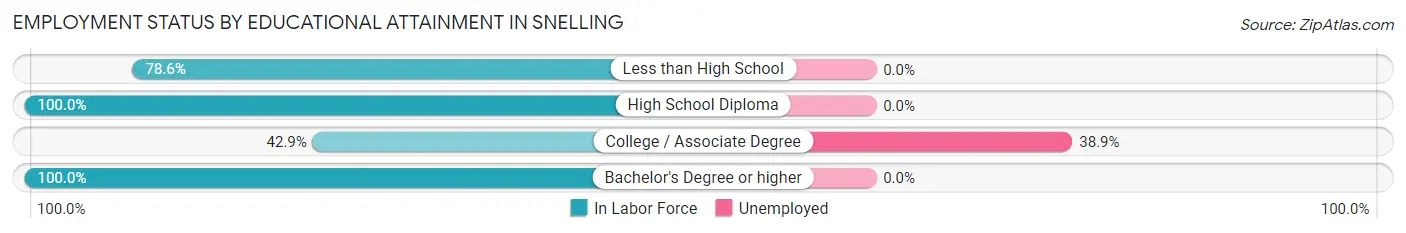
| Educational Attainment | In Labor Force | Unemployed |
| Less than High School | 22 (78.6%) | 0 (0.0%) |
| High School Diploma | 7 (100.0%) | 0 (0.0%) |
| College / Associate Degree | 18 (42.9%) | 16 (38.9%) |
| Bachelor's Degree or higher | 4 (100.0%) | 0 (0.0%) |
| Total | 51 (63.0%) | 11 (13.7%) |
Employment Occupations by Sex in Snelling
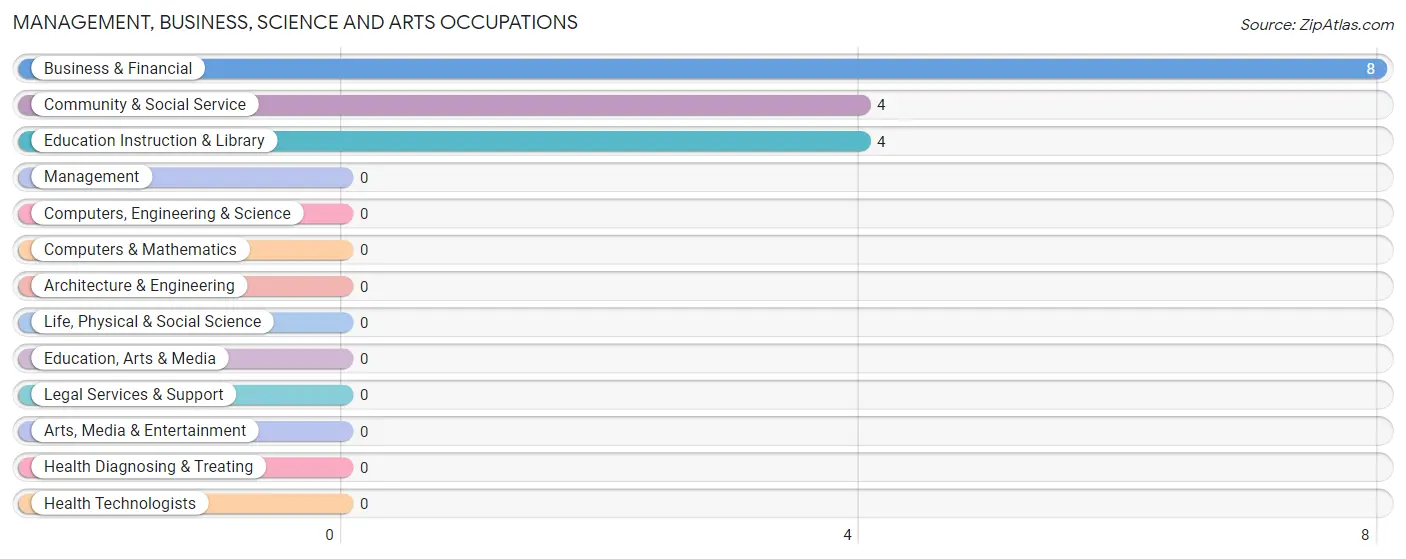
Management, Business, Science and Arts Occupations
The most common Management, Business, Science and Arts occupations in Snelling are Business & Financial (8 | 13.6%), Community & Social Service (4 | 6.8%), and Education Instruction & Library (4 | 6.8%).
Management, Business, Science and Arts Occupations by Sex
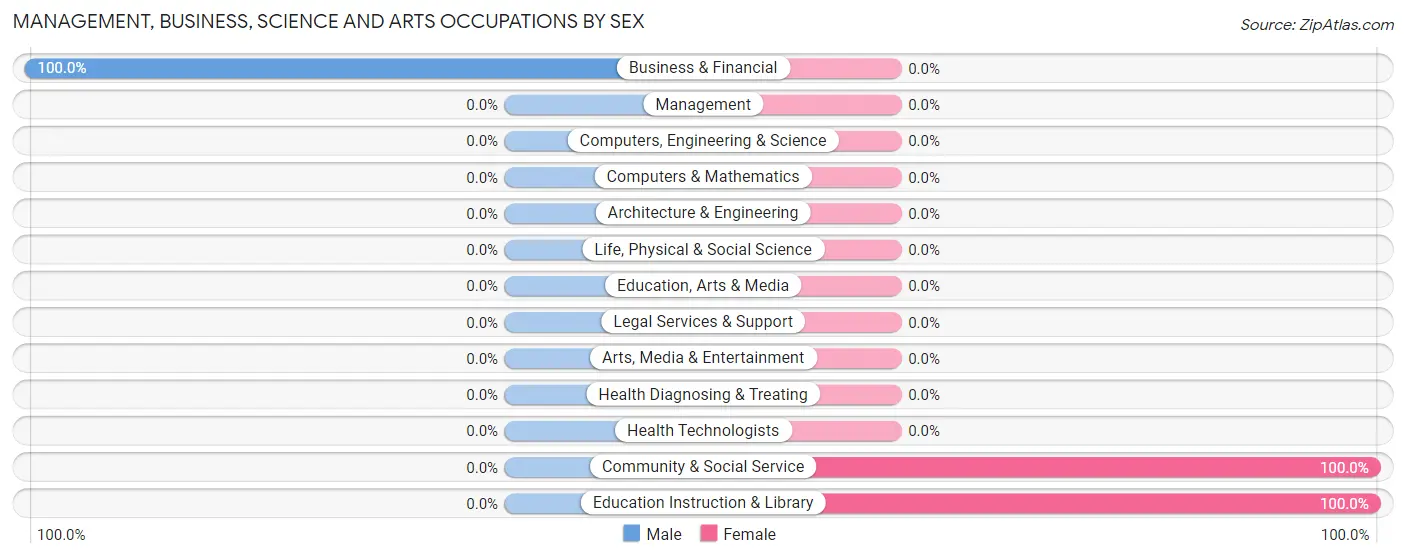
| Occupation | Male | Female |
| Management | 0 (0.0%) | 0 (0.0%) |
| Business & Financial | 8 (100.0%) | 0 (0.0%) |
| Computers, Engineering & Science | 0 (0.0%) | 0 (0.0%) |
| Computers & Mathematics | 0 (0.0%) | 0 (0.0%) |
| Architecture & Engineering | 0 (0.0%) | 0 (0.0%) |
| Life, Physical & Social Science | 0 (0.0%) | 0 (0.0%) |
| Community & Social Service | 0 (0.0%) | 4 (100.0%) |
| Education, Arts & Media | 0 (0.0%) | 0 (0.0%) |
| Legal Services & Support | 0 (0.0%) | 0 (0.0%) |
| Education Instruction & Library | 0 (0.0%) | 4 (100.0%) |
| Arts, Media & Entertainment | 0 (0.0%) | 0 (0.0%) |
| Health Diagnosing & Treating | 0 (0.0%) | 0 (0.0%) |
| Health Technologists | 0 (0.0%) | 0 (0.0%) |
| Total (Category) | 8 (66.7%) | 4 (33.3%) |
| Total (Overall) | 50 (84.8%) | 9 (15.2%) |
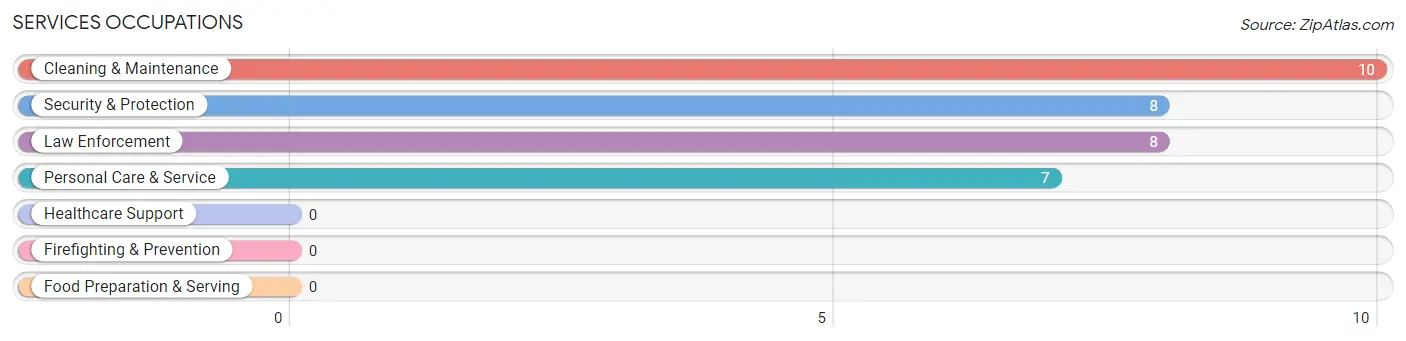
Services Occupations
The most common Services occupations in Snelling are Cleaning & Maintenance (10 | 17.0%), Security & Protection (8 | 13.6%), Law Enforcement (8 | 13.6%), and Personal Care & Service (7 | 11.9%).
Services Occupations by Sex
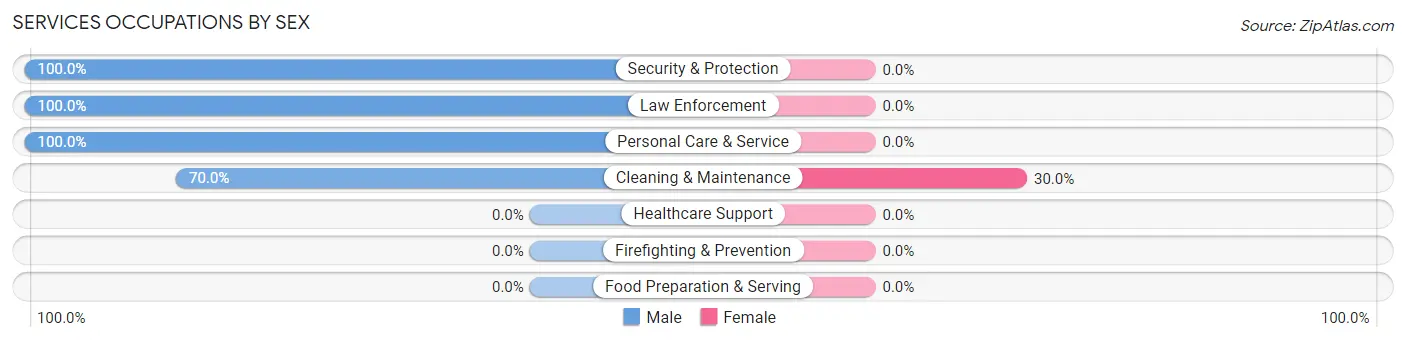
| Occupation | Male | Female |
| Healthcare Support | 0 (0.0%) | 0 (0.0%) |
| Security & Protection | 8 (100.0%) | 0 (0.0%) |
| Firefighting & Prevention | 0 (0.0%) | 0 (0.0%) |
| Law Enforcement | 8 (100.0%) | 0 (0.0%) |
| Food Preparation & Serving | 0 (0.0%) | 0 (0.0%) |
| Cleaning & Maintenance | 7 (70.0%) | 3 (30.0%) |
| Personal Care & Service | 7 (100.0%) | 0 (0.0%) |
| Total (Category) | 22 (88.0%) | 3 (12.0%) |
| Total (Overall) | 50 (84.8%) | 9 (15.2%) |
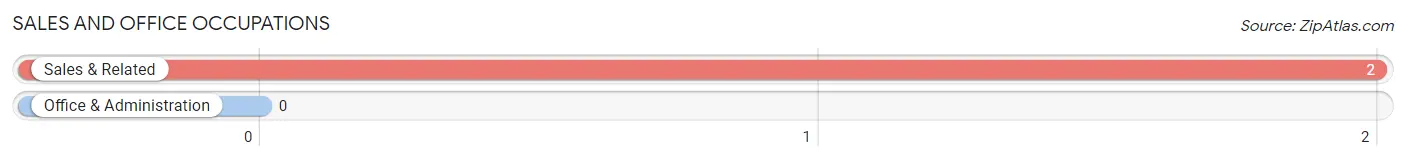
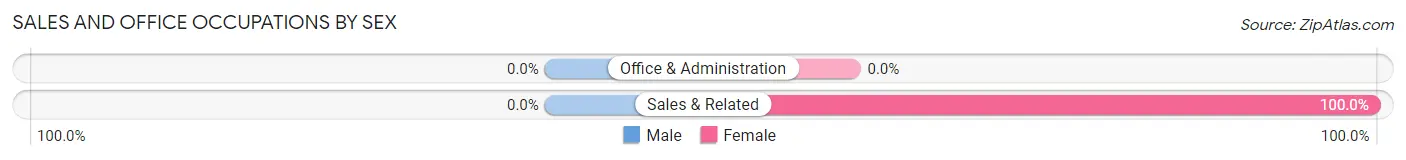
Sales and Office Occupations
The most common Sales and Office occupations in Snelling are , and Sales & Related (2 | 3.4%).
Sales and Office Occupations by Sex
| Occupation | Male | Female |
| Sales & Related | 0 (0.0%) | 2 (100.0%) |
| Office & Administration | 0 (0.0%) | 0 (0.0%) |
| Total (Category) | 0 (0.0%) | 2 (100.0%) |
| Total (Overall) | 50 (84.8%) | 9 (15.2%) |
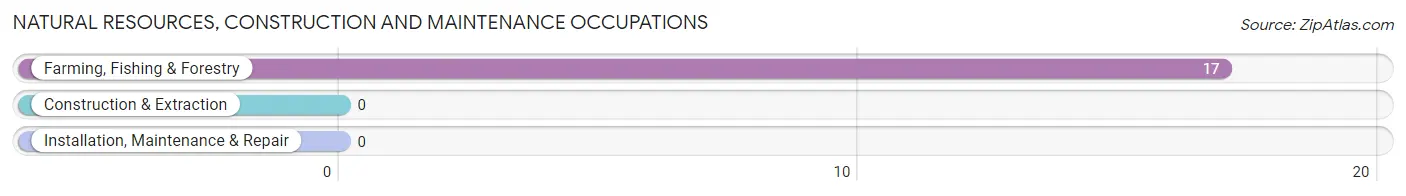
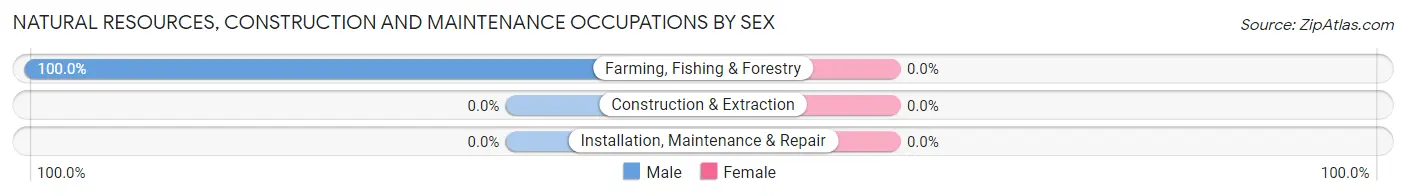
Natural Resources, Construction and Maintenance Occupations
The most common Natural Resources, Construction and Maintenance occupations in Snelling are , and Farming, Fishing & Forestry (17 | 28.8%).
Natural Resources, Construction and Maintenance Occupations by Sex
| Occupation | Male | Female |
| Farming, Fishing & Forestry | 17 (100.0%) | 0 (0.0%) |
| Construction & Extraction | 0 (0.0%) | 0 (0.0%) |
| Installation, Maintenance & Repair | 0 (0.0%) | 0 (0.0%) |
| Total (Category) | 17 (100.0%) | 0 (0.0%) |
| Total (Overall) | 50 (84.8%) | 9 (15.2%) |
Production, Transportation and Moving Occupations
The most common Production, Transportation and Moving occupations in Snelling are , and Production (3 | 5.1%).
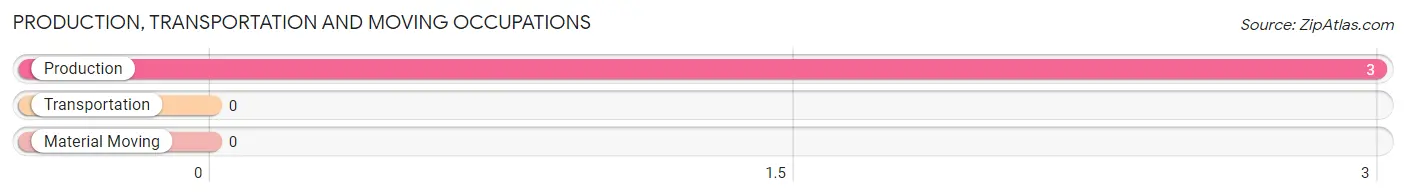
Production, Transportation and Moving Occupations by Sex
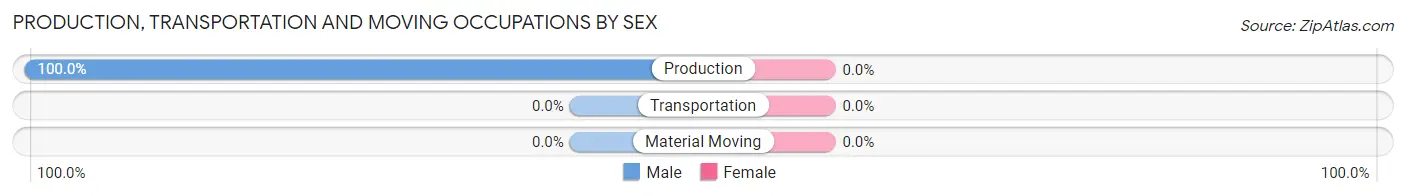
| Occupation | Male | Female |
| Production | 3 (100.0%) | 0 (0.0%) |
| Transportation | 0 (0.0%) | 0 (0.0%) |
| Material Moving | 0 (0.0%) | 0 (0.0%) |
| Total (Category) | 3 (100.0%) | 0 (0.0%) |
| Total (Overall) | 50 (84.8%) | 9 (15.2%) |
Employment Industries by Sex in Snelling
Employment Industries in Snelling
The major employment industries in Snelling include Agriculture, Fishing & Hunting (17 | 28.8%), Administrative & Support (10 | 17.0%), Construction (8 | 13.6%), Public Administration (8 | 13.6%), and Arts, Entertainment & Recreation (7 | 11.9%).
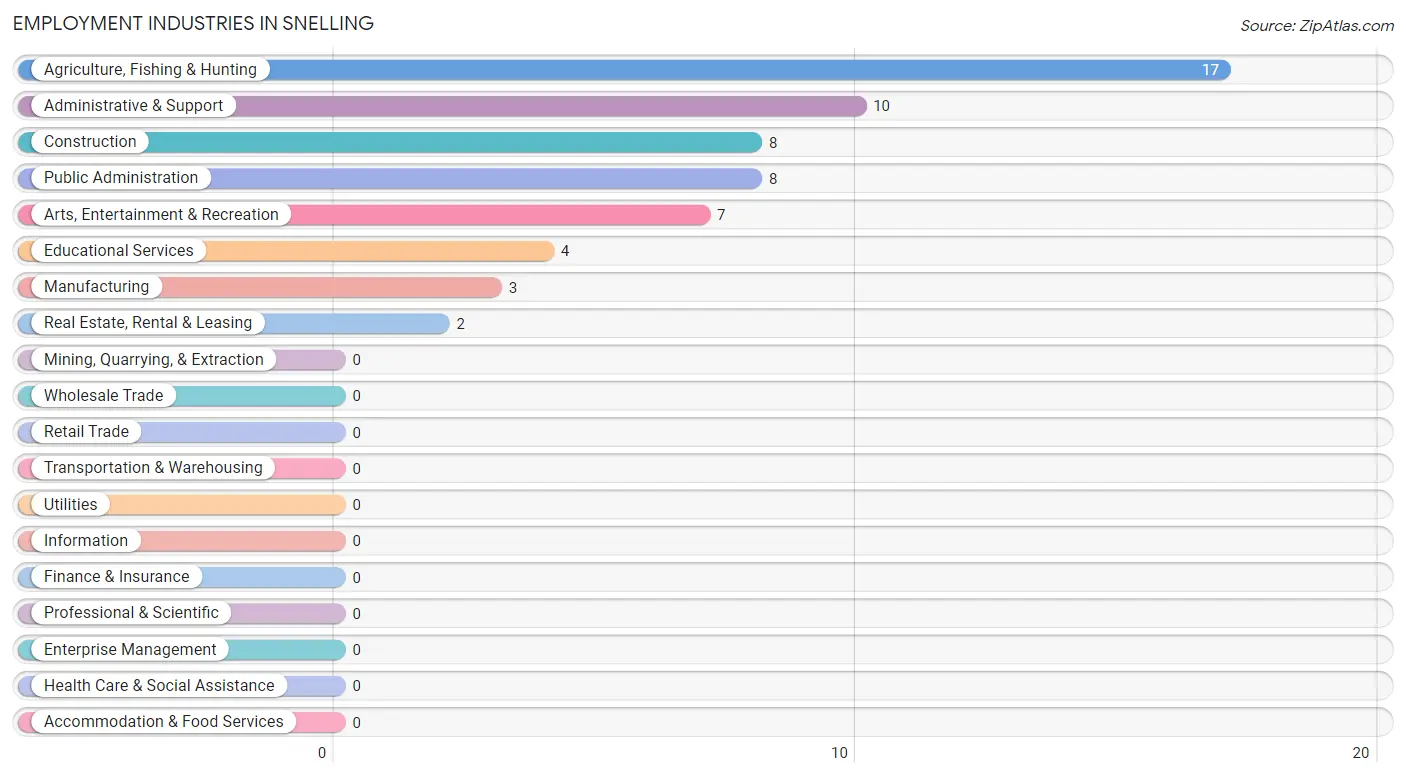
Employment Industries by Sex in Snelling
The Snelling industries that see more men than women are Agriculture, Fishing & Hunting (100.0%), Construction (100.0%), and Manufacturing (100.0%), whereas the industries that tend to have a higher number of women are Real Estate, Rental & Leasing (100.0%), Educational Services (100.0%), and Administrative & Support (30.0%).
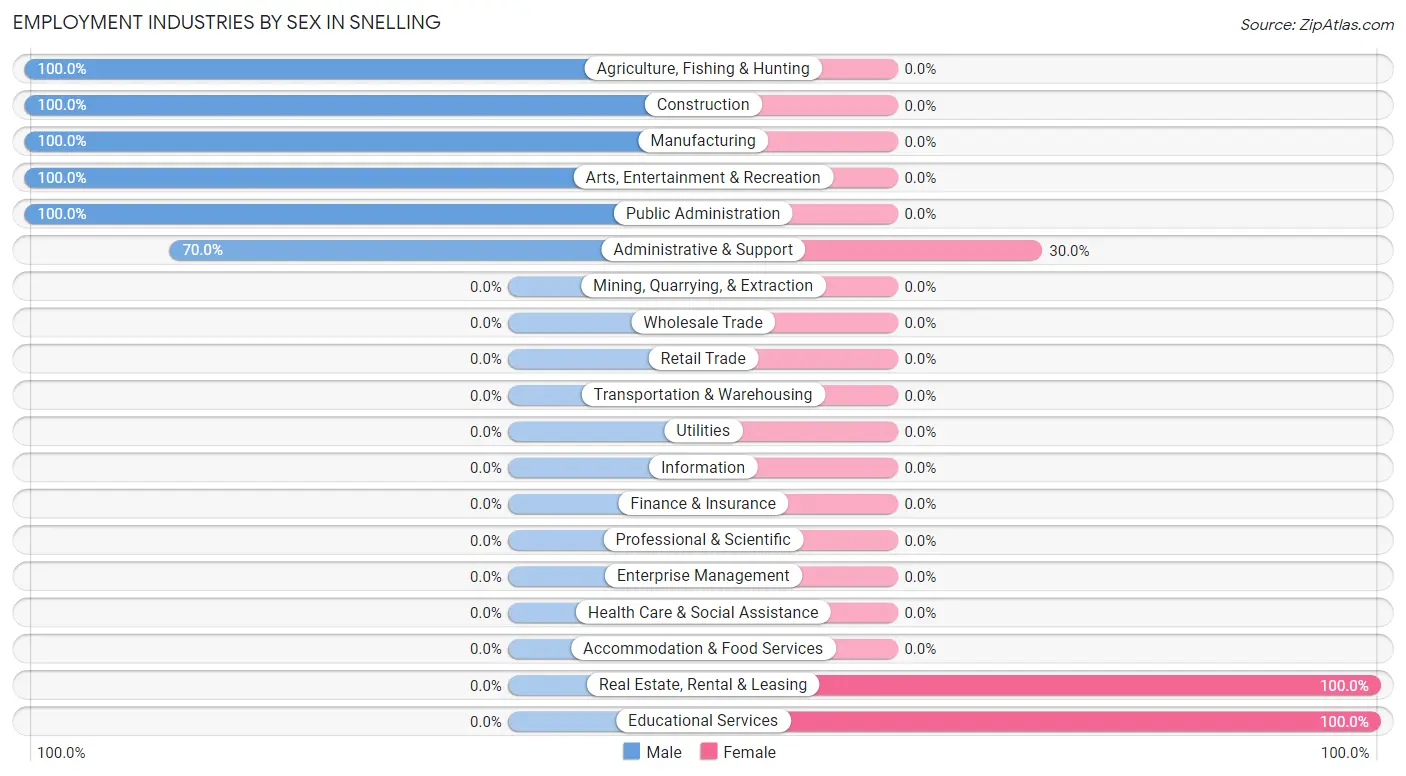
| Industry | Male | Female |
| Agriculture, Fishing & Hunting | 17 (100.0%) | 0 (0.0%) |
| Mining, Quarrying, & Extraction | 0 (0.0%) | 0 (0.0%) |
| Construction | 8 (100.0%) | 0 (0.0%) |
| Manufacturing | 3 (100.0%) | 0 (0.0%) |
| Wholesale Trade | 0 (0.0%) | 0 (0.0%) |
| Retail Trade | 0 (0.0%) | 0 (0.0%) |
| Transportation & Warehousing | 0 (0.0%) | 0 (0.0%) |
| Utilities | 0 (0.0%) | 0 (0.0%) |
| Information | 0 (0.0%) | 0 (0.0%) |
| Finance & Insurance | 0 (0.0%) | 0 (0.0%) |
| Real Estate, Rental & Leasing | 0 (0.0%) | 2 (100.0%) |
| Professional & Scientific | 0 (0.0%) | 0 (0.0%) |
| Enterprise Management | 0 (0.0%) | 0 (0.0%) |
| Administrative & Support | 7 (70.0%) | 3 (30.0%) |
| Educational Services | 0 (0.0%) | 4 (100.0%) |
| Health Care & Social Assistance | 0 (0.0%) | 0 (0.0%) |
| Arts, Entertainment & Recreation | 7 (100.0%) | 0 (0.0%) |
| Accommodation & Food Services | 0 (0.0%) | 0 (0.0%) |
| Public Administration | 8 (100.0%) | 0 (0.0%) |
| Total | 50 (84.8%) | 9 (15.2%) |
Education in Snelling
School Enrollment in Snelling
The most common levels of schooling among the 35 students in Snelling are college / undergraduate (27 | 77.1%), high school (5 | 14.3%), and middle school (3 | 8.6%).
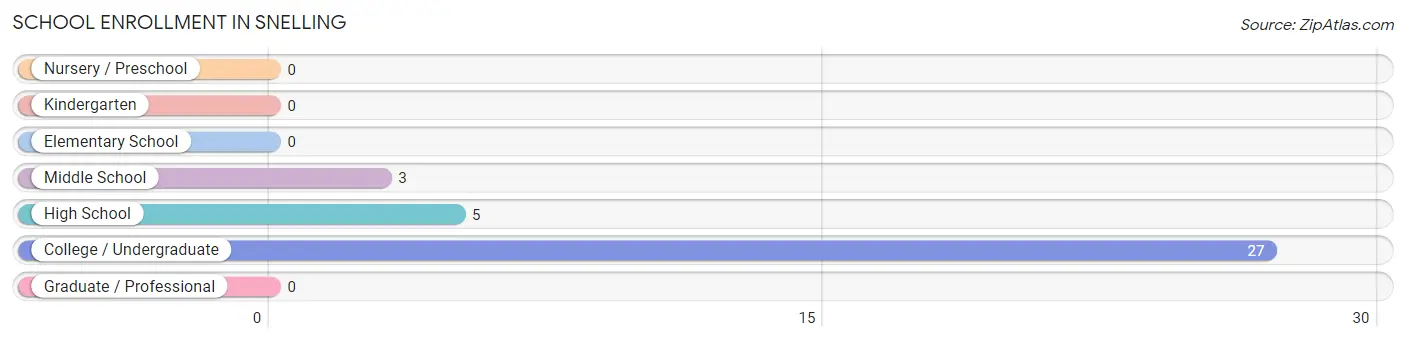
| School Level | # Students | % Students |
| Nursery / Preschool | 0 | 0.0% |
| Kindergarten | 0 | 0.0% |
| Elementary School | 0 | 0.0% |
| Middle School | 3 | 8.6% |
| High School | 5 | 14.3% |
| College / Undergraduate | 27 | 77.1% |
| Graduate / Professional | 0 | 0.0% |
| Total | 35 | 100.0% |
School Enrollment by Age by Funding Source in Snelling
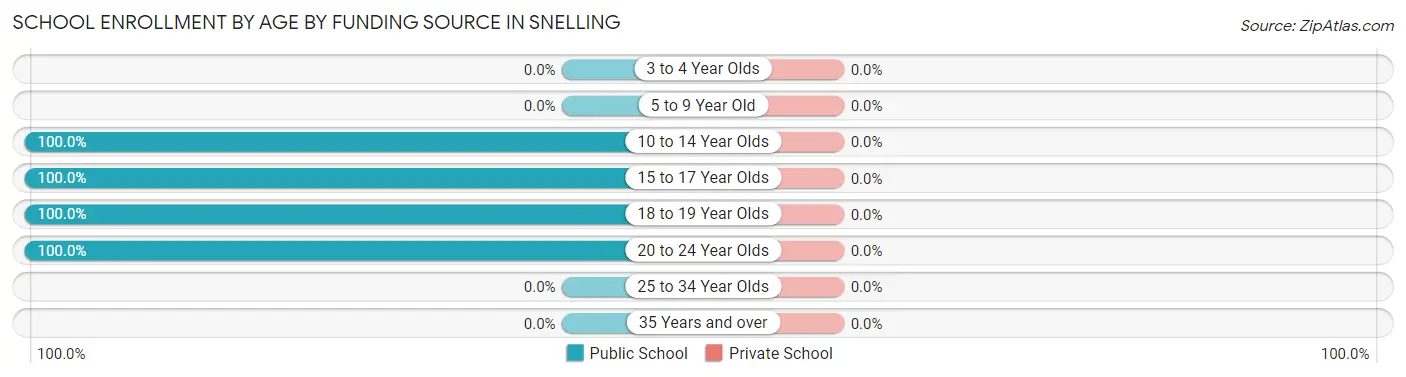
| Age Bracket | Public School | Private School |
| 3 to 4 Year Olds | 0 (0.0%) | 0 (0.0%) |
| 5 to 9 Year Old | 0 (0.0%) | 0 (0.0%) |
| 10 to 14 Year Olds | 8 (100.0%) | 0 (0.0%) |
| 15 to 17 Year Olds | 7 (100.0%) | 0 (0.0%) |
| 18 to 19 Year Olds | 6 (100.0%) | 0 (0.0%) |
| 20 to 24 Year Olds | 14 (100.0%) | 0 (0.0%) |
| 25 to 34 Year Olds | 0 (0.0%) | 0 (0.0%) |
| 35 Years and over | 0 (0.0%) | 0 (0.0%) |
| Total | 35 (100.0%) | 0 (0.0%) |
Educational Attainment by Field of Study in Snelling
Arts & humanities (7 | 63.6%), and psychology (4 | 36.4%) are the most common fields of study among 11 individuals in Snelling who have obtained a bachelor's degree or higher.
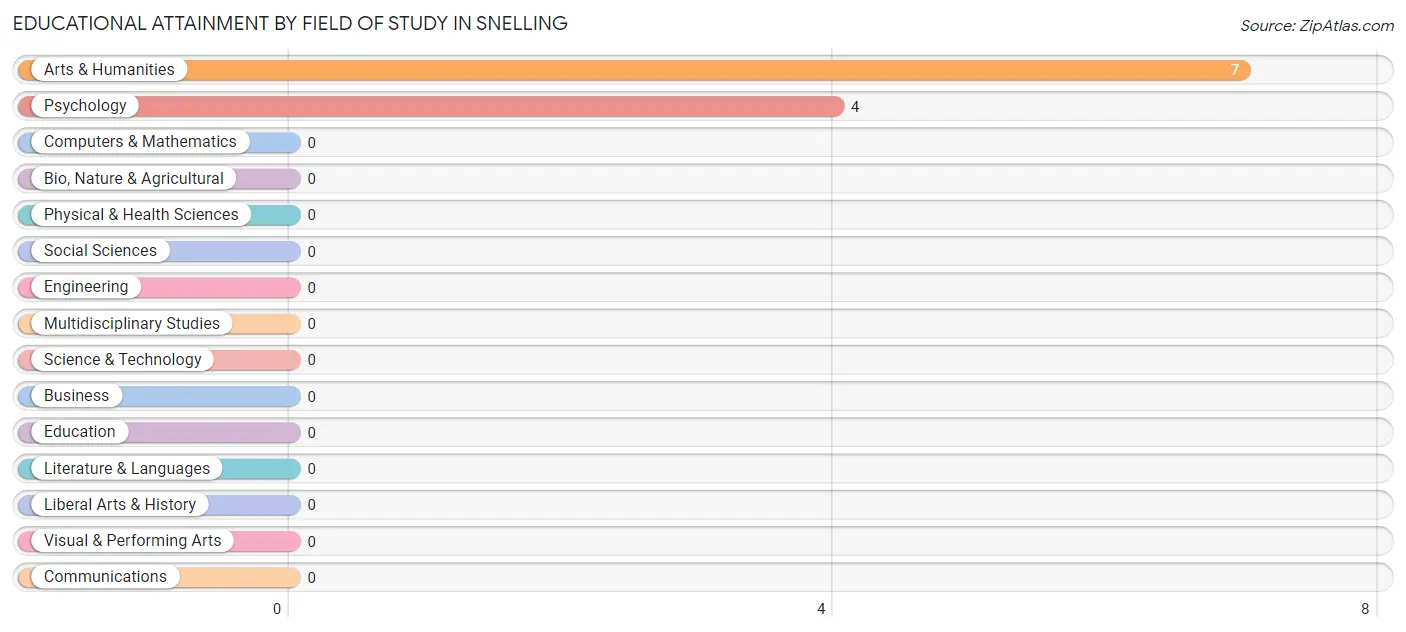
| Field of Study | # Graduates | % Graduates |
| Computers & Mathematics | 0 | 0.0% |
| Bio, Nature & Agricultural | 0 | 0.0% |
| Physical & Health Sciences | 0 | 0.0% |
| Psychology | 4 | 36.4% |
| Social Sciences | 0 | 0.0% |
| Engineering | 0 | 0.0% |
| Multidisciplinary Studies | 0 | 0.0% |
| Science & Technology | 0 | 0.0% |
| Business | 0 | 0.0% |
| Education | 0 | 0.0% |
| Literature & Languages | 0 | 0.0% |
| Liberal Arts & History | 0 | 0.0% |
| Visual & Performing Arts | 0 | 0.0% |
| Communications | 0 | 0.0% |
| Arts & Humanities | 7 | 63.6% |
| Total | 11 | 100.0% |
Transportation & Commute in Snelling
Vehicle Availability by Sex in Snelling
The most prevalent vehicle ownership categories in Snelling are males with 2 vehicles (33, accounting for 66.0%) and females with 2 vehicles (4, making up 366.7%).
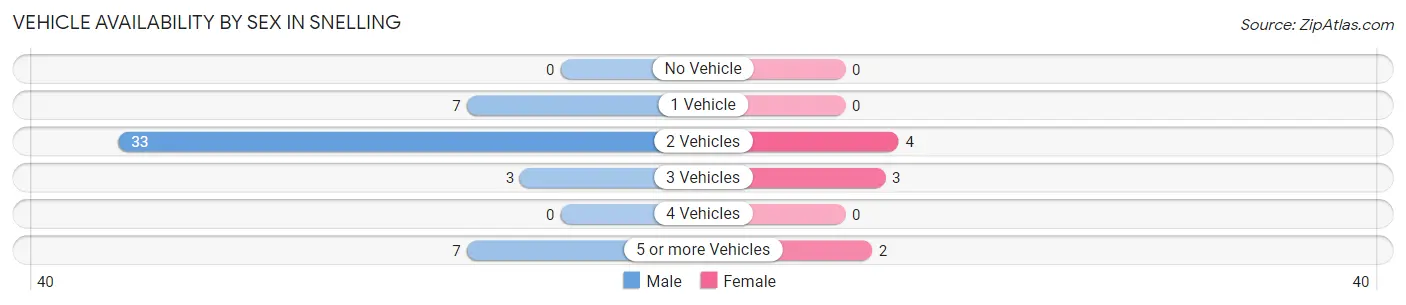
| Vehicles Available | Male | Female |
| No Vehicle | 0 (0.0%) | 0 (0.0%) |
| 1 Vehicle | 7 (14.0%) | 0 (0.0%) |
| 2 Vehicles | 33 (66.0%) | 4 (44.4%) |
| 3 Vehicles | 3 (6.0%) | 3 (33.3%) |
| 4 Vehicles | 0 (0.0%) | 0 (0.0%) |
| 5 or more Vehicles | 7 (14.0%) | 2 (22.2%) |
| Total | 50 (100.0%) | 9 (100.0%) |
Commute Time in Snelling
The most frequently occuring commute durations in Snelling are 20 to 24 minutes (17 commuters, 28.8%), 25 to 29 minutes (11 commuters, 18.6%), and 5 to 9 minutes (10 commuters, 17.0%).
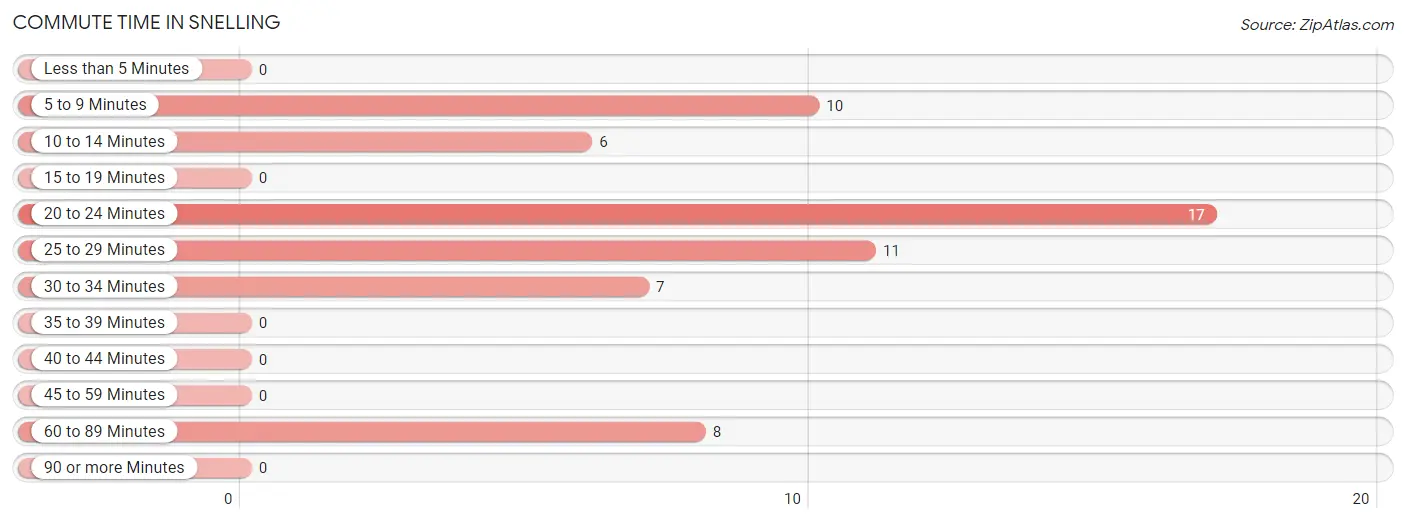
| Commute Time | # Commuters | % Commuters |
| Less than 5 Minutes | 0 | 0.0% |
| 5 to 9 Minutes | 10 | 17.0% |
| 10 to 14 Minutes | 6 | 10.2% |
| 15 to 19 Minutes | 0 | 0.0% |
| 20 to 24 Minutes | 17 | 28.8% |
| 25 to 29 Minutes | 11 | 18.6% |
| 30 to 34 Minutes | 7 | 11.9% |
| 35 to 39 Minutes | 0 | 0.0% |
| 40 to 44 Minutes | 0 | 0.0% |
| 45 to 59 Minutes | 0 | 0.0% |
| 60 to 89 Minutes | 8 | 13.6% |
| 90 or more Minutes | 0 | 0.0% |
Commute Time by Sex in Snelling
The most common commute times in Snelling are 20 to 24 minutes (14 commuters, 28.0%) for males and 30 to 34 minutes (4 commuters, 44.4%) for females.
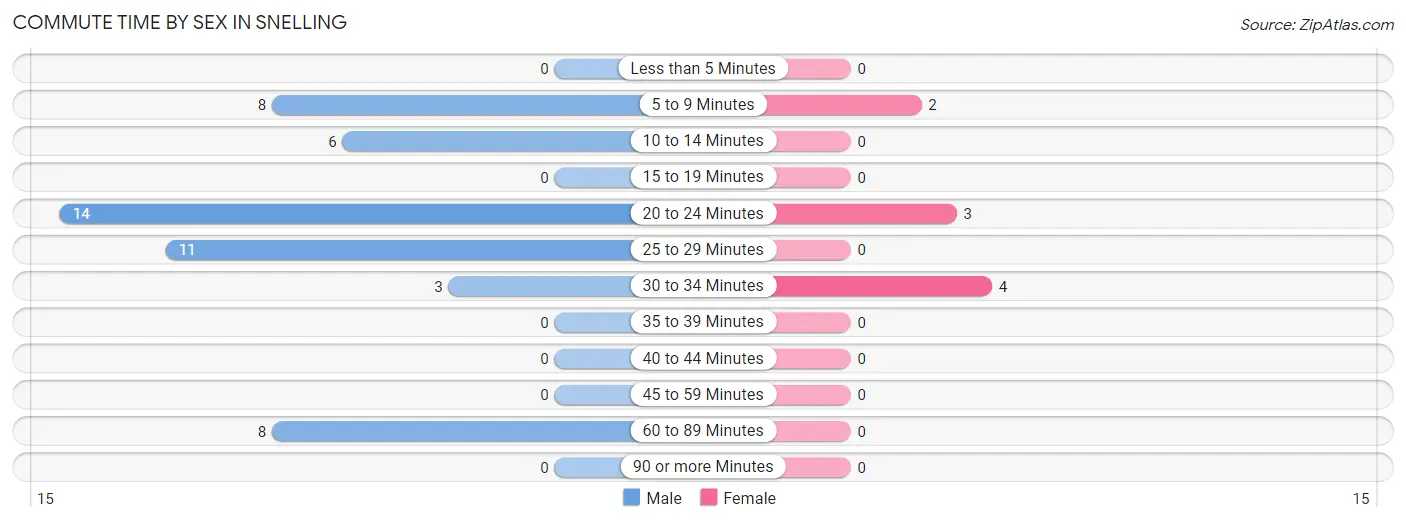
| Commute Time | Male | Female |
| Less than 5 Minutes | 0 (0.0%) | 0 (0.0%) |
| 5 to 9 Minutes | 8 (16.0%) | 2 (22.2%) |
| 10 to 14 Minutes | 6 (12.0%) | 0 (0.0%) |
| 15 to 19 Minutes | 0 (0.0%) | 0 (0.0%) |
| 20 to 24 Minutes | 14 (28.0%) | 3 (33.3%) |
| 25 to 29 Minutes | 11 (22.0%) | 0 (0.0%) |
| 30 to 34 Minutes | 3 (6.0%) | 4 (44.4%) |
| 35 to 39 Minutes | 0 (0.0%) | 0 (0.0%) |
| 40 to 44 Minutes | 0 (0.0%) | 0 (0.0%) |
| 45 to 59 Minutes | 0 (0.0%) | 0 (0.0%) |
| 60 to 89 Minutes | 8 (16.0%) | 0 (0.0%) |
| 90 or more Minutes | 0 (0.0%) | 0 (0.0%) |
Time of Departure to Work by Sex in Snelling
The most frequent times of departure to work in Snelling are 6:00 AM to 6:29 AM (14, 28.0%) for males and 6:30 AM to 6:59 AM (4, 44.4%) for females.
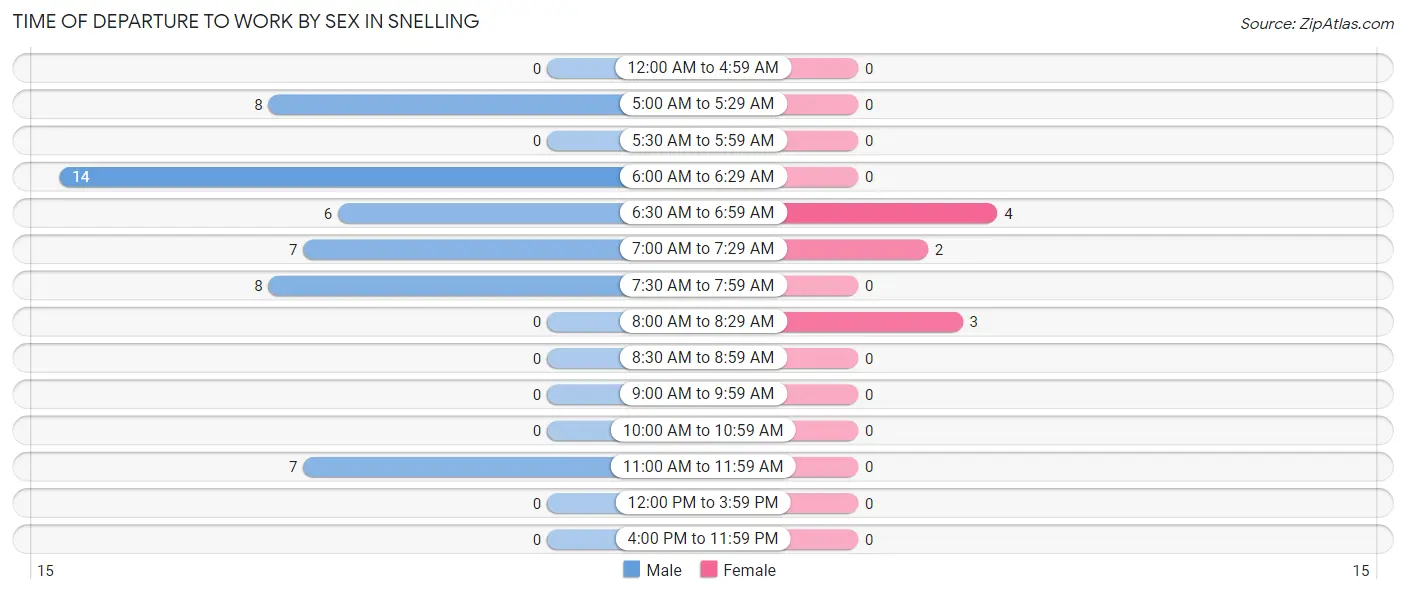
| Time of Departure | Male | Female |
| 12:00 AM to 4:59 AM | 0 (0.0%) | 0 (0.0%) |
| 5:00 AM to 5:29 AM | 8 (16.0%) | 0 (0.0%) |
| 5:30 AM to 5:59 AM | 0 (0.0%) | 0 (0.0%) |
| 6:00 AM to 6:29 AM | 14 (28.0%) | 0 (0.0%) |
| 6:30 AM to 6:59 AM | 6 (12.0%) | 4 (44.4%) |
| 7:00 AM to 7:29 AM | 7 (14.0%) | 2 (22.2%) |
| 7:30 AM to 7:59 AM | 8 (16.0%) | 0 (0.0%) |
| 8:00 AM to 8:29 AM | 0 (0.0%) | 3 (33.3%) |
| 8:30 AM to 8:59 AM | 0 (0.0%) | 0 (0.0%) |
| 9:00 AM to 9:59 AM | 0 (0.0%) | 0 (0.0%) |
| 10:00 AM to 10:59 AM | 0 (0.0%) | 0 (0.0%) |
| 11:00 AM to 11:59 AM | 7 (14.0%) | 0 (0.0%) |
| 12:00 PM to 3:59 PM | 0 (0.0%) | 0 (0.0%) |
| 4:00 PM to 11:59 PM | 0 (0.0%) | 0 (0.0%) |
| Total | 50 (100.0%) | 9 (100.0%) |
Housing Occupancy in Snelling
Occupancy by Ownership in Snelling
Of the total 73 dwellings in Snelling, owner-occupied units account for 45 (61.6%), while renter-occupied units make up 28 (38.4%).
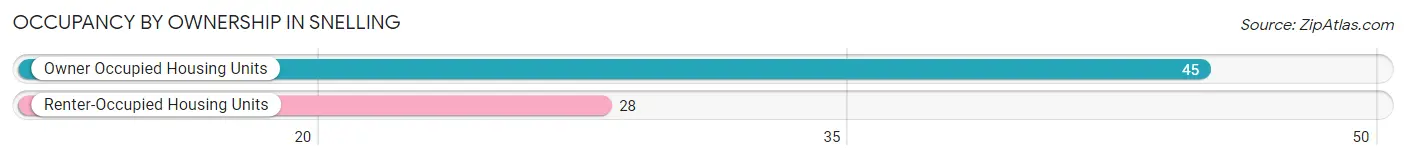
| Occupancy | # Housing Units | % Housing Units |
| Owner Occupied Housing Units | 45 | 61.6% |
| Renter-Occupied Housing Units | 28 | 38.4% |
| Total Occupied Housing Units | 73 | 100.0% |
Occupancy by Household Size in Snelling
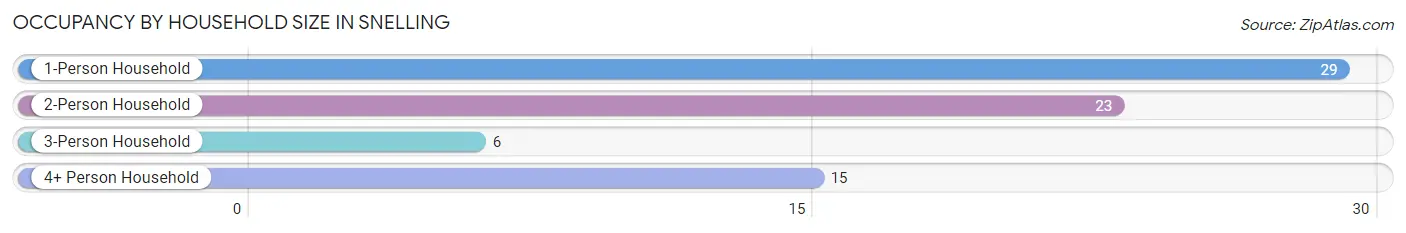
| Household Size | # Housing Units | % Housing Units |
| 1-Person Household | 29 | 39.7% |
| 2-Person Household | 23 | 31.5% |
| 3-Person Household | 6 | 8.2% |
| 4+ Person Household | 15 | 20.5% |
| Total Housing Units | 73 | 100.0% |
Occupancy by Ownership by Household Size in Snelling
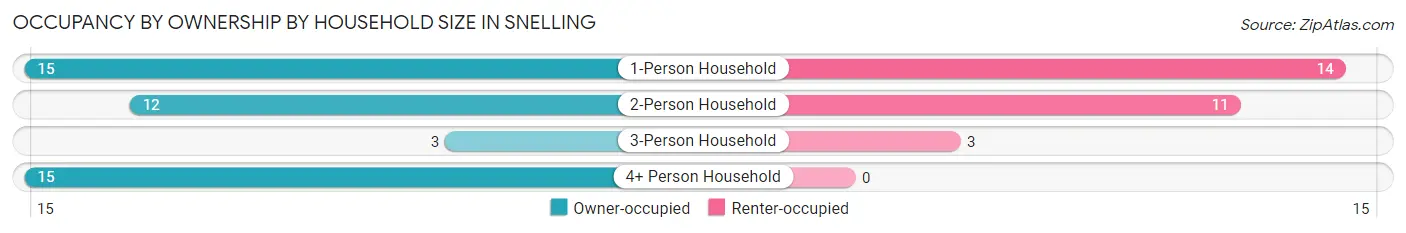
| Household Size | Owner-occupied | Renter-occupied |
| 1-Person Household | 15 (51.7%) | 14 (48.3%) |
| 2-Person Household | 12 (52.2%) | 11 (47.8%) |
| 3-Person Household | 3 (50.0%) | 3 (50.0%) |
| 4+ Person Household | 15 (100.0%) | 0 (0.0%) |
| Total Housing Units | 45 (61.6%) | 28 (38.4%) |
Occupancy by Educational Attainment in Snelling
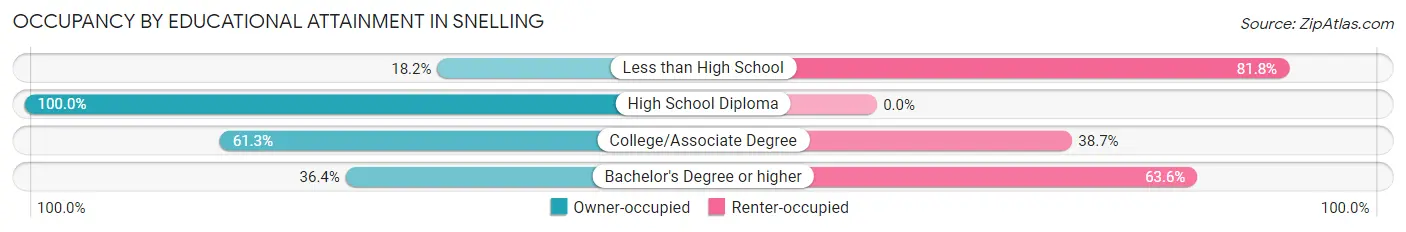
| Household Size | Owner-occupied | Renter-occupied |
| Less than High School | 2 (18.2%) | 9 (81.8%) |
| High School Diploma | 20 (100.0%) | 0 (0.0%) |
| College/Associate Degree | 19 (61.3%) | 12 (38.7%) |
| Bachelor's Degree or higher | 4 (36.4%) | 7 (63.6%) |
Occupancy by Age of Householder in Snelling
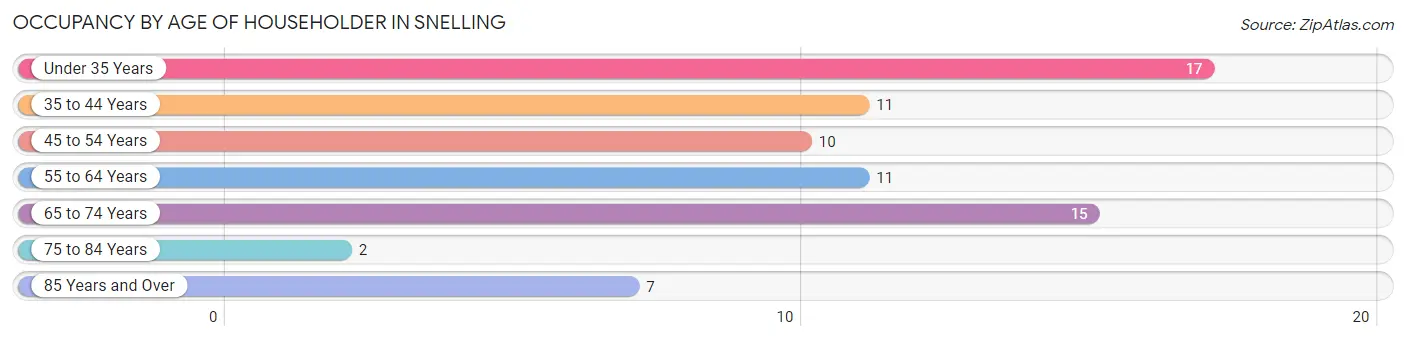
| Age Bracket | # Households | % Households |
| Under 35 Years | 17 | 23.3% |
| 35 to 44 Years | 11 | 15.1% |
| 45 to 54 Years | 10 | 13.7% |
| 55 to 64 Years | 11 | 15.1% |
| 65 to 74 Years | 15 | 20.5% |
| 75 to 84 Years | 2 | 2.7% |
| 85 Years and Over | 7 | 9.6% |
| Total | 73 | 100.0% |
Housing Finances in Snelling
Median Income by Occupancy in Snelling
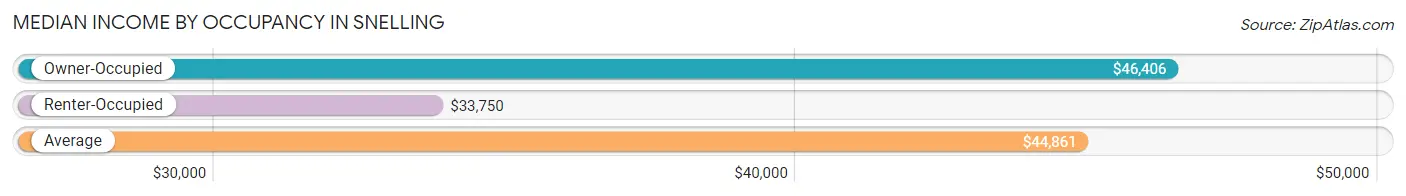
| Occupancy Type | # Households | Median Income |
| Owner-Occupied | 45 (61.6%) | $46,406 |
| Renter-Occupied | 28 (38.4%) | $33,750 |
| Average | 73 (100.0%) | $44,861 |
Occupancy by Householder Income Bracket in Snelling
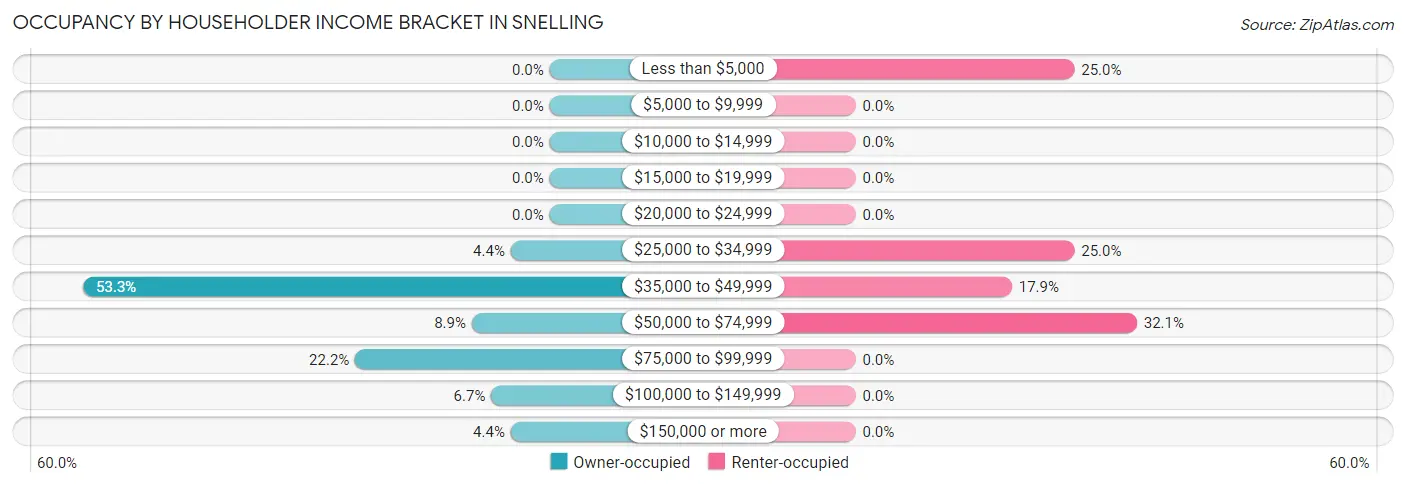
| Income Bracket | Owner-occupied | Renter-occupied |
| Less than $5,000 | 0 (0.0%) | 7 (25.0%) |
| $5,000 to $9,999 | 0 (0.0%) | 0 (0.0%) |
| $10,000 to $14,999 | 0 (0.0%) | 0 (0.0%) |
| $15,000 to $19,999 | 0 (0.0%) | 0 (0.0%) |
| $20,000 to $24,999 | 0 (0.0%) | 0 (0.0%) |
| $25,000 to $34,999 | 2 (4.4%) | 7 (25.0%) |
| $35,000 to $49,999 | 24 (53.3%) | 5 (17.9%) |
| $50,000 to $74,999 | 4 (8.9%) | 9 (32.1%) |
| $75,000 to $99,999 | 10 (22.2%) | 0 (0.0%) |
| $100,000 to $149,999 | 3 (6.7%) | 0 (0.0%) |
| $150,000 or more | 2 (4.4%) | 0 (0.0%) |
| Total | 45 (100.0%) | 28 (100.0%) |
Monthly Housing Cost Tiers in Snelling
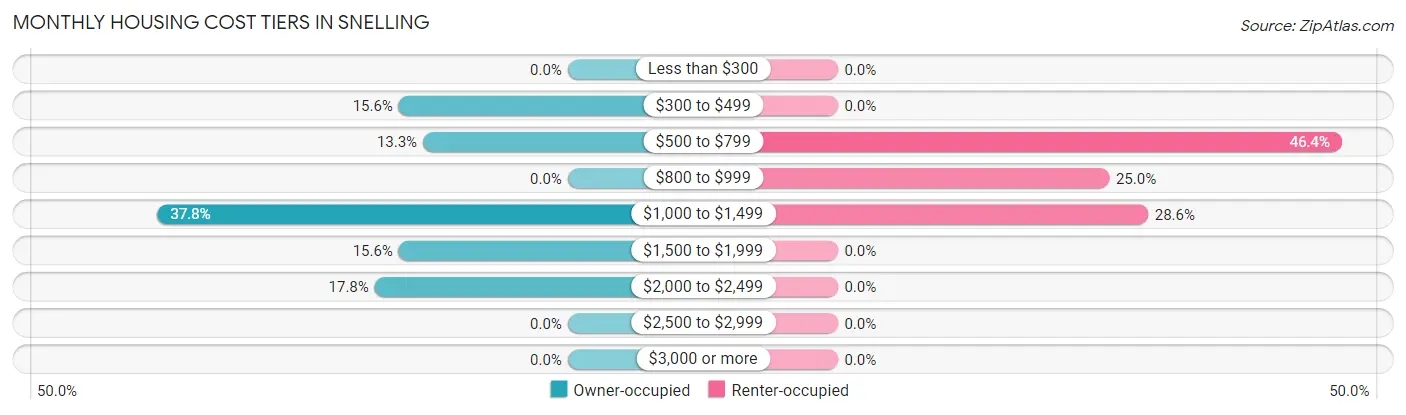
| Monthly Cost | Owner-occupied | Renter-occupied |
| Less than $300 | 0 (0.0%) | 0 (0.0%) |
| $300 to $499 | 7 (15.6%) | 0 (0.0%) |
| $500 to $799 | 6 (13.3%) | 13 (46.4%) |
| $800 to $999 | 0 (0.0%) | 7 (25.0%) |
| $1,000 to $1,499 | 17 (37.8%) | 8 (28.6%) |
| $1,500 to $1,999 | 7 (15.6%) | 0 (0.0%) |
| $2,000 to $2,499 | 8 (17.8%) | 0 (0.0%) |
| $2,500 to $2,999 | 0 (0.0%) | 0 (0.0%) |
| $3,000 or more | 0 (0.0%) | 0 (0.0%) |
| Total | 45 (100.0%) | 28 (100.0%) |
Physical Housing Characteristics in Snelling
Housing Structures in Snelling
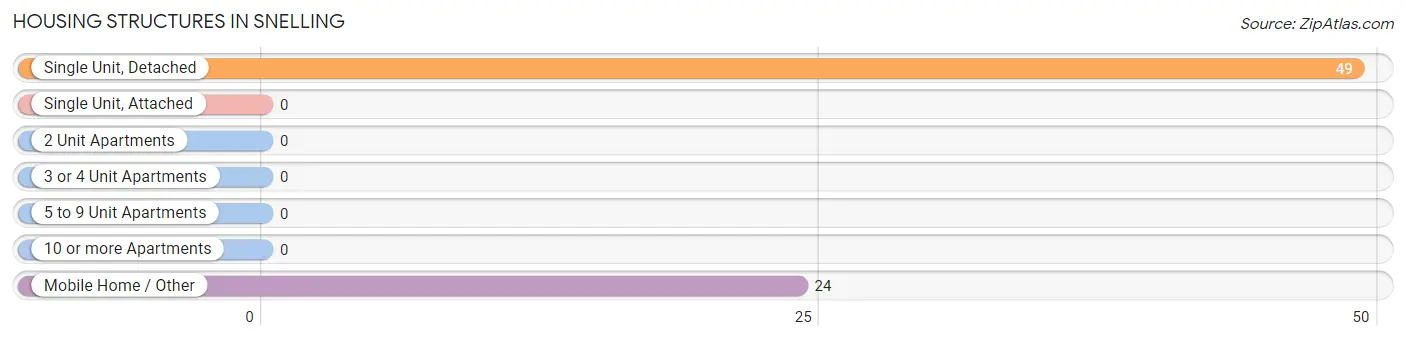
| Structure Type | # Housing Units | % Housing Units |
| Single Unit, Detached | 49 | 67.1% |
| Single Unit, Attached | 0 | 0.0% |
| 2 Unit Apartments | 0 | 0.0% |
| 3 or 4 Unit Apartments | 0 | 0.0% |
| 5 to 9 Unit Apartments | 0 | 0.0% |
| 10 or more Apartments | 0 | 0.0% |
| Mobile Home / Other | 24 | 32.9% |
| Total | 73 | 100.0% |
Housing Structures by Occupancy in Snelling
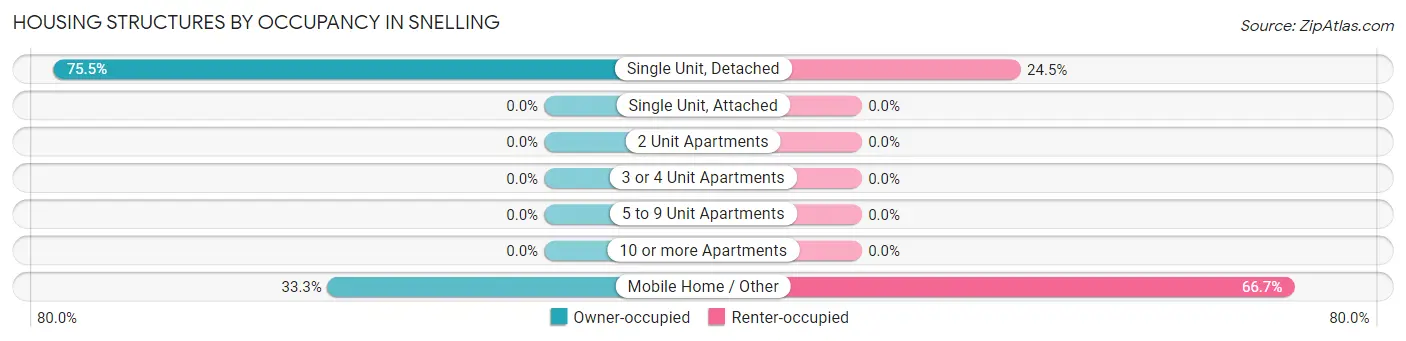
| Structure Type | Owner-occupied | Renter-occupied |
| Single Unit, Detached | 37 (75.5%) | 12 (24.5%) |
| Single Unit, Attached | 0 (0.0%) | 0 (0.0%) |
| 2 Unit Apartments | 0 (0.0%) | 0 (0.0%) |
| 3 or 4 Unit Apartments | 0 (0.0%) | 0 (0.0%) |
| 5 to 9 Unit Apartments | 0 (0.0%) | 0 (0.0%) |
| 10 or more Apartments | 0 (0.0%) | 0 (0.0%) |
| Mobile Home / Other | 8 (33.3%) | 16 (66.7%) |
| Total | 45 (61.6%) | 28 (38.4%) |
Housing Structures by Number of Rooms in Snelling
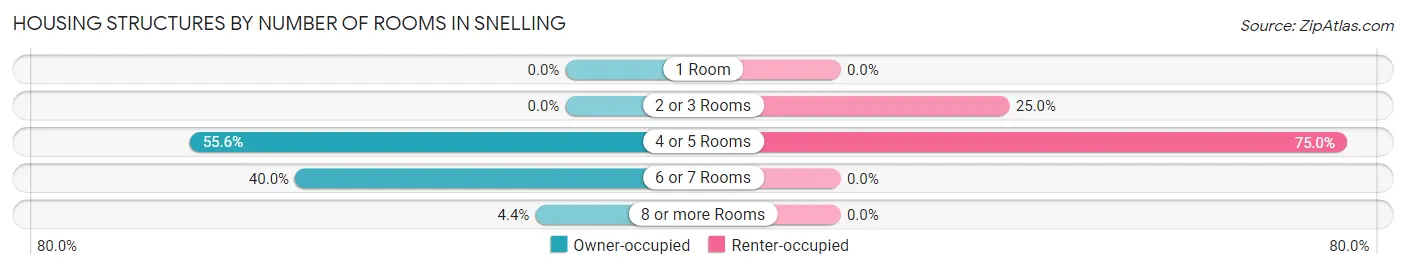
| Number of Rooms | Owner-occupied | Renter-occupied |
| 1 Room | 0 (0.0%) | 0 (0.0%) |
| 2 or 3 Rooms | 0 (0.0%) | 7 (25.0%) |
| 4 or 5 Rooms | 25 (55.6%) | 21 (75.0%) |
| 6 or 7 Rooms | 18 (40.0%) | 0 (0.0%) |
| 8 or more Rooms | 2 (4.4%) | 0 (0.0%) |
| Total | 45 (100.0%) | 28 (100.0%) |
Housing Structure by Heating Type in Snelling
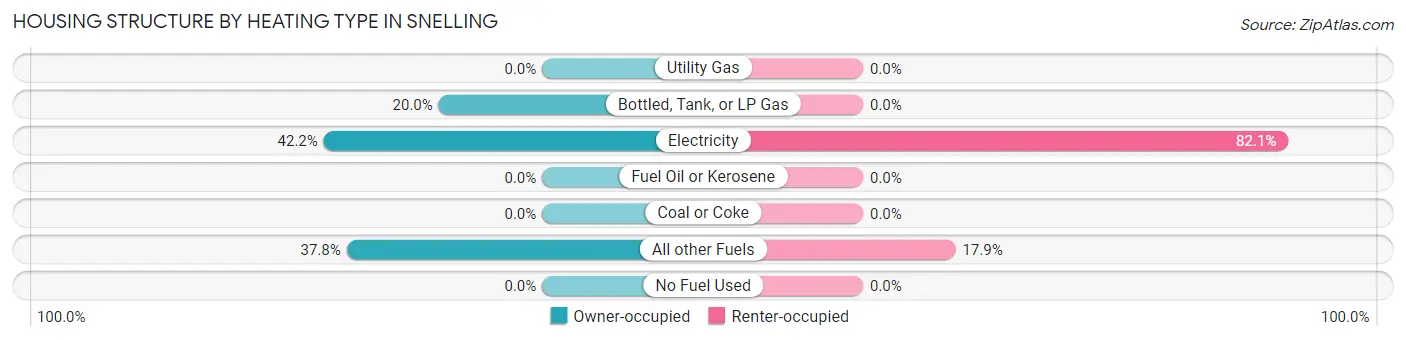
| Heating Type | Owner-occupied | Renter-occupied |
| Utility Gas | 0 (0.0%) | 0 (0.0%) |
| Bottled, Tank, or LP Gas | 9 (20.0%) | 0 (0.0%) |
| Electricity | 19 (42.2%) | 23 (82.1%) |
| Fuel Oil or Kerosene | 0 (0.0%) | 0 (0.0%) |
| Coal or Coke | 0 (0.0%) | 0 (0.0%) |
| All other Fuels | 17 (37.8%) | 5 (17.9%) |
| No Fuel Used | 0 (0.0%) | 0 (0.0%) |
| Total | 45 (100.0%) | 28 (100.0%) |
Household Vehicle Usage in Snelling
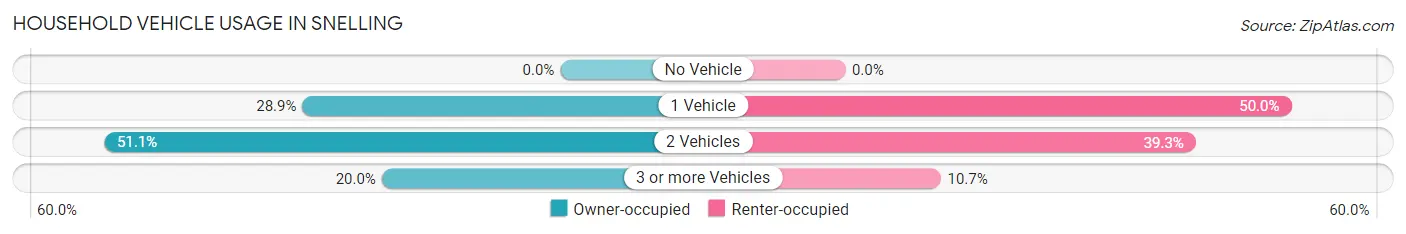
| Vehicles per Household | Owner-occupied | Renter-occupied |
| No Vehicle | 0 (0.0%) | 0 (0.0%) |
| 1 Vehicle | 13 (28.9%) | 14 (50.0%) |
| 2 Vehicles | 23 (51.1%) | 11 (39.3%) |
| 3 or more Vehicles | 9 (20.0%) | 3 (10.7%) |
| Total | 45 (100.0%) | 28 (100.0%) |
Real Estate & Mortgages in Snelling
Real Estate and Mortgage Overview in Snelling
| Characteristic | Without Mortgage | With Mortgage |
| Housing Units | 13 | 32 |
| Median Property Value | - | - |
| Median Household Income | - | - |
| Monthly Housing Costs | - | - |
| Real Estate Taxes | - | - |
Property Value by Mortgage Status in Snelling
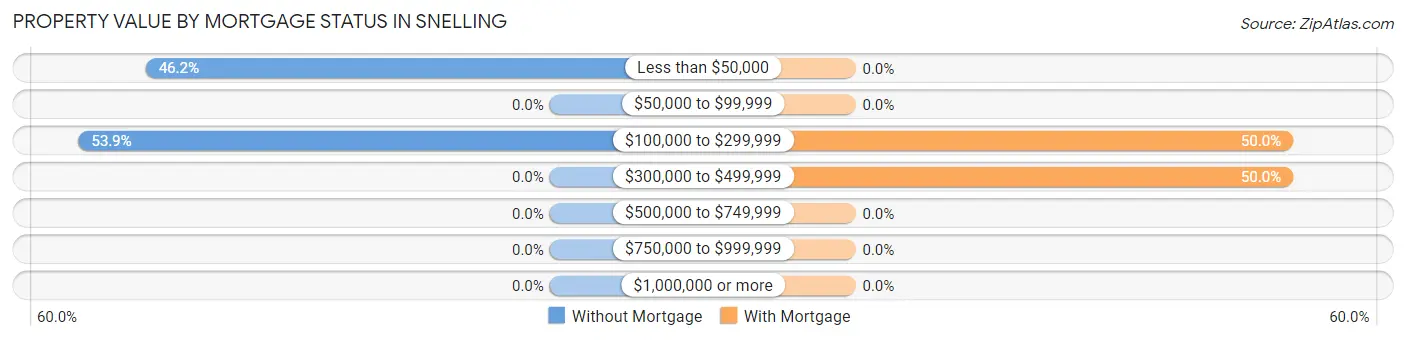
| Property Value | Without Mortgage | With Mortgage |
| Less than $50,000 | 6 (46.2%) | 0 (0.0%) |
| $50,000 to $99,999 | 0 (0.0%) | 0 (0.0%) |
| $100,000 to $299,999 | 7 (53.8%) | 16 (50.0%) |
| $300,000 to $499,999 | 0 (0.0%) | 16 (50.0%) |
| $500,000 to $749,999 | 0 (0.0%) | 0 (0.0%) |
| $750,000 to $999,999 | 0 (0.0%) | 0 (0.0%) |
| $1,000,000 or more | 0 (0.0%) | 0 (0.0%) |
| Total | 13 (100.0%) | 32 (100.0%) |
Household Income by Mortgage Status in Snelling
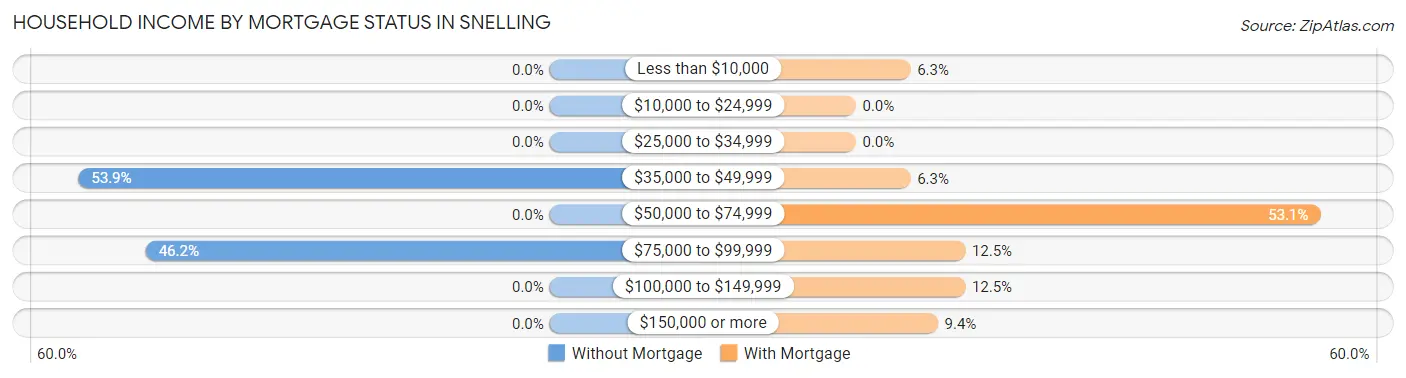
| Household Income | Without Mortgage | With Mortgage |
| Less than $10,000 | 0 (0.0%) | 2 (6.2%) |
| $10,000 to $24,999 | 0 (0.0%) | 0 (0.0%) |
| $25,000 to $34,999 | 0 (0.0%) | 0 (0.0%) |
| $35,000 to $49,999 | 7 (53.8%) | 2 (6.2%) |
| $50,000 to $74,999 | 0 (0.0%) | 17 (53.1%) |
| $75,000 to $99,999 | 6 (46.2%) | 4 (12.5%) |
| $100,000 to $149,999 | 0 (0.0%) | 4 (12.5%) |
| $150,000 or more | 0 (0.0%) | 3 (9.4%) |
| Total | 13 (100.0%) | 32 (100.0%) |
Property Value to Household Income Ratio in Snelling
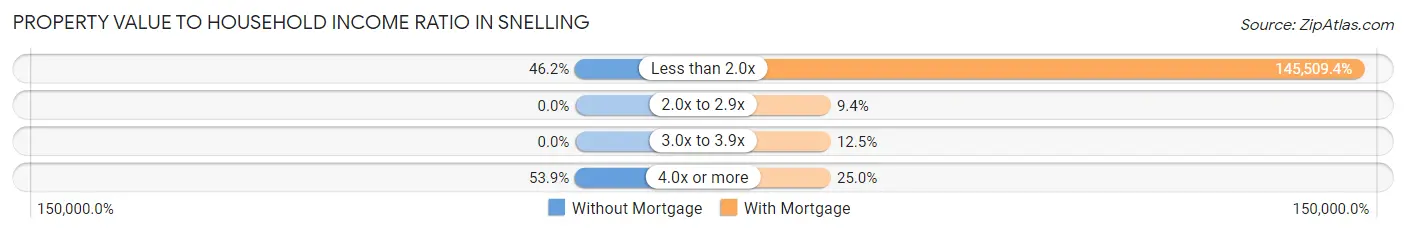
| Value-to-Income Ratio | Without Mortgage | With Mortgage |
| Less than 2.0x | 6 (46.2%) | 46,563 (145,509.4%) |
| 2.0x to 2.9x | 0 (0.0%) | 3 (9.4%) |
| 3.0x to 3.9x | 0 (0.0%) | 4 (12.5%) |
| 4.0x or more | 7 (53.8%) | 8 (25.0%) |
| Total | 13 (100.0%) | 32 (100.0%) |
Real Estate Taxes by Mortgage Status in Snelling
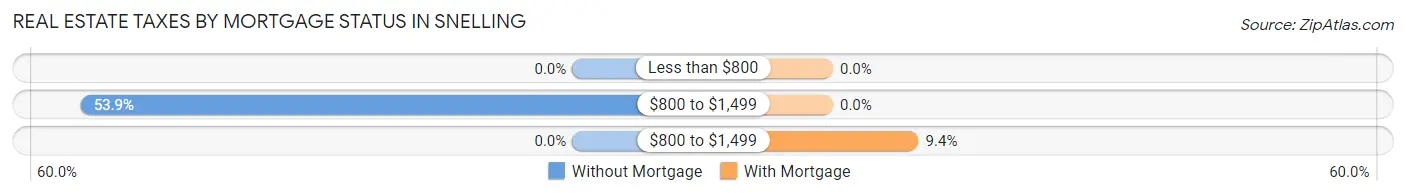
| Property Taxes | Without Mortgage | With Mortgage |
| Less than $800 | 0 (0.0%) | 0 (0.0%) |
| $800 to $1,499 | 7 (53.8%) | 0 (0.0%) |
| $800 to $1,499 | 0 (0.0%) | 3 (9.4%) |
| Total | 13 (100.0%) | 32 (100.0%) |
Health & Disability in Snelling
Health Insurance Coverage by Age in Snelling
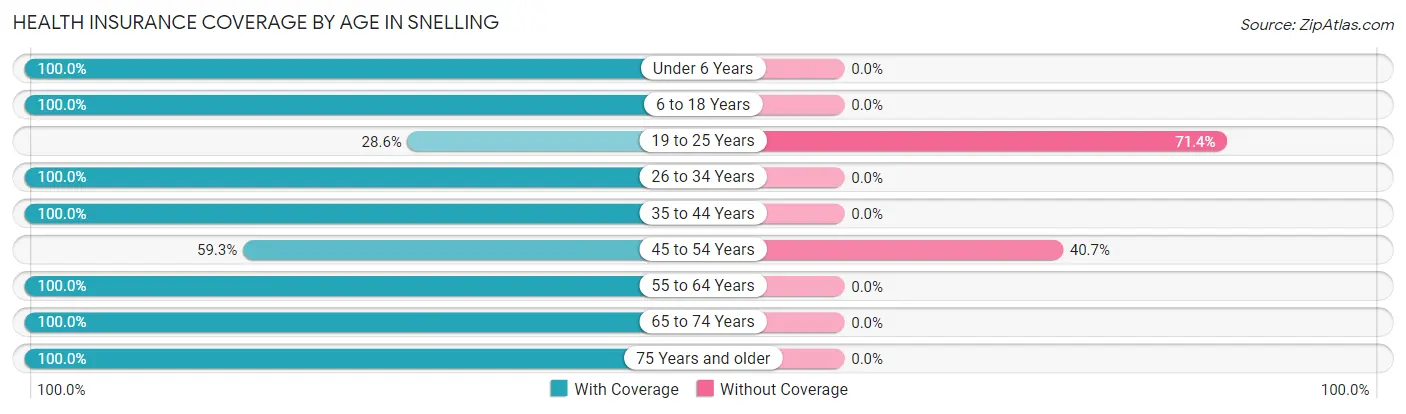
| Age Bracket | With Coverage | Without Coverage |
| Under 6 Years | 28 (100.0%) | 0 (0.0%) |
| 6 to 18 Years | 15 (100.0%) | 0 (0.0%) |
| 19 to 25 Years | 8 (28.6%) | 20 (71.4%) |
| 26 to 34 Years | 17 (100.0%) | 0 (0.0%) |
| 35 to 44 Years | 11 (100.0%) | 0 (0.0%) |
| 45 to 54 Years | 16 (59.3%) | 11 (40.7%) |
| 55 to 64 Years | 26 (100.0%) | 0 (0.0%) |
| 65 to 74 Years | 15 (100.0%) | 0 (0.0%) |
| 75 Years and older | 11 (100.0%) | 0 (0.0%) |
| Total | 147 (82.6%) | 31 (17.4%) |
Health Insurance Coverage by Citizenship Status in Snelling
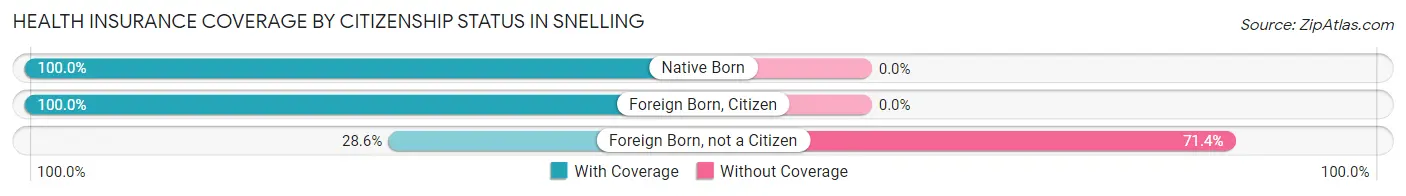
| Citizenship Status | With Coverage | Without Coverage |
| Native Born | 28 (100.0%) | 0 (0.0%) |
| Foreign Born, Citizen | 15 (100.0%) | 0 (0.0%) |
| Foreign Born, not a Citizen | 8 (28.6%) | 20 (71.4%) |
Health Insurance Coverage by Household Income in Snelling
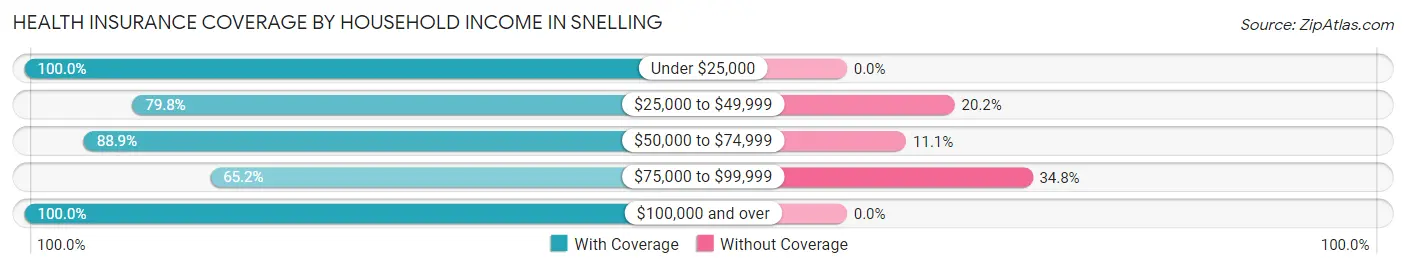
| Household Income | With Coverage | Without Coverage |
| Under $25,000 | 7 (100.0%) | 0 (0.0%) |
| $25,000 to $49,999 | 79 (79.8%) | 20 (20.2%) |
| $50,000 to $74,999 | 24 (88.9%) | 3 (11.1%) |
| $75,000 to $99,999 | 15 (65.2%) | 8 (34.8%) |
| $100,000 and over | 22 (100.0%) | 0 (0.0%) |
Public vs Private Health Insurance Coverage by Age in Snelling
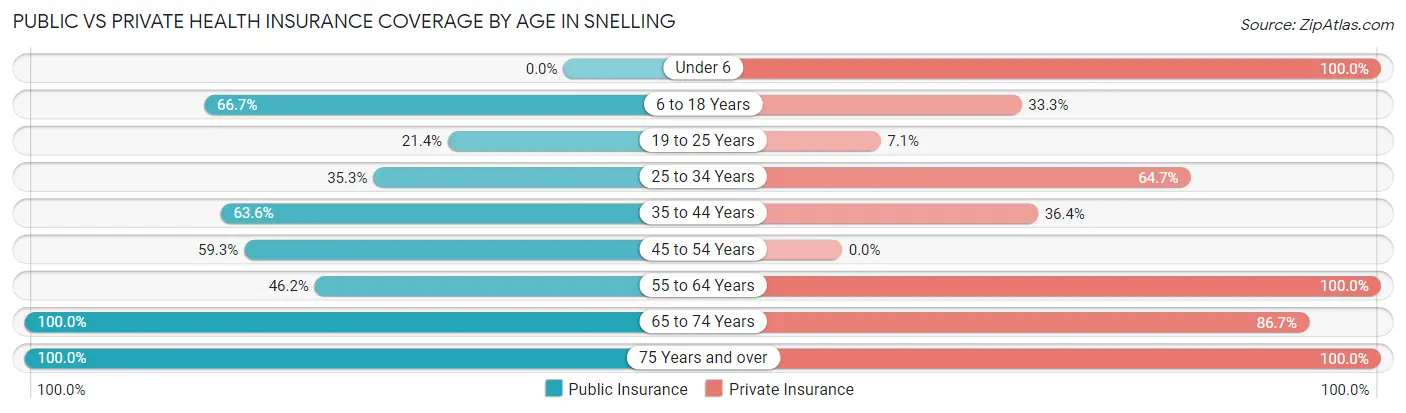
| Age Bracket | Public Insurance | Private Insurance |
| Under 6 | 0 (0.0%) | 28 (100.0%) |
| 6 to 18 Years | 10 (66.7%) | 5 (33.3%) |
| 19 to 25 Years | 6 (21.4%) | 2 (7.1%) |
| 25 to 34 Years | 6 (35.3%) | 11 (64.7%) |
| 35 to 44 Years | 7 (63.6%) | 4 (36.4%) |
| 45 to 54 Years | 16 (59.3%) | 0 (0.0%) |
| 55 to 64 Years | 12 (46.2%) | 26 (100.0%) |
| 65 to 74 Years | 15 (100.0%) | 13 (86.7%) |
| 75 Years and over | 11 (100.0%) | 11 (100.0%) |
| Total | 83 (46.6%) | 100 (56.2%) |
Disability Status by Sex by Age in Snelling
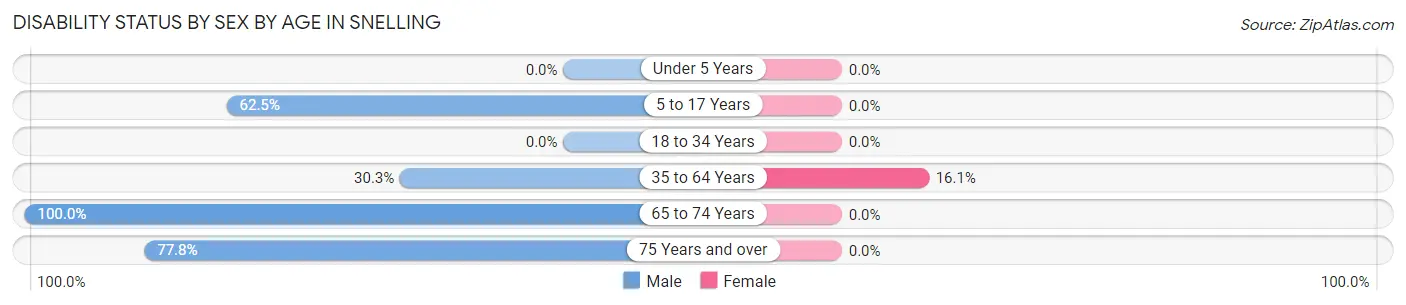
| Age Bracket | Male | Female |
| Under 5 Years | 0 (0.0%) | 0 (0.0%) |
| 5 to 17 Years | 5 (62.5%) | 0 (0.0%) |
| 18 to 34 Years | 0 (0.0%) | 0 (0.0%) |
| 35 to 64 Years | 10 (30.3%) | 5 (16.1%) |
| 65 to 74 Years | 9 (100.0%) | 0 (0.0%) |
| 75 Years and over | 7 (77.8%) | 0 (0.0%) |
Disability Class by Sex by Age in Snelling
Disability Class: Hearing Difficulty
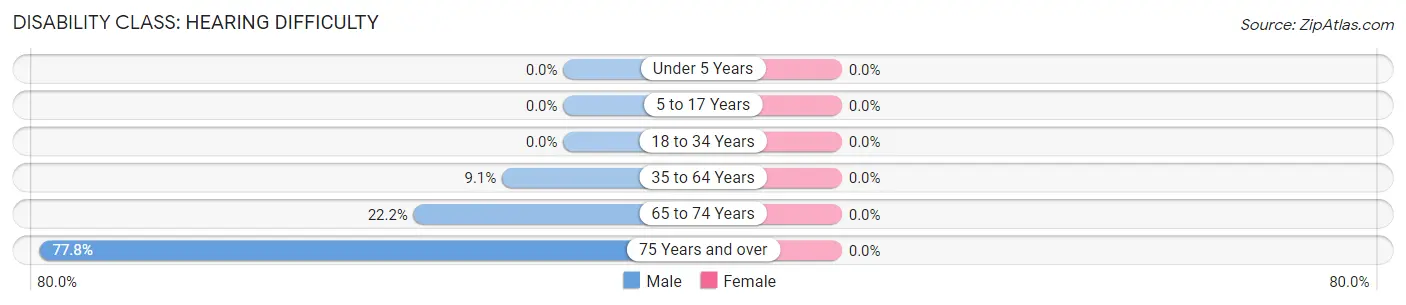
| Age Bracket | Male | Female |
| Under 5 Years | 0 (0.0%) | 0 (0.0%) |
| 5 to 17 Years | 0 (0.0%) | 0 (0.0%) |
| 18 to 34 Years | 0 (0.0%) | 0 (0.0%) |
| 35 to 64 Years | 3 (9.1%) | 0 (0.0%) |
| 65 to 74 Years | 2 (22.2%) | 0 (0.0%) |
| 75 Years and over | 7 (77.8%) | 0 (0.0%) |
Disability Class: Vision Difficulty
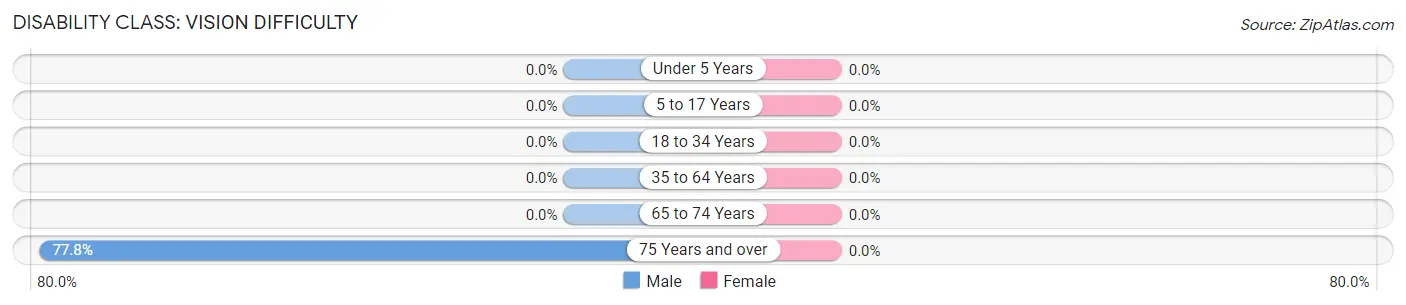
| Age Bracket | Male | Female |
| Under 5 Years | 0 (0.0%) | 0 (0.0%) |
| 5 to 17 Years | 0 (0.0%) | 0 (0.0%) |
| 18 to 34 Years | 0 (0.0%) | 0 (0.0%) |
| 35 to 64 Years | 0 (0.0%) | 0 (0.0%) |
| 65 to 74 Years | 0 (0.0%) | 0 (0.0%) |
| 75 Years and over | 7 (77.8%) | 0 (0.0%) |
Disability Class: Cognitive Difficulty
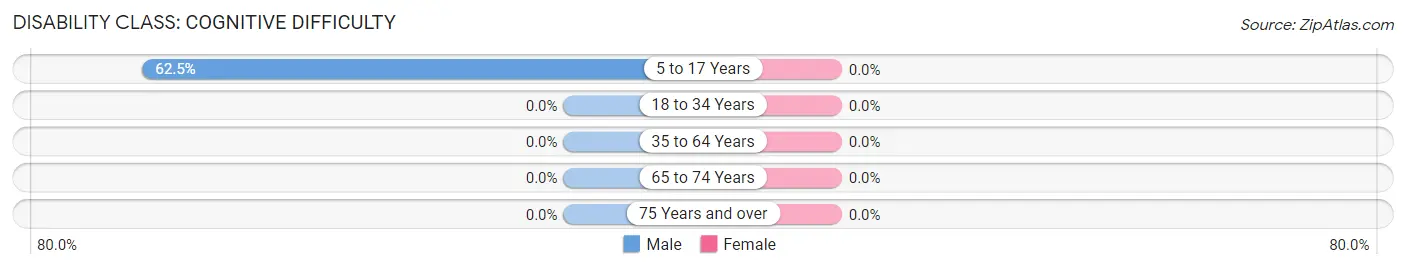
| Age Bracket | Male | Female |
| 5 to 17 Years | 5 (62.5%) | 0 (0.0%) |
| 18 to 34 Years | 0 (0.0%) | 0 (0.0%) |
| 35 to 64 Years | 0 (0.0%) | 0 (0.0%) |
| 65 to 74 Years | 0 (0.0%) | 0 (0.0%) |
| 75 Years and over | 0 (0.0%) | 0 (0.0%) |
Disability Class: Ambulatory Difficulty
| Age Bracket | Male | Female |
| 5 to 17 Years | 0 (0.0%) | 0 (0.0%) |
| 18 to 34 Years | 0 (0.0%) | 0 (0.0%) |
| 35 to 64 Years | 7 (21.2%) | 5 (16.1%) |
| 65 to 74 Years | 7 (77.8%) | 0 (0.0%) |
| 75 Years and over | 0 (0.0%) | 0 (0.0%) |
Disability Class: Self-Care Difficulty
| Age Bracket | Male | Female |
| 5 to 17 Years | 0 (0.0%) | 0 (0.0%) |
| 18 to 34 Years | 0 (0.0%) | 0 (0.0%) |
| 35 to 64 Years | 7 (21.2%) | 0 (0.0%) |
| 65 to 74 Years | 0 (0.0%) | 0 (0.0%) |
| 75 Years and over | 0 (0.0%) | 0 (0.0%) |
Technology Access in Snelling
Computing Device Access in Snelling
| Device Type | # Households | % Households |
| Desktop or Laptop | 34 | 46.6% |
| Smartphone | 64 | 87.7% |
| Tablet | 33 | 45.2% |
| No Computing Device | 9 | 12.3% |
| Total | 73 | 100.0% |
Internet Access in Snelling
| Internet Type | # Households | % Households |
| Dial-Up Internet | 0 | 0.0% |
| Broadband Home | 26 | 35.6% |
| Cellular Data Only | 20 | 27.4% |
| Satellite Internet | 16 | 21.9% |
| No Internet | 11 | 15.1% |
| Total | 73 | 100.0% |
Snelling Summary
Snelling is a small unincorporated community located in Merced County, California. It is situated in the San Joaquin Valley, approximately 8 miles south of the city of Merced. The population of Snelling was estimated to be 1,845 in 2019.
History
Snelling was founded in 1891 by the Southern Pacific Railroad. The town was named after the Snelling family, who were early settlers in the area. The town was originally a stop on the railroad line, and it quickly grew into a small farming community. The town was incorporated in 1921, and it remained a small farming community until the 1950s.
In the 1950s, the town began to experience rapid growth due to the influx of people from the San Francisco Bay Area. This growth was fueled by the construction of the nearby Merced Irrigation District, which provided water for the area’s agricultural needs. The town also benefited from the construction of the nearby San Luis Reservoir, which provided additional water for the area.
Geography
Snelling is located in the San Joaquin Valley, approximately 8 miles south of the city of Merced. The town is situated at an elevation of approximately 200 feet above sea level. The town is surrounded by rolling hills and farmland, and it is located near the San Luis Reservoir.
The climate in Snelling is hot and dry in the summer, and mild and wet in the winter. The average annual temperature is approximately 70 degrees Fahrenheit. The average annual precipitation is approximately 10 inches.
Economy
The economy of Snelling is largely based on agriculture. The town is home to several large farms, which produce a variety of crops, including almonds, walnuts, grapes, and tomatoes. The town is also home to several small businesses, including restaurants, grocery stores, and gas stations.
Demographics
As of 2019, the population of Snelling was estimated to be 1,845. The population is largely Hispanic, with approximately 75% of the population identifying as Hispanic or Latino. The median household income in Snelling is approximately $45,000, and the median home value is approximately $250,000.
Conclusion
Snelling is a small unincorporated community located in Merced County, California. It is situated in the San Joaquin Valley, approximately 8 miles south of the city of Merced. The population of Snelling was estimated to be 1,845 in 2019. The town is largely Hispanic, with approximately 75% of the population identifying as Hispanic or Latino. The economy of Snelling is largely based on agriculture, and the town is home to several large farms and small businesses.
Common Questions
What is Per Capita Income in Snelling?
Per Capita income in Snelling is $24,144.
What is the Median Family Income in Snelling?
Median Family Income in Snelling is $67,708.
What is the Median Household income in Snelling?
Median Household Income in Snelling is $44,861.
What is Inequality or Gini Index in Snelling?
Inequality or Gini Index in Snelling is 0.33.
What is the Total Population of Snelling?
Total Population of Snelling is 178.
What is the Total Male Population of Snelling?
Total Male Population of Snelling is 117.
What is the Total Female Population of Snelling?
Total Female Population of Snelling is 61.
What is the Ratio of Males per 100 Females in Snelling?
There are 191.80 Males per 100 Females in Snelling.
What is the Ratio of Females per 100 Males in Snelling?
There are 52.14 Females per 100 Males in Snelling.
What is the Median Population Age in Snelling?
Median Population Age in Snelling is 40.1 Years.
What is the Average Family Size in Snelling
Average Family Size in Snelling is 3.3 People.
What is the Average Household Size in Snelling
Average Household Size in Snelling is 2.4 People.
How Large is the Labor Force in Snelling?
There are 68 People in the Labor Forcein in Snelling.
What is the Percentage of People in the Labor Force in Snelling?
47.9% of People are in the Labor Force in Snelling.
What is the Unemployment Rate in Snelling?
Unemployment Rate in Snelling is 13.2%.