Cities with the Highest Percentage of Population Employed in Security & Protection in Alabama
RELATED REPORTS & OPTIONS
Security & Protection
Alabama
Compare Cities
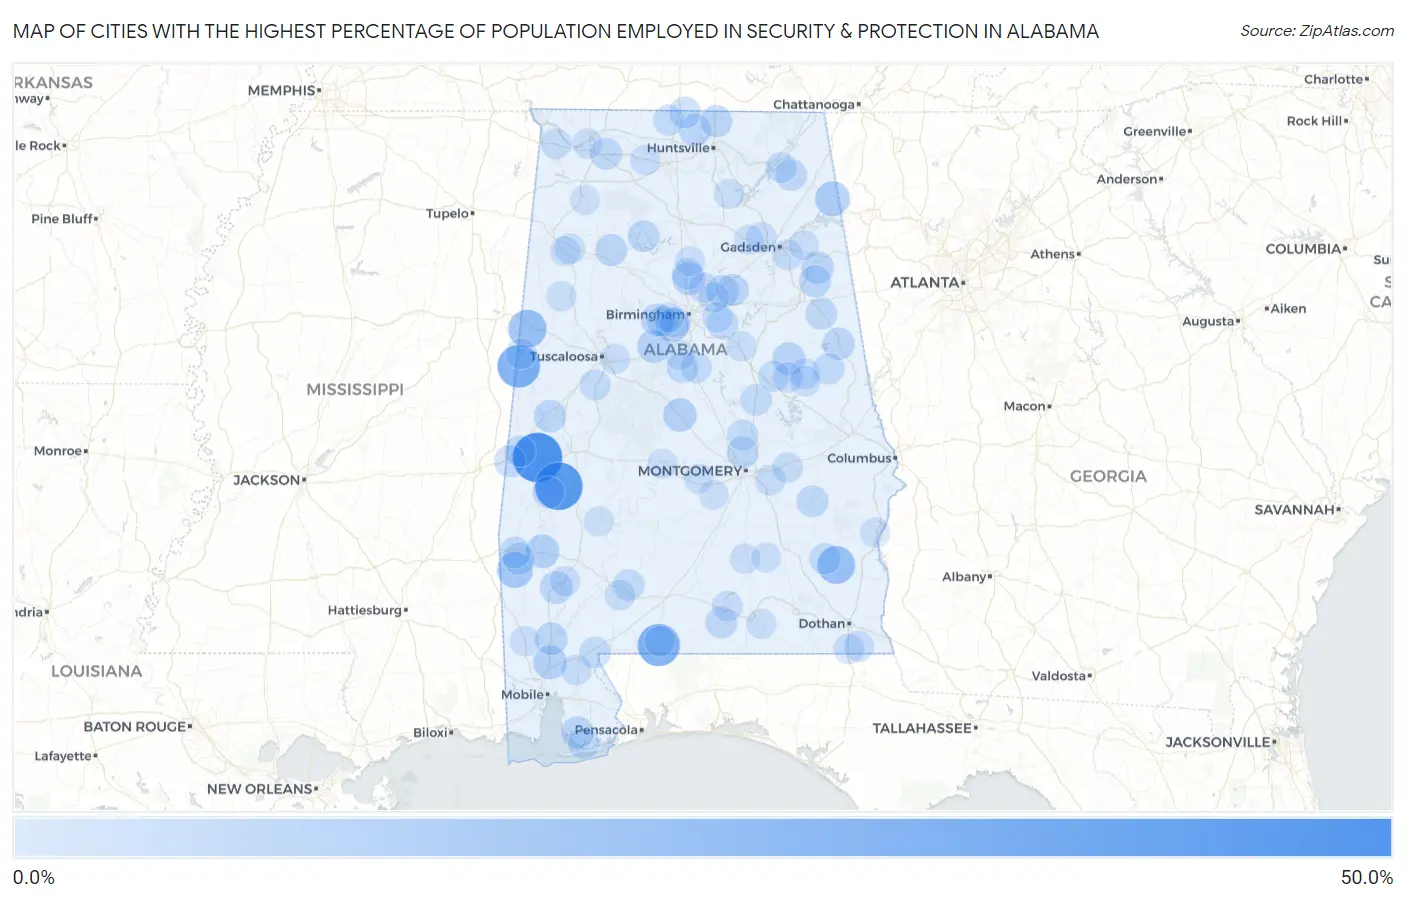
Map of Cities with the Highest Percentage of Population Employed in Security & Protection in Alabama
0.0%
50.0%
Cities with the Highest Percentage of Population Employed in Security & Protection in Alabama
| City | % Employed | vs State | vs National | |
| 1. | Bellamy | 40.7% | 2.3%(+38.5)#1 | 2.1%(+38.6)#63 |
| 2. | Myrtlewood | 37.1% | 2.3%(+34.8)#2 | 2.1%(+34.9)#76 |
| 3. | Memphis | 27.3% | 2.3%(+25.0)#3 | 2.1%(+25.1)#148 |
| 4. | Riverview | 26.5% | 2.3%(+24.3)#4 | 2.1%(+24.4)#155 |
| 5. | Ethelsville | 18.6% | 2.3%(+16.4)#5 | 2.1%(+16.5)#313 |
| 6. | Blue Springs | 18.2% | 2.3%(+15.9)#6 | 2.1%(+16.0)#325 |
| 7. | Millry | 14.4% | 2.3%(+12.1)#7 | 2.1%(+12.2)#531 |
| 8. | Broomtown | 12.9% | 2.3%(+10.6)#8 | 2.1%(+10.7)#675 |
| 9. | Brighton | 11.2% | 2.3%(+8.97)#9 | 2.1%(+9.09)#873 |
| 10. | Coffeeville | 10.8% | 2.3%(+8.54)#10 | 2.1%(+8.66)#951 |
| 11. | Axis | 10.6% | 2.3%(+8.31)#11 | 2.1%(+8.43)#1,001 |
| 12. | Maplesville | 10.2% | 2.3%(+7.96)#12 | 2.1%(+8.09)#1,053 |
| 13. | Lake View | 9.8% | 2.3%(+7.57)#13 | 2.1%(+7.69)#1,124 |
| 14. | Kimberly | 9.7% | 2.3%(+7.38)#14 | 2.1%(+7.50)#1,166 |
| 15. | Rock Creek | 9.4% | 2.3%(+7.09)#15 | 2.1%(+7.21)#1,235 |
| 16. | Millerville | 9.2% | 2.3%(+6.93)#16 | 2.1%(+7.05)#1,266 |
| 17. | Leroy | 8.8% | 2.3%(+6.54)#17 | 2.1%(+6.66)#1,392 |
| 18. | Mount Vernon | 8.8% | 2.3%(+6.49)#18 | 2.1%(+6.61)#1,404 |
| 19. | Nances Creek | 8.6% | 2.3%(+6.35)#19 | 2.1%(+6.47)#1,449 |
| 20. | Argo | 8.5% | 2.3%(+6.25)#20 | 2.1%(+6.37)#1,483 |
| 21. | Boligee | 8.5% | 2.3%(+6.24)#21 | 2.1%(+6.36)#1,488 |
| 22. | Harvest | 8.5% | 2.3%(+6.21)#22 | 2.1%(+6.33)#1,495 |
| 23. | Magnolia Springs | 8.4% | 2.3%(+6.15)#23 | 2.1%(+6.27)#1,516 |
| 24. | Wedowee | 8.3% | 2.3%(+6.00)#24 | 2.1%(+6.12)#1,565 |
| 25. | Odenville | 8.0% | 2.3%(+5.73)#25 | 2.1%(+5.85)#1,662 |
| 26. | Hazel Green | 7.9% | 2.3%(+5.59)#26 | 2.1%(+5.71)#1,700 |
| 27. | Nauvoo | 7.8% | 2.3%(+5.57)#27 | 2.1%(+5.69)#1,710 |
| 28. | White Plains | 7.7% | 2.3%(+5.48)#28 | 2.1%(+5.60)#1,745 |
| 29. | Pennington | 7.6% | 2.3%(+5.30)#29 | 2.1%(+5.42)#1,813 |
| 30. | Union Springs | 7.6% | 2.3%(+5.28)#30 | 2.1%(+5.41)#1,822 |
| 31. | Cullomburg | 7.5% | 2.3%(+5.28)#31 | 2.1%(+5.40)#1,829 |
| 32. | Hollis Crossroads | 7.5% | 2.3%(+5.26)#32 | 2.1%(+5.38)#1,839 |
| 33. | Leighton | 7.5% | 2.3%(+5.19)#33 | 2.1%(+5.31)#1,873 |
| 34. | Carolina | 7.4% | 2.3%(+5.17)#34 | 2.1%(+5.29)#1,886 |
| 35. | Coosada | 7.4% | 2.3%(+5.14)#35 | 2.1%(+5.27)#1,894 |
| 36. | Cuba | 7.2% | 2.3%(+4.98)#36 | 2.1%(+5.10)#1,956 |
| 37. | Arley | 7.2% | 2.3%(+4.97)#37 | 2.1%(+5.09)#1,965 |
| 38. | Powell | 7.1% | 2.3%(+4.85)#38 | 2.1%(+4.97)#2,014 |
| 39. | Vandiver | 7.0% | 2.3%(+4.75)#39 | 2.1%(+4.87)#2,064 |
| 40. | Ardmore | 7.0% | 2.3%(+4.70)#40 | 2.1%(+4.82)#2,095 |
| 41. | Silas | 6.9% | 2.3%(+4.63)#41 | 2.1%(+4.75)#2,137 |
| 42. | Monroeville | 6.9% | 2.3%(+4.62)#42 | 2.1%(+4.74)#2,144 |
| 43. | Wadley | 6.8% | 2.3%(+4.55)#43 | 2.1%(+4.67)#2,175 |
| 44. | Rockford | 6.8% | 2.3%(+4.54)#44 | 2.1%(+4.66)#2,179 |
| 45. | Perdido | 6.7% | 2.3%(+4.42)#45 | 2.1%(+4.55)#2,242 |
| 46. | Montevallo | 6.6% | 2.3%(+4.34)#46 | 2.1%(+4.46)#2,299 |
| 47. | Clio | 6.6% | 2.3%(+4.30)#47 | 2.1%(+4.42)#2,316 |
| 48. | York | 6.5% | 2.3%(+4.25)#48 | 2.1%(+4.38)#2,343 |
| 49. | Warrior | 6.4% | 2.3%(+4.15)#49 | 2.1%(+4.27)#2,415 |
| 50. | Goodwater | 6.3% | 2.3%(+4.04)#50 | 2.1%(+4.16)#2,488 |
| 51. | Bon Secour | 6.3% | 2.3%(+4.03)#51 | 2.1%(+4.15)#2,493 |
| 52. | Calera | 6.3% | 2.3%(+4.02)#52 | 2.1%(+4.14)#2,501 |
| 53. | Holtville | 6.3% | 2.3%(+4.02)#53 | 2.1%(+4.14)#2,504 |
| 54. | Concord | 6.0% | 2.3%(+3.77)#54 | 2.1%(+3.89)#2,678 |
| 55. | Elkmont | 6.0% | 2.3%(+3.75)#55 | 2.1%(+3.88)#2,690 |
| 56. | Moundville | 5.9% | 2.3%(+3.66)#56 | 2.1%(+3.78)#2,771 |
| 57. | Section | 5.9% | 2.3%(+3.63)#57 | 2.1%(+3.75)#2,794 |
| 58. | Glencoe | 5.8% | 2.3%(+3.56)#58 | 2.1%(+3.68)#2,859 |
| 59. | Pike Road | 5.8% | 2.3%(+3.49)#59 | 2.1%(+3.62)#2,916 |
| 60. | Bay Minette | 5.7% | 2.3%(+3.40)#60 | 2.1%(+3.52)#2,987 |
| 61. | Egypt | 5.6% | 2.3%(+3.36)#61 | 2.1%(+3.48)#3,037 |
| 62. | Midfield | 5.6% | 2.3%(+3.29)#62 | 2.1%(+3.41)#3,093 |
| 63. | Heath | 5.5% | 2.3%(+3.22)#63 | 2.1%(+3.35)#3,167 |
| 64. | Shorter | 5.5% | 2.3%(+3.21)#64 | 2.1%(+3.33)#3,185 |
| 65. | Frisco City | 5.5% | 2.3%(+3.20)#65 | 2.1%(+3.33)#3,193 |
| 66. | Madrid | 5.5% | 2.3%(+3.18)#66 | 2.1%(+3.31)#3,212 |
| 67. | Pickensville | 5.4% | 2.3%(+3.15)#67 | 2.1%(+3.28)#3,240 |
| 68. | Goldville | 5.4% | 2.3%(+3.14)#68 | 2.1%(+3.26)#3,259 |
| 69. | Cherokee | 5.4% | 2.3%(+3.10)#69 | 2.1%(+3.22)#3,285 |
| 70. | Dunnavant | 5.4% | 2.3%(+3.09)#70 | 2.1%(+3.21)#3,294 |
| 71. | East Brewton | 5.3% | 2.3%(+3.07)#71 | 2.1%(+3.19)#3,315 |
| 72. | Cottonwood | 5.3% | 2.3%(+3.05)#72 | 2.1%(+3.17)#3,338 |
| 73. | Twin | 5.3% | 2.3%(+3.03)#73 | 2.1%(+3.15)#3,373 |
| 74. | Hackneyville | 5.2% | 2.3%(+2.93)#74 | 2.1%(+3.05)#3,484 |
| 75. | Hillsboro | 5.1% | 2.3%(+2.85)#75 | 2.1%(+2.97)#3,565 |
| 76. | New Site | 5.1% | 2.3%(+2.85)#76 | 2.1%(+2.97)#3,566 |
| 77. | Childersburg | 5.1% | 2.3%(+2.84)#77 | 2.1%(+2.96)#3,581 |
| 78. | Trussville | 5.1% | 2.3%(+2.80)#78 | 2.1%(+2.92)#3,622 |
| 79. | Sheffield | 5.0% | 2.3%(+2.77)#79 | 2.1%(+2.89)#3,652 |
| 80. | Jackson | 5.0% | 2.3%(+2.72)#80 | 2.1%(+2.84)#3,707 |
| 81. | Rutledge | 5.0% | 2.3%(+2.68)#81 | 2.1%(+2.80)#3,744 |
| 82. | Citronelle | 4.8% | 2.3%(+2.50)#82 | 2.1%(+2.62)#3,951 |
| 83. | Pinson | 4.7% | 2.3%(+2.47)#83 | 2.1%(+2.59)#3,982 |
| 84. | Cottondale | 4.7% | 2.3%(+2.46)#84 | 2.1%(+2.58)#3,994 |
| 85. | Belk | 4.7% | 2.3%(+2.45)#85 | 2.1%(+2.57)#4,015 |
| 86. | Kinston | 4.7% | 2.3%(+2.43)#86 | 2.1%(+2.55)#4,037 |
| 87. | Pleasant Grove | 4.5% | 2.3%(+2.27)#87 | 2.1%(+2.39)#4,266 |
| 88. | Walnut Grove | 4.5% | 2.3%(+2.22)#88 | 2.1%(+2.34)#4,334 |
| 89. | Pine Hill | 4.5% | 2.3%(+2.20)#89 | 2.1%(+2.32)#4,355 |
| 90. | Selma | 4.5% | 2.3%(+2.20)#90 | 2.1%(+2.32)#4,368 |
| 91. | Guin | 4.5% | 2.3%(+2.20)#91 | 2.1%(+2.32)#4,369 |
| 92. | Hayden | 4.5% | 2.3%(+2.19)#92 | 2.1%(+2.31)#4,379 |
| 93. | Hayneville | 4.5% | 2.3%(+2.19)#93 | 2.1%(+2.31)#4,380 |
| 94. | Ballplay | 4.4% | 2.3%(+2.14)#94 | 2.1%(+2.27)#4,446 |
| 95. | White Hall | 4.4% | 2.3%(+2.14)#95 | 2.1%(+2.26)#4,447 |
| 96. | Phil Campbell | 4.4% | 2.3%(+2.13)#96 | 2.1%(+2.25)#4,466 |
| 97. | Goshen | 4.4% | 2.3%(+2.13)#97 | 2.1%(+2.25)#4,472 |
| 98. | Eufaula | 4.4% | 2.3%(+2.10)#98 | 2.1%(+2.22)#4,506 |
| 99. | Union Grove | 4.3% | 2.3%(+2.08)#99 | 2.1%(+2.20)#4,551 |
| 100. | Brantleyville | 4.3% | 2.3%(+2.06)#100 | 2.1%(+2.18)#4,570 |
Common Questions
What are the Top 10 Cities with the Highest Percentage of Population Employed in Security & Protection in Alabama?
Top 10 Cities with the Highest Percentage of Population Employed in Security & Protection in Alabama are:
#1
40.7%
#2
37.1%
#3
27.3%
#4
26.5%
#5
18.6%
#6
18.2%
#7
14.4%
#8
12.9%
#9
11.2%
#10
10.8%
What city has the Highest Percentage of Population Employed in Security & Protection in Alabama?
Bellamy has the Highest Percentage of Population Employed in Security & Protection in Alabama with 40.7%.
What is the Percentage of Population Employed in Security & Protection in the State of Alabama?
Percentage of Population Employed in Security & Protection in Alabama is 2.3%.
What is the Percentage of Population Employed in Security & Protection in the United States?
Percentage of Population Employed in Security & Protection in the United States is 2.1%.