Cities with the Highest Percentage of Population Employed in Security & Protection in Virginia
RELATED REPORTS & OPTIONS
Security & Protection
Virginia
Compare Cities
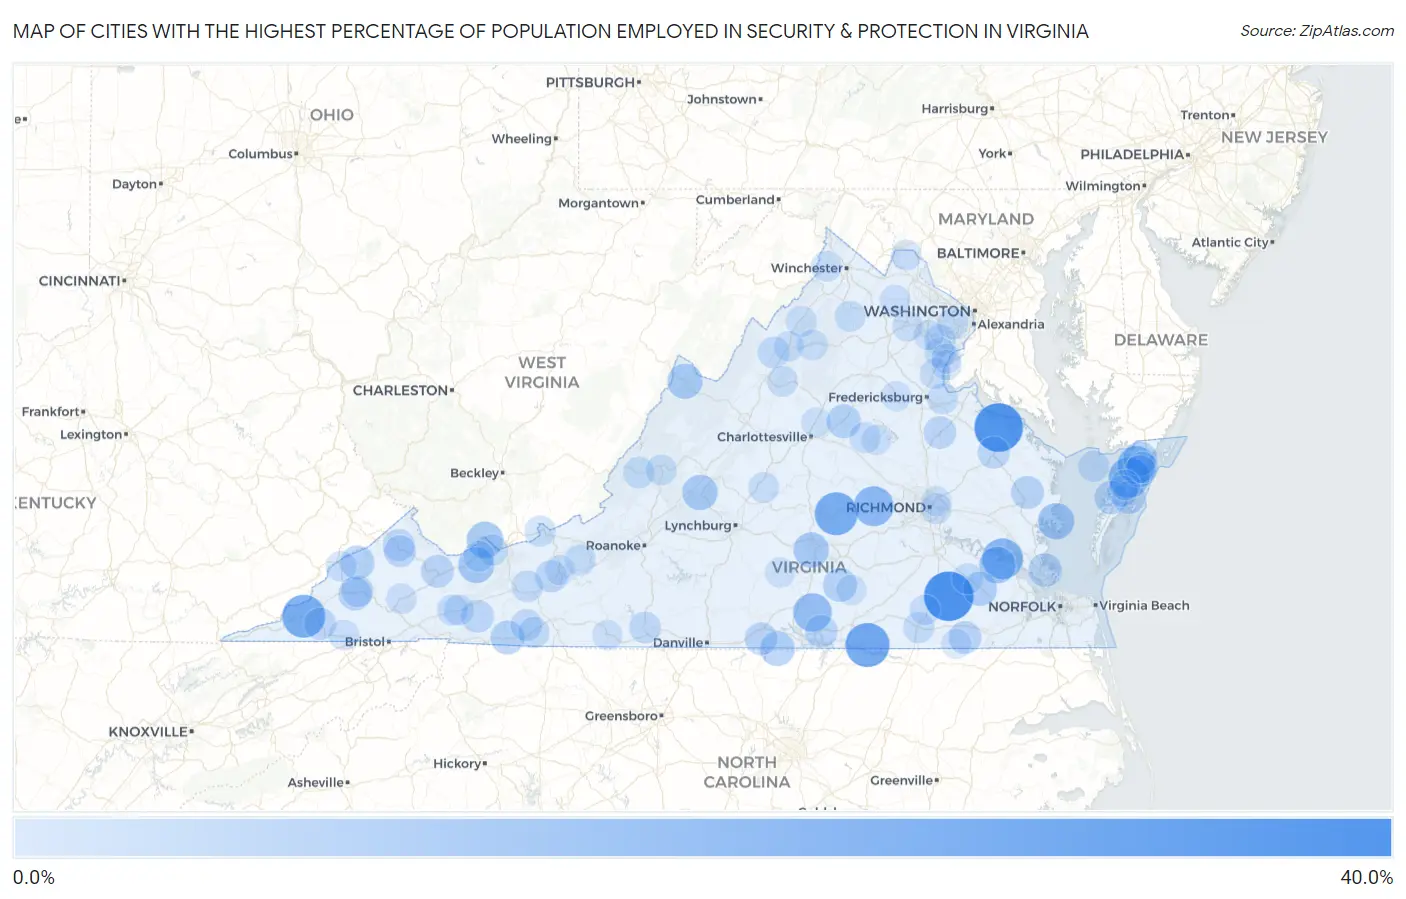
Map of Cities with the Highest Percentage of Population Employed in Security & Protection in Virginia
0.0%
40.0%
Cities with the Highest Percentage of Population Employed in Security & Protection in Virginia
| City | % Employed | vs State | vs National | |
| 1. | Sussex | 34.3% | 2.7%(+31.6)#1 | 2.1%(+32.1)#85 |
| 2. | East Stone Gap | 32.9% | 2.7%(+30.2)#2 | 2.1%(+30.7)#95 |
| 3. | Montross | 32.7% | 2.7%(+30.0)#3 | 2.1%(+30.6)#97 |
| 4. | Kincora | 27.9% | 2.7%(+25.2)#4 | 2.1%(+25.8)#140 |
| 5. | Eggleston | 27.5% | 2.7%(+24.8)#5 | 2.1%(+25.4)#145 |
| 6. | Boissevain | 26.5% | 2.7%(+23.8)#6 | 2.1%(+24.3)#156 |
| 7. | Ebony | 25.9% | 2.7%(+23.2)#7 | 2.1%(+23.8)#163 |
| 8. | Dryden | 24.2% | 2.7%(+21.5)#8 | 2.1%(+22.1)#197 |
| 9. | Cumberland | 24.2% | 2.7%(+21.5)#9 | 2.1%(+22.0)#199 |
| 10. | Scotland | 20.8% | 2.7%(+18.2)#10 | 2.1%(+18.7)#255 |
| 11. | Greenbush | 20.5% | 2.7%(+17.8)#11 | 2.1%(+18.3)#266 |
| 12. | Powhatan | 19.4% | 2.7%(+16.7)#12 | 2.1%(+17.2)#292 |
| 13. | Chase City | 17.5% | 2.7%(+14.8)#13 | 2.1%(+15.3)#358 |
| 14. | Bloxom | 16.7% | 2.7%(+14.0)#14 | 2.1%(+14.5)#393 |
| 15. | Surry | 14.7% | 2.7%(+12.0)#15 | 2.1%(+12.5)#503 |
| 16. | Pocahontas | 14.6% | 2.7%(+11.9)#16 | 2.1%(+12.4)#513 |
| 17. | Mathews | 14.3% | 2.7%(+11.7)#17 | 2.1%(+12.2)#533 |
| 18. | Gratton | 13.7% | 2.7%(+11.0)#18 | 2.1%(+11.5)#595 |
| 19. | Hampden Sydney | 12.8% | 2.7%(+10.1)#19 | 2.1%(+10.6)#685 |
| 20. | Glasgow | 12.7% | 2.7%(+10.00)#20 | 2.1%(+10.5)#694 |
| 21. | Monterey | 12.5% | 2.7%(+9.82)#21 | 2.1%(+10.4)#707 |
| 22. | Virgilina | 11.6% | 2.7%(+8.91)#22 | 2.1%(+9.45)#826 |
| 23. | Wakefield | 10.9% | 2.7%(+8.26)#23 | 2.1%(+8.80)#935 |
| 24. | Hallwood | 10.8% | 2.7%(+8.13)#24 | 2.1%(+8.66)#952 |
| 25. | Gordonsville | 10.7% | 2.7%(+8.03)#25 | 2.1%(+8.57)#966 |
| 26. | Clintwood | 10.6% | 2.7%(+7.94)#26 | 2.1%(+8.48)#993 |
| 27. | Independence | 10.6% | 2.7%(+7.89)#27 | 2.1%(+8.42)#1,002 |
| 28. | Victoria | 10.4% | 2.7%(+7.71)#28 | 2.1%(+8.25)#1,026 |
| 29. | Bethel Manor | 10.1% | 2.7%(+7.46)#29 | 2.1%(+7.99)#1,076 |
| 30. | Boston | 9.9% | 2.7%(+7.23)#30 | 2.1%(+7.76)#1,110 |
| 31. | Riverview | 9.7% | 2.7%(+7.04)#31 | 2.1%(+7.57)#1,155 |
| 32. | Urbanna | 9.6% | 2.7%(+6.93)#32 | 2.1%(+7.47)#1,172 |
| 33. | Wachapreague | 9.2% | 2.7%(+6.50)#33 | 2.1%(+7.04)#1,269 |
| 34. | Cedar Bluff | 9.0% | 2.7%(+6.34)#34 | 2.1%(+6.88)#1,328 |
| 35. | Cluster Springs | 9.0% | 2.7%(+6.28)#35 | 2.1%(+6.81)#1,341 |
| 36. | Newsoms | 8.9% | 2.7%(+6.25)#36 | 2.1%(+6.78)#1,359 |
| 37. | Sugar Grove | 8.8% | 2.7%(+6.16)#37 | 2.1%(+6.70)#1,382 |
| 38. | Bowling Green | 8.8% | 2.7%(+6.16)#38 | 2.1%(+6.69)#1,385 |
| 39. | Boydton | 8.8% | 2.7%(+6.14)#39 | 2.1%(+6.68)#1,389 |
| 40. | Duffield | 8.3% | 2.7%(+5.65)#40 | 2.1%(+6.18)#1,548 |
| 41. | Pulaski | 8.3% | 2.7%(+5.63)#41 | 2.1%(+6.16)#1,553 |
| 42. | Tappahannock | 8.2% | 2.7%(+5.55)#42 | 2.1%(+6.08)#1,578 |
| 43. | Grundy | 8.1% | 2.7%(+5.37)#43 | 2.1%(+5.90)#1,639 |
| 44. | Gargatha | 8.0% | 2.7%(+5.34)#44 | 2.1%(+5.88)#1,650 |
| 45. | Vansant | 7.9% | 2.7%(+5.24)#45 | 2.1%(+5.77)#1,680 |
| 46. | Coeburn | 7.8% | 2.7%(+5.07)#46 | 2.1%(+5.61)#1,741 |
| 47. | Broadway | 7.6% | 2.7%(+4.89)#47 | 2.1%(+5.43)#1,809 |
| 48. | Fries | 7.5% | 2.7%(+4.86)#48 | 2.1%(+5.40)#1,828 |
| 49. | Fieldale | 7.5% | 2.7%(+4.82)#49 | 2.1%(+5.35)#1,848 |
| 50. | Modest Town | 7.2% | 2.7%(+4.53)#50 | 2.1%(+5.07)#1,975 |
| 51. | Max Meadows | 7.2% | 2.7%(+4.52)#51 | 2.1%(+5.06)#1,980 |
| 52. | County Center | 7.1% | 2.7%(+4.41)#52 | 2.1%(+4.94)#2,026 |
| 53. | Galax | 7.1% | 2.7%(+4.40)#53 | 2.1%(+4.93)#2,033 |
| 54. | Tangier | 7.0% | 2.7%(+4.31)#54 | 2.1%(+4.84)#2,080 |
| 55. | Covington | 7.0% | 2.7%(+4.28)#55 | 2.1%(+4.81)#2,097 |
| 56. | Louisa | 6.9% | 2.7%(+4.22)#56 | 2.1%(+4.75)#2,129 |
| 57. | Belview | 6.9% | 2.7%(+4.21)#57 | 2.1%(+4.75)#2,134 |
| 58. | Emporia | 6.9% | 2.7%(+4.18)#58 | 2.1%(+4.72)#2,150 |
| 59. | Bluefield | 6.8% | 2.7%(+4.13)#59 | 2.1%(+4.67)#2,178 |
| 60. | Waverly | 6.8% | 2.7%(+4.10)#60 | 2.1%(+4.64)#2,191 |
| 61. | Kings Park | 6.7% | 2.7%(+4.07)#61 | 2.1%(+4.60)#2,204 |
| 62. | Glen Lyn | 6.7% | 2.7%(+3.98)#62 | 2.1%(+4.52)#2,273 |
| 63. | Passapatanzy | 6.7% | 2.7%(+3.97)#63 | 2.1%(+4.51)#2,277 |
| 64. | Seven Mile Ford | 6.6% | 2.7%(+3.93)#64 | 2.1%(+4.46)#2,294 |
| 65. | Springville | 6.5% | 2.7%(+3.84)#65 | 2.1%(+4.37)#2,350 |
| 66. | Melfa | 6.5% | 2.7%(+3.80)#66 | 2.1%(+4.34)#2,363 |
| 67. | Chester Gap | 6.5% | 2.7%(+3.80)#67 | 2.1%(+4.33)#2,365 |
| 68. | Montrose | 6.4% | 2.7%(+3.67)#68 | 2.1%(+4.21)#2,466 |
| 69. | Massanutten | 6.2% | 2.7%(+3.52)#69 | 2.1%(+4.06)#2,559 |
| 70. | Edinburg | 6.2% | 2.7%(+3.49)#70 | 2.1%(+4.03)#2,573 |
| 71. | Pound | 6.1% | 2.7%(+3.47)#71 | 2.1%(+4.00)#2,592 |
| 72. | Luray | 6.1% | 2.7%(+3.46)#72 | 2.1%(+3.99)#2,595 |
| 73. | Arrington | 6.1% | 2.7%(+3.46)#73 | 2.1%(+3.99)#2,600 |
| 74. | Mcmullin | 6.1% | 2.7%(+3.40)#74 | 2.1%(+3.93)#2,638 |
| 75. | Shawneeland | 6.1% | 2.7%(+3.39)#75 | 2.1%(+3.93)#2,643 |
| 76. | Iron Gate | 6.1% | 2.7%(+3.38)#76 | 2.1%(+3.91)#2,657 |
| 77. | Aquia Harbour | 6.0% | 2.7%(+3.32)#77 | 2.1%(+3.85)#2,705 |
| 78. | Montclair | 6.0% | 2.7%(+3.31)#78 | 2.1%(+3.84)#2,714 |
| 79. | Afton | 6.0% | 2.7%(+3.31)#79 | 2.1%(+3.84)#2,716 |
| 80. | Jarratt | 6.0% | 2.7%(+3.30)#80 | 2.1%(+3.83)#2,724 |
| 81. | Lebanon | 6.0% | 2.7%(+3.27)#81 | 2.1%(+3.81)#2,747 |
| 82. | Gate City | 5.9% | 2.7%(+3.26)#82 | 2.1%(+3.79)#2,762 |
| 83. | Gainesville | 5.9% | 2.7%(+3.25)#83 | 2.1%(+3.78)#2,772 |
| 84. | Lovettsville | 5.8% | 2.7%(+3.13)#84 | 2.1%(+3.67)#2,869 |
| 85. | Onley | 5.8% | 2.7%(+3.13)#85 | 2.1%(+3.67)#2,870 |
| 86. | Buckhall | 5.8% | 2.7%(+3.13)#86 | 2.1%(+3.66)#2,873 |
| 87. | New Market | 5.8% | 2.7%(+3.13)#87 | 2.1%(+3.66)#2,874 |
| 88. | Baywood | 5.7% | 2.7%(+3.03)#88 | 2.1%(+3.57)#2,949 |
| 89. | Middleburg | 5.5% | 2.7%(+2.84)#89 | 2.1%(+3.37)#3,137 |
| 90. | Kenbridge | 5.5% | 2.7%(+2.79)#90 | 2.1%(+3.33)#3,191 |
| 91. | Dublin | 5.5% | 2.7%(+2.78)#91 | 2.1%(+3.31)#3,207 |
| 92. | Lake Wilderness | 5.5% | 2.7%(+2.77)#92 | 2.1%(+3.30)#3,216 |
| 93. | Stuart | 5.4% | 2.7%(+2.74)#93 | 2.1%(+3.28)#3,239 |
| 94. | Quantico | 5.3% | 2.7%(+2.63)#94 | 2.1%(+3.16)#3,352 |
| 95. | Cherry Hill | 5.3% | 2.7%(+2.63)#95 | 2.1%(+3.16)#3,354 |
| 96. | Phenix | 5.3% | 2.7%(+2.62)#96 | 2.1%(+3.15)#3,372 |
| 97. | Hollymead | 5.3% | 2.7%(+2.61)#97 | 2.1%(+3.15)#3,376 |
| 98. | Mineral | 5.3% | 2.7%(+2.60)#98 | 2.1%(+3.14)#3,384 |
| 99. | Boykins | 5.3% | 2.7%(+2.60)#99 | 2.1%(+3.14)#3,385 |
| 100. | East Highland Park | 5.3% | 2.7%(+2.57)#100 | 2.1%(+3.11)#3,427 |
Common Questions
What are the Top 10 Cities with the Highest Percentage of Population Employed in Security & Protection in Virginia?
Top 10 Cities with the Highest Percentage of Population Employed in Security & Protection in Virginia are:
#1
34.3%
#2
32.7%
#3
25.9%
#4
24.2%
#5
24.2%
#6
20.8%
#7
20.5%
#8
19.4%
#9
17.5%
#10
16.7%
What city has the Highest Percentage of Population Employed in Security & Protection in Virginia?
Sussex has the Highest Percentage of Population Employed in Security & Protection in Virginia with 34.3%.
What is the Percentage of Population Employed in Security & Protection in the State of Virginia?
Percentage of Population Employed in Security & Protection in Virginia is 2.7%.
What is the Percentage of Population Employed in Security & Protection in the United States?
Percentage of Population Employed in Security & Protection in the United States is 2.1%.