Cities with the Highest Percentage of Population Employed in Security & Protection in New Jersey
RELATED REPORTS & OPTIONS
Security & Protection
New Jersey
Compare Cities
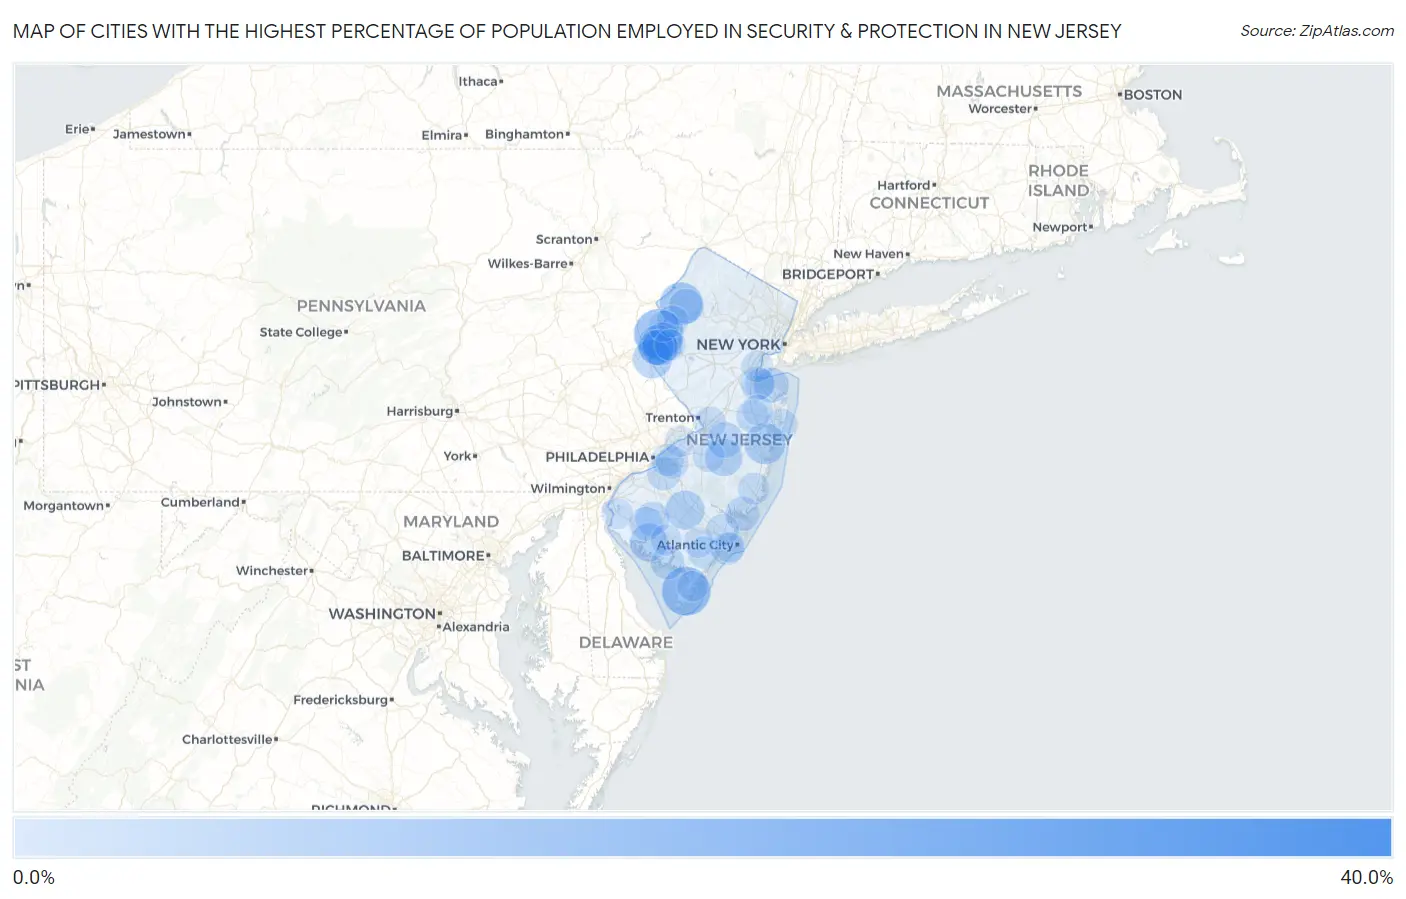
Map of Cities with the Highest Percentage of Population Employed in Security & Protection in New Jersey
0.0%
40.0%
Cities with the Highest Percentage of Population Employed in Security & Protection in New Jersey
| City | % Employed | vs State | vs National | |
| 1. | Dutch Neck | 37.7% | 2.4%(+35.3)#1 | 2.1%(+35.6)#71 |
| 2. | Port Elizabeth | 37.2% | 2.4%(+34.8)#2 | 2.1%(+35.0)#75 |
| 3. | Deerfield Street | 30.0% | 2.4%(+27.6)#3 | 2.1%(+27.9)#117 |
| 4. | Dividing Creek | 23.9% | 2.4%(+21.5)#4 | 2.1%(+21.8)#203 |
| 5. | Branchville Borough | 19.5% | 2.4%(+17.1)#5 | 2.1%(+17.4)#289 |
| 6. | Hutchinson | 17.8% | 2.4%(+15.4)#6 | 2.1%(+15.7)#341 |
| 7. | Whitesboro | 17.3% | 2.4%(+14.9)#7 | 2.1%(+15.2)#365 |
| 8. | William Paterson University Of New Jersey | 14.5% | 2.4%(+12.1)#8 | 2.1%(+12.4)#518 |
| 9. | Pine Beach Borough | 13.4% | 2.4%(+11.0)#9 | 2.1%(+11.3)#622 |
| 10. | Marksboro | 13.2% | 2.4%(+10.8)#10 | 2.1%(+11.1)#638 |
| 11. | Union | 12.8% | 2.4%(+10.4)#11 | 2.1%(+10.6)#684 |
| 12. | Leisure Village | 12.0% | 2.4%(+9.63)#12 | 2.1%(+9.88)#754 |
| 13. | Silver Lake | 11.7% | 2.4%(+9.26)#13 | 2.1%(+9.51)#815 |
| 14. | New Village | 11.2% | 2.4%(+8.76)#14 | 2.1%(+9.01)#887 |
| 15. | Upper Stewartsville | 11.1% | 2.4%(+8.71)#15 | 2.1%(+8.96)#897 |
| 16. | Finesville | 10.8% | 2.4%(+8.39)#16 | 2.1%(+8.64)#955 |
| 17. | Collings Lakes | 10.6% | 2.4%(+8.23)#17 | 2.1%(+8.49)#991 |
| 18. | Oceanville | 10.6% | 2.4%(+8.23)#18 | 2.1%(+8.49)#992 |
| 19. | West Park | 10.0% | 2.4%(+7.64)#19 | 2.1%(+7.89)#1,090 |
| 20. | Fairton | 9.9% | 2.4%(+7.51)#20 | 2.1%(+7.76)#1,109 |
| 21. | Sweetwater | 9.7% | 2.4%(+7.31)#21 | 2.1%(+7.56)#1,156 |
| 22. | Country Lake Estates | 9.6% | 2.4%(+7.15)#22 | 2.1%(+7.40)#1,185 |
| 23. | Marshallville | 9.0% | 2.4%(+6.62)#23 | 2.1%(+6.87)#1,329 |
| 24. | Stewartsville | 8.9% | 2.4%(+6.51)#24 | 2.1%(+6.76)#1,364 |
| 25. | Pluckemin | 8.7% | 2.4%(+6.29)#25 | 2.1%(+6.55)#1,430 |
| 26. | New Egypt | 8.6% | 2.4%(+6.21)#26 | 2.1%(+6.47)#1,451 |
| 27. | Greenwich | 8.0% | 2.4%(+5.60)#27 | 2.1%(+5.86)#1,653 |
| 28. | North Middletown | 8.0% | 2.4%(+5.56)#28 | 2.1%(+5.81)#1,672 |
| 29. | Johnsonburg | 7.9% | 2.4%(+5.48)#29 | 2.1%(+5.73)#1,693 |
| 30. | Wenonah Borough | 7.8% | 2.4%(+5.35)#30 | 2.1%(+5.60)#1,742 |
| 31. | Farmingdale Borough | 7.6% | 2.4%(+5.22)#31 | 2.1%(+5.47)#1,789 |
| 32. | Mystic Island | 7.4% | 2.4%(+5.04)#32 | 2.1%(+5.29)#1,887 |
| 33. | Olivet | 7.4% | 2.4%(+5.00)#33 | 2.1%(+5.25)#1,905 |
| 34. | Port Norris | 7.1% | 2.4%(+4.74)#34 | 2.1%(+4.99)#1,994 |
| 35. | Seabrook Farms | 7.1% | 2.4%(+4.73)#35 | 2.1%(+4.98)#2,012 |
| 36. | Woodbine Borough | 7.1% | 2.4%(+4.69)#36 | 2.1%(+4.94)#2,025 |
| 37. | Lower Berkshire Valley | 7.0% | 2.4%(+4.64)#37 | 2.1%(+4.90)#2,053 |
| 38. | Stanhope Borough | 7.0% | 2.4%(+4.63)#38 | 2.1%(+4.89)#2,058 |
| 39. | Laurence Harbor | 6.9% | 2.4%(+4.52)#39 | 2.1%(+4.78)#2,119 |
| 40. | Gouldtown | 6.7% | 2.4%(+4.32)#40 | 2.1%(+4.57)#2,233 |
| 41. | Glendora | 6.7% | 2.4%(+4.32)#41 | 2.1%(+4.57)#2,234 |
| 42. | West Belmar | 6.5% | 2.4%(+4.09)#42 | 2.1%(+4.34)#2,360 |
| 43. | West Freehold | 6.5% | 2.4%(+4.07)#43 | 2.1%(+4.32)#2,373 |
| 44. | Margate City | 6.4% | 2.4%(+3.98)#44 | 2.1%(+4.23)#2,445 |
| 45. | Stockton Borough | 6.4% | 2.4%(+3.96)#45 | 2.1%(+4.22)#2,454 |
| 46. | Delmont | 6.3% | 2.4%(+3.95)#46 | 2.1%(+4.20)#2,469 |
| 47. | Pomona | 6.3% | 2.4%(+3.88)#47 | 2.1%(+4.13)#2,506 |
| 48. | English Creek | 6.2% | 2.4%(+3.83)#48 | 2.1%(+4.08)#2,538 |
| 49. | Emerson Borough | 6.2% | 2.4%(+3.76)#49 | 2.1%(+4.02)#2,580 |
| 50. | Helmetta Borough | 6.1% | 2.4%(+3.66)#50 | 2.1%(+3.91)#2,652 |
| 51. | Lakeside-Beebe Run | 6.1% | 2.4%(+3.66)#51 | 2.1%(+3.91)#2,661 |
| 52. | Corbin City | 6.0% | 2.4%(+3.64)#52 | 2.1%(+3.89)#2,675 |
| 53. | Golden Triangle | 6.0% | 2.4%(+3.61)#53 | 2.1%(+3.86)#2,698 |
| 54. | Yardville | 6.0% | 2.4%(+3.55)#54 | 2.1%(+3.80)#2,748 |
| 55. | Kingston Estates | 5.9% | 2.4%(+3.54)#55 | 2.1%(+3.79)#2,761 |
| 56. | Silver Lake Cdp Essex County | 5.9% | 2.4%(+3.47)#56 | 2.1%(+3.73)#2,834 |
| 57. | Ocean Acres | 5.9% | 2.4%(+3.46)#57 | 2.1%(+3.72)#2,838 |
| 58. | Shrewsbury Borough | 5.8% | 2.4%(+3.37)#58 | 2.1%(+3.63)#2,906 |
| 59. | Leesburg | 5.7% | 2.4%(+3.34)#59 | 2.1%(+3.60)#2,929 |
| 60. | Mountain Lake | 5.7% | 2.4%(+3.33)#60 | 2.1%(+3.59)#2,937 |
| 61. | Port Reading | 5.7% | 2.4%(+3.26)#61 | 2.1%(+3.52)#2,991 |
| 62. | North Arlington Borough | 5.6% | 2.4%(+3.23)#62 | 2.1%(+3.48)#3,033 |
| 63. | Pemberton Heights | 5.6% | 2.4%(+3.19)#63 | 2.1%(+3.44)#3,069 |
| 64. | Allentown Borough | 5.6% | 2.4%(+3.17)#64 | 2.1%(+3.42)#3,085 |
| 65. | Park Ridge Borough | 5.5% | 2.4%(+3.14)#65 | 2.1%(+3.39)#3,121 |
| 66. | Mount Hope | 5.5% | 2.4%(+3.06)#66 | 2.1%(+3.31)#3,206 |
| 67. | Beverly | 5.4% | 2.4%(+2.96)#67 | 2.1%(+3.21)#3,296 |
| 68. | Ampere North | 5.4% | 2.4%(+2.95)#68 | 2.1%(+3.21)#3,300 |
| 69. | Belvidere | 5.3% | 2.4%(+2.90)#69 | 2.1%(+3.16)#3,358 |
| 70. | Wood Ridge Borough | 5.3% | 2.4%(+2.90)#70 | 2.1%(+3.16)#3,361 |
| 71. | Asbury | 5.3% | 2.4%(+2.86)#71 | 2.1%(+3.11)#3,415 |
| 72. | Layton | 5.3% | 2.4%(+2.85)#72 | 2.1%(+3.10)#3,428 |
| 73. | Cologne | 5.2% | 2.4%(+2.83)#73 | 2.1%(+3.09)#3,445 |
| 74. | Millington | 5.2% | 2.4%(+2.83)#74 | 2.1%(+3.08)#3,453 |
| 75. | Millville | 5.2% | 2.4%(+2.81)#75 | 2.1%(+3.06)#3,467 |
| 76. | Mckee | 5.2% | 2.4%(+2.77)#76 | 2.1%(+3.02)#3,510 |
| 77. | Cliffwood Beach | 5.2% | 2.4%(+2.76)#77 | 2.1%(+3.01)#3,522 |
| 78. | Salem | 5.1% | 2.4%(+2.69)#78 | 2.1%(+2.94)#3,604 |
| 79. | Tuckerton Borough | 5.1% | 2.4%(+2.66)#79 | 2.1%(+2.91)#3,631 |
| 80. | Estell Manor | 5.0% | 2.4%(+2.64)#80 | 2.1%(+2.90)#3,640 |
| 81. | East Freehold | 5.0% | 2.4%(+2.64)#81 | 2.1%(+2.90)#3,642 |
| 82. | Goshen | 5.0% | 2.4%(+2.62)#82 | 2.1%(+2.88)#3,664 |
| 83. | Whippany | 5.0% | 2.4%(+2.59)#83 | 2.1%(+2.84)#3,701 |
| 84. | Milltown Borough | 5.0% | 2.4%(+2.58)#84 | 2.1%(+2.83)#3,713 |
| 85. | Marmora | 5.0% | 2.4%(+2.57)#85 | 2.1%(+2.82)#3,720 |
| 86. | Andover Borough | 5.0% | 2.4%(+2.56)#86 | 2.1%(+2.82)#3,727 |
| 87. | Belmar Borough | 4.9% | 2.4%(+2.54)#87 | 2.1%(+2.80)#3,753 |
| 88. | Cape May Court House | 4.9% | 2.4%(+2.53)#88 | 2.1%(+2.79)#3,767 |
| 89. | Green | 4.9% | 2.4%(+2.51)#89 | 2.1%(+2.76)#3,800 |
| 90. | Avon By The Sea Borough | 4.9% | 2.4%(+2.47)#90 | 2.1%(+2.72)#3,846 |
| 91. | Ringwood Borough | 4.8% | 2.4%(+2.43)#91 | 2.1%(+2.68)#3,892 |
| 92. | Newport | 4.8% | 2.4%(+2.36)#92 | 2.1%(+2.61)#3,961 |
| 93. | Carteret Borough | 4.7% | 2.4%(+2.30)#93 | 2.1%(+2.55)#4,034 |
| 94. | Oceanport Borough | 4.7% | 2.4%(+2.29)#94 | 2.1%(+2.54)#4,045 |
| 95. | Haddon Heights Borough | 4.7% | 2.4%(+2.27)#95 | 2.1%(+2.52)#4,085 |
| 96. | Kean University | 4.6% | 2.4%(+2.23)#96 | 2.1%(+2.49)#4,125 |
| 97. | Ventnor City | 4.6% | 2.4%(+2.23)#97 | 2.1%(+2.49)#4,129 |
| 98. | Clementon Borough | 4.6% | 2.4%(+2.22)#98 | 2.1%(+2.47)#4,149 |
| 99. | Seaside Heights Borough | 4.6% | 2.4%(+2.20)#99 | 2.1%(+2.46)#4,174 |
| 100. | Spring Lake Heights Borough | 4.6% | 2.4%(+2.20)#100 | 2.1%(+2.45)#4,185 |
Common Questions
What are the Top 10 Cities with the Highest Percentage of Population Employed in Security & Protection in New Jersey?
Top 10 Cities with the Highest Percentage of Population Employed in Security & Protection in New Jersey are:
#1
17.8%
#2
17.3%
#3
13.2%
#4
12.0%
#5
11.2%
#6
11.1%
#7
10.8%
#8
10.6%
#9
9.9%
#10
9.6%
What city has the Highest Percentage of Population Employed in Security & Protection in New Jersey?
Hutchinson has the Highest Percentage of Population Employed in Security & Protection in New Jersey with 17.8%.
What is the Percentage of Population Employed in Security & Protection in the State of New Jersey?
Percentage of Population Employed in Security & Protection in New Jersey is 2.4%.
What is the Percentage of Population Employed in Security & Protection in the United States?
Percentage of Population Employed in Security & Protection in the United States is 2.1%.