Imperial, CA Map & Demographics
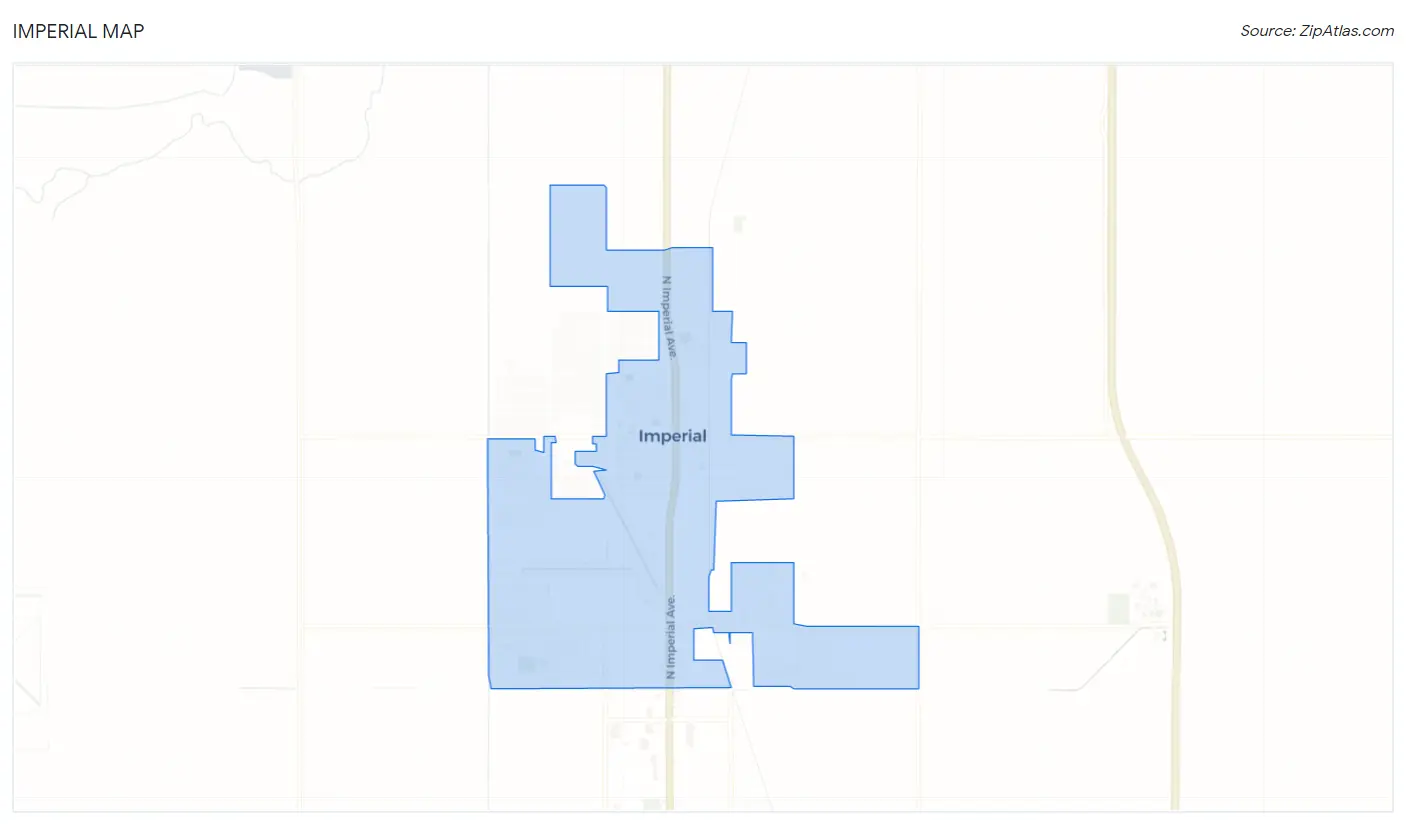
Imperial Map
Imperial Overview
$25,203
PER CAPITA INCOME
$94,163
AVG FAMILY INCOME
$83,029
AVG HOUSEHOLD INCOME
41.8%
WAGE / INCOME GAP [ % ]
58.2¢/ $1
WAGE / INCOME GAP [ $ ]
0.37
INEQUALITY / GINI INDEX
20,430
TOTAL POPULATION
9,891
MALE POPULATION
10,539
FEMALE POPULATION
93.85
MALES / 100 FEMALES
106.55
FEMALES / 100 MALES
30.4
MEDIAN AGE
4.7
AVG FAMILY SIZE
4.0
AVG HOUSEHOLD SIZE
8,263
LABOR FORCE [ PEOPLE ]
58.5%
PERCENT IN LABOR FORCE
10.7%
UNEMPLOYMENT RATE
Imperial Zip Codes
Imperial Area Codes
Income in Imperial
Income Overview in Imperial
Per Capita Income in Imperial is $25,203, while median incomes of families and households are $94,163 and $83,029 respectively.
| Characteristic | Number | Measure |
| Per Capita Income | 20,430 | $25,203 |
| Median Family Income | 3,979 | $94,163 |
| Mean Family Income | 3,979 | $100,121 |
| Median Household Income | 5,146 | $83,029 |
| Mean Household Income | 5,146 | $93,310 |
| Income Deficit | 3,979 | $0 |
| Wage / Income Gap (%) | 20,430 | 41.83% |
| Wage / Income Gap ($) | 20,430 | 58.17¢ per $1 |
| Gini / Inequality Index | 20,430 | 0.37 |
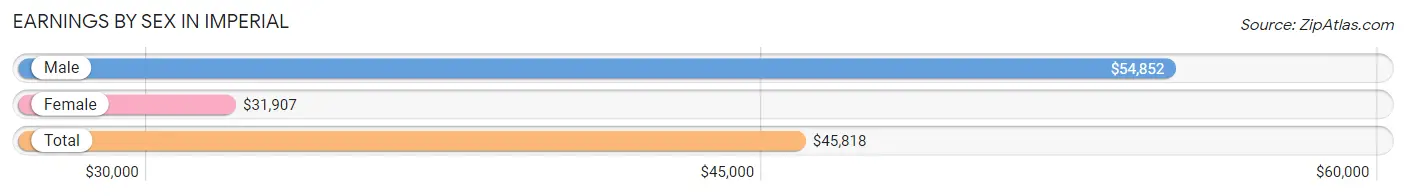
Earnings by Sex in Imperial
Average Earnings in Imperial are $45,818, $54,852 for men and $31,907 for women, a difference of 41.8%.
| Sex | Number | Average Earnings |
| Male | 4,233 (53.1%) | $54,852 |
| Female | 3,733 (46.9%) | $31,907 |
| Total | 7,966 (100.0%) | $45,818 |
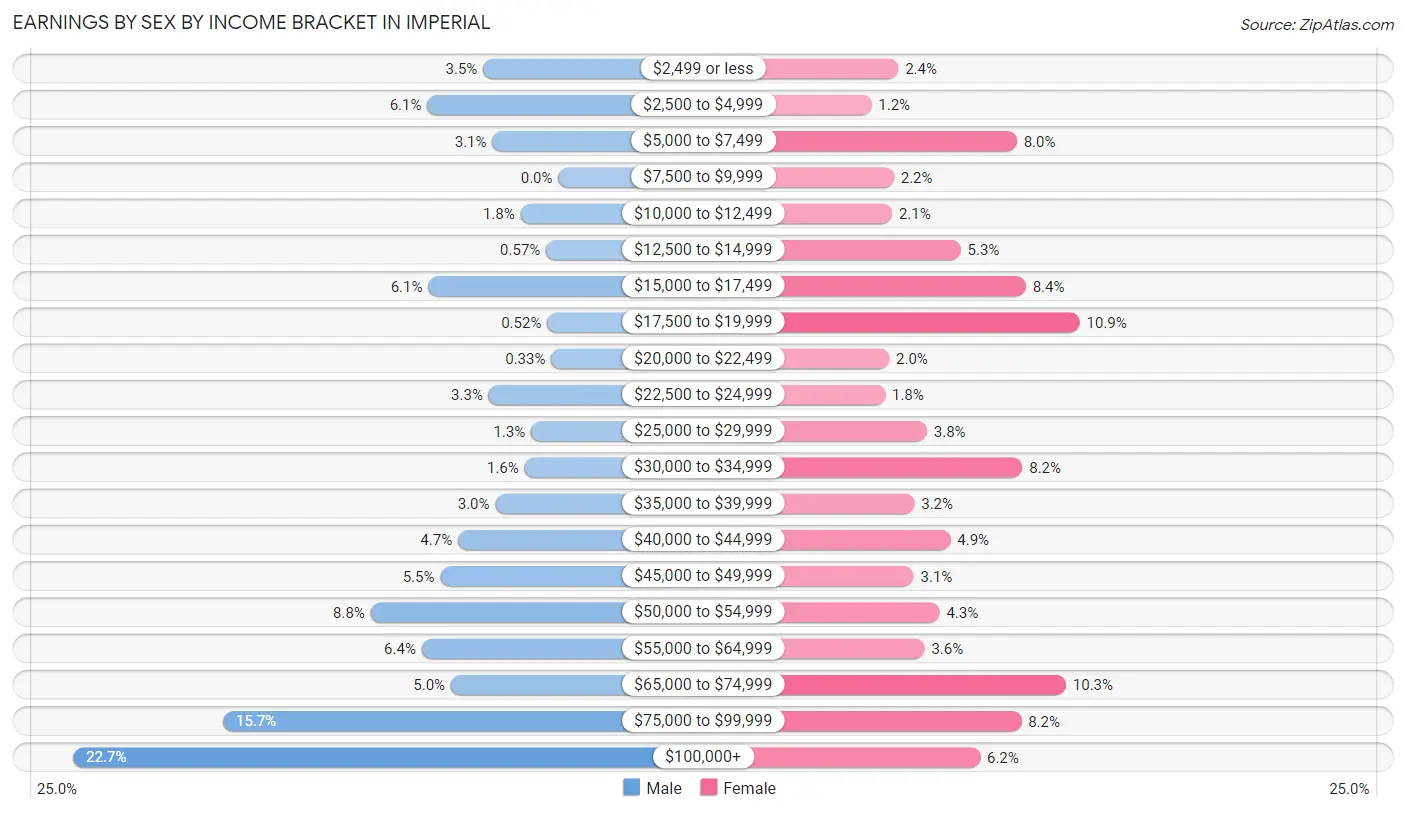
Earnings by Sex by Income Bracket in Imperial
The most common earnings brackets in Imperial are $100,000+ for men (962 | 22.7%) and $17,500 to $19,999 for women (407 | 10.9%).
| Income | Male | Female |
| $2,499 or less | 149 (3.5%) | 90 (2.4%) |
| $2,500 to $4,999 | 260 (6.1%) | 43 (1.1%) |
| $5,000 to $7,499 | 131 (3.1%) | 297 (8.0%) |
| $7,500 to $9,999 | 0 (0.0%) | 82 (2.2%) |
| $10,000 to $12,499 | 75 (1.8%) | 79 (2.1%) |
| $12,500 to $14,999 | 24 (0.6%) | 199 (5.3%) |
| $15,000 to $17,499 | 258 (6.1%) | 313 (8.4%) |
| $17,500 to $19,999 | 22 (0.5%) | 407 (10.9%) |
| $20,000 to $22,499 | 14 (0.3%) | 74 (2.0%) |
| $22,500 to $24,999 | 138 (3.3%) | 67 (1.8%) |
| $25,000 to $29,999 | 54 (1.3%) | 140 (3.7%) |
| $30,000 to $34,999 | 67 (1.6%) | 307 (8.2%) |
| $35,000 to $39,999 | 125 (2.9%) | 118 (3.2%) |
| $40,000 to $44,999 | 199 (4.7%) | 181 (4.9%) |
| $45,000 to $49,999 | 234 (5.5%) | 117 (3.1%) |
| $50,000 to $54,999 | 372 (8.8%) | 162 (4.3%) |
| $55,000 to $64,999 | 271 (6.4%) | 136 (3.6%) |
| $65,000 to $74,999 | 213 (5.0%) | 383 (10.3%) |
| $75,000 to $99,999 | 665 (15.7%) | 305 (8.2%) |
| $100,000+ | 962 (22.7%) | 233 (6.2%) |
| Total | 4,233 (100.0%) | 3,733 (100.0%) |
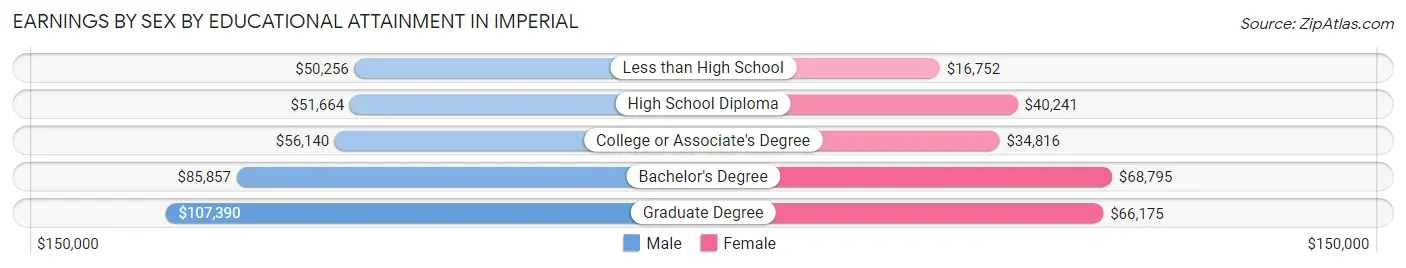
Earnings by Sex by Educational Attainment in Imperial
Average earnings in Imperial are $58,080 for men and $38,462 for women, a difference of 33.8%. Men with an educational attainment of graduate degree enjoy the highest average annual earnings of $107,390, while those with less than high school education earn the least with $50,256. Women with an educational attainment of bachelor's degree earn the most with the average annual earnings of $68,795, while those with less than high school education have the smallest earnings of $16,752.
| Educational Attainment | Male Income | Female Income |
| Less than High School | $50,256 | $16,752 |
| High School Diploma | $51,664 | $40,241 |
| College or Associate's Degree | $56,140 | $34,816 |
| Bachelor's Degree | $85,857 | $68,795 |
| Graduate Degree | $107,390 | $66,175 |
| Total | $58,080 | $38,462 |
Family Income in Imperial
Family Income Brackets in Imperial
According to the Imperial family income data, there are 1,257 families falling into the $100,000 to $149,999 income range, which is the most common income bracket and makes up 31.6% of all families. Conversely, the $10,000 to $14,999 income bracket is the least frequent group with only 36 families (0.9%) belonging to this category.
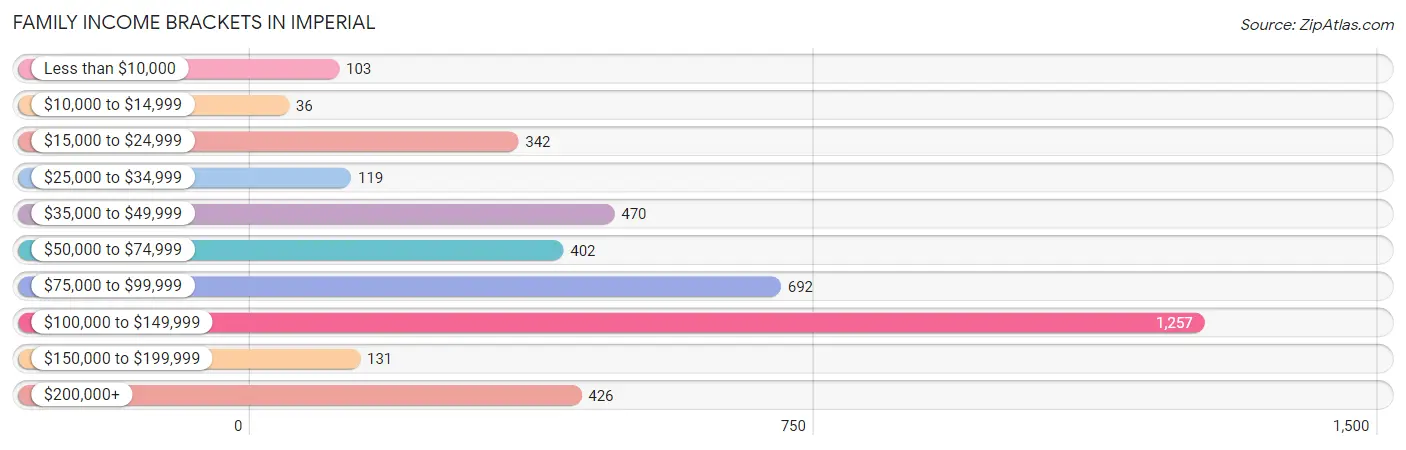
| Income Bracket | # Families | % Families |
| Less than $10,000 | 103 | 2.6% |
| $10,000 to $14,999 | 36 | 0.9% |
| $15,000 to $24,999 | 342 | 8.6% |
| $25,000 to $34,999 | 119 | 3.0% |
| $35,000 to $49,999 | 470 | 11.8% |
| $50,000 to $74,999 | 402 | 10.1% |
| $75,000 to $99,999 | 692 | 17.4% |
| $100,000 to $149,999 | 1,257 | 31.6% |
| $150,000 to $199,999 | 131 | 3.3% |
| $200,000+ | 426 | 10.7% |
Family Income by Famaliy Size in Imperial
6-person families (474 | 11.9%) account for the highest median family income in Imperial with $115,243 per family, while 2-person families (1,055 | 26.5%) have the highest median income of $45,174 per family member.
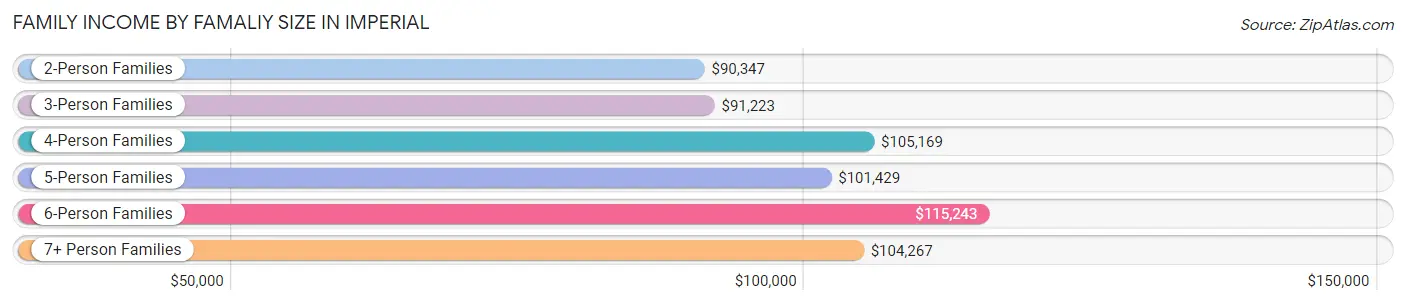
| Income Bracket | # Families | Median Income |
| 2-Person Families | 1,055 (26.5%) | $90,347 |
| 3-Person Families | 914 (23.0%) | $91,223 |
| 4-Person Families | 948 (23.8%) | $105,169 |
| 5-Person Families | 416 (10.4%) | $101,429 |
| 6-Person Families | 474 (11.9%) | $115,243 |
| 7+ Person Families | 172 (4.3%) | $104,267 |
| Total | 3,979 (100.0%) | $94,163 |
Family Income by Number of Earners in Imperial
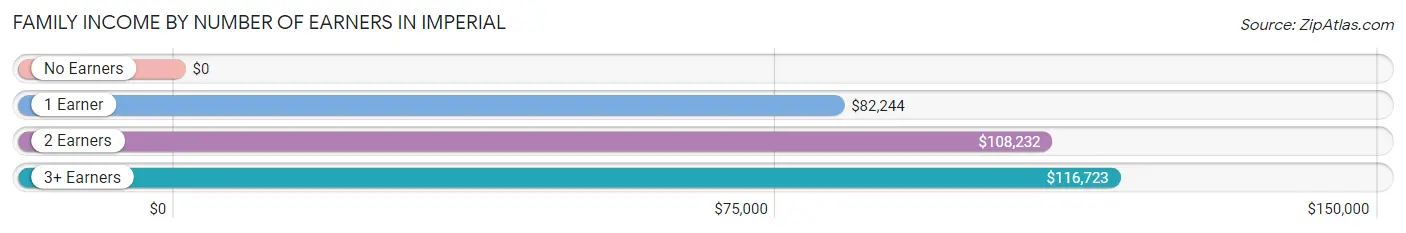
| Number of Earners | # Families | Median Income |
| No Earners | 649 (16.3%) | $0 |
| 1 Earner | 1,536 (38.6%) | $82,244 |
| 2 Earners | 1,240 (31.2%) | $108,232 |
| 3+ Earners | 554 (13.9%) | $116,723 |
| Total | 3,979 (100.0%) | $94,163 |
Household Income in Imperial
Household Income Brackets in Imperial
With 1,323 households falling in the category, the $100,000 to $149,999 income range is the most frequent in Imperial, accounting for 25.7% of all households. In contrast, only 82 households (1.6%) fall into the $10,000 to $14,999 income bracket, making it the least populous group.
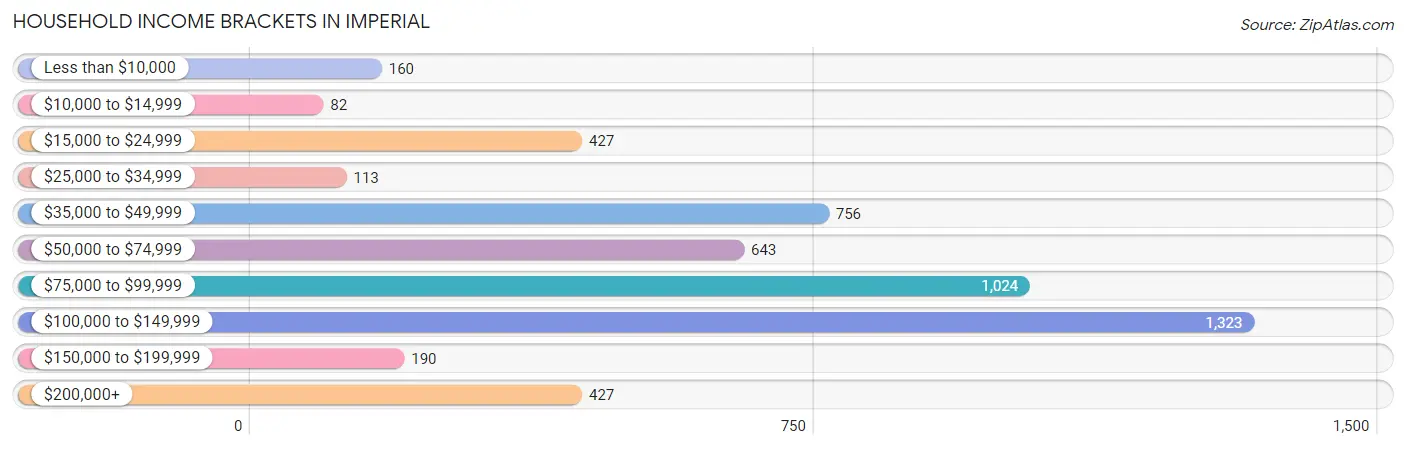
| Income Bracket | # Households | % Households |
| Less than $10,000 | 160 | 3.1% |
| $10,000 to $14,999 | 82 | 1.6% |
| $15,000 to $24,999 | 427 | 8.3% |
| $25,000 to $34,999 | 113 | 2.2% |
| $35,000 to $49,999 | 756 | 14.7% |
| $50,000 to $74,999 | 643 | 12.5% |
| $75,000 to $99,999 | 1,024 | 19.9% |
| $100,000 to $149,999 | 1,323 | 25.7% |
| $150,000 to $199,999 | 190 | 3.7% |
| $200,000+ | 427 | 8.3% |
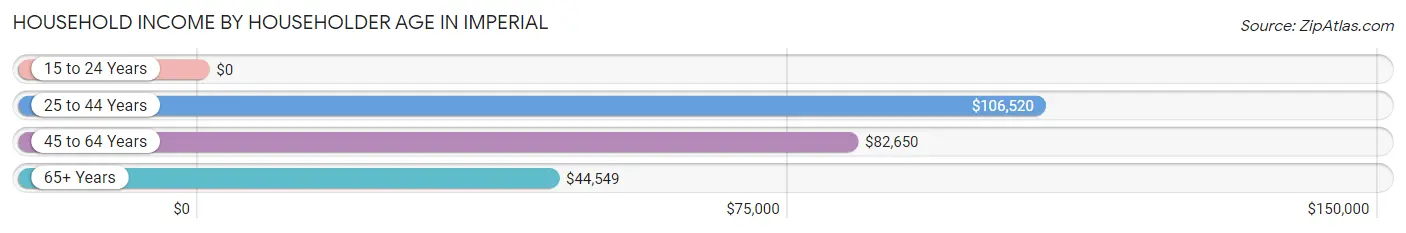
Household Income by Householder Age in Imperial
The median household income in Imperial is $83,029, with the highest median household income of $106,520 found in the 25 to 44 years age bracket for the primary householder. A total of 2,006 households (39.0%) fall into this category. Meanwhile, the 15 to 24 years age bracket for the primary householder has the lowest median household income of $0, with 124 households (2.4%) in this group.
| Income Bracket | # Households | Median Income |
| 15 to 24 Years | 124 (2.4%) | $0 |
| 25 to 44 Years | 2,006 (39.0%) | $106,520 |
| 45 to 64 Years | 2,257 (43.9%) | $82,650 |
| 65+ Years | 759 (14.7%) | $44,549 |
| Total | 5,146 (100.0%) | $83,029 |
Poverty in Imperial
Income Below Poverty by Sex and Age in Imperial
With 10.8% poverty level for males and 11.3% for females among the residents of Imperial, 15 year old males and 65 to 74 year old females are the most vulnerable to poverty, with 68 males (45.0%) and 137 females (22.1%) in their respective age groups living below the poverty level.
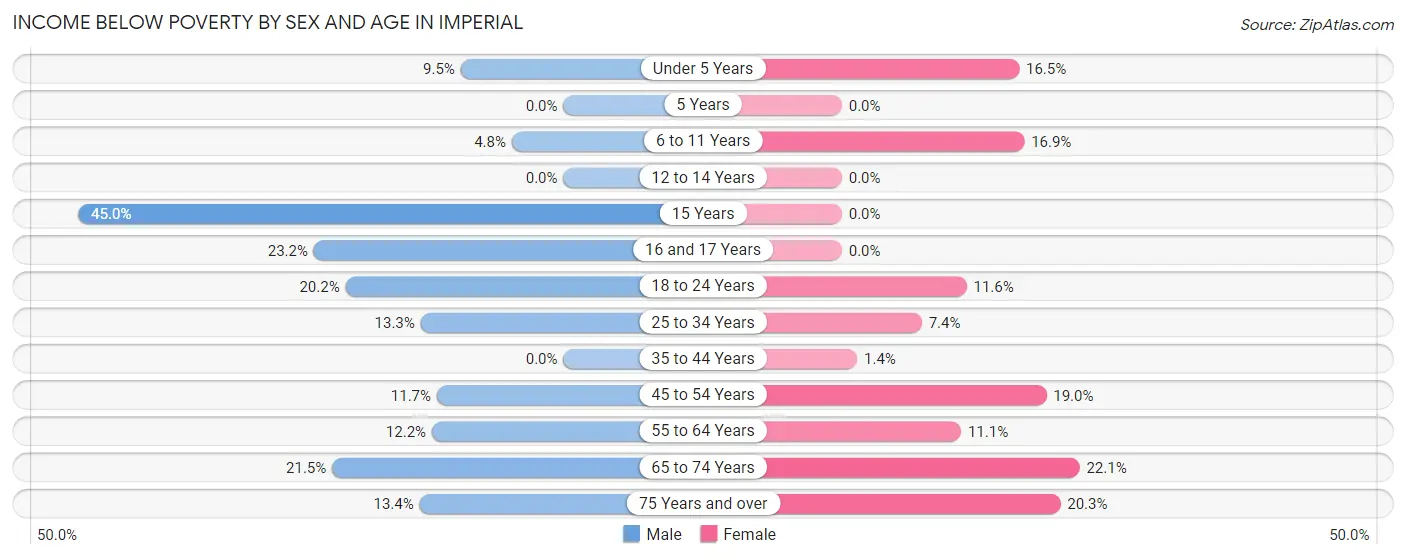
| Age Bracket | Male | Female |
| Under 5 Years | 92 (9.5%) | 177 (16.5%) |
| 5 Years | 0 (0.0%) | 0 (0.0%) |
| 6 to 11 Years | 67 (4.8%) | 206 (16.9%) |
| 12 to 14 Years | 0 (0.0%) | 0 (0.0%) |
| 15 Years | 68 (45.0%) | 0 (0.0%) |
| 16 and 17 Years | 110 (23.2%) | 0 (0.0%) |
| 18 to 24 Years | 168 (20.2%) | 157 (11.6%) |
| 25 to 34 Years | 120 (13.3%) | 73 (7.4%) |
| 35 to 44 Years | 0 (0.0%) | 18 (1.4%) |
| 45 to 54 Years | 123 (11.7%) | 209 (19.0%) |
| 55 to 64 Years | 176 (12.2%) | 129 (11.1%) |
| 65 to 74 Years | 91 (21.5%) | 137 (22.1%) |
| 75 Years and over | 51 (13.4%) | 87 (20.3%) |
| Total | 1,066 (10.8%) | 1,193 (11.3%) |
Income Above Poverty by Sex and Age in Imperial
According to the poverty statistics in Imperial, males aged 5 years and females aged 5 years are the age groups that are most secure financially, with 100.0% of males and 100.0% of females in these age groups living above the poverty line.
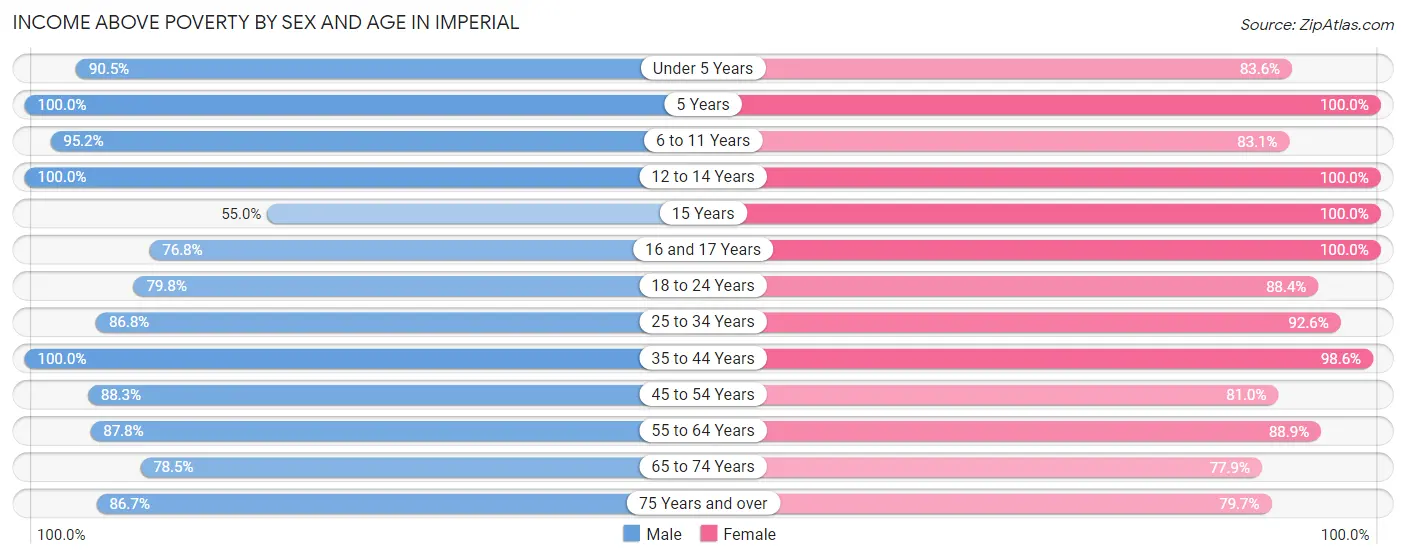
| Age Bracket | Male | Female |
| Under 5 Years | 873 (90.5%) | 899 (83.6%) |
| 5 Years | 156 (100.0%) | 325 (100.0%) |
| 6 to 11 Years | 1,335 (95.2%) | 1,011 (83.1%) |
| 12 to 14 Years | 405 (100.0%) | 330 (100.0%) |
| 15 Years | 83 (55.0%) | 279 (100.0%) |
| 16 and 17 Years | 365 (76.8%) | 377 (100.0%) |
| 18 to 24 Years | 663 (79.8%) | 1,199 (88.4%) |
| 25 to 34 Years | 786 (86.8%) | 911 (92.6%) |
| 35 to 44 Years | 1,284 (100.0%) | 1,248 (98.6%) |
| 45 to 54 Years | 925 (88.3%) | 892 (81.0%) |
| 55 to 64 Years | 1,267 (87.8%) | 1,037 (88.9%) |
| 65 to 74 Years | 333 (78.5%) | 484 (77.9%) |
| 75 Years and over | 331 (86.7%) | 342 (79.7%) |
| Total | 8,806 (89.2%) | 9,334 (88.7%) |
Income Below Poverty Among Married-Couple Families in Imperial
The poverty statistics for married-couple families in Imperial show that 5.6% or 147 of the total 2,623 families live below the poverty line. Families with no children have the highest poverty rate of 9.7%, comprising of 130 families. On the other hand, families with 3 or 4 children have the lowest poverty rate of 0.0%, which includes 0 families.
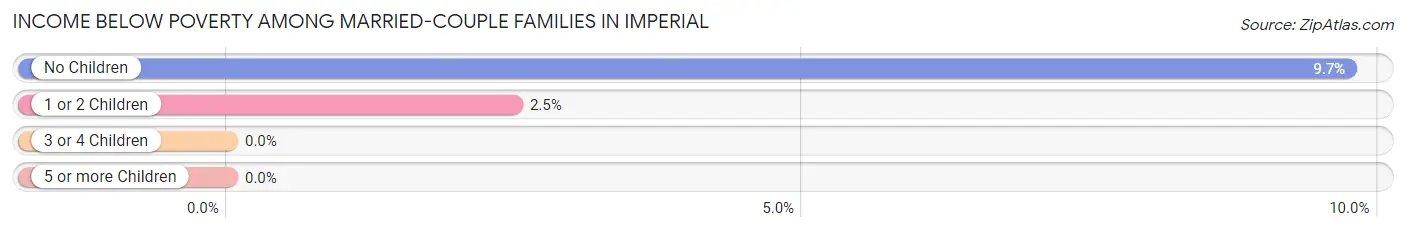
| Children | Above Poverty | Below Poverty |
| No Children | 1,205 (90.3%) | 130 (9.7%) |
| 1 or 2 Children | 669 (97.5%) | 17 (2.5%) |
| 3 or 4 Children | 578 (100.0%) | 0 (0.0%) |
| 5 or more Children | 24 (100.0%) | 0 (0.0%) |
| Total | 2,476 (94.4%) | 147 (5.6%) |
Income Below Poverty Among Single-Parent Households in Imperial
According to the poverty data in Imperial, 4.5% or 16 single-father households and 20.4% or 204 single-mother households are living below the poverty line. Among single-father households, those with no children have the highest poverty rate, with 16 households (7.6%) experiencing poverty. Likewise, among single-mother households, those with 1 or 2 children have the highest poverty rate, with 144 households (23.8%) falling below the poverty line.
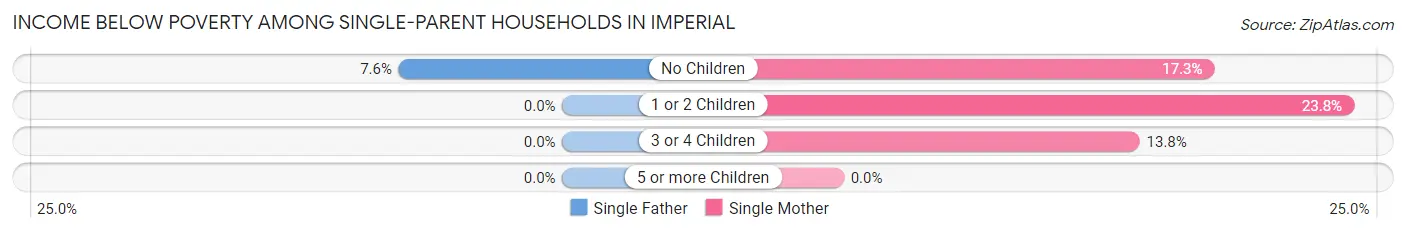
| Children | Single Father | Single Mother |
| No Children | 16 (7.6%) | 29 (17.3%) |
| 1 or 2 Children | 0 (0.0%) | 144 (23.8%) |
| 3 or 4 Children | 0 (0.0%) | 31 (13.8%) |
| 5 or more Children | 0 (0.0%) | 0 (0.0%) |
| Total | 16 (4.5%) | 204 (20.4%) |
Income Below Poverty Among Married-Couple vs Single-Parent Households in Imperial
The poverty data for Imperial shows that 147 of the married-couple family households (5.6%) and 220 of the single-parent households (16.2%) are living below the poverty level. Within the married-couple family households, those with no children have the highest poverty rate, with 130 households (9.7%) falling below the poverty line. Among the single-parent households, those with 1 or 2 children have the highest poverty rate, with 144 household (19.1%) living below poverty.
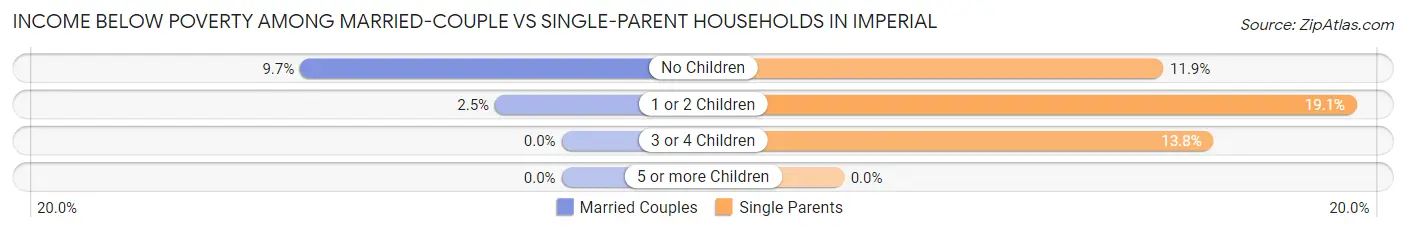
| Children | Married-Couple Families | Single-Parent Households |
| No Children | 130 (9.7%) | 45 (11.9%) |
| 1 or 2 Children | 17 (2.5%) | 144 (19.1%) |
| 3 or 4 Children | 0 (0.0%) | 31 (13.8%) |
| 5 or more Children | 0 (0.0%) | 0 (0.0%) |
| Total | 147 (5.6%) | 220 (16.2%) |
Race in Imperial
The most populous races in Imperial are Hispanic or Latino (16,449 | 80.5%), White / Caucasian (10,250 | 50.2%), and Some other Race (5,094 | 24.9%).
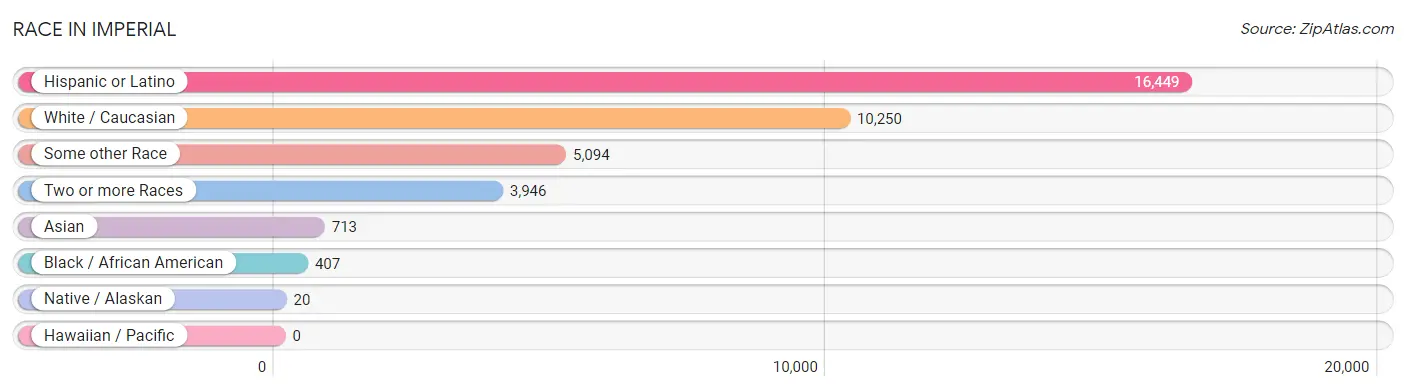
| Race | # Population | % Population |
| Asian | 713 | 3.5% |
| Black / African American | 407 | 2.0% |
| Hawaiian / Pacific | 0 | 0.0% |
| Hispanic or Latino | 16,449 | 80.5% |
| Native / Alaskan | 20 | 0.1% |
| White / Caucasian | 10,250 | 50.2% |
| Two or more Races | 3,946 | 19.3% |
| Some other Race | 5,094 | 24.9% |
| Total | 20,430 | 100.0% |
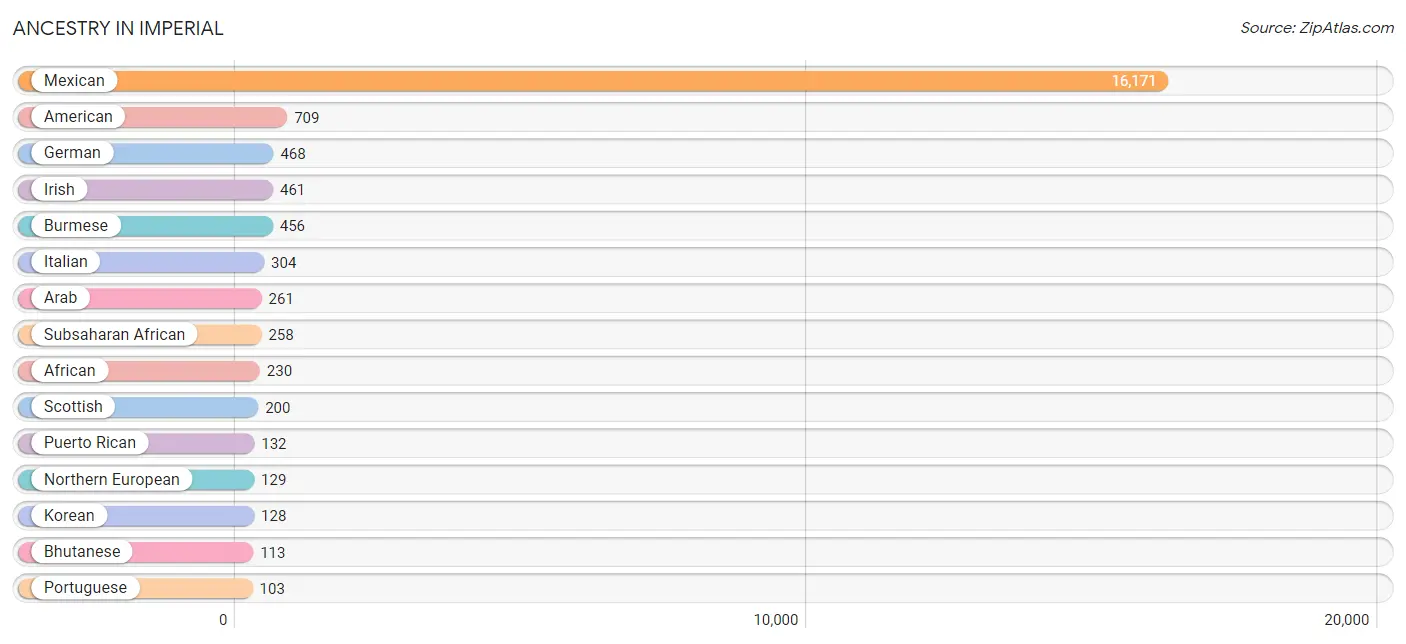
Ancestry in Imperial
The most populous ancestries reported in Imperial are Mexican (16,171 | 79.1%), American (709 | 3.5%), German (468 | 2.3%), Irish (461 | 2.3%), and Burmese (456 | 2.2%), together accounting for 89.4% of all Imperial residents.
| Ancestry | # Population | % Population |
| African | 230 | 1.1% |
| American | 709 | 3.5% |
| Arab | 261 | 1.3% |
| Bhutanese | 113 | 0.5% |
| British | 26 | 0.1% |
| Burmese | 456 | 2.2% |
| Central American | 28 | 0.1% |
| English | 82 | 0.4% |
| European | 72 | 0.4% |
| French Canadian | 19 | 0.1% |
| German | 468 | 2.3% |
| Indian (Asian) | 41 | 0.2% |
| Irish | 461 | 2.3% |
| Italian | 304 | 1.5% |
| Jordanian | 35 | 0.2% |
| Korean | 128 | 0.6% |
| Lithuanian | 21 | 0.1% |
| Mexican | 16,171 | 79.1% |
| Mexican American Indian | 66 | 0.3% |
| Native Hawaiian | 8 | 0.0% |
| Navajo | 49 | 0.2% |
| Nigerian | 28 | 0.1% |
| Northern European | 129 | 0.6% |
| Norwegian | 33 | 0.2% |
| Panamanian | 28 | 0.1% |
| Portuguese | 103 | 0.5% |
| Puerto Rican | 132 | 0.6% |
| Russian | 13 | 0.1% |
| Scottish | 200 | 1.0% |
| Slovene | 28 | 0.1% |
| Spaniard | 57 | 0.3% |
| Sri Lankan | 75 | 0.4% |
| Subsaharan African | 258 | 1.3% |
| Swedish | 26 | 0.1% |
| Thai | 32 | 0.2% |
| Turkish | 37 | 0.2% | View All 36 Rows |
Immigrants in Imperial
The most numerous immigrant groups reported in Imperial came from Central America (4,608 | 22.6%), Latin America (4,608 | 22.6%), Mexico (4,554 | 22.3%), Asia (382 | 1.9%), and Eastern Asia (276 | 1.3%), together accounting for 70.6% of all Imperial residents.
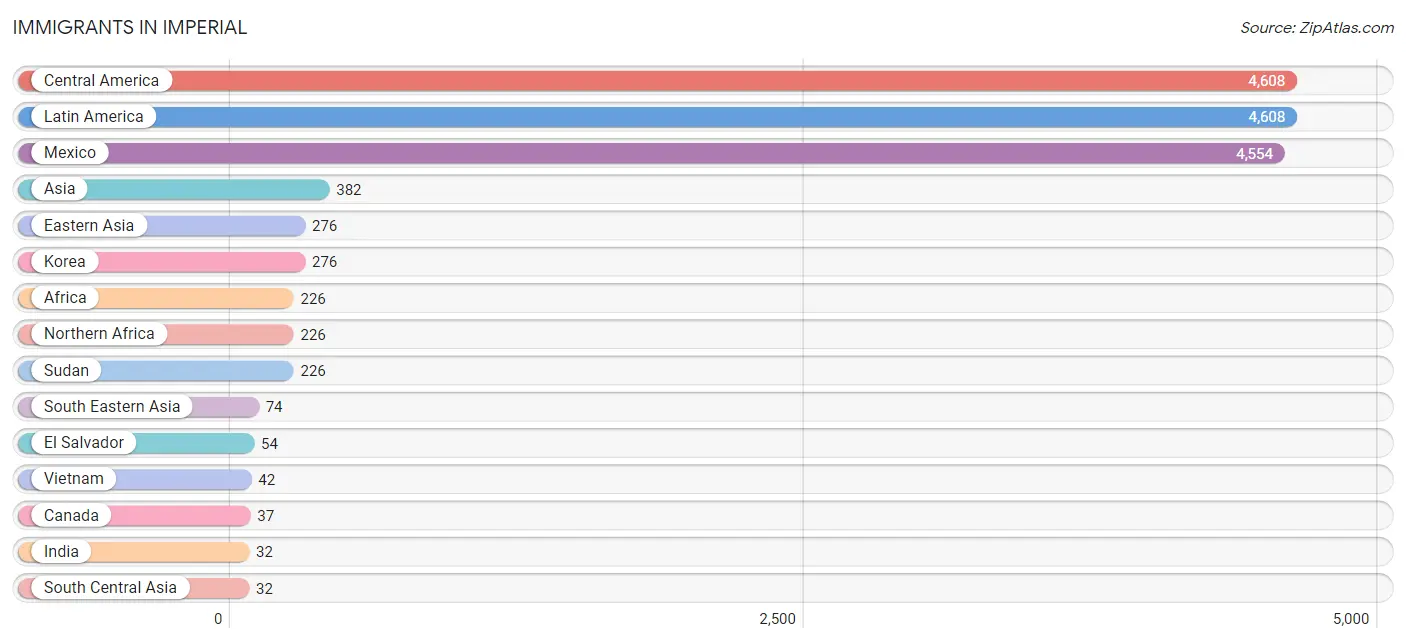
| Immigration Origin | # Population | % Population |
| Africa | 226 | 1.1% |
| Asia | 382 | 1.9% |
| Canada | 37 | 0.2% |
| Central America | 4,608 | 22.6% |
| Eastern Asia | 276 | 1.3% |
| El Salvador | 54 | 0.3% |
| India | 32 | 0.2% |
| Korea | 276 | 1.3% |
| Latin America | 4,608 | 22.6% |
| Malaysia | 14 | 0.1% |
| Mexico | 4,554 | 22.3% |
| Northern Africa | 226 | 1.1% |
| Philippines | 18 | 0.1% |
| South Central Asia | 32 | 0.2% |
| South Eastern Asia | 74 | 0.4% |
| Sudan | 226 | 1.1% |
| Vietnam | 42 | 0.2% | View All 17 Rows |
Sex and Age in Imperial
Sex and Age in Imperial
The most populous age groups in Imperial are 10 to 14 Years (1,216 | 12.3%) for men and 15 to 19 Years (1,285 | 12.2%) for women.
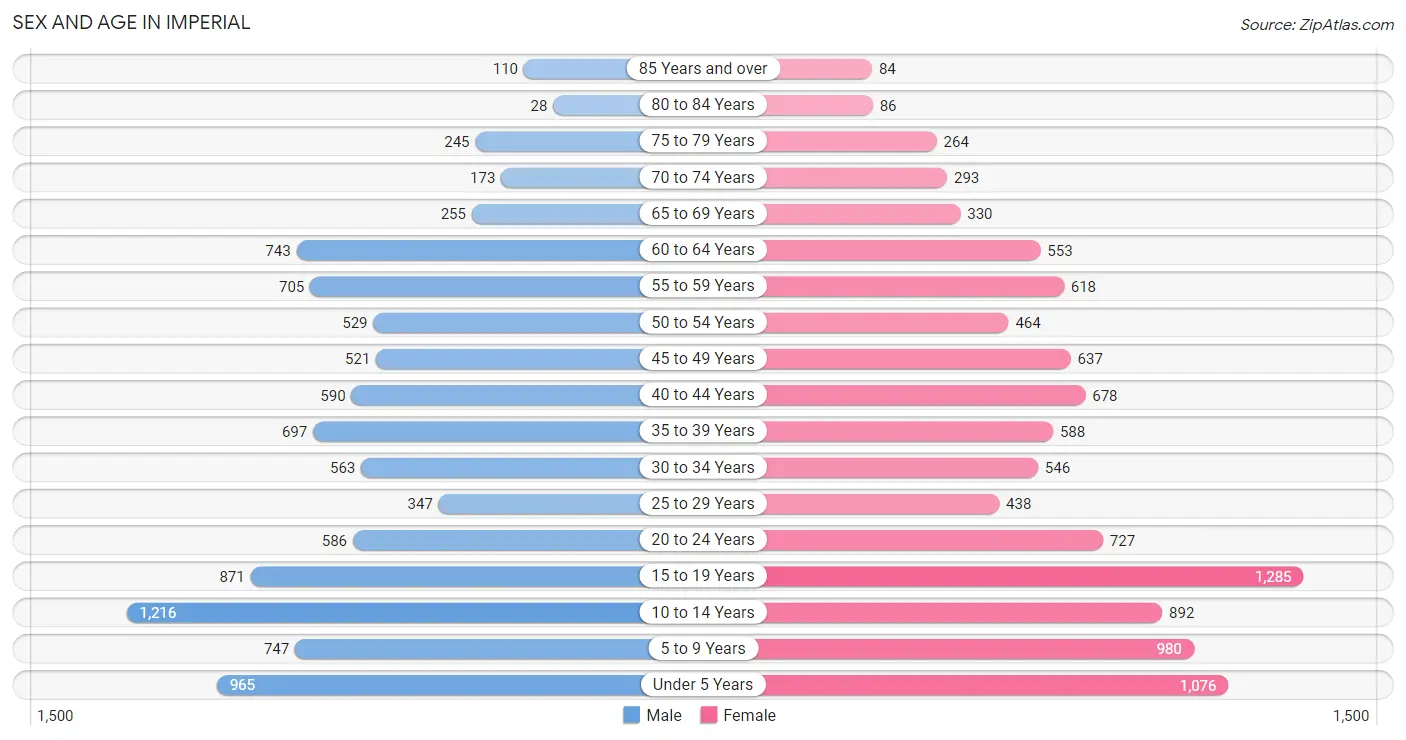
| Age Bracket | Male | Female |
| Under 5 Years | 965 (9.8%) | 1,076 (10.2%) |
| 5 to 9 Years | 747 (7.5%) | 980 (9.3%) |
| 10 to 14 Years | 1,216 (12.3%) | 892 (8.5%) |
| 15 to 19 Years | 871 (8.8%) | 1,285 (12.2%) |
| 20 to 24 Years | 586 (5.9%) | 727 (6.9%) |
| 25 to 29 Years | 347 (3.5%) | 438 (4.2%) |
| 30 to 34 Years | 563 (5.7%) | 546 (5.2%) |
| 35 to 39 Years | 697 (7.0%) | 588 (5.6%) |
| 40 to 44 Years | 590 (6.0%) | 678 (6.4%) |
| 45 to 49 Years | 521 (5.3%) | 637 (6.0%) |
| 50 to 54 Years | 529 (5.3%) | 464 (4.4%) |
| 55 to 59 Years | 705 (7.1%) | 618 (5.9%) |
| 60 to 64 Years | 743 (7.5%) | 553 (5.2%) |
| 65 to 69 Years | 255 (2.6%) | 330 (3.1%) |
| 70 to 74 Years | 173 (1.8%) | 293 (2.8%) |
| 75 to 79 Years | 245 (2.5%) | 264 (2.5%) |
| 80 to 84 Years | 28 (0.3%) | 86 (0.8%) |
| 85 Years and over | 110 (1.1%) | 84 (0.8%) |
| Total | 9,891 (100.0%) | 10,539 (100.0%) |
Families and Households in Imperial
Median Family Size in Imperial
The median family size in Imperial is 4.66 persons per family, with single female/mother families (999 | 25.1%) accounting for the largest median family size of 6.03 persons per family. On the other hand, single male/father families (357 | 9.0%) represent the smallest median family size with 3.53 persons per family.
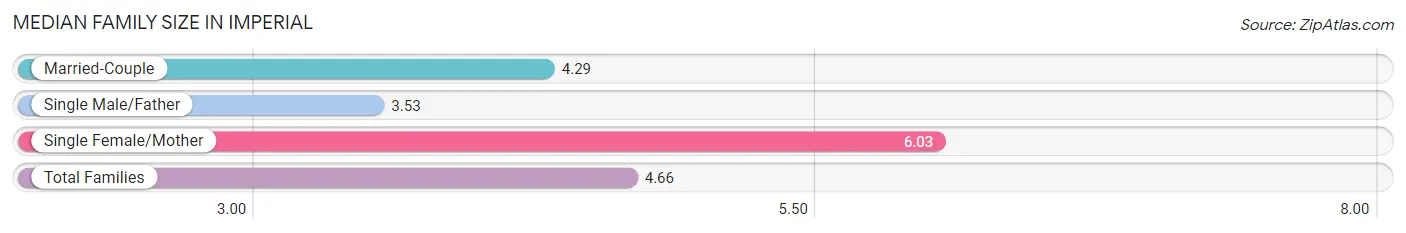
| Family Type | # Families | Family Size |
| Married-Couple | 2,623 (65.9%) | 4.29 |
| Single Male/Father | 357 (9.0%) | 3.53 |
| Single Female/Mother | 999 (25.1%) | 6.03 |
| Total Families | 3,979 (100.0%) | 4.66 |
Median Household Size in Imperial
The median household size in Imperial is 3.96 persons per household, with single female/mother households (999 | 19.4%) accounting for the largest median household size of 6.2 persons per household. non-family households (1,167 | 22.7%) represent the smallest median household size with 1.26 persons per household.
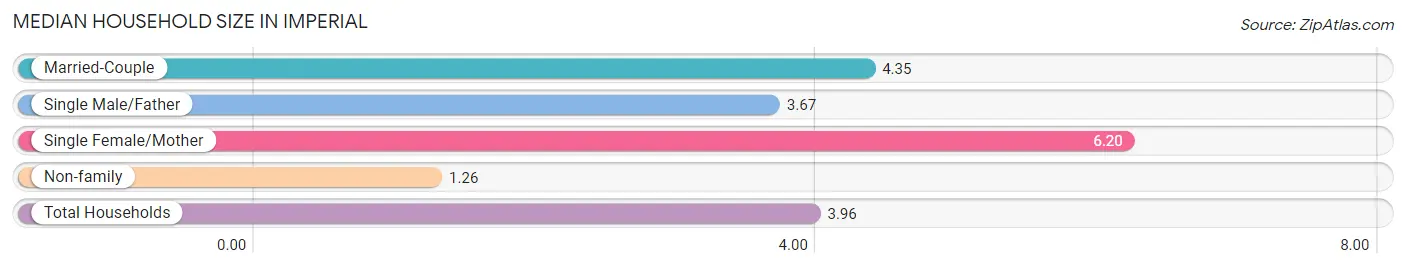
| Household Type | # Households | Household Size |
| Married-Couple | 2,623 (51.0%) | 4.35 |
| Single Male/Father | 357 (6.9%) | 3.67 |
| Single Female/Mother | 999 (19.4%) | 6.20 |
| Non-family | 1,167 (22.7%) | 1.26 |
| Total Households | 5,146 (100.0%) | 3.96 |
Household Size by Marriage Status in Imperial
Out of a total of 5,146 households in Imperial, 3,979 (77.3%) are family households, while 1,167 (22.7%) are nonfamily households. The most numerous type of family households are 3-person households, comprising 992, and the most common type of nonfamily households are 1-person households, comprising 967.
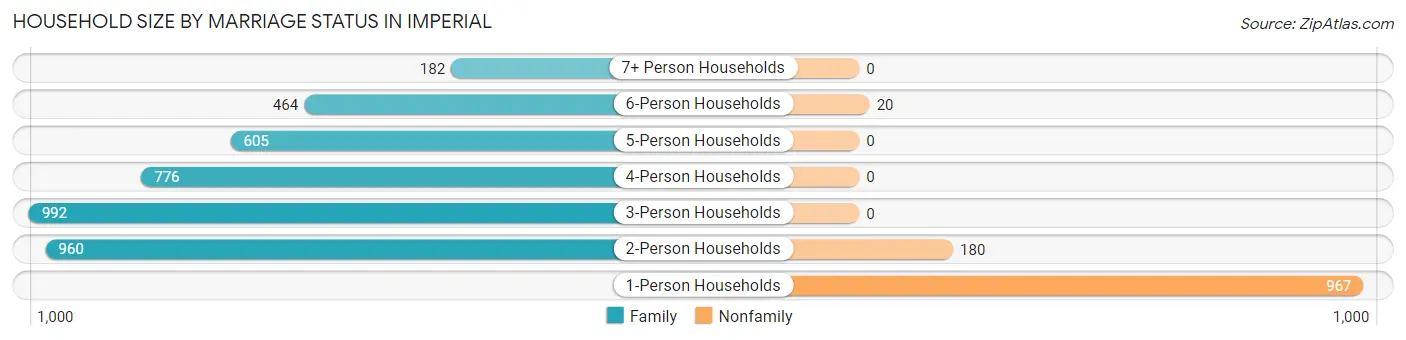
| Household Size | Family Households | Nonfamily Households |
| 1-Person Households | - | 967 (18.8%) |
| 2-Person Households | 960 (18.7%) | 180 (3.5%) |
| 3-Person Households | 992 (19.3%) | 0 (0.0%) |
| 4-Person Households | 776 (15.1%) | 0 (0.0%) |
| 5-Person Households | 605 (11.8%) | 0 (0.0%) |
| 6-Person Households | 464 (9.0%) | 20 (0.4%) |
| 7+ Person Households | 182 (3.5%) | 0 (0.0%) |
| Total | 3,979 (77.3%) | 1,167 (22.7%) |
Female Fertility in Imperial
Fertility by Age in Imperial
Average fertility rate in Imperial is 94.0 births per 1,000 women. Women in the age bracket of 20 to 34 years have the highest fertility rate with 158.0 births per 1,000 women. Women in the age bracket of 20 to 34 years acount for 56.2% of all women with births.
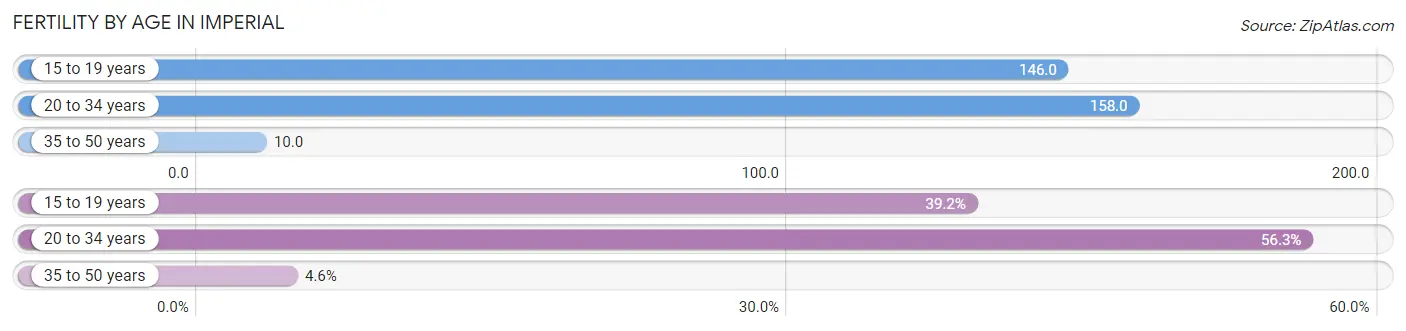
| Age Bracket | Women with Births | Births / 1,000 Women |
| 15 to 19 years | 188 (39.2%) | 146.0 |
| 20 to 34 years | 270 (56.2%) | 158.0 |
| 35 to 50 years | 22 (4.6%) | 10.0 |
| Total | 480 (100.0%) | 94.0 |
Fertility by Age by Marriage Status in Imperial
12.1% of women with births (480) in Imperial are married. The highest percentage of unmarried women with births falls into 15 to 19 years age bracket with 100.0% of them unmarried at the time of birth, while the lowest percentage of unmarried women with births belong to 35 to 50 years age bracket with 0.0% of them unmarried.
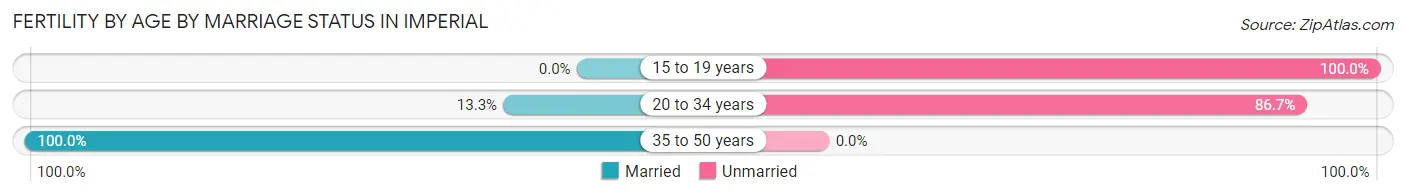
| Age Bracket | Married | Unmarried |
| 15 to 19 years | 0 (0.0%) | 188 (100.0%) |
| 20 to 34 years | 36 (13.3%) | 234 (86.7%) |
| 35 to 50 years | 22 (100.0%) | 0 (0.0%) |
| Total | 58 (12.1%) | 422 (87.9%) |
Fertility by Education in Imperial
Average fertility rate in Imperial is 94.0 births per 1,000 women. Women with the education attainment of less than high school have the highest fertility rate of 262.0 births per 1,000 women, while women with the education attainment of college or associate's degree have the lowest fertility at 9.0 births per 1,000 women. Women with the education attainment of less than high school represent 63.5% of all women with births.
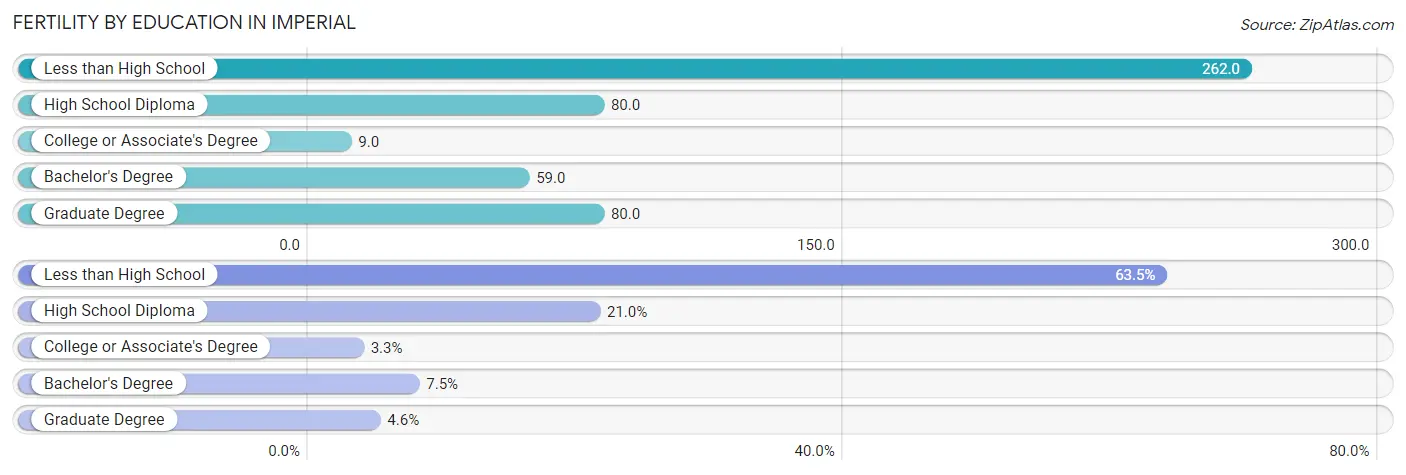
| Educational Attainment | Women with Births | Births / 1,000 Women |
| Less than High School | 305 (63.5%) | 262.0 |
| High School Diploma | 101 (21.0%) | 80.0 |
| College or Associate's Degree | 16 (3.3%) | 9.0 |
| Bachelor's Degree | 36 (7.5%) | 59.0 |
| Graduate Degree | 22 (4.6%) | 80.0 |
| Total | 480 (100.0%) | 94.0 |
Fertility by Education by Marriage Status in Imperial
87.9% of women with births in Imperial are unmarried. Women with the educational attainment of bachelor's degree are most likely to be married with 100.0% of them married at childbirth, while women with the educational attainment of less than high school are least likely to be married with 100.0% of them unmarried at childbirth.
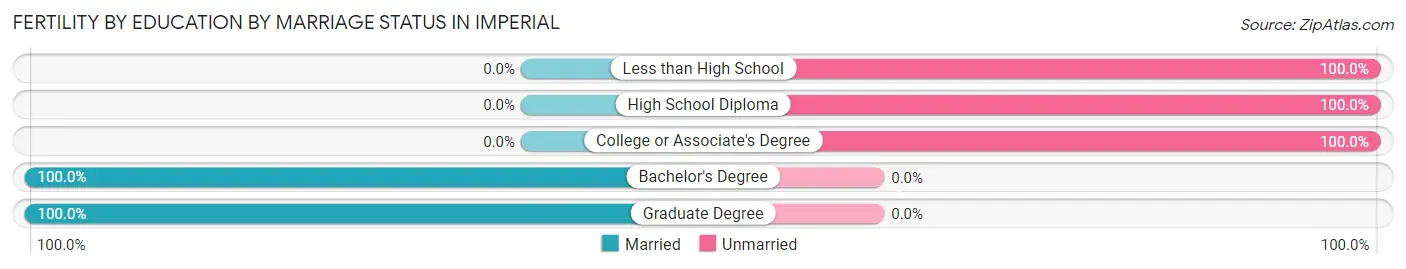
| Educational Attainment | Married | Unmarried |
| Less than High School | 0 (0.0%) | 305 (100.0%) |
| High School Diploma | 0 (0.0%) | 101 (100.0%) |
| College or Associate's Degree | 0 (0.0%) | 16 (100.0%) |
| Bachelor's Degree | 36 (100.0%) | 0 (0.0%) |
| Graduate Degree | 22 (100.0%) | 0 (0.0%) |
| Total | 58 (12.1%) | 422 (87.9%) |
Employment Characteristics in Imperial
Employment by Class of Employer in Imperial
Among the 7,284 employed individuals in Imperial, private company employees (4,349 | 59.7%), local government employees (961 | 13.2%), and state government employees (776 | 10.6%) make up the most common classes of employment.
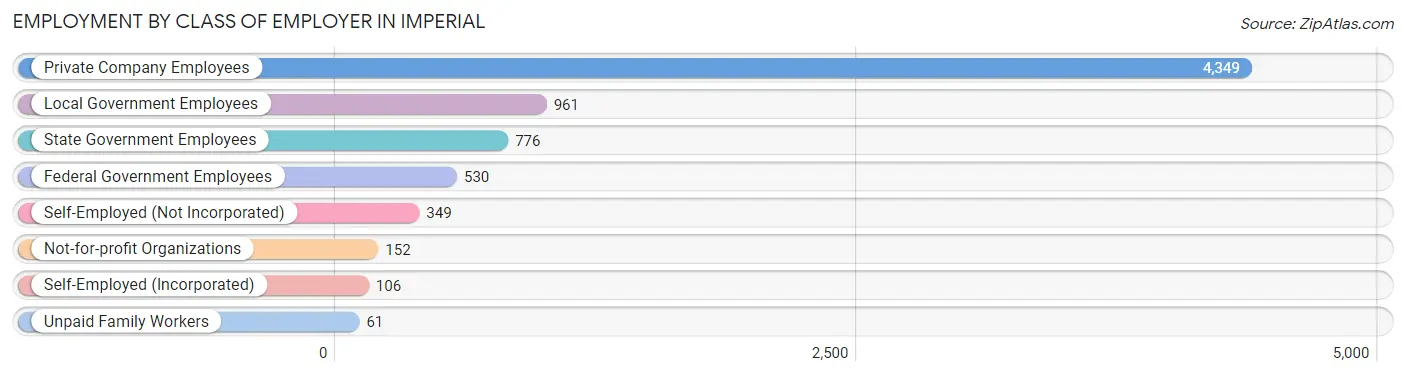
| Employer Class | # Employees | % Employees |
| Private Company Employees | 4,349 | 59.7% |
| Self-Employed (Incorporated) | 106 | 1.5% |
| Self-Employed (Not Incorporated) | 349 | 4.8% |
| Not-for-profit Organizations | 152 | 2.1% |
| Local Government Employees | 961 | 13.2% |
| State Government Employees | 776 | 10.6% |
| Federal Government Employees | 530 | 7.3% |
| Unpaid Family Workers | 61 | 0.8% |
| Total | 7,284 | 100.0% |
Employment Status by Age in Imperial
According to the labor force statistics for Imperial, out of the total population over 16 years of age (14,124), 58.5% or 8,263 individuals are in the labor force, with 10.7% or 884 of them unemployed. The age group with the highest labor force participation rate is 35 to 44 years, with 91.6% or 2,339 individuals in the labor force. Within the labor force, the 65 to 74 years age range has the highest percentage of unemployed individuals, with 43.5% or 54 of them being unemployed.
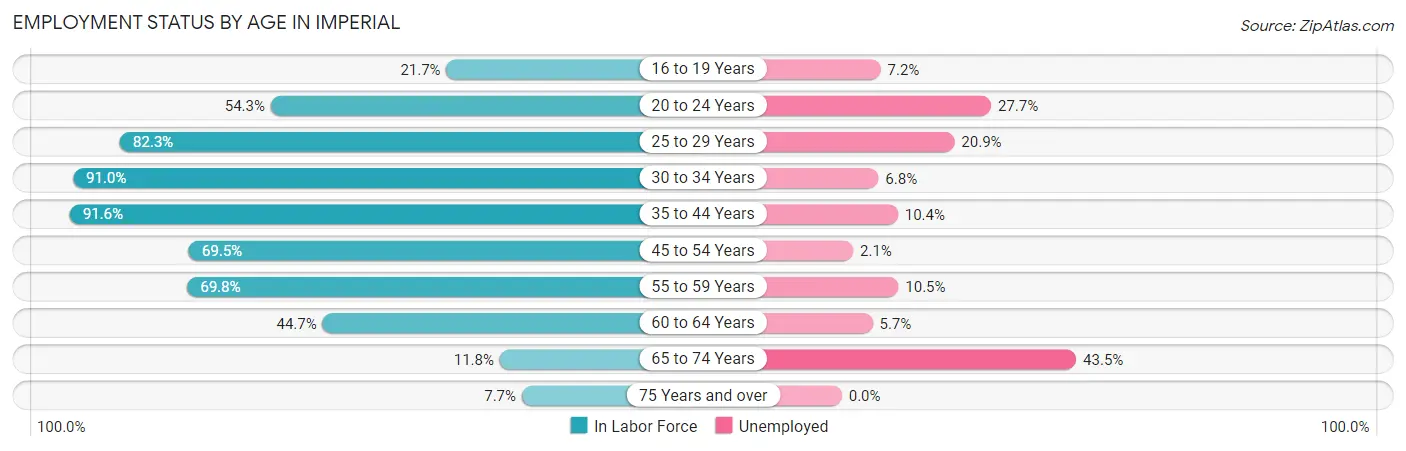
| Age Bracket | In Labor Force | Unemployed |
| 16 to 19 Years | 375 (21.7%) | 27 (7.2%) |
| 20 to 24 Years | 713 (54.3%) | 198 (27.7%) |
| 25 to 29 Years | 646 (82.3%) | 135 (20.9%) |
| 30 to 34 Years | 1,009 (91.0%) | 69 (6.8%) |
| 35 to 44 Years | 2,339 (91.6%) | 243 (10.4%) |
| 45 to 54 Years | 1,495 (69.5%) | 31 (2.1%) |
| 55 to 59 Years | 923 (69.8%) | 97 (10.5%) |
| 60 to 64 Years | 579 (44.7%) | 33 (5.7%) |
| 65 to 74 Years | 124 (11.8%) | 54 (43.5%) |
| 75 Years and over | 63 (7.7%) | 0 (0.0%) |
| Total | 8,263 (58.5%) | 884 (10.7%) |
Employment Status by Educational Attainment in Imperial
According to labor force statistics for Imperial, 75.8% of individuals (6,986) out of the total population between 25 and 64 years of age (9,217) are in the labor force, with 8.7% or 608 of them being unemployed. The group with the highest labor force participation rate are those with the educational attainment of bachelor's degree or higher, with 96.1% or 2,049 individuals in the labor force. Within the labor force, individuals with less than high school education have the highest percentage of unemployment, with 11.5% or 52 of them being unemployed.
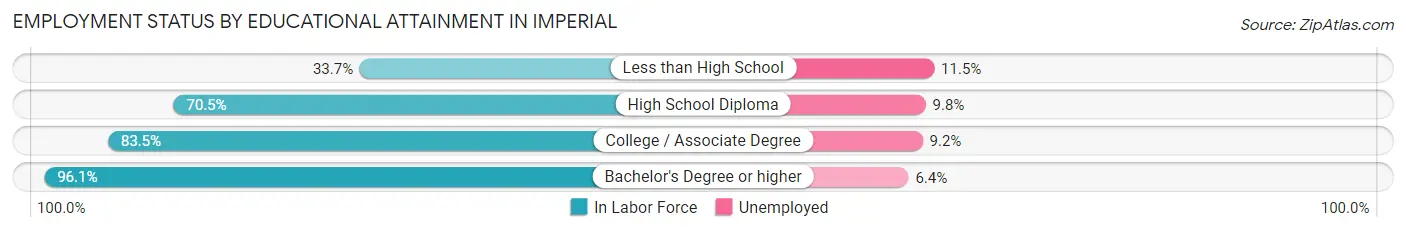
| Educational Attainment | In Labor Force | Unemployed |
| Less than High School | 451 (33.7%) | 154 (11.5%) |
| High School Diploma | 1,657 (70.5%) | 230 (9.8%) |
| College / Associate Degree | 2,836 (83.5%) | 312 (9.2%) |
| Bachelor's Degree or higher | 2,049 (96.1%) | 136 (6.4%) |
| Total | 6,986 (75.8%) | 802 (8.7%) |
Employment Occupations by Sex in Imperial
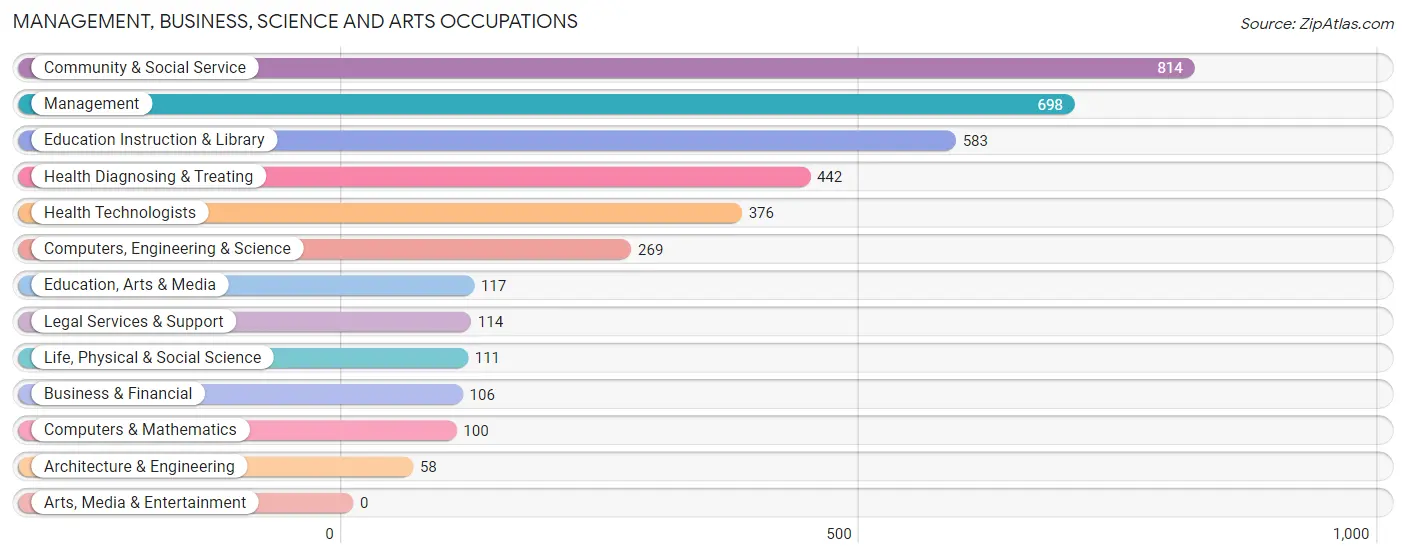
Management, Business, Science and Arts Occupations
The most common Management, Business, Science and Arts occupations in Imperial are Community & Social Service (814 | 11.1%), Management (698 | 9.5%), Education Instruction & Library (583 | 7.9%), Health Diagnosing & Treating (442 | 6.0%), and Health Technologists (376 | 5.1%).
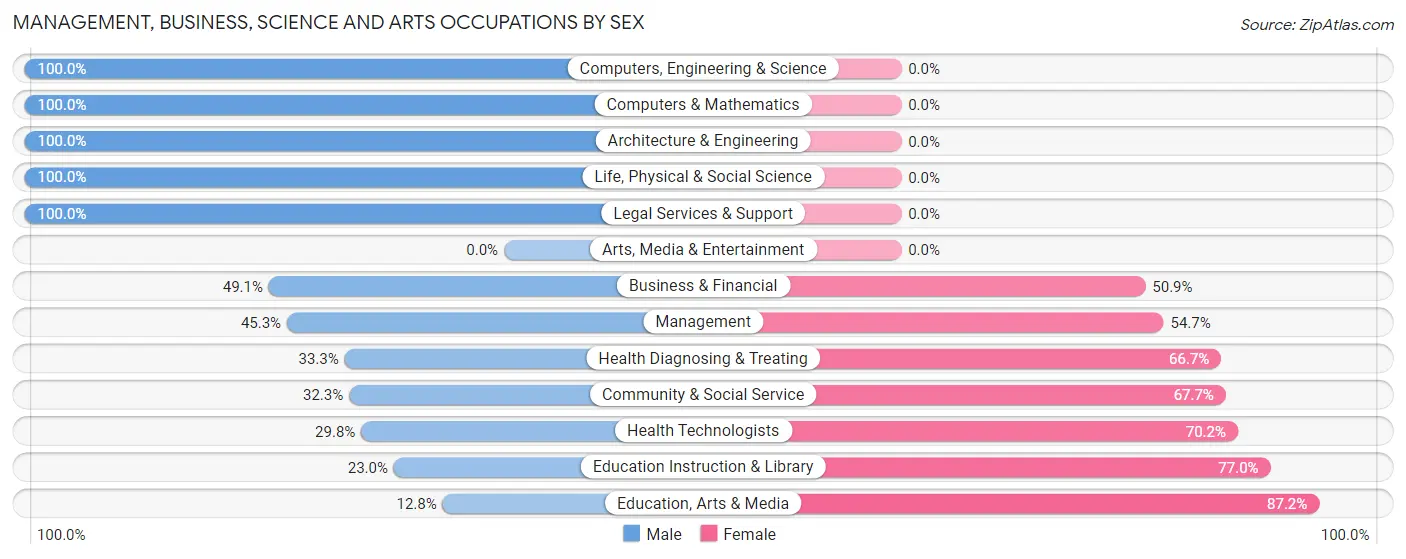
Management, Business, Science and Arts Occupations by Sex
Within the Management, Business, Science and Arts occupations in Imperial, the most male-oriented occupations are Computers, Engineering & Science (100.0%), Computers & Mathematics (100.0%), and Architecture & Engineering (100.0%), while the most female-oriented occupations are Education, Arts & Media (87.2%), Education Instruction & Library (77.0%), and Health Technologists (70.2%).
| Occupation | Male | Female |
| Management | 316 (45.3%) | 382 (54.7%) |
| Business & Financial | 52 (49.1%) | 54 (50.9%) |
| Computers, Engineering & Science | 269 (100.0%) | 0 (0.0%) |
| Computers & Mathematics | 100 (100.0%) | 0 (0.0%) |
| Architecture & Engineering | 58 (100.0%) | 0 (0.0%) |
| Life, Physical & Social Science | 111 (100.0%) | 0 (0.0%) |
| Community & Social Service | 263 (32.3%) | 551 (67.7%) |
| Education, Arts & Media | 15 (12.8%) | 102 (87.2%) |
| Legal Services & Support | 114 (100.0%) | 0 (0.0%) |
| Education Instruction & Library | 134 (23.0%) | 449 (77.0%) |
| Arts, Media & Entertainment | 0 (0.0%) | 0 (0.0%) |
| Health Diagnosing & Treating | 147 (33.3%) | 295 (66.7%) |
| Health Technologists | 112 (29.8%) | 264 (70.2%) |
| Total (Category) | 1,047 (45.0%) | 1,282 (55.0%) |
| Total (Overall) | 3,848 (52.2%) | 3,516 (47.7%) |
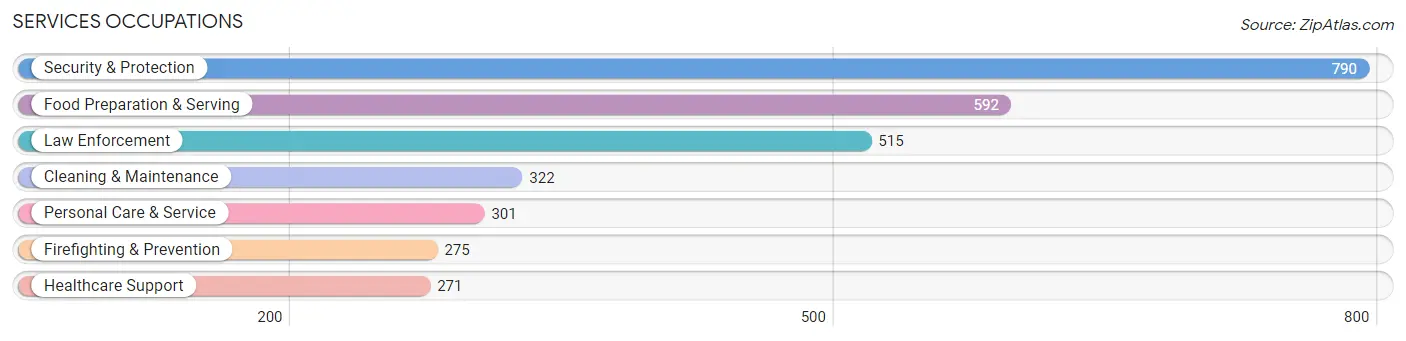
Services Occupations
The most common Services occupations in Imperial are Security & Protection (790 | 10.7%), Food Preparation & Serving (592 | 8.0%), Law Enforcement (515 | 7.0%), Cleaning & Maintenance (322 | 4.4%), and Personal Care & Service (301 | 4.1%).
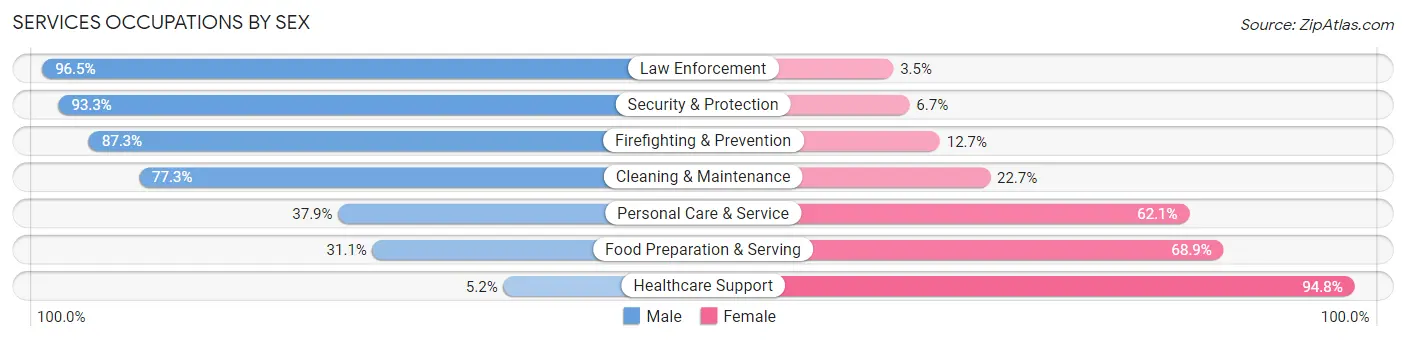
Services Occupations by Sex
Within the Services occupations in Imperial, the most male-oriented occupations are Law Enforcement (96.5%), Security & Protection (93.3%), and Firefighting & Prevention (87.3%), while the most female-oriented occupations are Healthcare Support (94.8%), Food Preparation & Serving (68.9%), and Personal Care & Service (62.1%).
| Occupation | Male | Female |
| Healthcare Support | 14 (5.2%) | 257 (94.8%) |
| Security & Protection | 737 (93.3%) | 53 (6.7%) |
| Firefighting & Prevention | 240 (87.3%) | 35 (12.7%) |
| Law Enforcement | 497 (96.5%) | 18 (3.5%) |
| Food Preparation & Serving | 184 (31.1%) | 408 (68.9%) |
| Cleaning & Maintenance | 249 (77.3%) | 73 (22.7%) |
| Personal Care & Service | 114 (37.9%) | 187 (62.1%) |
| Total (Category) | 1,298 (57.0%) | 978 (43.0%) |
| Total (Overall) | 3,848 (52.2%) | 3,516 (47.7%) |
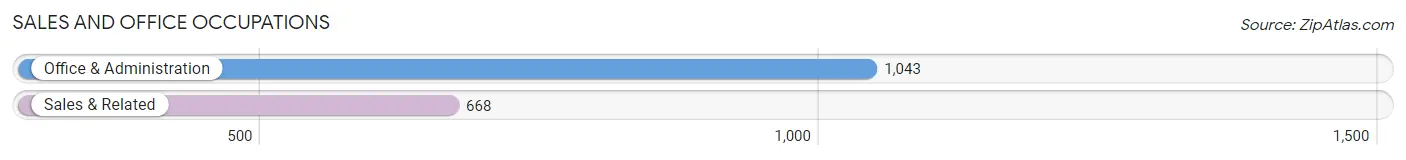
Sales and Office Occupations
The most common Sales and Office occupations in Imperial are Office & Administration (1,043 | 14.2%), and Sales & Related (668 | 9.1%).
Sales and Office Occupations by Sex
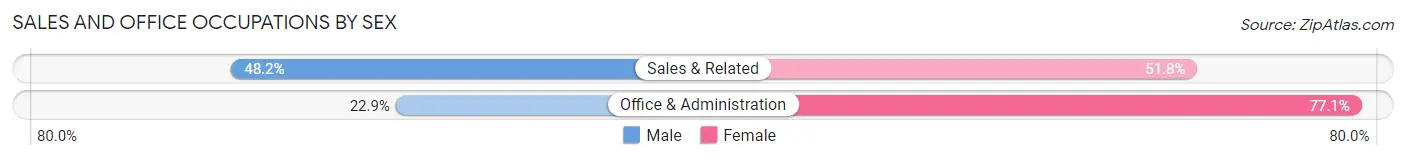
| Occupation | Male | Female |
| Sales & Related | 322 (48.2%) | 346 (51.8%) |
| Office & Administration | 239 (22.9%) | 804 (77.1%) |
| Total (Category) | 561 (32.8%) | 1,150 (67.2%) |
| Total (Overall) | 3,848 (52.2%) | 3,516 (47.7%) |
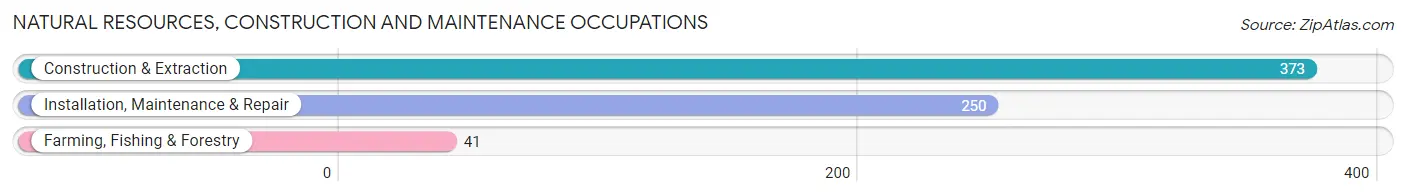
Natural Resources, Construction and Maintenance Occupations
The most common Natural Resources, Construction and Maintenance occupations in Imperial are Construction & Extraction (373 | 5.1%), Installation, Maintenance & Repair (250 | 3.4%), and Farming, Fishing & Forestry (41 | 0.6%).
Natural Resources, Construction and Maintenance Occupations by Sex
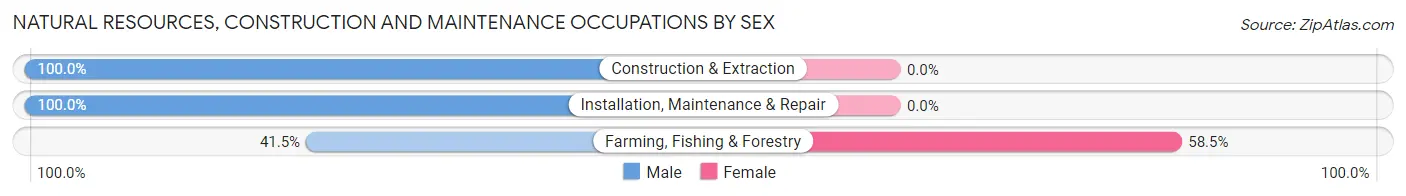
| Occupation | Male | Female |
| Farming, Fishing & Forestry | 17 (41.5%) | 24 (58.5%) |
| Construction & Extraction | 373 (100.0%) | 0 (0.0%) |
| Installation, Maintenance & Repair | 250 (100.0%) | 0 (0.0%) |
| Total (Category) | 640 (96.4%) | 24 (3.6%) |
| Total (Overall) | 3,848 (52.2%) | 3,516 (47.7%) |
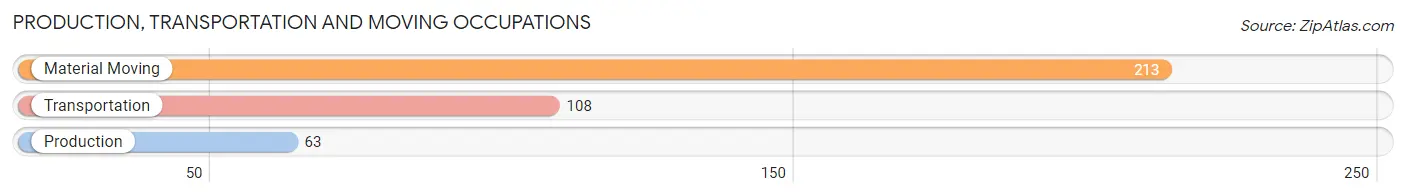
Production, Transportation and Moving Occupations
The most common Production, Transportation and Moving occupations in Imperial are Material Moving (213 | 2.9%), Transportation (108 | 1.5%), and Production (63 | 0.9%).
Production, Transportation and Moving Occupations by Sex
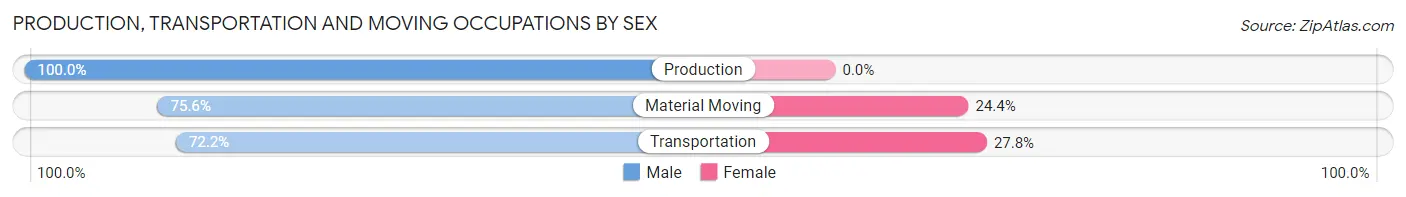
| Occupation | Male | Female |
| Production | 63 (100.0%) | 0 (0.0%) |
| Transportation | 78 (72.2%) | 30 (27.8%) |
| Material Moving | 161 (75.6%) | 52 (24.4%) |
| Total (Category) | 302 (78.6%) | 82 (21.3%) |
| Total (Overall) | 3,848 (52.2%) | 3,516 (47.7%) |
Employment Industries by Sex in Imperial
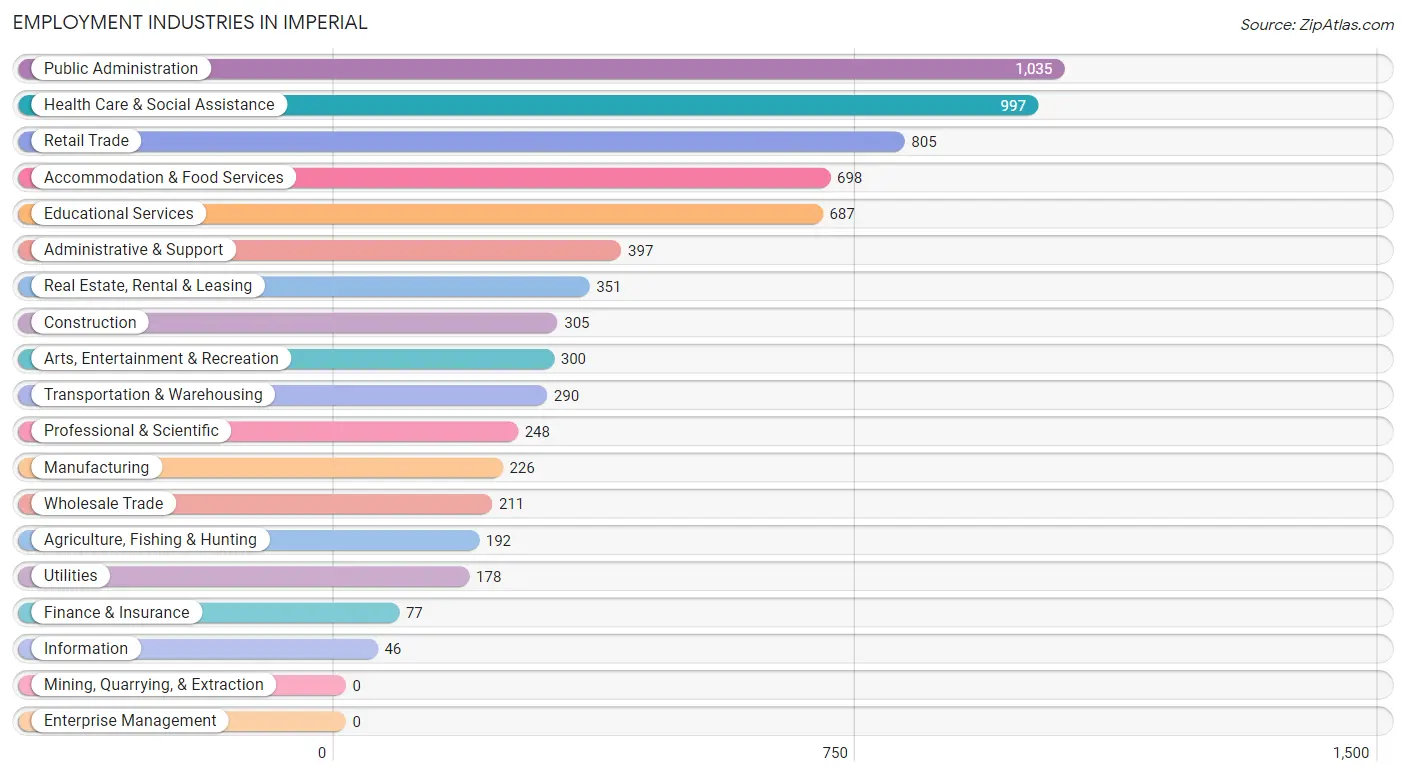
Employment Industries in Imperial
The major employment industries in Imperial include Public Administration (1,035 | 14.1%), Health Care & Social Assistance (997 | 13.5%), Retail Trade (805 | 10.9%), Accommodation & Food Services (698 | 9.5%), and Educational Services (687 | 9.3%).
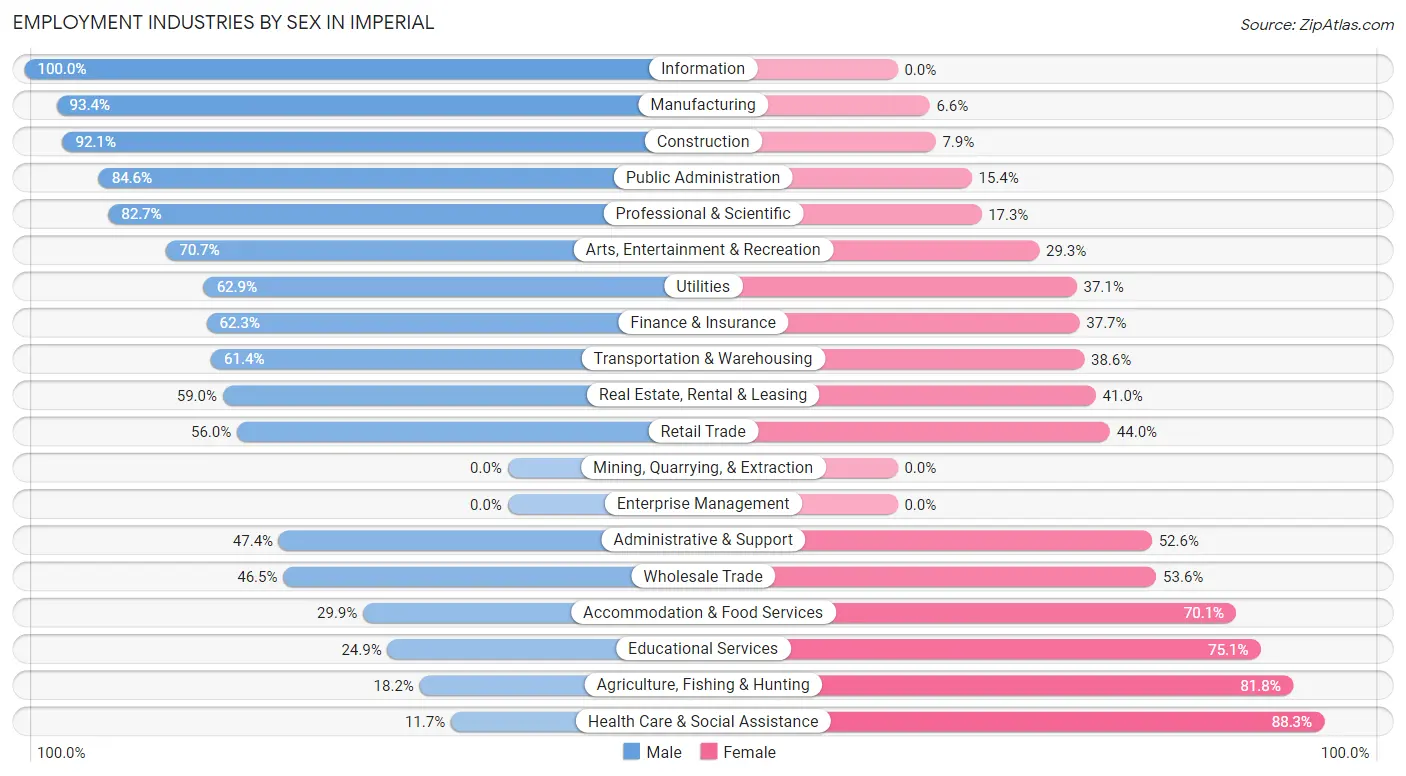
Employment Industries by Sex in Imperial
The Imperial industries that see more men than women are Information (100.0%), Manufacturing (93.4%), and Construction (92.1%), whereas the industries that tend to have a higher number of women are Health Care & Social Assistance (88.3%), Agriculture, Fishing & Hunting (81.8%), and Educational Services (75.1%).
| Industry | Male | Female |
| Agriculture, Fishing & Hunting | 35 (18.2%) | 157 (81.8%) |
| Mining, Quarrying, & Extraction | 0 (0.0%) | 0 (0.0%) |
| Construction | 281 (92.1%) | 24 (7.9%) |
| Manufacturing | 211 (93.4%) | 15 (6.6%) |
| Wholesale Trade | 98 (46.5%) | 113 (53.5%) |
| Retail Trade | 451 (56.0%) | 354 (44.0%) |
| Transportation & Warehousing | 178 (61.4%) | 112 (38.6%) |
| Utilities | 112 (62.9%) | 66 (37.1%) |
| Information | 46 (100.0%) | 0 (0.0%) |
| Finance & Insurance | 48 (62.3%) | 29 (37.7%) |
| Real Estate, Rental & Leasing | 207 (59.0%) | 144 (41.0%) |
| Professional & Scientific | 205 (82.7%) | 43 (17.3%) |
| Enterprise Management | 0 (0.0%) | 0 (0.0%) |
| Administrative & Support | 188 (47.4%) | 209 (52.6%) |
| Educational Services | 171 (24.9%) | 516 (75.1%) |
| Health Care & Social Assistance | 117 (11.7%) | 880 (88.3%) |
| Arts, Entertainment & Recreation | 212 (70.7%) | 88 (29.3%) |
| Accommodation & Food Services | 209 (29.9%) | 489 (70.1%) |
| Public Administration | 876 (84.6%) | 159 (15.4%) |
| Total | 3,848 (52.2%) | 3,516 (47.7%) |
Education in Imperial
School Enrollment in Imperial
The most common levels of schooling among the 6,928 students in Imperial are high school (1,683 | 24.3%), middle school (1,524 | 22.0%), and elementary school (1,516 | 21.9%).
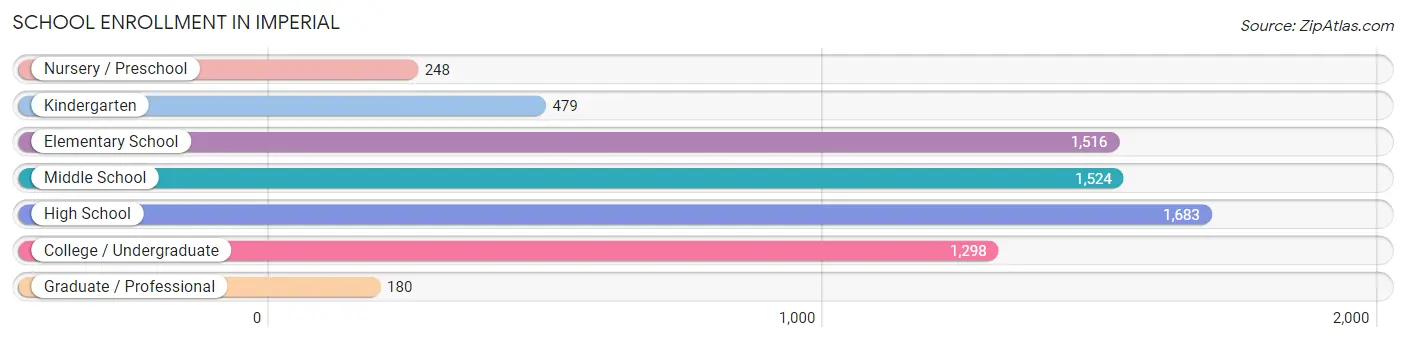
| School Level | # Students | % Students |
| Nursery / Preschool | 248 | 3.6% |
| Kindergarten | 479 | 6.9% |
| Elementary School | 1,516 | 21.9% |
| Middle School | 1,524 | 22.0% |
| High School | 1,683 | 24.3% |
| College / Undergraduate | 1,298 | 18.7% |
| Graduate / Professional | 180 | 2.6% |
| Total | 6,928 | 100.0% |
School Enrollment by Age by Funding Source in Imperial
Out of a total of 6,928 students who are enrolled in schools in Imperial, 298 (4.3%) attend a private institution, while the remaining 6,630 (95.7%) are enrolled in public schools. The age group of 3 to 4 year olds has the highest likelihood of being enrolled in private schools, with 96 (43.0% in the age bracket) enrolled. Conversely, the age group of 15 to 17 year olds has the lowest likelihood of being enrolled in a private school, with 1,282 (100.0% in the age bracket) attending a public institution.
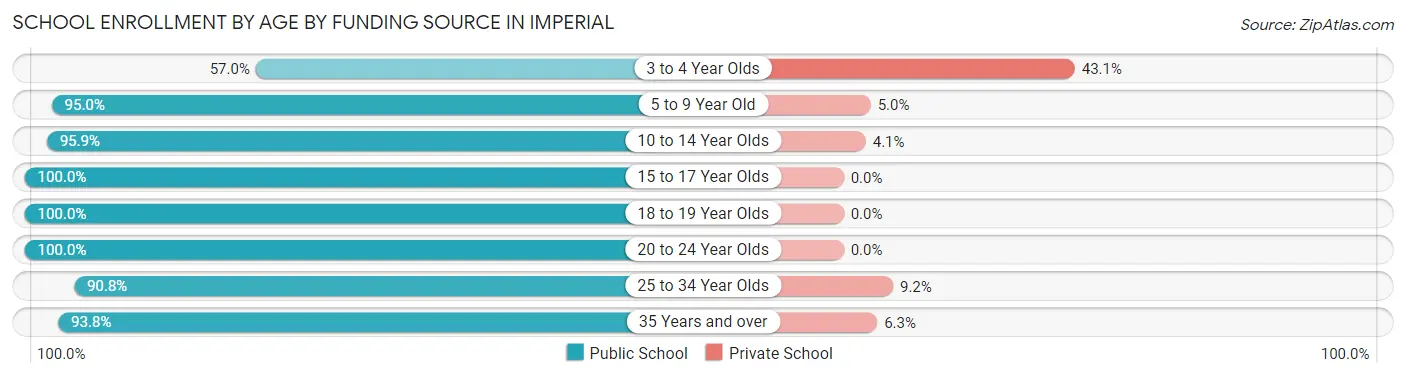
| Age Bracket | Public School | Private School |
| 3 to 4 Year Olds | 127 (57.0%) | 96 (43.0%) |
| 5 to 9 Year Old | 1,451 (95.0%) | 77 (5.0%) |
| 10 to 14 Year Olds | 2,002 (95.9%) | 86 (4.1%) |
| 15 to 17 Year Olds | 1,282 (100.0%) | 0 (0.0%) |
| 18 to 19 Year Olds | 706 (100.0%) | 0 (0.0%) |
| 20 to 24 Year Olds | 552 (100.0%) | 0 (0.0%) |
| 25 to 34 Year Olds | 237 (90.8%) | 24 (9.2%) |
| 35 Years and over | 270 (93.8%) | 18 (6.2%) |
| Total | 6,630 (95.7%) | 298 (4.3%) |
Educational Attainment by Field of Study in Imperial
Arts & humanities (418 | 17.9%), business (404 | 17.3%), science & technology (292 | 12.5%), liberal arts & history (217 | 9.3%), and engineering (189 | 8.1%) are the most common fields of study among 2,329 individuals in Imperial who have obtained a bachelor's degree or higher.
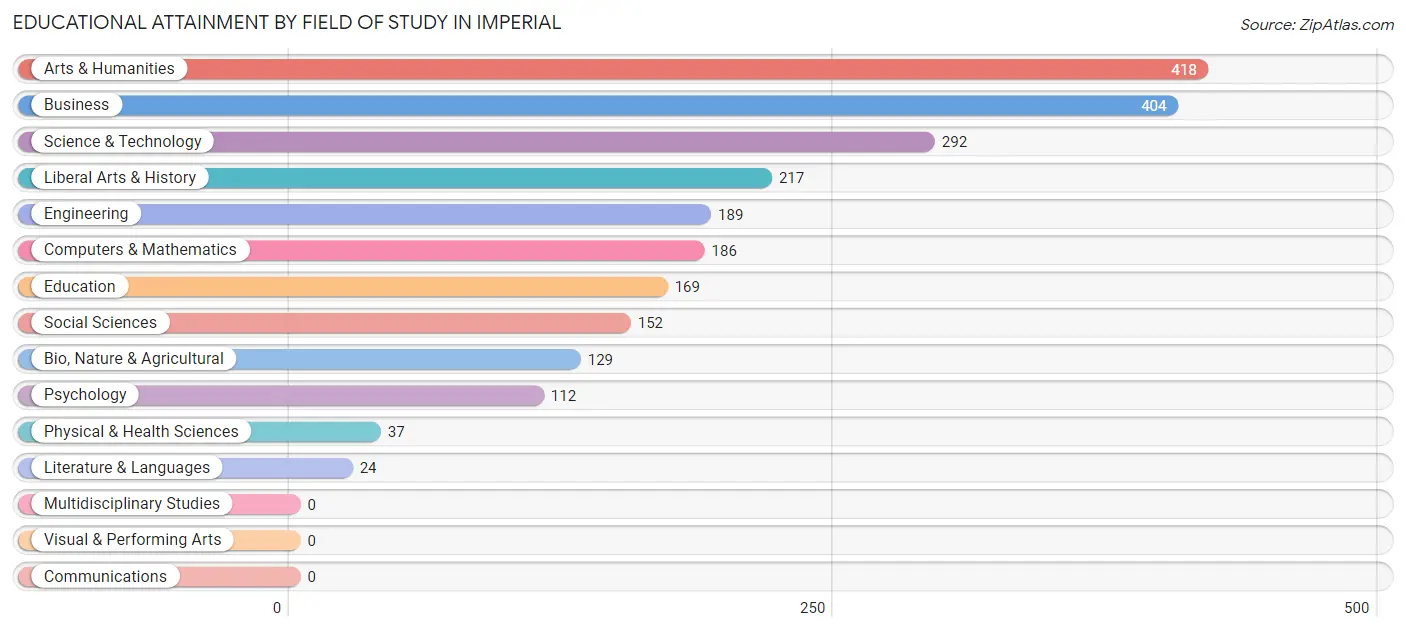
| Field of Study | # Graduates | % Graduates |
| Computers & Mathematics | 186 | 8.0% |
| Bio, Nature & Agricultural | 129 | 5.5% |
| Physical & Health Sciences | 37 | 1.6% |
| Psychology | 112 | 4.8% |
| Social Sciences | 152 | 6.5% |
| Engineering | 189 | 8.1% |
| Multidisciplinary Studies | 0 | 0.0% |
| Science & Technology | 292 | 12.5% |
| Business | 404 | 17.3% |
| Education | 169 | 7.3% |
| Literature & Languages | 24 | 1.0% |
| Liberal Arts & History | 217 | 9.3% |
| Visual & Performing Arts | 0 | 0.0% |
| Communications | 0 | 0.0% |
| Arts & Humanities | 418 | 17.9% |
| Total | 2,329 | 100.0% |
Transportation & Commute in Imperial
Vehicle Availability by Sex in Imperial
The most prevalent vehicle ownership categories in Imperial are males with 2 vehicles (1,841, accounting for 47.9%) and females with 2 vehicles (1,221, making up 53.5%).
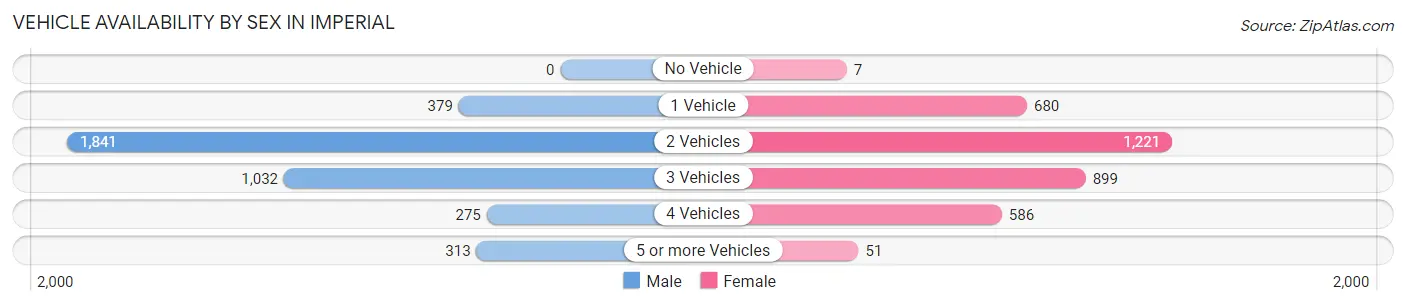
| Vehicles Available | Male | Female |
| No Vehicle | 0 (0.0%) | 7 (0.2%) |
| 1 Vehicle | 379 (9.9%) | 680 (19.7%) |
| 2 Vehicles | 1,841 (47.9%) | 1,221 (35.4%) |
| 3 Vehicles | 1,032 (26.9%) | 899 (26.1%) |
| 4 Vehicles | 275 (7.2%) | 586 (17.0%) |
| 5 or more Vehicles | 313 (8.2%) | 51 (1.5%) |
| Total | 3,840 (100.0%) | 3,444 (100.0%) |
Commute Time in Imperial
The most frequently occuring commute durations in Imperial are 10 to 14 minutes (1,636 commuters, 23.9%), 15 to 19 minutes (1,578 commuters, 23.1%), and 5 to 9 minutes (1,216 commuters, 17.8%).
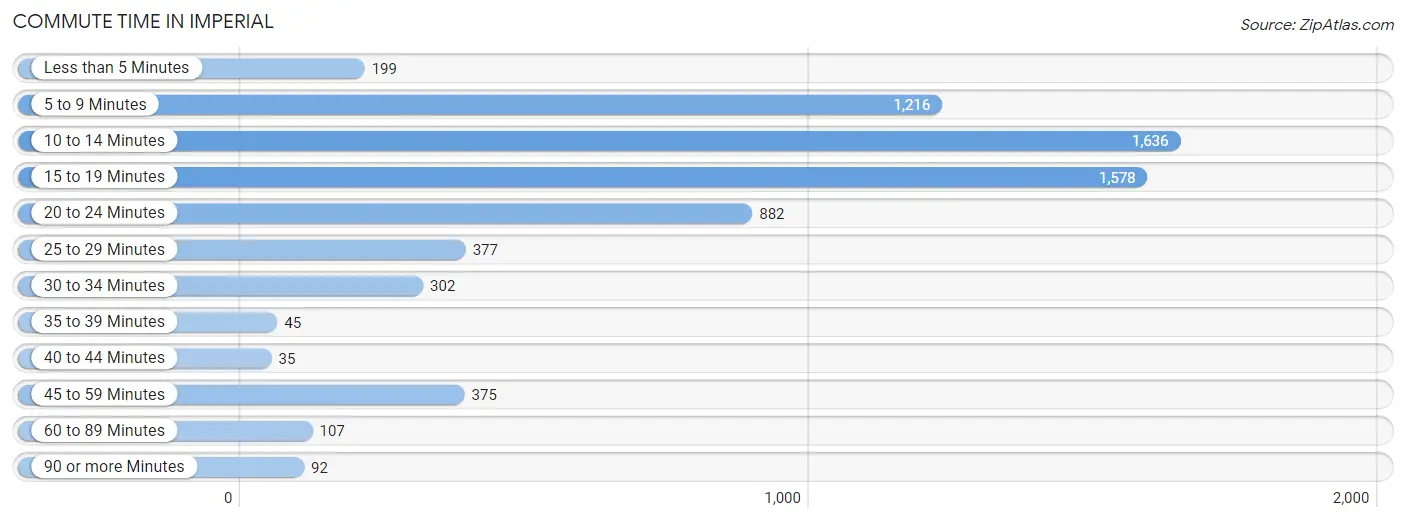
| Commute Time | # Commuters | % Commuters |
| Less than 5 Minutes | 199 | 2.9% |
| 5 to 9 Minutes | 1,216 | 17.8% |
| 10 to 14 Minutes | 1,636 | 23.9% |
| 15 to 19 Minutes | 1,578 | 23.1% |
| 20 to 24 Minutes | 882 | 12.9% |
| 25 to 29 Minutes | 377 | 5.5% |
| 30 to 34 Minutes | 302 | 4.4% |
| 35 to 39 Minutes | 45 | 0.7% |
| 40 to 44 Minutes | 35 | 0.5% |
| 45 to 59 Minutes | 375 | 5.5% |
| 60 to 89 Minutes | 107 | 1.6% |
| 90 or more Minutes | 92 | 1.3% |
Commute Time by Sex in Imperial
The most common commute times in Imperial are 15 to 19 minutes (799 commuters, 22.3%) for males and 10 to 14 minutes (975 commuters, 29.9%) for females.
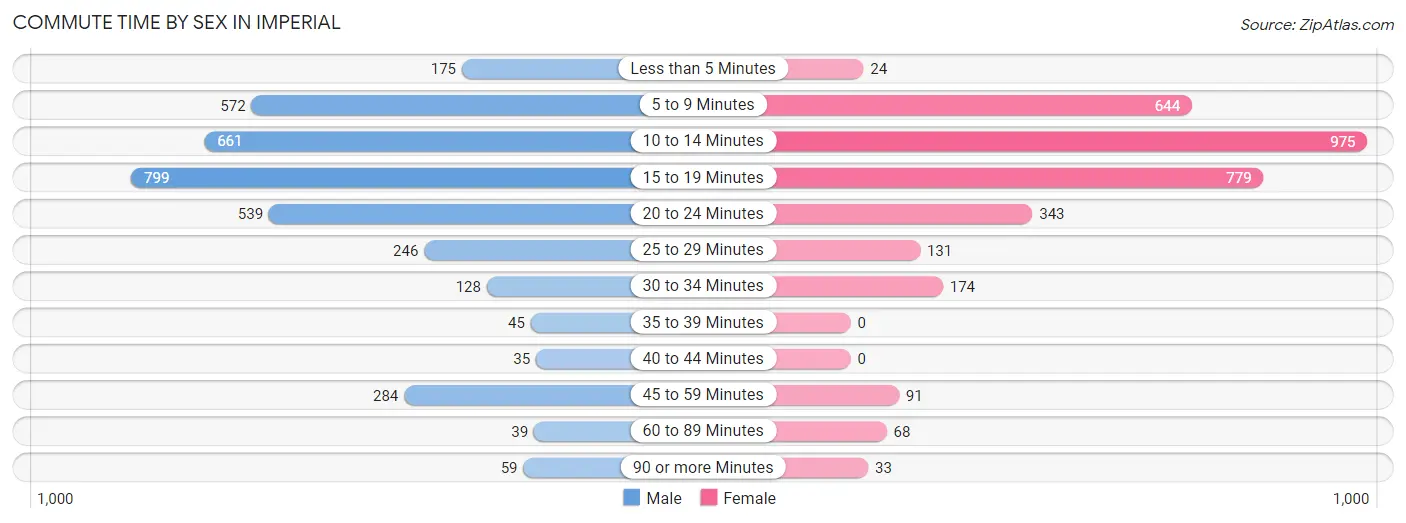
| Commute Time | Male | Female |
| Less than 5 Minutes | 175 (4.9%) | 24 (0.7%) |
| 5 to 9 Minutes | 572 (16.0%) | 644 (19.7%) |
| 10 to 14 Minutes | 661 (18.4%) | 975 (29.9%) |
| 15 to 19 Minutes | 799 (22.3%) | 779 (23.9%) |
| 20 to 24 Minutes | 539 (15.0%) | 343 (10.5%) |
| 25 to 29 Minutes | 246 (6.9%) | 131 (4.0%) |
| 30 to 34 Minutes | 128 (3.6%) | 174 (5.3%) |
| 35 to 39 Minutes | 45 (1.3%) | 0 (0.0%) |
| 40 to 44 Minutes | 35 (1.0%) | 0 (0.0%) |
| 45 to 59 Minutes | 284 (7.9%) | 91 (2.8%) |
| 60 to 89 Minutes | 39 (1.1%) | 68 (2.1%) |
| 90 or more Minutes | 59 (1.7%) | 33 (1.0%) |
Time of Departure to Work by Sex in Imperial
The most frequent times of departure to work in Imperial are 12:00 AM to 4:59 AM (604, 16.9%) for males and 7:00 AM to 7:29 AM (783, 24.0%) for females.
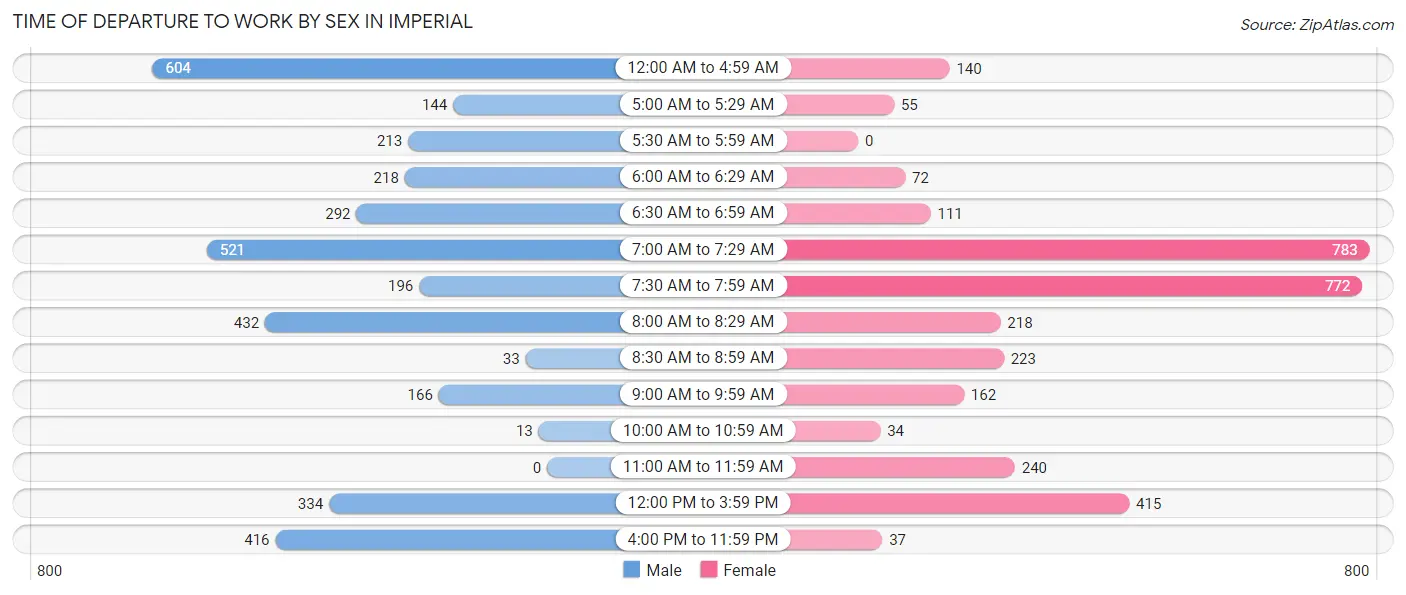
| Time of Departure | Male | Female |
| 12:00 AM to 4:59 AM | 604 (16.9%) | 140 (4.3%) |
| 5:00 AM to 5:29 AM | 144 (4.0%) | 55 (1.7%) |
| 5:30 AM to 5:59 AM | 213 (5.9%) | 0 (0.0%) |
| 6:00 AM to 6:29 AM | 218 (6.1%) | 72 (2.2%) |
| 6:30 AM to 6:59 AM | 292 (8.2%) | 111 (3.4%) |
| 7:00 AM to 7:29 AM | 521 (14.5%) | 783 (24.0%) |
| 7:30 AM to 7:59 AM | 196 (5.5%) | 772 (23.7%) |
| 8:00 AM to 8:29 AM | 432 (12.1%) | 218 (6.7%) |
| 8:30 AM to 8:59 AM | 33 (0.9%) | 223 (6.8%) |
| 9:00 AM to 9:59 AM | 166 (4.6%) | 162 (5.0%) |
| 10:00 AM to 10:59 AM | 13 (0.4%) | 34 (1.0%) |
| 11:00 AM to 11:59 AM | 0 (0.0%) | 240 (7.4%) |
| 12:00 PM to 3:59 PM | 334 (9.3%) | 415 (12.7%) |
| 4:00 PM to 11:59 PM | 416 (11.6%) | 37 (1.1%) |
| Total | 3,582 (100.0%) | 3,262 (100.0%) |
Housing Occupancy in Imperial
Occupancy by Ownership in Imperial
Of the total 5,146 dwellings in Imperial, owner-occupied units account for 3,386 (65.8%), while renter-occupied units make up 1,760 (34.2%).
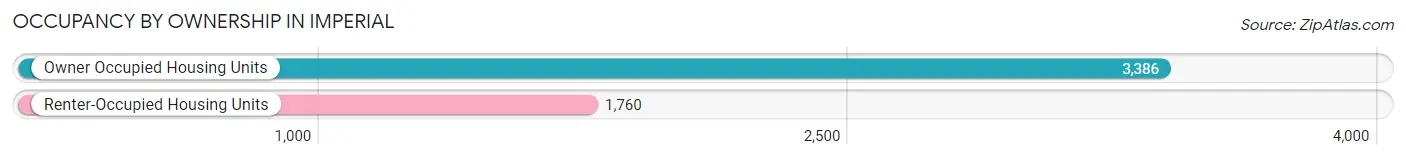
| Occupancy | # Housing Units | % Housing Units |
| Owner Occupied Housing Units | 3,386 | 65.8% |
| Renter-Occupied Housing Units | 1,760 | 34.2% |
| Total Occupied Housing Units | 5,146 | 100.0% |
Occupancy by Household Size in Imperial
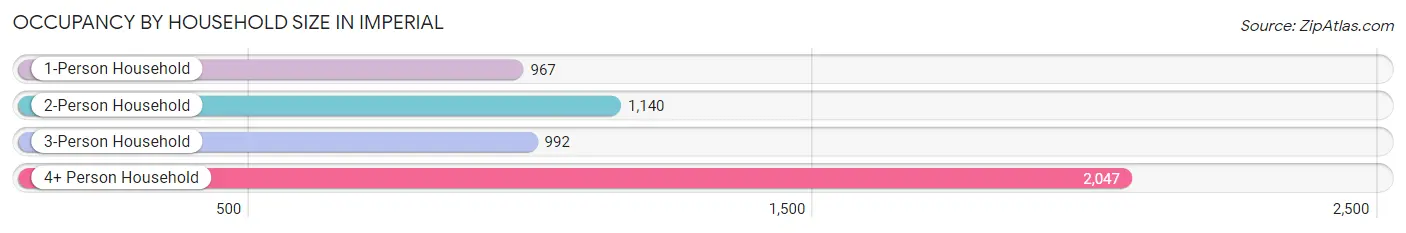
| Household Size | # Housing Units | % Housing Units |
| 1-Person Household | 967 | 18.8% |
| 2-Person Household | 1,140 | 22.2% |
| 3-Person Household | 992 | 19.3% |
| 4+ Person Household | 2,047 | 39.8% |
| Total Housing Units | 5,146 | 100.0% |
Occupancy by Ownership by Household Size in Imperial
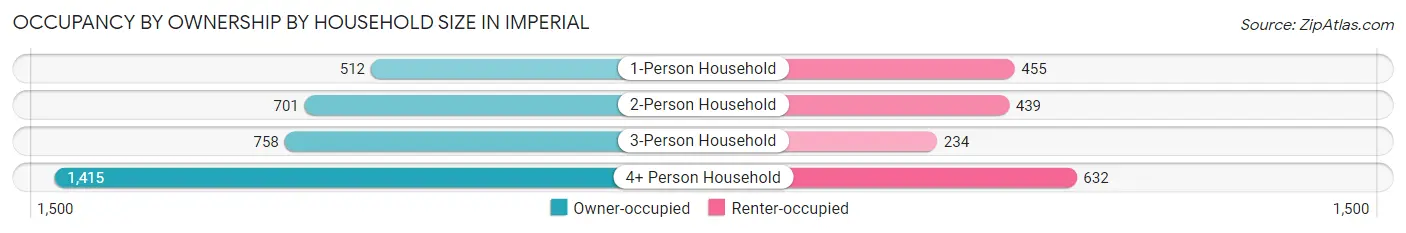
| Household Size | Owner-occupied | Renter-occupied |
| 1-Person Household | 512 (52.9%) | 455 (47.0%) |
| 2-Person Household | 701 (61.5%) | 439 (38.5%) |
| 3-Person Household | 758 (76.4%) | 234 (23.6%) |
| 4+ Person Household | 1,415 (69.1%) | 632 (30.9%) |
| Total Housing Units | 3,386 (65.8%) | 1,760 (34.2%) |
Occupancy by Educational Attainment in Imperial
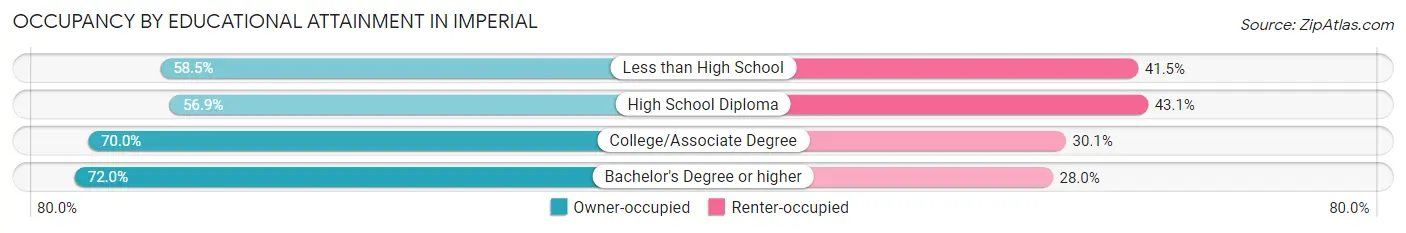
| Household Size | Owner-occupied | Renter-occupied |
| Less than High School | 534 (58.5%) | 379 (41.5%) |
| High School Diploma | 608 (56.9%) | 460 (43.1%) |
| College/Associate Degree | 1,201 (70.0%) | 516 (30.0%) |
| Bachelor's Degree or higher | 1,043 (72.0%) | 405 (28.0%) |
Occupancy by Age of Householder in Imperial
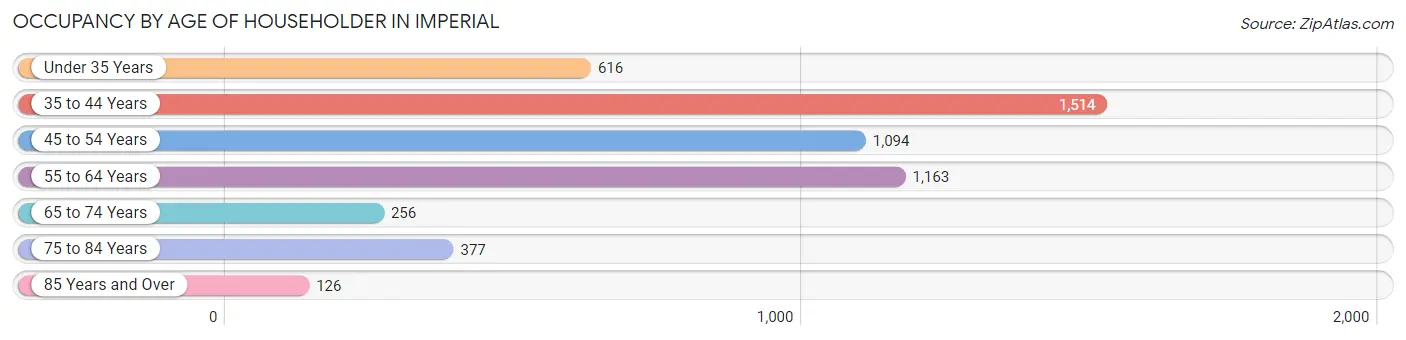
| Age Bracket | # Households | % Households |
| Under 35 Years | 616 | 12.0% |
| 35 to 44 Years | 1,514 | 29.4% |
| 45 to 54 Years | 1,094 | 21.3% |
| 55 to 64 Years | 1,163 | 22.6% |
| 65 to 74 Years | 256 | 5.0% |
| 75 to 84 Years | 377 | 7.3% |
| 85 Years and Over | 126 | 2.5% |
| Total | 5,146 | 100.0% |
Housing Finances in Imperial
Median Income by Occupancy in Imperial
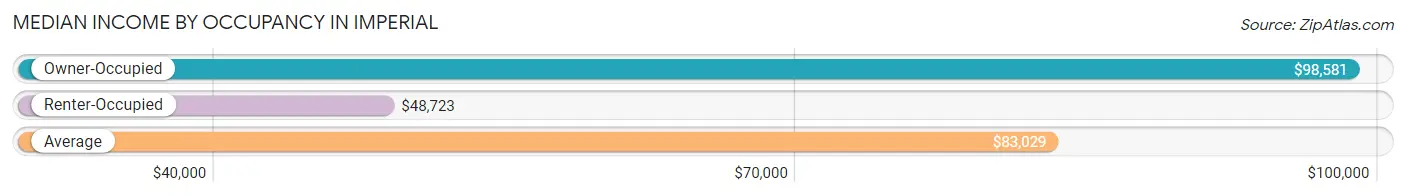
| Occupancy Type | # Households | Median Income |
| Owner-Occupied | 3,386 (65.8%) | $98,581 |
| Renter-Occupied | 1,760 (34.2%) | $48,723 |
| Average | 5,146 (100.0%) | $83,029 |
Occupancy by Householder Income Bracket in Imperial
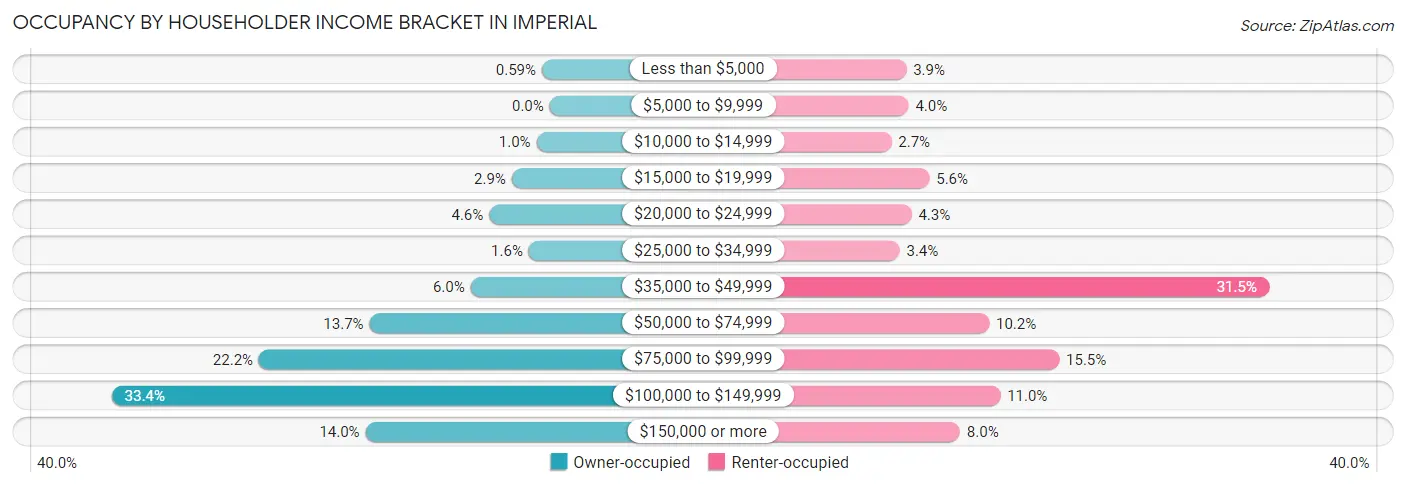
| Income Bracket | Owner-occupied | Renter-occupied |
| Less than $5,000 | 20 (0.6%) | 68 (3.9%) |
| $5,000 to $9,999 | 0 (0.0%) | 71 (4.0%) |
| $10,000 to $14,999 | 34 (1.0%) | 48 (2.7%) |
| $15,000 to $19,999 | 98 (2.9%) | 99 (5.6%) |
| $20,000 to $24,999 | 156 (4.6%) | 75 (4.3%) |
| $25,000 to $34,999 | 54 (1.6%) | 59 (3.4%) |
| $35,000 to $49,999 | 204 (6.0%) | 554 (31.5%) |
| $50,000 to $74,999 | 465 (13.7%) | 179 (10.2%) |
| $75,000 to $99,999 | 750 (22.2%) | 273 (15.5%) |
| $100,000 to $149,999 | 1,130 (33.4%) | 194 (11.0%) |
| $150,000 or more | 475 (14.0%) | 140 (8.0%) |
| Total | 3,386 (100.0%) | 1,760 (100.0%) |
Monthly Housing Cost Tiers in Imperial
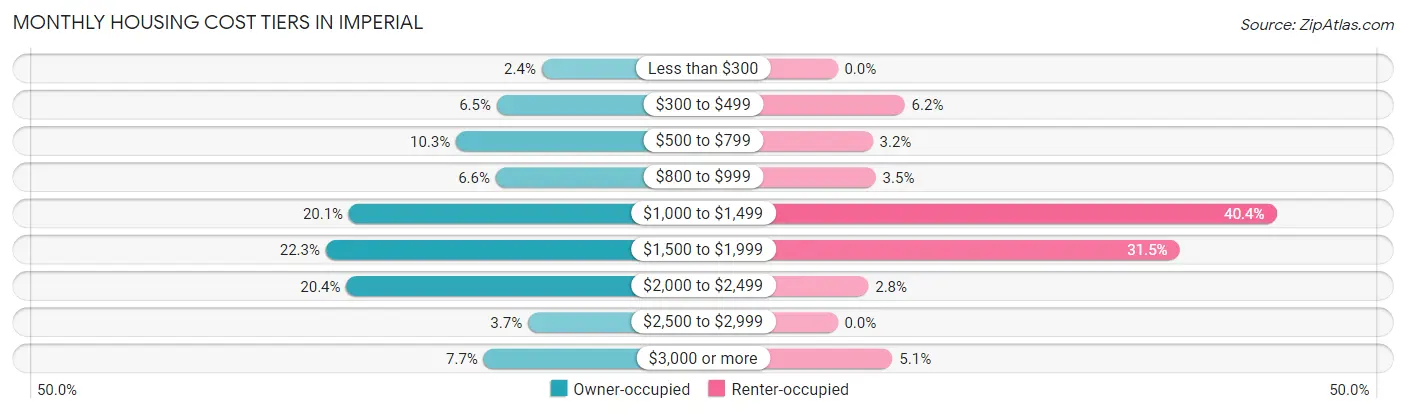
| Monthly Cost | Owner-occupied | Renter-occupied |
| Less than $300 | 81 (2.4%) | 0 (0.0%) |
| $300 to $499 | 221 (6.5%) | 109 (6.2%) |
| $500 to $799 | 348 (10.3%) | 57 (3.2%) |
| $800 to $999 | 224 (6.6%) | 62 (3.5%) |
| $1,000 to $1,499 | 682 (20.1%) | 711 (40.4%) |
| $1,500 to $1,999 | 754 (22.3%) | 554 (31.5%) |
| $2,000 to $2,499 | 690 (20.4%) | 50 (2.8%) |
| $2,500 to $2,999 | 124 (3.7%) | 0 (0.0%) |
| $3,000 or more | 262 (7.7%) | 89 (5.1%) |
| Total | 3,386 (100.0%) | 1,760 (100.0%) |
Physical Housing Characteristics in Imperial
Housing Structures in Imperial
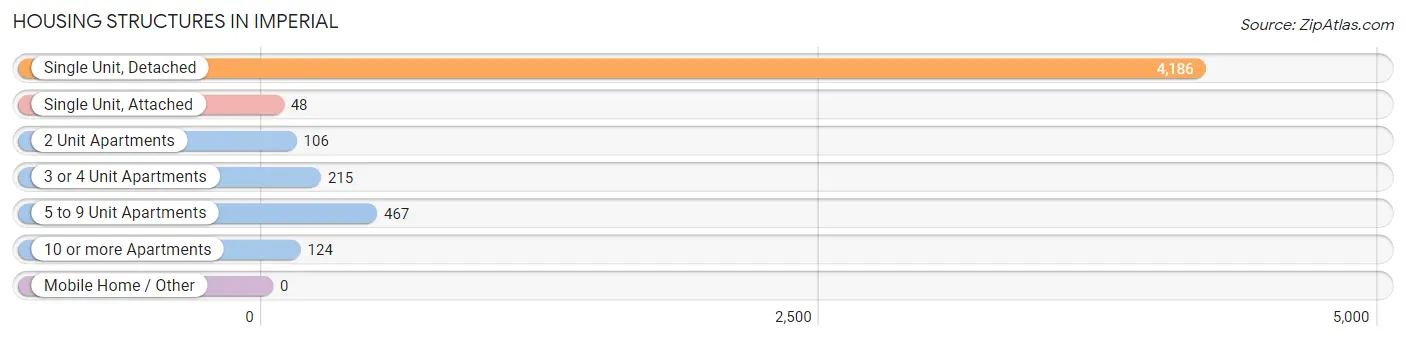
| Structure Type | # Housing Units | % Housing Units |
| Single Unit, Detached | 4,186 | 81.3% |
| Single Unit, Attached | 48 | 0.9% |
| 2 Unit Apartments | 106 | 2.1% |
| 3 or 4 Unit Apartments | 215 | 4.2% |
| 5 to 9 Unit Apartments | 467 | 9.1% |
| 10 or more Apartments | 124 | 2.4% |
| Mobile Home / Other | 0 | 0.0% |
| Total | 5,146 | 100.0% |
Housing Structures by Occupancy in Imperial
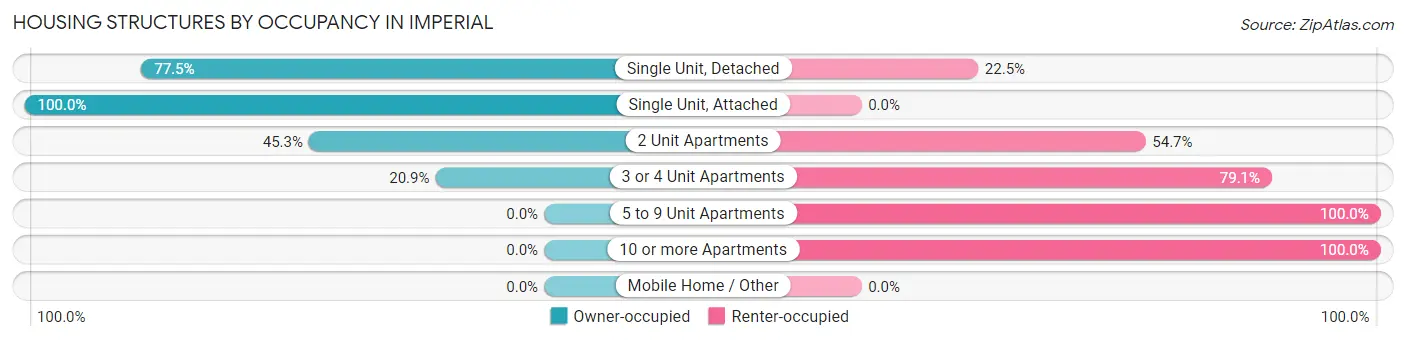
| Structure Type | Owner-occupied | Renter-occupied |
| Single Unit, Detached | 3,245 (77.5%) | 941 (22.5%) |
| Single Unit, Attached | 48 (100.0%) | 0 (0.0%) |
| 2 Unit Apartments | 48 (45.3%) | 58 (54.7%) |
| 3 or 4 Unit Apartments | 45 (20.9%) | 170 (79.1%) |
| 5 to 9 Unit Apartments | 0 (0.0%) | 467 (100.0%) |
| 10 or more Apartments | 0 (0.0%) | 124 (100.0%) |
| Mobile Home / Other | 0 (0.0%) | 0 (0.0%) |
| Total | 3,386 (65.8%) | 1,760 (34.2%) |
Housing Structures by Number of Rooms in Imperial
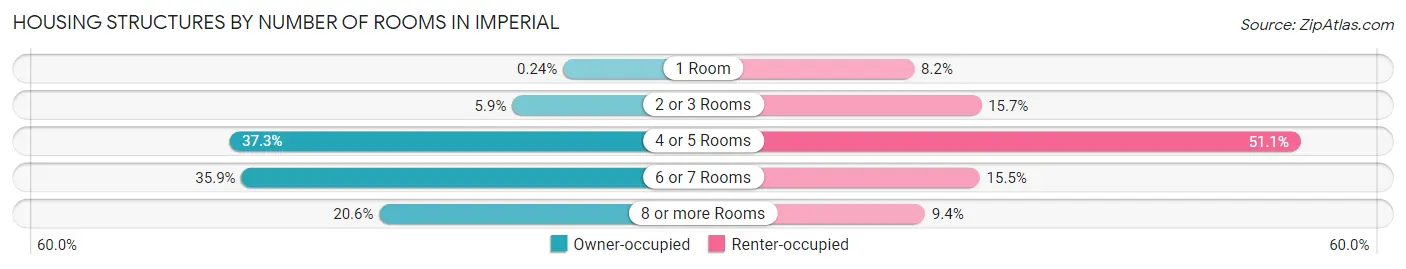
| Number of Rooms | Owner-occupied | Renter-occupied |
| 1 Room | 8 (0.2%) | 145 (8.2%) |
| 2 or 3 Rooms | 199 (5.9%) | 276 (15.7%) |
| 4 or 5 Rooms | 1,263 (37.3%) | 900 (51.1%) |
| 6 or 7 Rooms | 1,217 (35.9%) | 273 (15.5%) |
| 8 or more Rooms | 699 (20.6%) | 166 (9.4%) |
| Total | 3,386 (100.0%) | 1,760 (100.0%) |
Housing Structure by Heating Type in Imperial
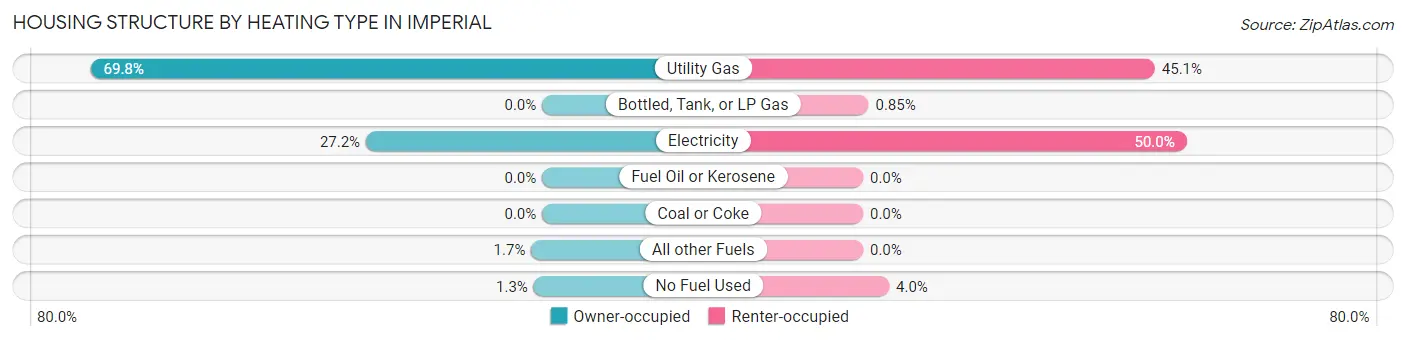
| Heating Type | Owner-occupied | Renter-occupied |
| Utility Gas | 2,363 (69.8%) | 794 (45.1%) |
| Bottled, Tank, or LP Gas | 0 (0.0%) | 15 (0.9%) |
| Electricity | 922 (27.2%) | 880 (50.0%) |
| Fuel Oil or Kerosene | 0 (0.0%) | 0 (0.0%) |
| Coal or Coke | 0 (0.0%) | 0 (0.0%) |
| All other Fuels | 57 (1.7%) | 0 (0.0%) |
| No Fuel Used | 44 (1.3%) | 71 (4.0%) |
| Total | 3,386 (100.0%) | 1,760 (100.0%) |
Household Vehicle Usage in Imperial
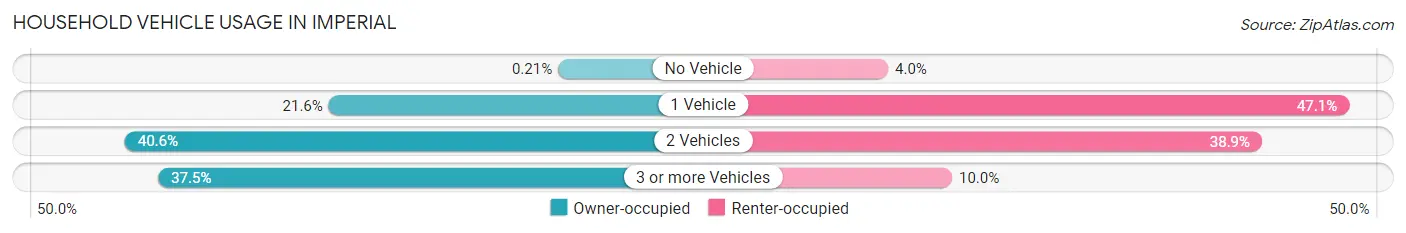
| Vehicles per Household | Owner-occupied | Renter-occupied |
| No Vehicle | 7 (0.2%) | 71 (4.0%) |
| 1 Vehicle | 732 (21.6%) | 828 (47.0%) |
| 2 Vehicles | 1,376 (40.6%) | 685 (38.9%) |
| 3 or more Vehicles | 1,271 (37.5%) | 176 (10.0%) |
| Total | 3,386 (100.0%) | 1,760 (100.0%) |
Real Estate & Mortgages in Imperial
Real Estate and Mortgage Overview in Imperial
| Characteristic | Without Mortgage | With Mortgage |
| Housing Units | 872 | 2,514 |
| Median Property Value | $300,300 | $297,500 |
| Median Household Income | $72,332 | $411 |
| Monthly Housing Costs | $598 | $262 |
| Real Estate Taxes | $1,891 | $18 |
Property Value by Mortgage Status in Imperial
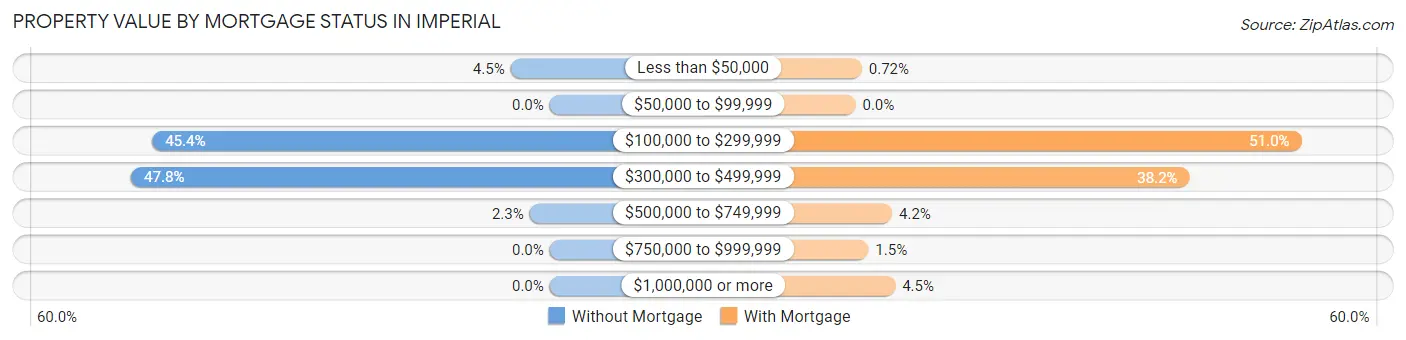
| Property Value | Without Mortgage | With Mortgage |
| Less than $50,000 | 39 (4.5%) | 18 (0.7%) |
| $50,000 to $99,999 | 0 (0.0%) | 0 (0.0%) |
| $100,000 to $299,999 | 396 (45.4%) | 1,281 (50.9%) |
| $300,000 to $499,999 | 417 (47.8%) | 959 (38.2%) |
| $500,000 to $749,999 | 20 (2.3%) | 105 (4.2%) |
| $750,000 to $999,999 | 0 (0.0%) | 37 (1.5%) |
| $1,000,000 or more | 0 (0.0%) | 114 (4.5%) |
| Total | 872 (100.0%) | 2,514 (100.0%) |
Household Income by Mortgage Status in Imperial
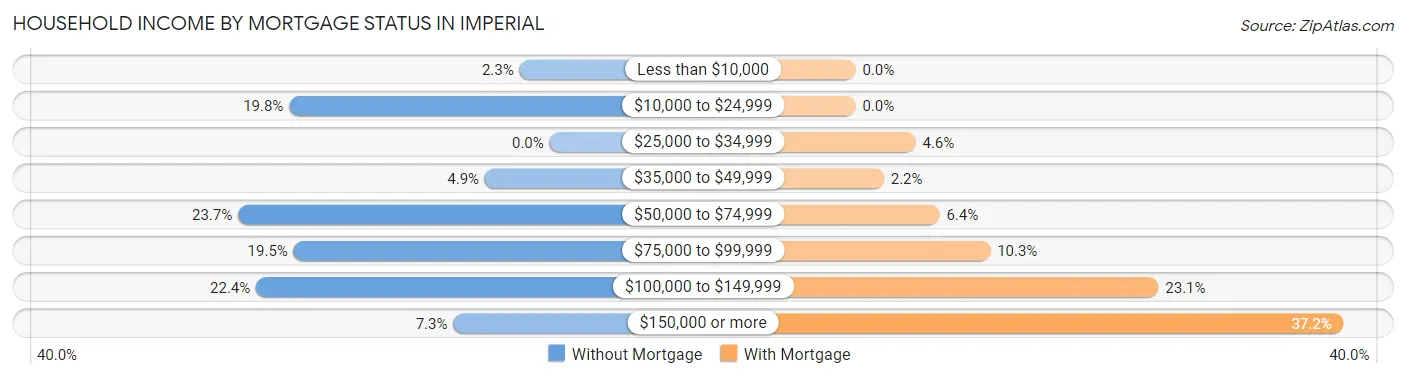
| Household Income | Without Mortgage | With Mortgage |
| Less than $10,000 | 20 (2.3%) | 0 (0.0%) |
| $10,000 to $24,999 | 173 (19.8%) | 0 (0.0%) |
| $25,000 to $34,999 | 0 (0.0%) | 115 (4.6%) |
| $35,000 to $49,999 | 43 (4.9%) | 54 (2.1%) |
| $50,000 to $74,999 | 207 (23.7%) | 161 (6.4%) |
| $75,000 to $99,999 | 170 (19.5%) | 258 (10.3%) |
| $100,000 to $149,999 | 195 (22.4%) | 580 (23.1%) |
| $150,000 or more | 64 (7.3%) | 935 (37.2%) |
| Total | 872 (100.0%) | 2,514 (100.0%) |
Property Value to Household Income Ratio in Imperial
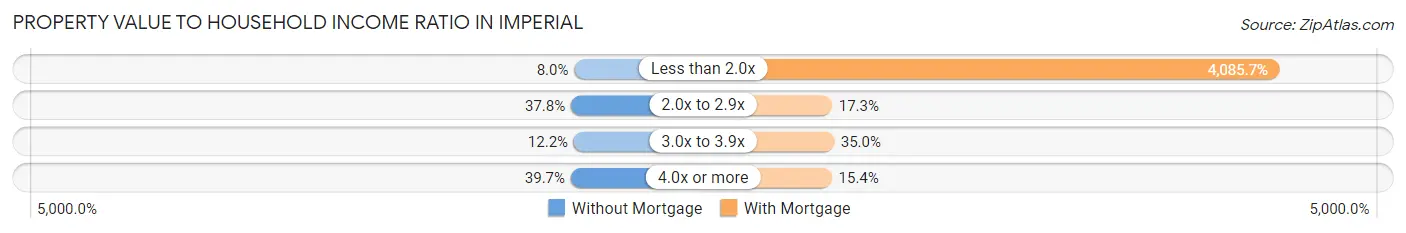
| Value-to-Income Ratio | Without Mortgage | With Mortgage |
| Less than 2.0x | 70 (8.0%) | 102,714 (4,085.7%) |
| 2.0x to 2.9x | 330 (37.8%) | 436 (17.3%) |
| 3.0x to 3.9x | 106 (12.2%) | 881 (35.0%) |
| 4.0x or more | 346 (39.7%) | 388 (15.4%) |
| Total | 872 (100.0%) | 2,514 (100.0%) |
Real Estate Taxes by Mortgage Status in Imperial
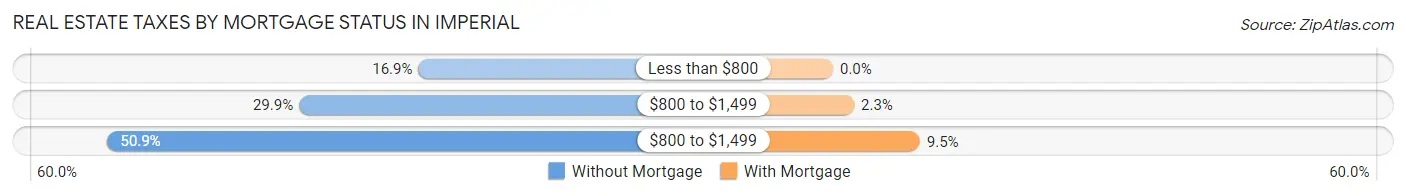
| Property Taxes | Without Mortgage | With Mortgage |
| Less than $800 | 147 (16.9%) | 0 (0.0%) |
| $800 to $1,499 | 261 (29.9%) | 58 (2.3%) |
| $800 to $1,499 | 444 (50.9%) | 239 (9.5%) |
| Total | 872 (100.0%) | 2,514 (100.0%) |
Health & Disability in Imperial
Health Insurance Coverage by Age in Imperial
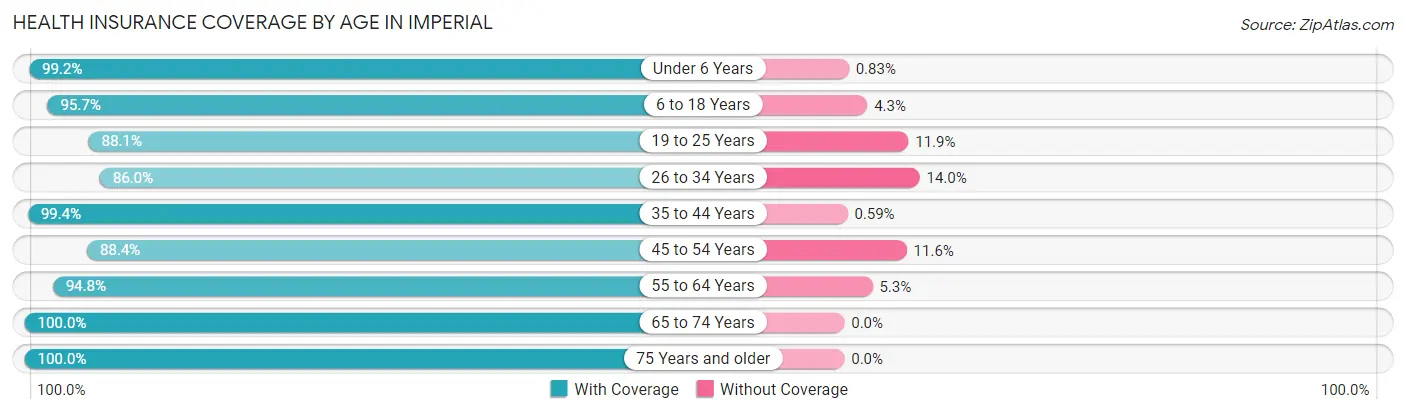
| Age Bracket | With Coverage | Without Coverage |
| Under 6 Years | 2,501 (99.2%) | 21 (0.8%) |
| 6 to 18 Years | 4,929 (95.7%) | 220 (4.3%) |
| 19 to 25 Years | 1,513 (88.1%) | 205 (11.9%) |
| 26 to 34 Years | 1,569 (86.0%) | 256 (14.0%) |
| 35 to 44 Years | 2,535 (99.4%) | 15 (0.6%) |
| 45 to 54 Years | 1,899 (88.4%) | 250 (11.6%) |
| 55 to 64 Years | 2,472 (94.8%) | 137 (5.2%) |
| 65 to 74 Years | 1,045 (100.0%) | 0 (0.0%) |
| 75 Years and older | 811 (100.0%) | 0 (0.0%) |
| Total | 19,274 (94.6%) | 1,104 (5.4%) |
Health Insurance Coverage by Citizenship Status in Imperial
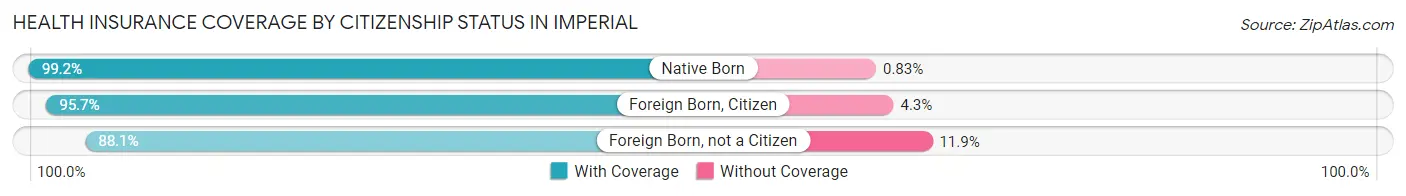
| Citizenship Status | With Coverage | Without Coverage |
| Native Born | 2,501 (99.2%) | 21 (0.8%) |
| Foreign Born, Citizen | 4,929 (95.7%) | 220 (4.3%) |
| Foreign Born, not a Citizen | 1,513 (88.1%) | 205 (11.9%) |
Health Insurance Coverage by Household Income in Imperial
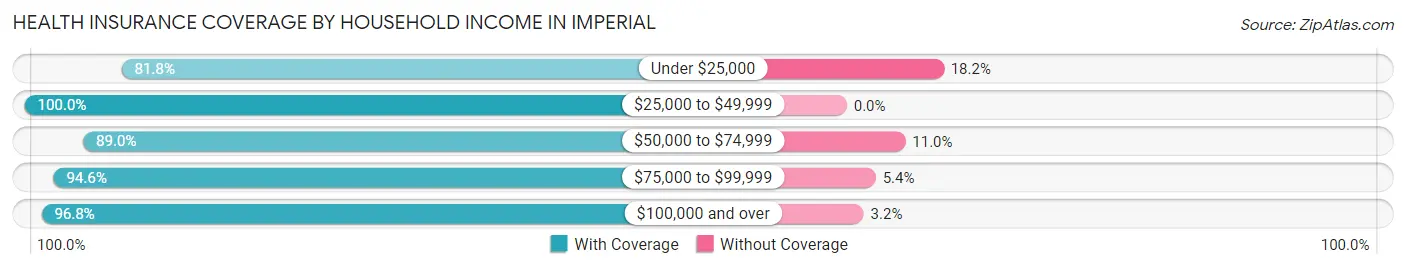
| Household Income | With Coverage | Without Coverage |
| Under $25,000 | 1,762 (81.8%) | 391 (18.2%) |
| $25,000 to $49,999 | 3,132 (100.0%) | 0 (0.0%) |
| $50,000 to $74,999 | 1,875 (89.0%) | 231 (11.0%) |
| $75,000 to $99,999 | 3,001 (94.6%) | 172 (5.4%) |
| $100,000 and over | 9,504 (96.8%) | 310 (3.2%) |
Public vs Private Health Insurance Coverage by Age in Imperial
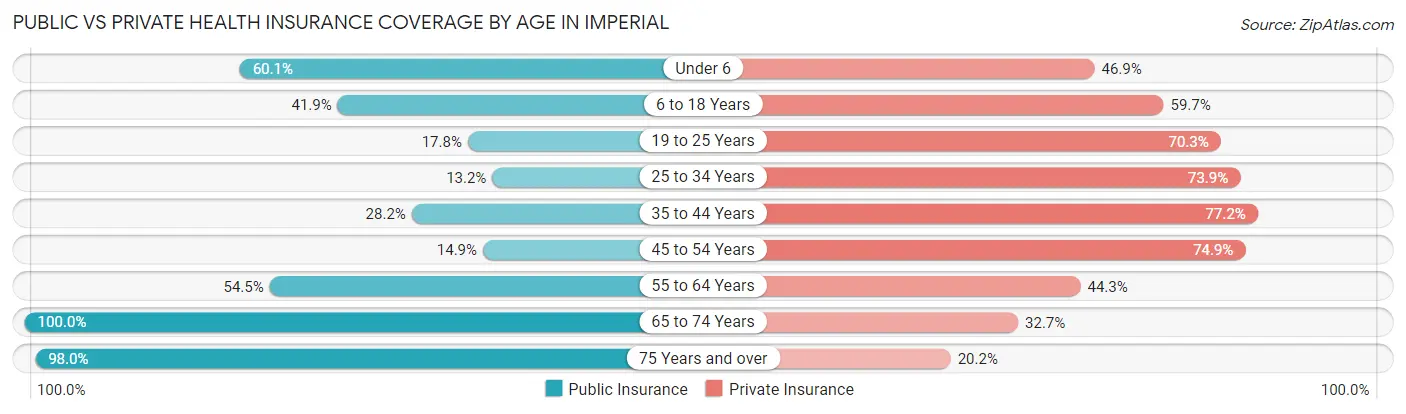
| Age Bracket | Public Insurance | Private Insurance |
| Under 6 | 1,515 (60.1%) | 1,183 (46.9%) |
| 6 to 18 Years | 2,158 (41.9%) | 3,075 (59.7%) |
| 19 to 25 Years | 305 (17.7%) | 1,208 (70.3%) |
| 25 to 34 Years | 241 (13.2%) | 1,349 (73.9%) |
| 35 to 44 Years | 718 (28.2%) | 1,968 (77.2%) |
| 45 to 54 Years | 321 (14.9%) | 1,609 (74.9%) |
| 55 to 64 Years | 1,423 (54.5%) | 1,156 (44.3%) |
| 65 to 74 Years | 1,045 (100.0%) | 342 (32.7%) |
| 75 Years and over | 795 (98.0%) | 164 (20.2%) |
| Total | 8,521 (41.8%) | 12,054 (59.2%) |
Disability Status by Sex by Age in Imperial
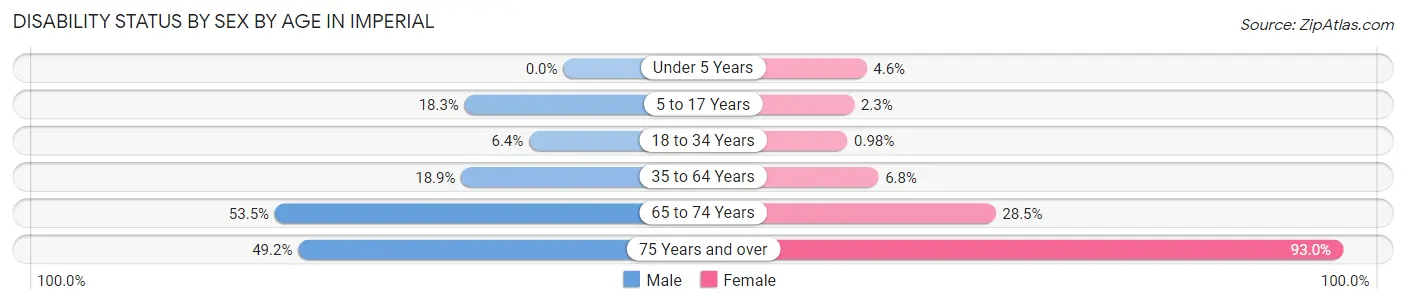
| Age Bracket | Male | Female |
| Under 5 Years | 0 (0.0%) | 49 (4.5%) |
| 5 to 17 Years | 474 (18.3%) | 57 (2.2%) |
| 18 to 34 Years | 109 (6.4%) | 23 (1.0%) |
| 35 to 64 Years | 715 (18.9%) | 239 (6.8%) |
| 65 to 74 Years | 227 (53.5%) | 177 (28.5%) |
| 75 Years and over | 188 (49.2%) | 399 (93.0%) |
Disability Class by Sex by Age in Imperial
Disability Class: Hearing Difficulty
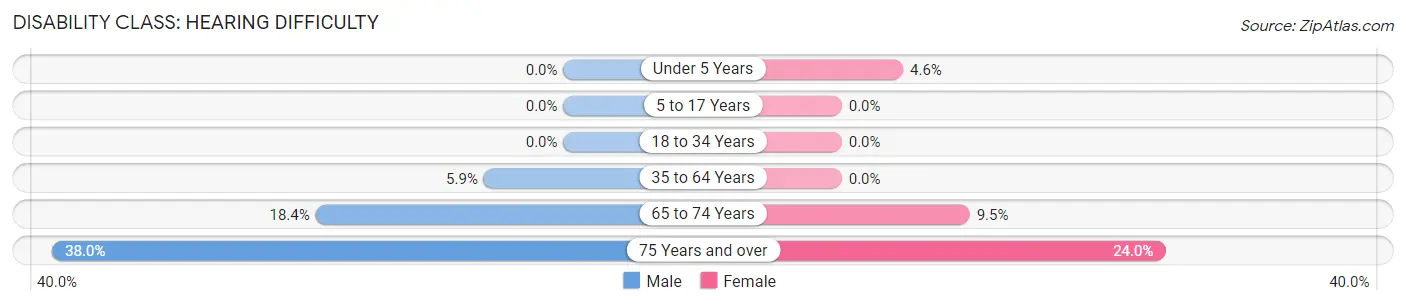
| Age Bracket | Male | Female |
| Under 5 Years | 0 (0.0%) | 49 (4.5%) |
| 5 to 17 Years | 0 (0.0%) | 0 (0.0%) |
| 18 to 34 Years | 0 (0.0%) | 0 (0.0%) |
| 35 to 64 Years | 223 (5.9%) | 0 (0.0%) |
| 65 to 74 Years | 78 (18.4%) | 59 (9.5%) |
| 75 Years and over | 145 (38.0%) | 103 (24.0%) |
Disability Class: Vision Difficulty
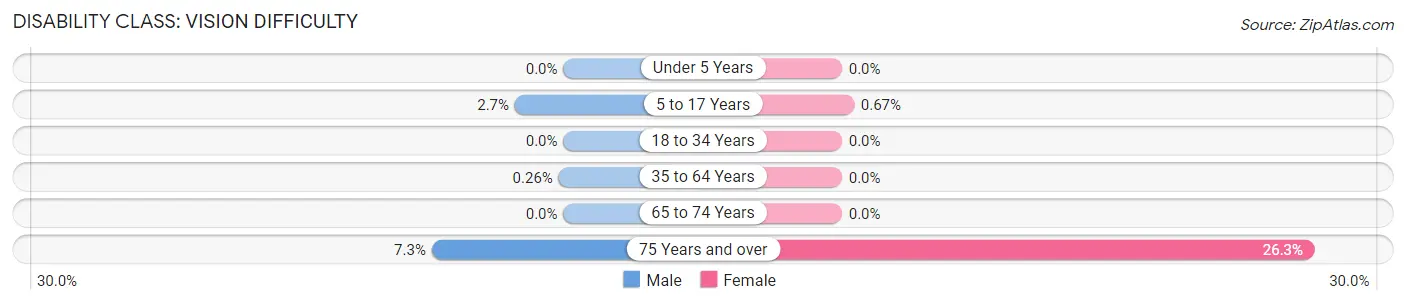
| Age Bracket | Male | Female |
| Under 5 Years | 0 (0.0%) | 0 (0.0%) |
| 5 to 17 Years | 70 (2.7%) | 17 (0.7%) |
| 18 to 34 Years | 0 (0.0%) | 0 (0.0%) |
| 35 to 64 Years | 10 (0.3%) | 0 (0.0%) |
| 65 to 74 Years | 0 (0.0%) | 0 (0.0%) |
| 75 Years and over | 28 (7.3%) | 113 (26.3%) |
Disability Class: Cognitive Difficulty
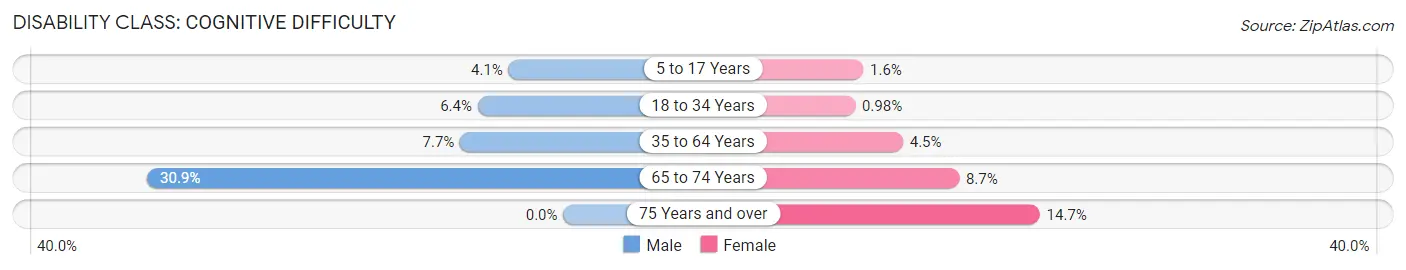
| Age Bracket | Male | Female |
| 5 to 17 Years | 105 (4.1%) | 40 (1.6%) |
| 18 to 34 Years | 109 (6.4%) | 23 (1.0%) |
| 35 to 64 Years | 289 (7.7%) | 160 (4.5%) |
| 65 to 74 Years | 131 (30.9%) | 54 (8.7%) |
| 75 Years and over | 0 (0.0%) | 63 (14.7%) |
Disability Class: Ambulatory Difficulty
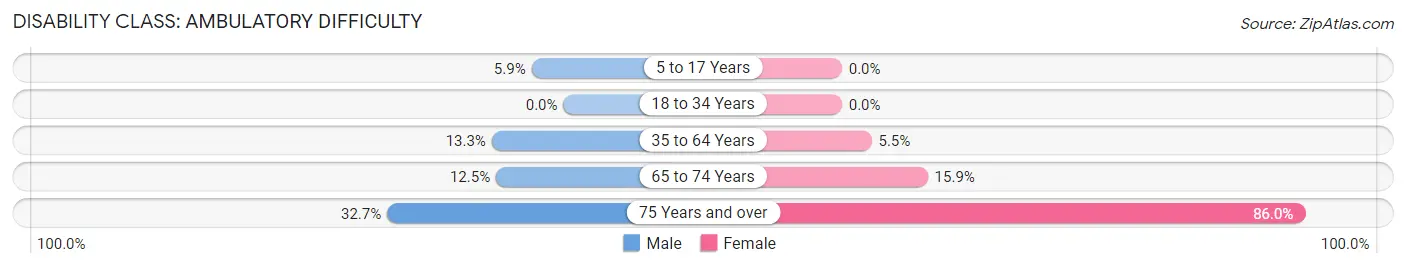
| Age Bracket | Male | Female |
| 5 to 17 Years | 153 (5.9%) | 0 (0.0%) |
| 18 to 34 Years | 0 (0.0%) | 0 (0.0%) |
| 35 to 64 Years | 502 (13.3%) | 195 (5.5%) |
| 65 to 74 Years | 53 (12.5%) | 99 (15.9%) |
| 75 Years and over | 125 (32.7%) | 369 (86.0%) |
Disability Class: Self-Care Difficulty
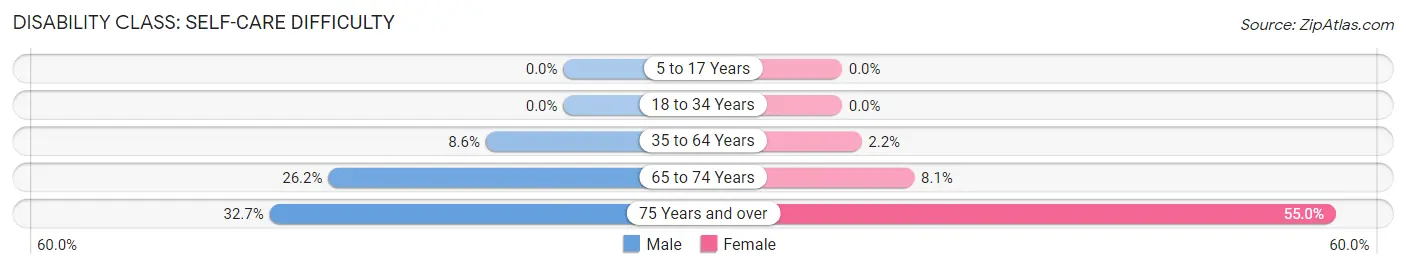
| Age Bracket | Male | Female |
| 5 to 17 Years | 0 (0.0%) | 0 (0.0%) |
| 18 to 34 Years | 0 (0.0%) | 0 (0.0%) |
| 35 to 64 Years | 326 (8.6%) | 77 (2.2%) |
| 65 to 74 Years | 111 (26.2%) | 50 (8.1%) |
| 75 Years and over | 125 (32.7%) | 236 (55.0%) |
Technology Access in Imperial
Computing Device Access in Imperial
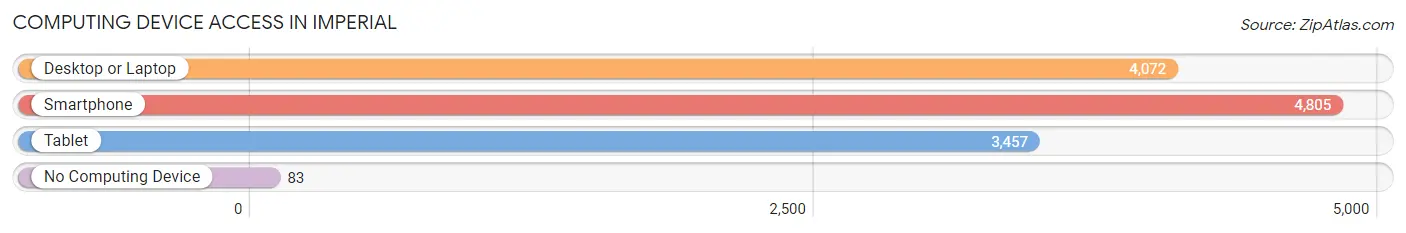
| Device Type | # Households | % Households |
| Desktop or Laptop | 4,072 | 79.1% |
| Smartphone | 4,805 | 93.4% |
| Tablet | 3,457 | 67.2% |
| No Computing Device | 83 | 1.6% |
| Total | 5,146 | 100.0% |
Internet Access in Imperial
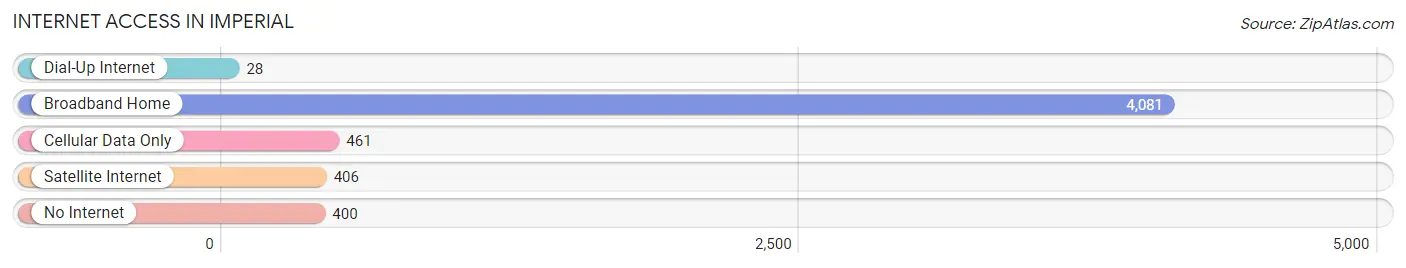
| Internet Type | # Households | % Households |
| Dial-Up Internet | 28 | 0.5% |
| Broadband Home | 4,081 | 79.3% |
| Cellular Data Only | 461 | 9.0% |
| Satellite Internet | 406 | 7.9% |
| No Internet | 400 | 7.8% |
| Total | 5,146 | 100.0% |
Imperial Summary
Imperial is a city located in Imperial County, California, United States. It is located in the southeastern corner of the state, near the border with Mexico. The population was 14,758 at the 2010 census, up from 14,536 at the 2000 census. It is part of the El Centro metropolitan area.
Geography
Imperial is located at 32°49′N 115°30′W (32.8133, -115.4983). According to the United States Census Bureau, the city has a total area of 4.8 square miles (12.4 km2), all of it land.
History
Imperial was founded in 1901 by W.F. Holt and C.A. Barker, two real estate developers from Los Angeles. The city was named after Imperial Valley, which was in turn named for the Imperial Land Company, a subsidiary of the California Development Company, which had been formed to promote the valley's development.
The Imperial Valley was a major center of agriculture in the early 20th century, and Imperial was the center of the valley's business and social life. The city was incorporated in 1957.
Economy
Imperial is the economic center of the Imperial Valley, and is home to a variety of businesses and industries. The city is home to the Imperial Valley Mall, which is the largest shopping center in the area. The city is also home to a number of manufacturing and agricultural businesses, including Imperial Valley Foods, Imperial Valley Packing, and Imperial Valley Produce.
The city is also home to a number of government and military installations, including the Naval Air Facility El Centro, the U.S. Border Patrol El Centro Sector Headquarters, and the Imperial County Airport.
Demographics
As of the census of 2000, there were 14,536 people, 4,636 households, and 3,435 families residing in the city. The population density was 3,072.3 people per square mile (1,185.2/km2). There were 5,134 housing units at an average density of 1,072.3 per square mile (414.3/km2). The racial makeup of the city was 63.2% White, 1.7% African American, 1.1% Native American, 0.8% Asian, 0.1% Pacific Islander, 30.5% from other races, and 3.6% from two or more races. Hispanic or Latino of any race were 57.5% of the population.
There were 4,636 households, out of which 41.2% had children under the age of 18 living with them, 51.2% were married couples living together, 16.2% had a female householder with no husband present, and 25.7% were non-families. 20.9% of all households were made up of individuals, and 8.9% had someone living alone who was 65 years of age or older. The average household size was 3.11 and the average family size was 3.63.
In the city, the population was spread out, with 33.2% under the age of 18, 9.3% from 18 to 24, 27.2% from 25 to 44, 18.5% from 45 to 64, and 11.8% who were 65 years of age or older. The median age was 30 years. For every 100 females, there were 97.7 males. For every 100 females age 18 and over, there were 94.2 males.
The median income for a household in the city was $27,844, and the median income for a family was $31,979. Males had a median income of $26,844 versus $20,813 for females. The per capita income for the city was $11,845. About 20.2% of families and 23.3% of the population were below the poverty line, including 30.2% of those under age 18 and 16.7% of those age 65 or over.
Common Questions
What is Per Capita Income in Imperial?
Per Capita income in Imperial is $25,203.
What is the Median Family Income in Imperial?
Median Family Income in Imperial is $94,163.
What is the Median Household income in Imperial?
Median Household Income in Imperial is $83,029.
What is Income or Wage Gap in Imperial?
Income or Wage Gap in Imperial is 41.8%.
Women in Imperial earn 58.2 cents for every dollar earned by a man.
What is Inequality or Gini Index in Imperial?
Inequality or Gini Index in Imperial is 0.37.
What is the Total Population of Imperial?
Total Population of Imperial is 20,430.
What is the Total Male Population of Imperial?
Total Male Population of Imperial is 9,891.
What is the Total Female Population of Imperial?
Total Female Population of Imperial is 10,539.
What is the Ratio of Males per 100 Females in Imperial?
There are 93.85 Males per 100 Females in Imperial.
What is the Ratio of Females per 100 Males in Imperial?
There are 106.55 Females per 100 Males in Imperial.
What is the Median Population Age in Imperial?
Median Population Age in Imperial is 30.4 Years.
What is the Average Family Size in Imperial
Average Family Size in Imperial is 4.7 People.
What is the Average Household Size in Imperial
Average Household Size in Imperial is 4.0 People.
How Large is the Labor Force in Imperial?
There are 8,263 People in the Labor Forcein in Imperial.
What is the Percentage of People in the Labor Force in Imperial?
58.5% of People are in the Labor Force in Imperial.
What is the Unemployment Rate in Imperial?
Unemployment Rate in Imperial is 10.7%.