Mi Wuk Village, CA Map & Demographics
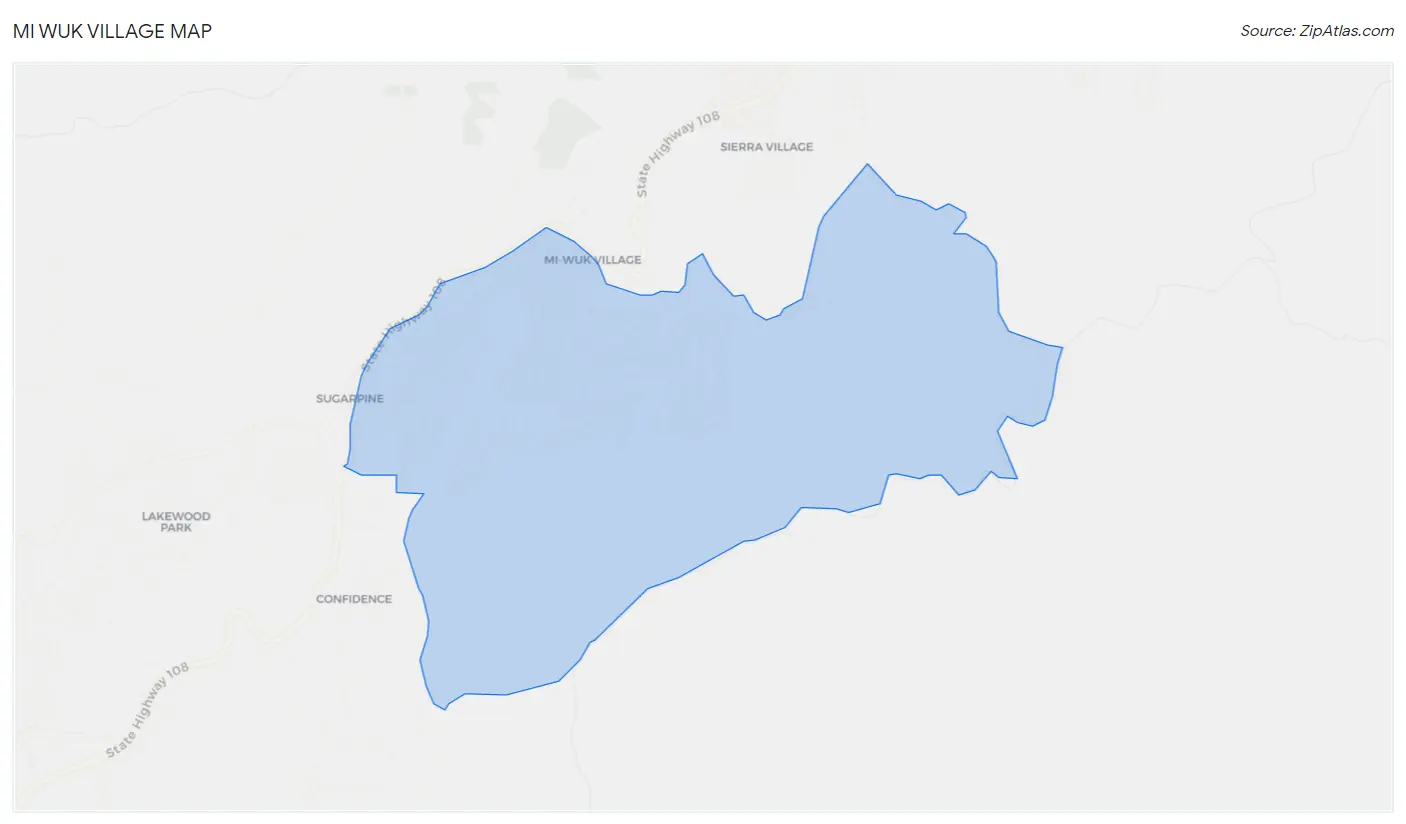
Mi Wuk Village Map
Mi Wuk Village Overview
$48,651
PER CAPITA INCOME
$146,300
AVG FAMILY INCOME
$91,848
AVG HOUSEHOLD INCOME
42.6%
WAGE / INCOME GAP [ % ]
57.4¢/ $1
WAGE / INCOME GAP [ $ ]
0.32
INEQUALITY / GINI INDEX
1,010
TOTAL POPULATION
503
MALE POPULATION
507
FEMALE POPULATION
99.21
MALES / 100 FEMALES
100.80
FEMALES / 100 MALES
53.6
MEDIAN AGE
3.1
AVG FAMILY SIZE
2.5
AVG HOUSEHOLD SIZE
515
LABOR FORCE [ PEOPLE ]
57.0%
PERCENT IN LABOR FORCE
13.6%
UNEMPLOYMENT RATE
Mi Wuk Village Zip Codes
Mi Wuk Village Area Codes
Income in Mi Wuk Village
Income Overview in Mi Wuk Village
Per Capita Income in Mi Wuk Village is $48,651, while median incomes of families and households are $146,300 and $91,848 respectively.
| Characteristic | Number | Measure |
| Per Capita Income | 1,010 | $48,651 |
| Median Family Income | 270 | $146,300 |
| Mean Family Income | 270 | $142,488 |
| Median Household Income | 410 | $91,848 |
| Mean Household Income | 410 | $113,607 |
| Income Deficit | 270 | $0 |
| Wage / Income Gap (%) | 1,010 | 42.62% |
| Wage / Income Gap ($) | 1,010 | 57.38¢ per $1 |
| Gini / Inequality Index | 1,010 | 0.32 |
Earnings by Sex in Mi Wuk Village
Average Earnings in Mi Wuk Village are $32,969, $48,500 for men and $27,831 for women, a difference of 42.6%.
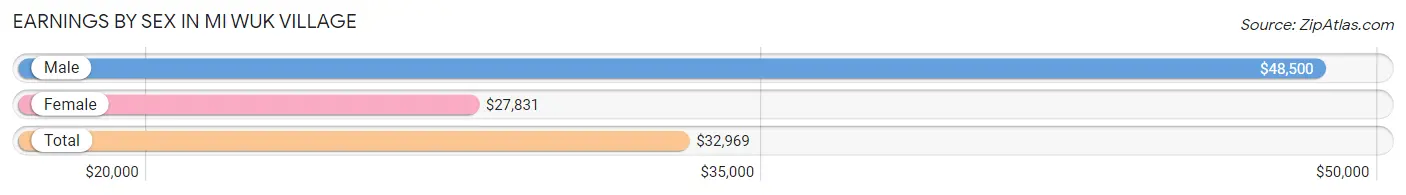
| Sex | Number | Average Earnings |
| Male | 330 (52.0%) | $48,500 |
| Female | 305 (48.0%) | $27,831 |
| Total | 635 (100.0%) | $32,969 |
Earnings by Sex by Income Bracket in Mi Wuk Village
The most common earnings brackets in Mi Wuk Village are $22,500 to $24,999 for men (55 | 16.7%) and $25,000 to $29,999 for women (65 | 21.3%).
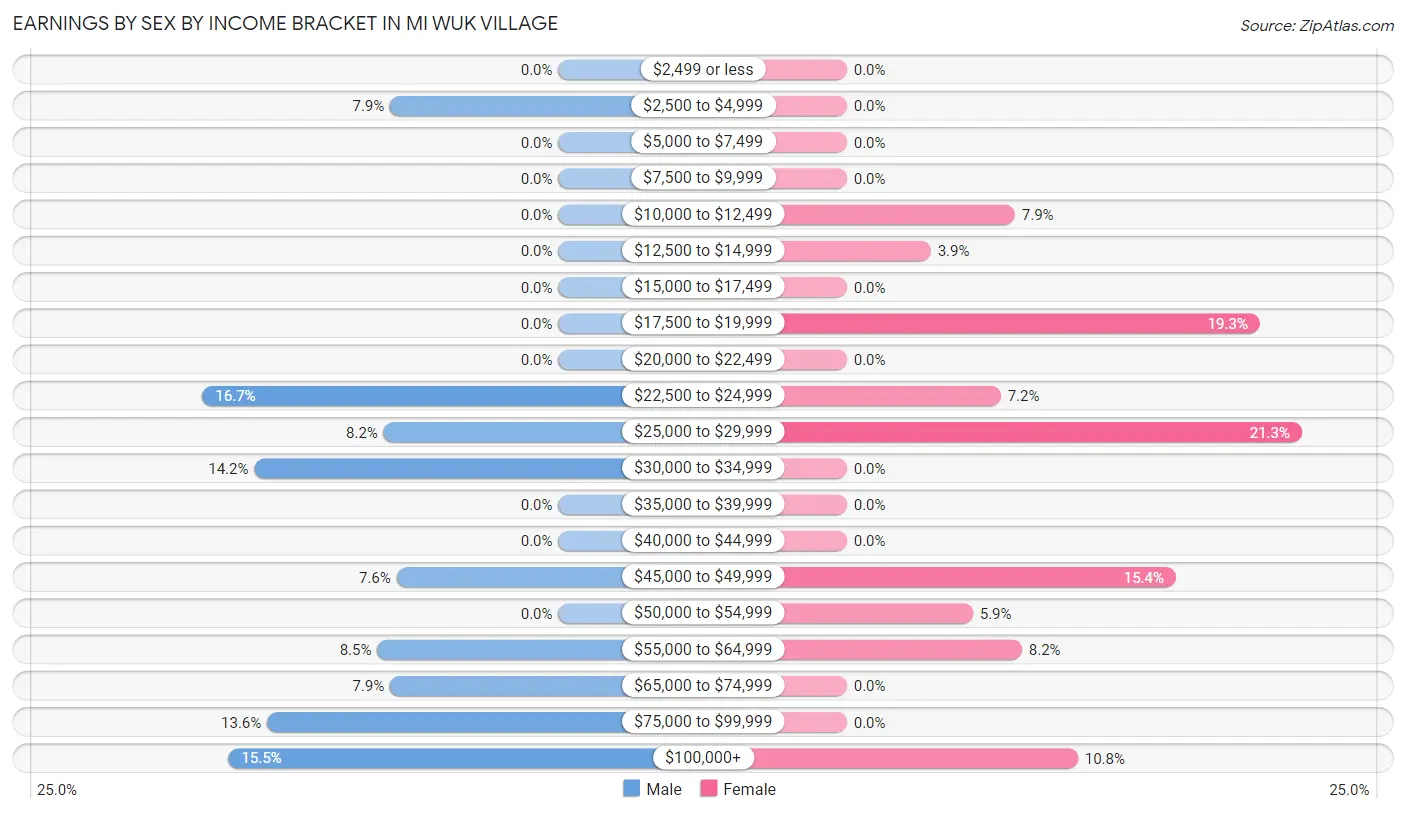
| Income | Male | Female |
| $2,499 or less | 0 (0.0%) | 0 (0.0%) |
| $2,500 to $4,999 | 26 (7.9%) | 0 (0.0%) |
| $5,000 to $7,499 | 0 (0.0%) | 0 (0.0%) |
| $7,500 to $9,999 | 0 (0.0%) | 0 (0.0%) |
| $10,000 to $12,499 | 0 (0.0%) | 24 (7.9%) |
| $12,500 to $14,999 | 0 (0.0%) | 12 (3.9%) |
| $15,000 to $17,499 | 0 (0.0%) | 0 (0.0%) |
| $17,500 to $19,999 | 0 (0.0%) | 59 (19.3%) |
| $20,000 to $22,499 | 0 (0.0%) | 0 (0.0%) |
| $22,500 to $24,999 | 55 (16.7%) | 22 (7.2%) |
| $25,000 to $29,999 | 27 (8.2%) | 65 (21.3%) |
| $30,000 to $34,999 | 47 (14.2%) | 0 (0.0%) |
| $35,000 to $39,999 | 0 (0.0%) | 0 (0.0%) |
| $40,000 to $44,999 | 0 (0.0%) | 0 (0.0%) |
| $45,000 to $49,999 | 25 (7.6%) | 47 (15.4%) |
| $50,000 to $54,999 | 0 (0.0%) | 18 (5.9%) |
| $55,000 to $64,999 | 28 (8.5%) | 25 (8.2%) |
| $65,000 to $74,999 | 26 (7.9%) | 0 (0.0%) |
| $75,000 to $99,999 | 45 (13.6%) | 0 (0.0%) |
| $100,000+ | 51 (15.4%) | 33 (10.8%) |
| Total | 330 (100.0%) | 305 (100.0%) |
Earnings by Sex by Educational Attainment in Mi Wuk Village
Average earnings in Mi Wuk Village are $48,500 for men and $27,831 for women, a difference of 42.6%. Men with an educational attainment of college or associate's degree enjoy the highest average annual earnings of $90,350, while those with high school diploma education earn the least with $48,650. Women with an educational attainment of college or associate's degree earn the most with the average annual earnings of $24,489, while those with college or associate's degree education have the smallest earnings of $24,489.
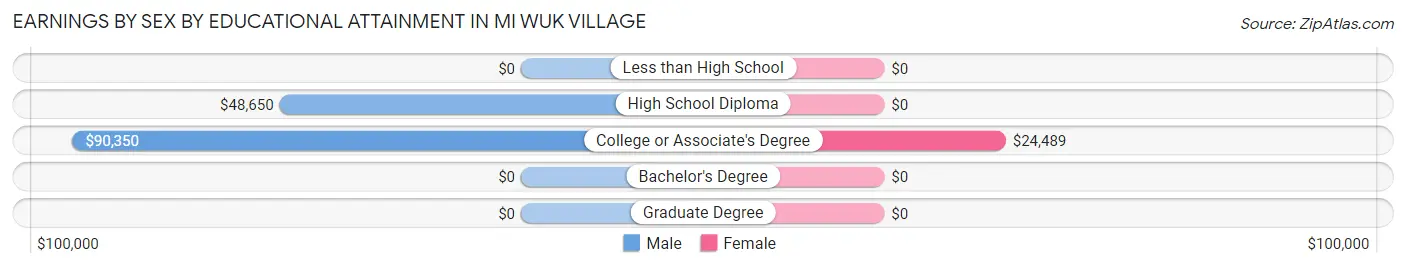
| Educational Attainment | Male Income | Female Income |
| Less than High School | - | - |
| High School Diploma | $48,650 | $0 |
| College or Associate's Degree | $90,350 | $24,489 |
| Bachelor's Degree | - | - |
| Graduate Degree | - | - |
| Total | $48,500 | $27,831 |
Family Income in Mi Wuk Village
Family Income Brackets in Mi Wuk Village
According to the Mi Wuk Village family income data, there are 73 families falling into the $150,000 to $199,999 income range, which is the most common income bracket and makes up 27.0% of all families.
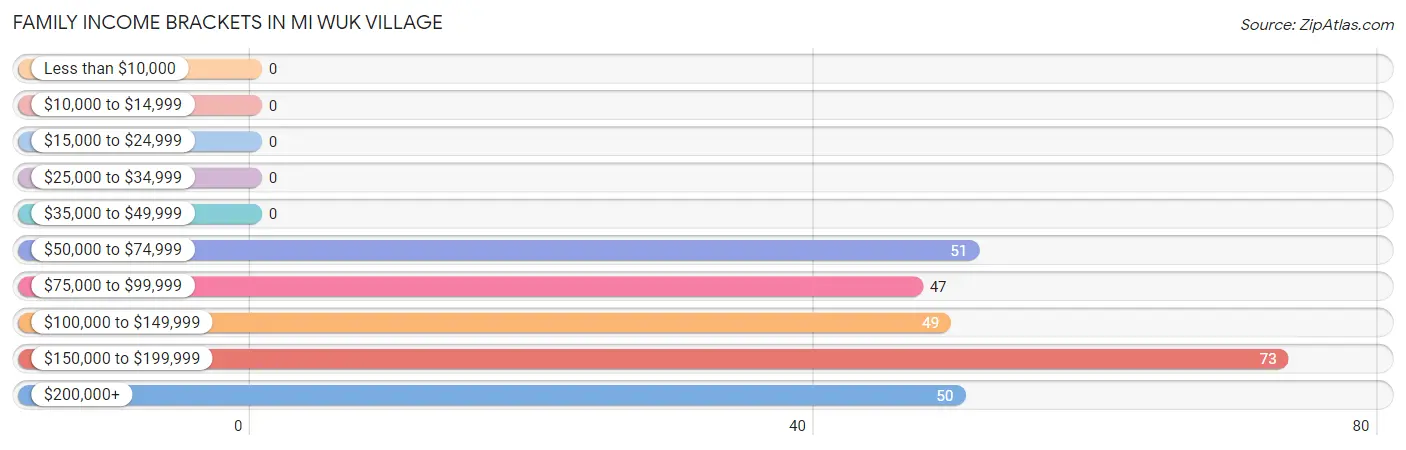
| Income Bracket | # Families | % Families |
| Less than $10,000 | 0 | 0.0% |
| $10,000 to $14,999 | 0 | 0.0% |
| $15,000 to $24,999 | 0 | 0.0% |
| $25,000 to $34,999 | 0 | 0.0% |
| $35,000 to $49,999 | 0 | 0.0% |
| $50,000 to $74,999 | 51 | 18.9% |
| $75,000 to $99,999 | 47 | 17.4% |
| $100,000 to $149,999 | 49 | 18.1% |
| $150,000 to $199,999 | 73 | 27.0% |
| $200,000+ | 50 | 18.5% |
Family Income by Famaliy Size in Mi Wuk Village
4-person families (96 | 35.6%) account for the highest median family income in Mi Wuk Village with $169,792 per family, while 2-person families (99 | 36.7%) have the highest median income of $72,625 per family member.
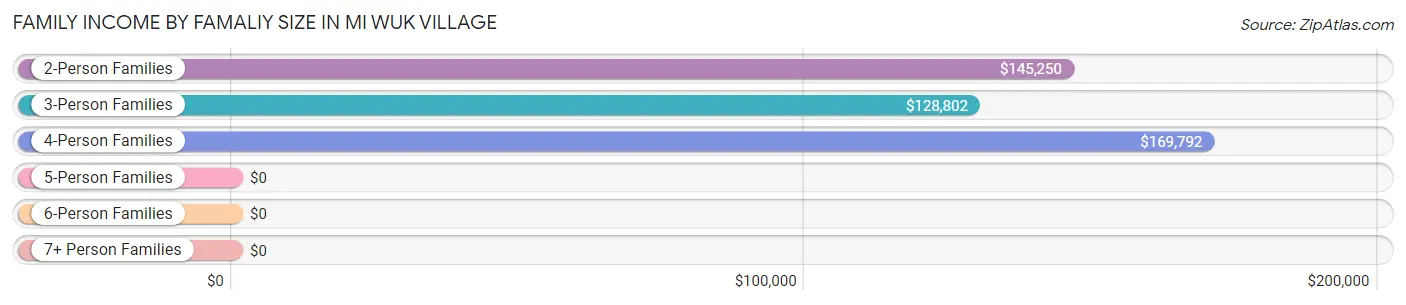
| Income Bracket | # Families | Median Income |
| 2-Person Families | 99 (36.7%) | $145,250 |
| 3-Person Families | 75 (27.8%) | $128,802 |
| 4-Person Families | 96 (35.6%) | $169,792 |
| 5-Person Families | 0 (0.0%) | $0 |
| 6-Person Families | 0 (0.0%) | $0 |
| 7+ Person Families | 0 (0.0%) | $0 |
| Total | 270 (100.0%) | $146,300 |
Family Income by Number of Earners in Mi Wuk Village
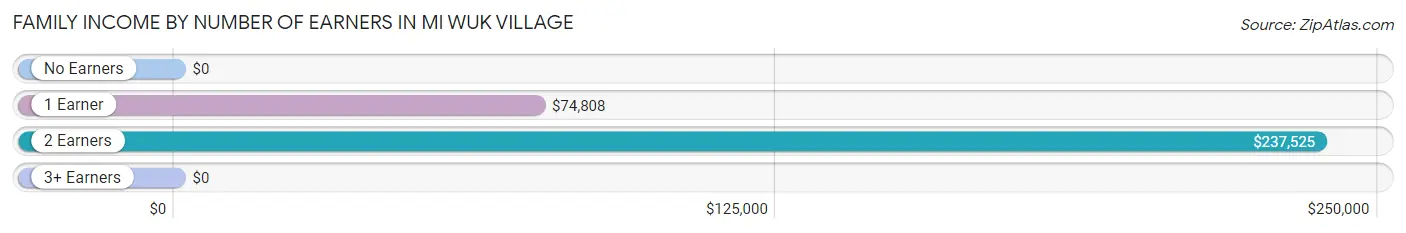
| Number of Earners | # Families | Median Income |
| No Earners | 27 (10.0%) | $0 |
| 1 Earner | 98 (36.3%) | $74,808 |
| 2 Earners | 99 (36.7%) | $237,525 |
| 3+ Earners | 46 (17.0%) | $0 |
| Total | 270 (100.0%) | $146,300 |
Household Income in Mi Wuk Village
Household Income Brackets in Mi Wuk Village
With 76 households falling in the category, the $100,000 to $149,999 income range is the most frequent in Mi Wuk Village, accounting for 18.5% of all households.
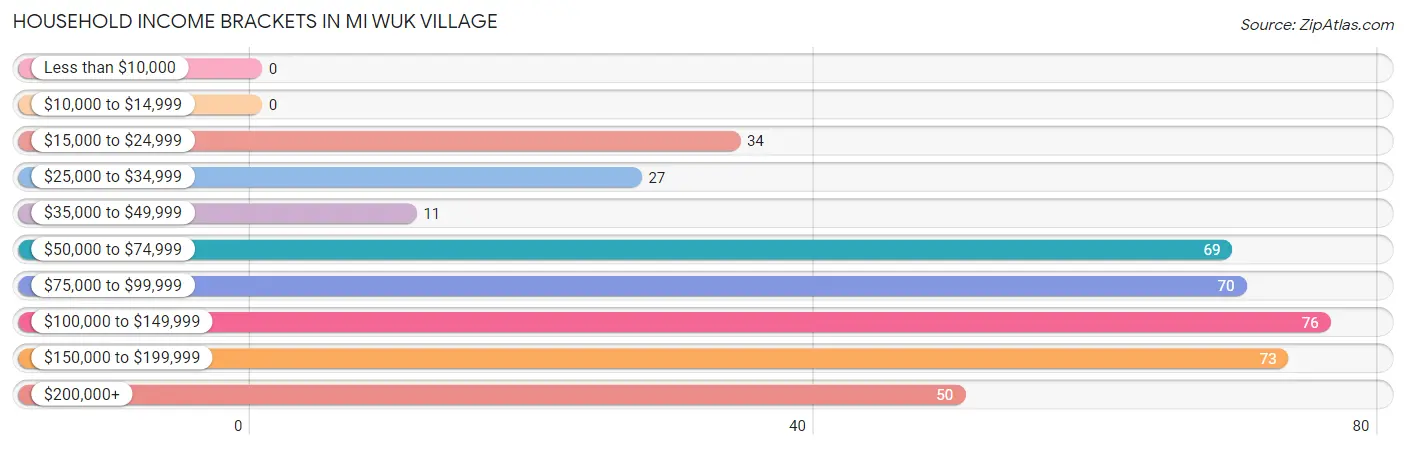
| Income Bracket | # Households | % Households |
| Less than $10,000 | 0 | 0.0% |
| $10,000 to $14,999 | 0 | 0.0% |
| $15,000 to $24,999 | 34 | 8.3% |
| $25,000 to $34,999 | 27 | 6.6% |
| $35,000 to $49,999 | 11 | 2.7% |
| $50,000 to $74,999 | 69 | 16.8% |
| $75,000 to $99,999 | 70 | 17.1% |
| $100,000 to $149,999 | 76 | 18.5% |
| $150,000 to $199,999 | 73 | 17.8% |
| $200,000+ | 50 | 12.2% |
Household Income by Householder Age in Mi Wuk Village
The median household income in Mi Wuk Village is $91,848, with the highest median household income of $106,620 found in the 45 to 64 years age bracket for the primary householder. A total of 161 households (39.3%) fall into this category.
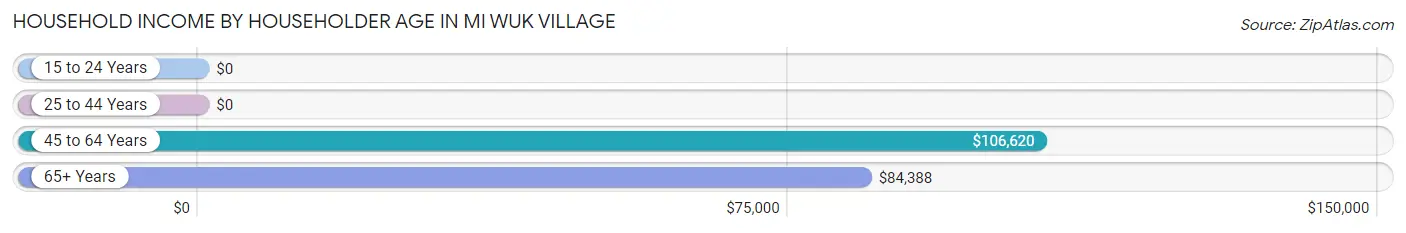
| Income Bracket | # Households | Median Income |
| 15 to 24 Years | 0 (0.0%) | $0 |
| 25 to 44 Years | 74 (18.0%) | $0 |
| 45 to 64 Years | 161 (39.3%) | $106,620 |
| 65+ Years | 175 (42.7%) | $84,388 |
| Total | 410 (100.0%) | $91,848 |
Poverty in Mi Wuk Village
Income Below Poverty by Sex and Age in Mi Wuk Village
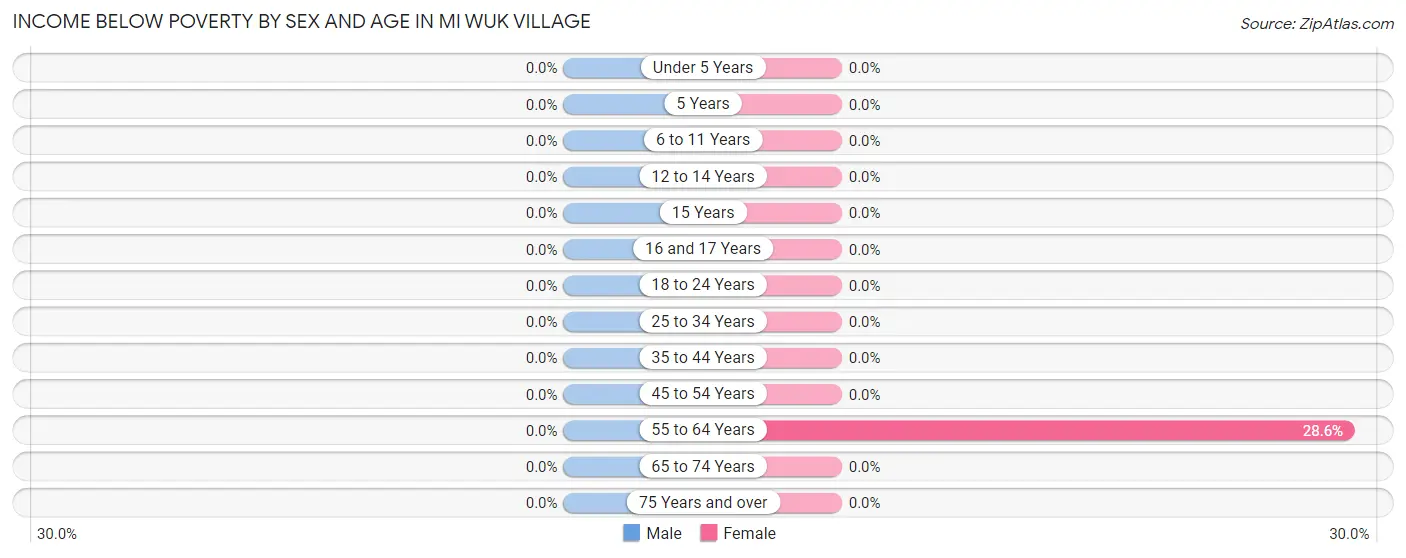
| Age Bracket | Male | Female |
| Under 5 Years | 0 (0.0%) | 0 (0.0%) |
| 5 Years | 0 (0.0%) | 0 (0.0%) |
| 6 to 11 Years | 0 (0.0%) | 0 (0.0%) |
| 12 to 14 Years | 0 (0.0%) | 0 (0.0%) |
| 15 Years | 0 (0.0%) | 0 (0.0%) |
| 16 and 17 Years | 0 (0.0%) | 0 (0.0%) |
| 18 to 24 Years | 0 (0.0%) | 0 (0.0%) |
| 25 to 34 Years | 0 (0.0%) | 0 (0.0%) |
| 35 to 44 Years | 0 (0.0%) | 0 (0.0%) |
| 45 to 54 Years | 0 (0.0%) | 0 (0.0%) |
| 55 to 64 Years | 0 (0.0%) | 24 (28.6%) |
| 65 to 74 Years | 0 (0.0%) | 0 (0.0%) |
| 75 Years and over | 0 (0.0%) | 0 (0.0%) |
| Total | 0 (0.0%) | 24 (4.7%) |
Income Above Poverty by Sex and Age in Mi Wuk Village
According to the poverty statistics in Mi Wuk Village, males aged under 5 years and females aged under 5 years are the age groups that are most secure financially, with 100.0% of males and 100.0% of females in these age groups living above the poverty line.
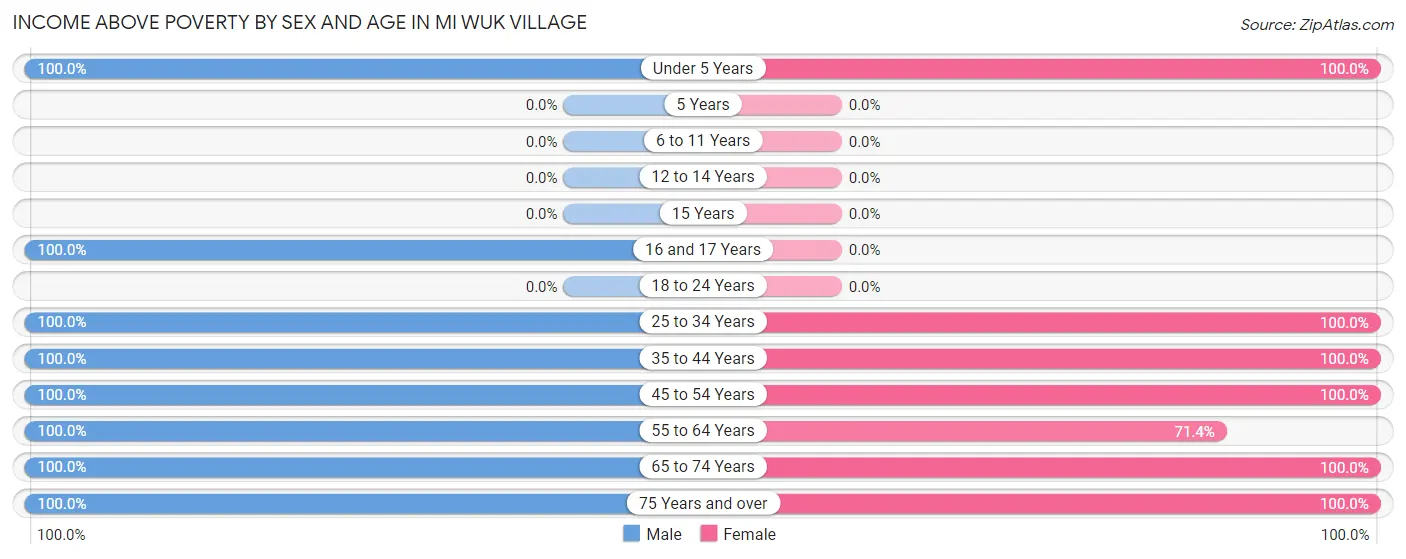
| Age Bracket | Male | Female |
| Under 5 Years | 22 (100.0%) | 85 (100.0%) |
| 5 Years | 0 (0.0%) | 0 (0.0%) |
| 6 to 11 Years | 0 (0.0%) | 0 (0.0%) |
| 12 to 14 Years | 0 (0.0%) | 0 (0.0%) |
| 15 Years | 0 (0.0%) | 0 (0.0%) |
| 16 and 17 Years | 35 (100.0%) | 0 (0.0%) |
| 18 to 24 Years | 0 (0.0%) | 0 (0.0%) |
| 25 to 34 Years | 84 (100.0%) | 86 (100.0%) |
| 35 to 44 Years | 48 (100.0%) | 67 (100.0%) |
| 45 to 54 Years | 52 (100.0%) | 61 (100.0%) |
| 55 to 64 Years | 97 (100.0%) | 60 (71.4%) |
| 65 to 74 Years | 142 (100.0%) | 74 (100.0%) |
| 75 Years and over | 23 (100.0%) | 50 (100.0%) |
| Total | 503 (100.0%) | 483 (95.3%) |
Income Below Poverty Among Married-Couple Families in Mi Wuk Village
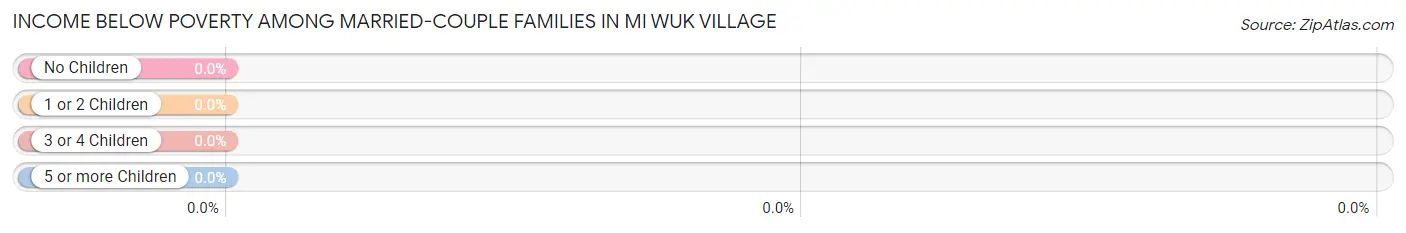
| Children | Above Poverty | Below Poverty |
| No Children | 170 (100.0%) | 0 (0.0%) |
| 1 or 2 Children | 100 (100.0%) | 0 (0.0%) |
| 3 or 4 Children | 0 (0.0%) | 0 (0.0%) |
| 5 or more Children | 0 (0.0%) | 0 (0.0%) |
| Total | 270 (100.0%) | 0 (0.0%) |
Income Below Poverty Among Single-Parent Households in Mi Wuk Village
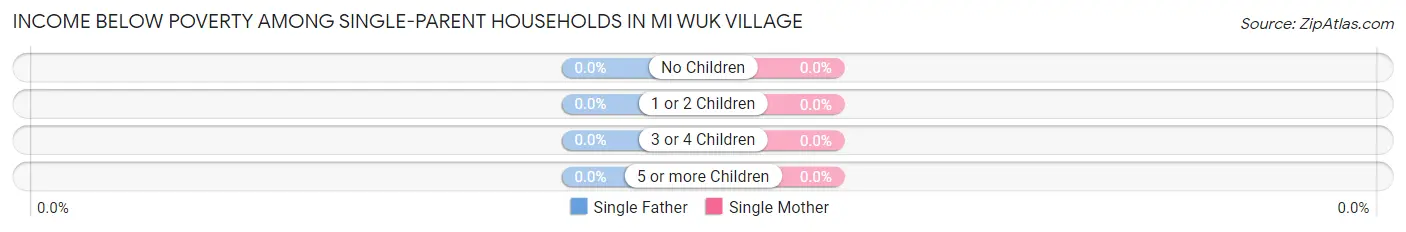
| Children | Single Father | Single Mother |
| No Children | 0 (0.0%) | 0 (0.0%) |
| 1 or 2 Children | 0 (0.0%) | 0 (0.0%) |
| 3 or 4 Children | 0 (0.0%) | 0 (0.0%) |
| 5 or more Children | 0 (0.0%) | 0 (0.0%) |
| Total | 0 (0.0%) | 0 (0.0%) |
Income Below Poverty Among Married-Couple vs Single-Parent Households in Mi Wuk Village
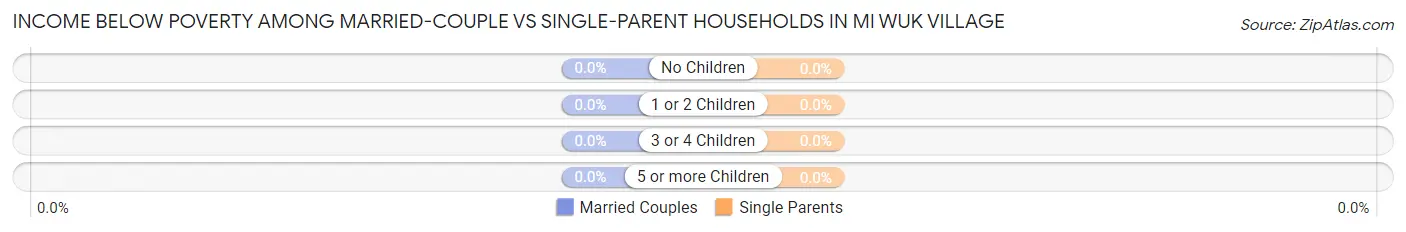
| Children | Married-Couple Families | Single-Parent Households |
| No Children | 0 (0.0%) | 0 (0.0%) |
| 1 or 2 Children | 0 (0.0%) | 0 (0.0%) |
| 3 or 4 Children | 0 (0.0%) | 0 (0.0%) |
| 5 or more Children | 0 (0.0%) | 0 (0.0%) |
| Total | 0 (0.0%) | 0 (0.0%) |
Race in Mi Wuk Village
The most populous races in Mi Wuk Village are White / Caucasian (992 | 98.2%), Hispanic or Latino (31 | 3.1%), and Asian (18 | 1.8%).
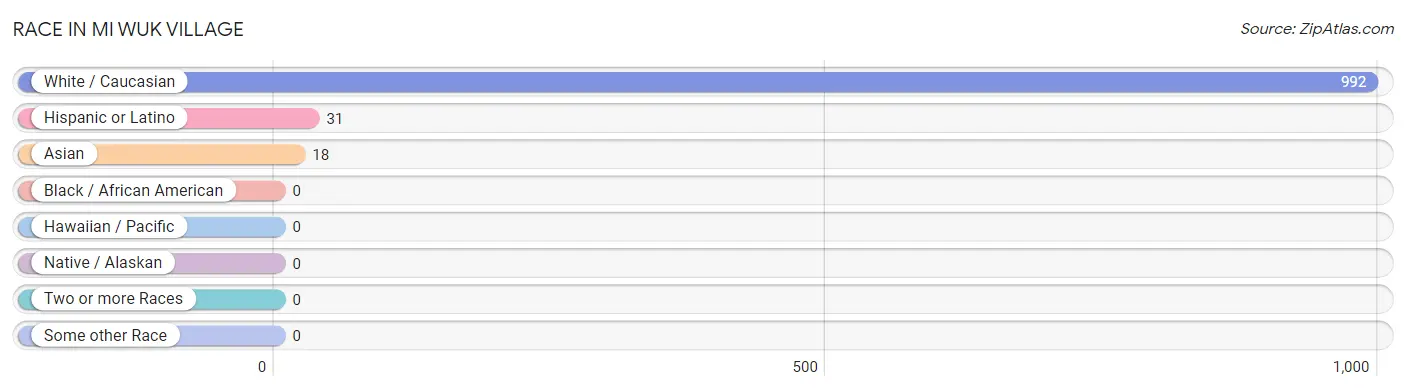
| Race | # Population | % Population |
| Asian | 18 | 1.8% |
| Black / African American | 0 | 0.0% |
| Hawaiian / Pacific | 0 | 0.0% |
| Hispanic or Latino | 31 | 3.1% |
| Native / Alaskan | 0 | 0.0% |
| White / Caucasian | 992 | 98.2% |
| Two or more Races | 0 | 0.0% |
| Some other Race | 0 | 0.0% |
| Total | 1,010 | 100.0% |
Ancestry in Mi Wuk Village
The most populous ancestries reported in Mi Wuk Village are German (348 | 34.5%), Norwegian (138 | 13.7%), Irish (129 | 12.8%), English (128 | 12.7%), and Italian (91 | 9.0%), together accounting for 82.6% of all Mi Wuk Village residents.
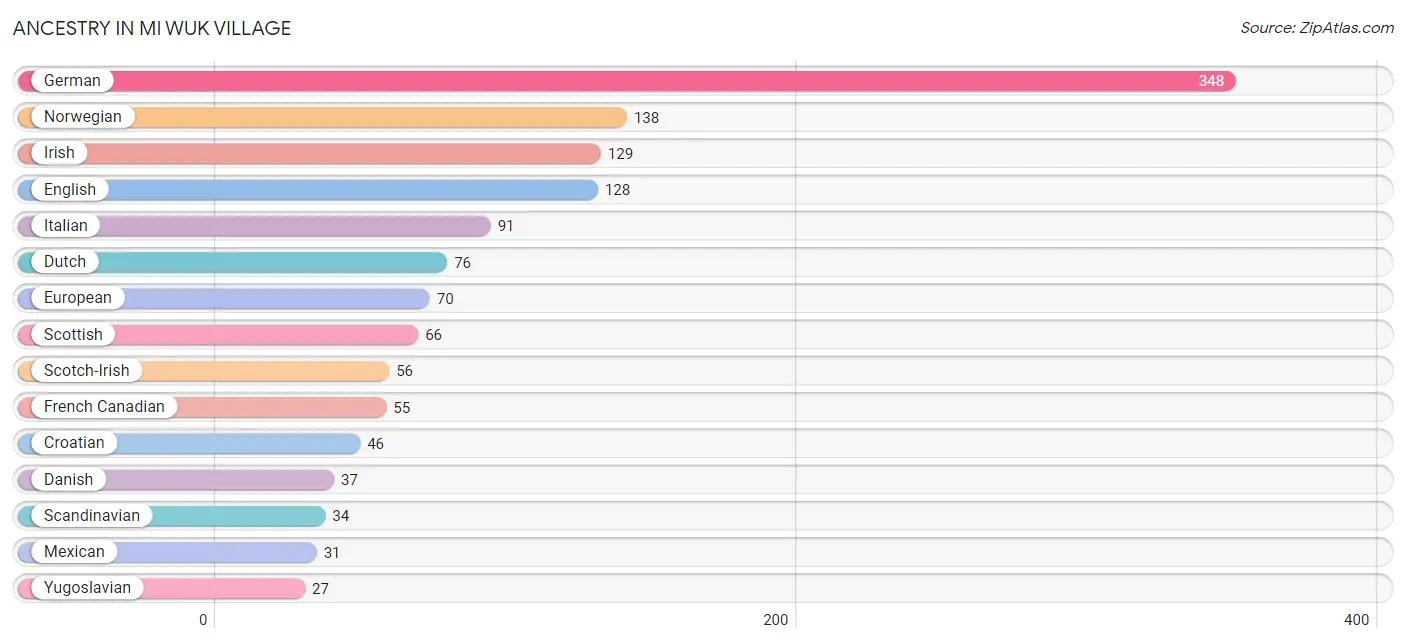
| Ancestry | # Population | % Population |
| Basque | 9 | 0.9% |
| Croatian | 46 | 4.5% |
| Danish | 37 | 3.7% |
| Dutch | 76 | 7.5% |
| English | 128 | 12.7% |
| European | 70 | 6.9% |
| Finnish | 24 | 2.4% |
| French | 16 | 1.6% |
| French Canadian | 55 | 5.4% |
| German | 348 | 34.5% |
| Irish | 129 | 12.8% |
| Italian | 91 | 9.0% |
| Korean | 18 | 1.8% |
| Mexican | 31 | 3.1% |
| Norwegian | 138 | 13.7% |
| Scandinavian | 34 | 3.4% |
| Scotch-Irish | 56 | 5.5% |
| Scottish | 66 | 6.5% |
| Yugoslavian | 27 | 2.7% | View All 19 Rows |
Immigrants in Mi Wuk Village
The most numerous immigrant groups reported in Mi Wuk Village came from Asia (18 | 1.8%), Philippines (18 | 1.8%), and South Eastern Asia (18 | 1.8%), together accounting for 5.3% of all Mi Wuk Village residents.
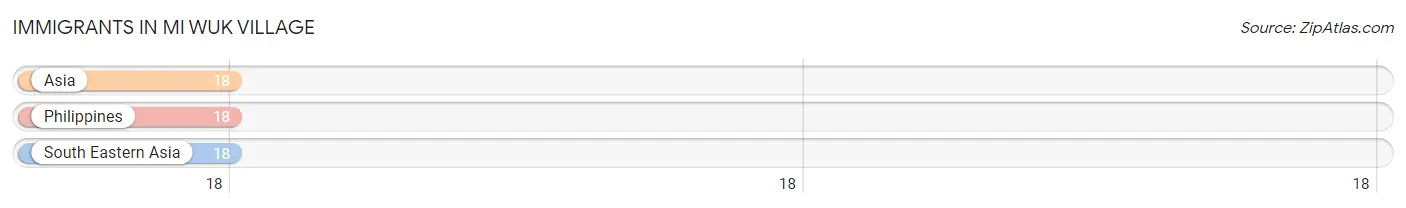
| Immigration Origin | # Population | % Population |
| Asia | 18 | 1.8% |
| Philippines | 18 | 1.8% |
| South Eastern Asia | 18 | 1.8% | View All 3 Rows |
Sex and Age in Mi Wuk Village
Sex and Age in Mi Wuk Village
The most populous age groups in Mi Wuk Village are 65 to 69 Years (92 | 18.3%) for men and Under 5 Years (85 | 16.8%) for women.
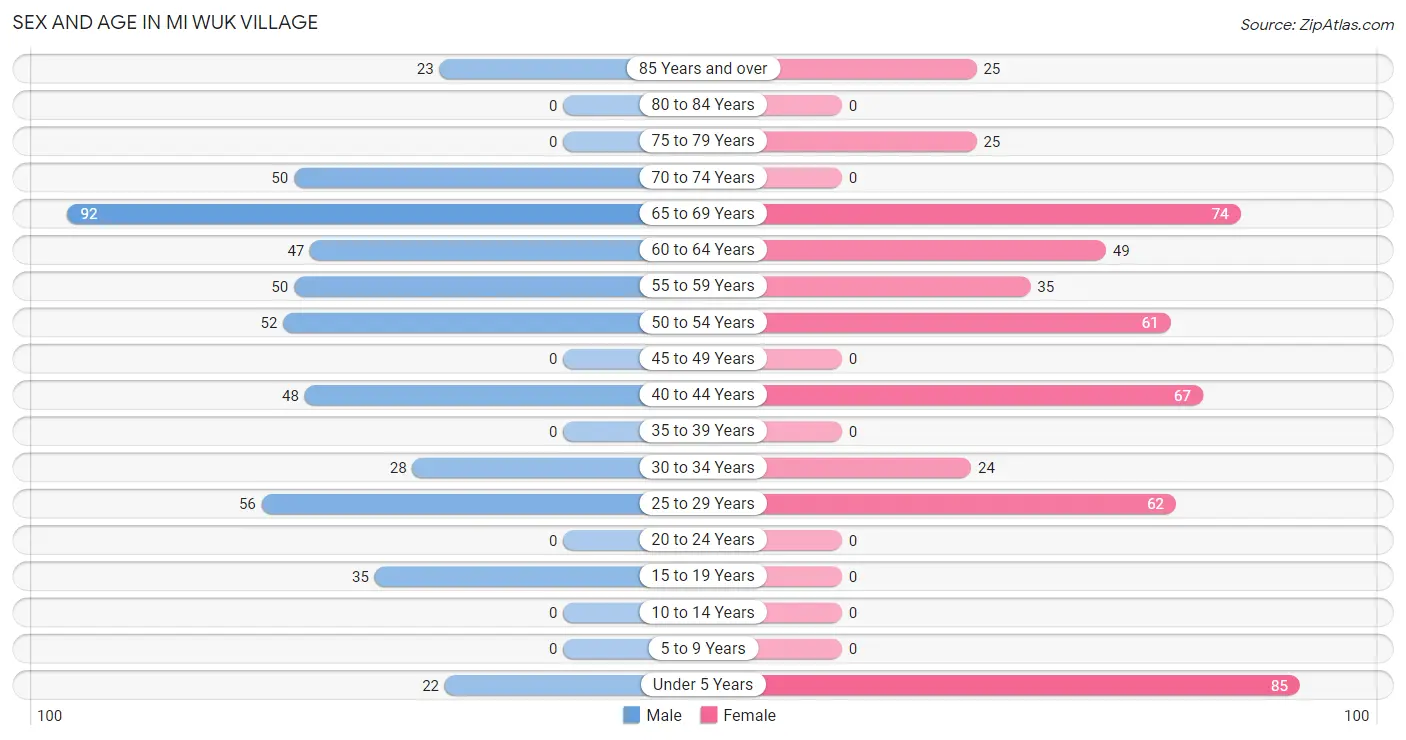
| Age Bracket | Male | Female |
| Under 5 Years | 22 (4.4%) | 85 (16.8%) |
| 5 to 9 Years | 0 (0.0%) | 0 (0.0%) |
| 10 to 14 Years | 0 (0.0%) | 0 (0.0%) |
| 15 to 19 Years | 35 (7.0%) | 0 (0.0%) |
| 20 to 24 Years | 0 (0.0%) | 0 (0.0%) |
| 25 to 29 Years | 56 (11.1%) | 62 (12.2%) |
| 30 to 34 Years | 28 (5.6%) | 24 (4.7%) |
| 35 to 39 Years | 0 (0.0%) | 0 (0.0%) |
| 40 to 44 Years | 48 (9.5%) | 67 (13.2%) |
| 45 to 49 Years | 0 (0.0%) | 0 (0.0%) |
| 50 to 54 Years | 52 (10.3%) | 61 (12.0%) |
| 55 to 59 Years | 50 (9.9%) | 35 (6.9%) |
| 60 to 64 Years | 47 (9.3%) | 49 (9.7%) |
| 65 to 69 Years | 92 (18.3%) | 74 (14.6%) |
| 70 to 74 Years | 50 (9.9%) | 0 (0.0%) |
| 75 to 79 Years | 0 (0.0%) | 25 (4.9%) |
| 80 to 84 Years | 0 (0.0%) | 0 (0.0%) |
| 85 Years and over | 23 (4.6%) | 25 (4.9%) |
| Total | 503 (100.0%) | 507 (100.0%) |
Families and Households in Mi Wuk Village
Median Family Size in Mi Wuk Village
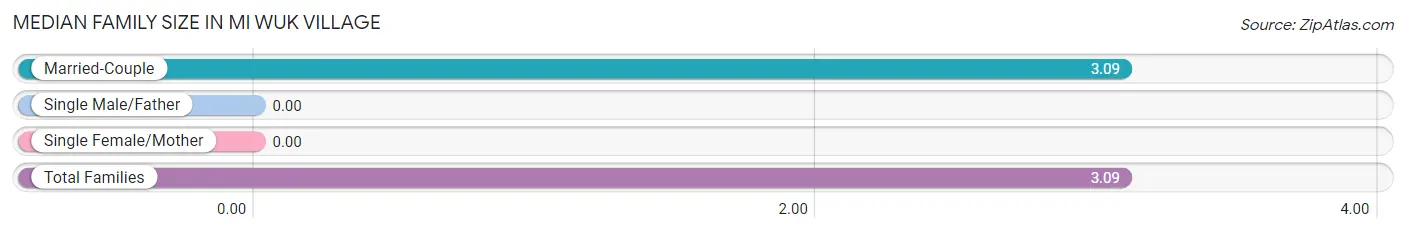
| Family Type | # Families | Family Size |
| Married-Couple | 270 (100.0%) | 3.09 |
| Single Male/Father | 0 (0.0%) | - |
| Single Female/Mother | 0 (0.0%) | - |
| Total Families | 270 (100.0%) | 3.09 |
Median Household Size in Mi Wuk Village
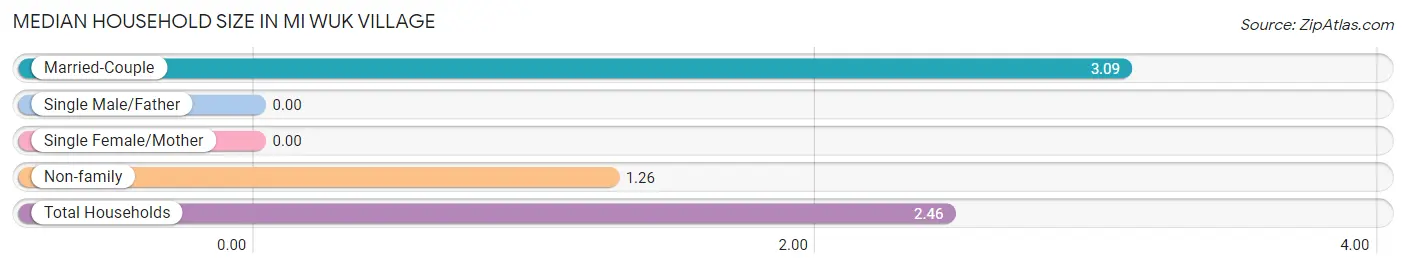
| Household Type | # Households | Household Size |
| Married-Couple | 270 (65.8%) | 3.09 |
| Single Male/Father | 0 (0.0%) | - |
| Single Female/Mother | 0 (0.0%) | - |
| Non-family | 140 (34.2%) | 1.26 |
| Total Households | 410 (100.0%) | 2.46 |
Household Size by Marriage Status in Mi Wuk Village
Out of a total of 410 households in Mi Wuk Village, 270 (65.8%) are family households, while 140 (34.2%) are nonfamily households. The most numerous type of family households are 2-person households, comprising 99, and the most common type of nonfamily households are 1-person households, comprising 106.
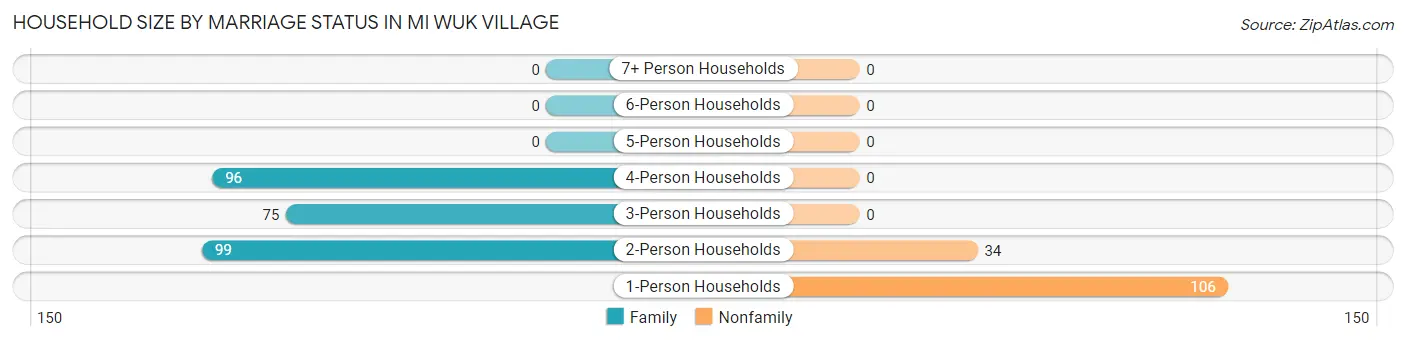
| Household Size | Family Households | Nonfamily Households |
| 1-Person Households | - | 106 (25.9%) |
| 2-Person Households | 99 (24.1%) | 34 (8.3%) |
| 3-Person Households | 75 (18.3%) | 0 (0.0%) |
| 4-Person Households | 96 (23.4%) | 0 (0.0%) |
| 5-Person Households | 0 (0.0%) | 0 (0.0%) |
| 6-Person Households | 0 (0.0%) | 0 (0.0%) |
| 7+ Person Households | 0 (0.0%) | 0 (0.0%) |
| Total | 270 (65.8%) | 140 (34.2%) |
Female Fertility in Mi Wuk Village
Fertility by Age in Mi Wuk Village
| Age Bracket | Women with Births | Births / 1,000 Women |
| 15 to 19 years | 0 (0.0%) | 0.0 |
| 20 to 34 years | 0 (0.0%) | 0.0 |
| 35 to 50 years | 0 (0.0%) | 0.0 |
| Total | 0 (0.0%) | 0.0 |
Fertility by Age by Marriage Status in Mi Wuk Village
| Age Bracket | Married | Unmarried |
| 15 to 19 years | 0 (0.0%) | 0 (0.0%) |
| 20 to 34 years | 0 (0.0%) | 0 (0.0%) |
| 35 to 50 years | 0 (0.0%) | 0 (0.0%) |
| Total | 0 (0.0%) | 0 (0.0%) |
Fertility by Education in Mi Wuk Village
| Educational Attainment | Women with Births | Births / 1,000 Women |
| Less than High School | 0 (0.0%) | 0.0 |
| High School Diploma | 0 (0.0%) | 0.0 |
| College or Associate's Degree | 0 (0.0%) | 0.0 |
| Bachelor's Degree | 0 (0.0%) | 0.0 |
| Graduate Degree | 0 (0.0%) | 0.0 |
| Total | 0 (0.0%) | 0.0 |
Fertility by Education by Marriage Status in Mi Wuk Village
| Educational Attainment | Married | Unmarried |
| Less than High School | 0 (0.0%) | 0 (0.0%) |
| High School Diploma | 0 (0.0%) | 0 (0.0%) |
| College or Associate's Degree | 0 (0.0%) | 0 (0.0%) |
| Bachelor's Degree | 0 (0.0%) | 0 (0.0%) |
| Graduate Degree | 0 (0.0%) | 0 (0.0%) |
| Total | 0 (0.0%) | 0 (0.0%) |
Employment Characteristics in Mi Wuk Village
Employment by Class of Employer in Mi Wuk Village
Among the 414 employed individuals in Mi Wuk Village, private company employees (166 | 40.1%), self-employed (incorporated) (78 | 18.8%), and state government employees (64 | 15.5%) make up the most common classes of employment.
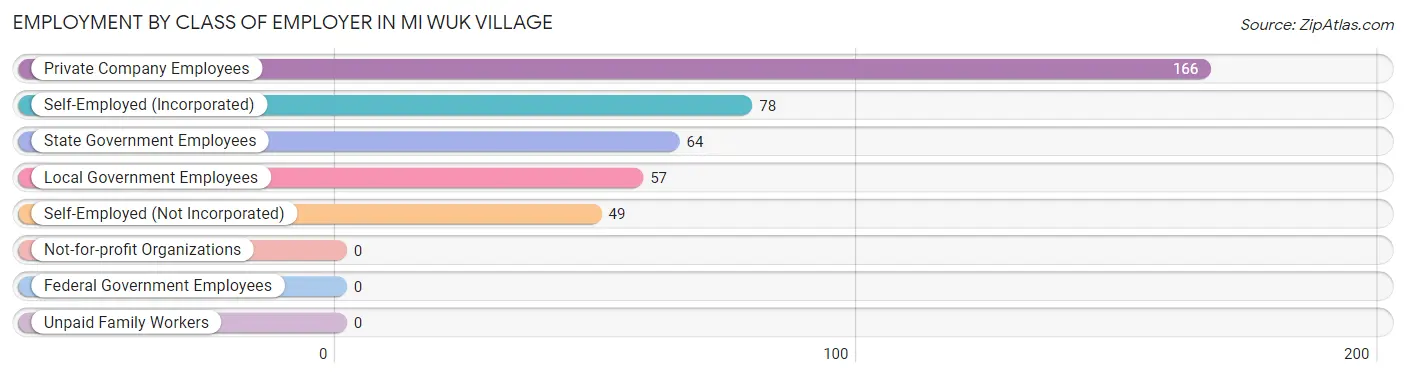
| Employer Class | # Employees | % Employees |
| Private Company Employees | 166 | 40.1% |
| Self-Employed (Incorporated) | 78 | 18.8% |
| Self-Employed (Not Incorporated) | 49 | 11.8% |
| Not-for-profit Organizations | 0 | 0.0% |
| Local Government Employees | 57 | 13.8% |
| State Government Employees | 64 | 15.5% |
| Federal Government Employees | 0 | 0.0% |
| Unpaid Family Workers | 0 | 0.0% |
| Total | 414 | 100.0% |
Employment Status by Age in Mi Wuk Village
According to the labor force statistics for Mi Wuk Village, out of the total population over 16 years of age (903), 57.0% or 515 individuals are in the labor force, with 13.6% or 70 of them unemployed. The age group with the highest labor force participation rate is 30 to 34 years, with 100.0% or 52 individuals in the labor force. Within the labor force, the 60 to 64 years age range has the highest percentage of unemployed individuals, with 51.7% or 45 of them being unemployed.
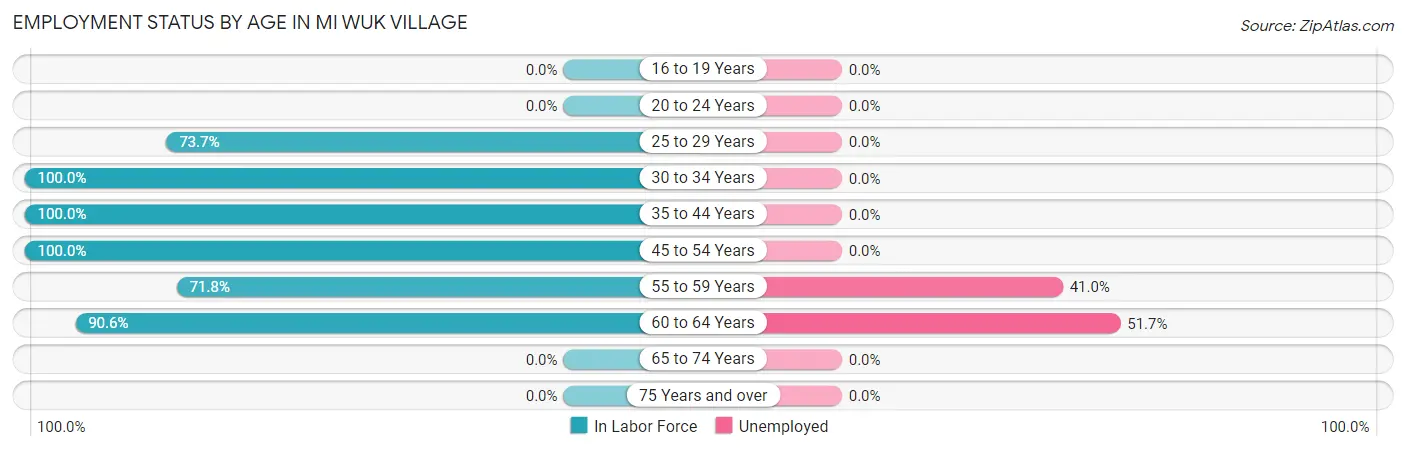
| Age Bracket | In Labor Force | Unemployed |
| 16 to 19 Years | 0 (0.0%) | 0 (0.0%) |
| 20 to 24 Years | 0 (0.0%) | 0 (0.0%) |
| 25 to 29 Years | 87 (73.7%) | 0 (0.0%) |
| 30 to 34 Years | 52 (100.0%) | 0 (0.0%) |
| 35 to 44 Years | 115 (100.0%) | 0 (0.0%) |
| 45 to 54 Years | 113 (100.0%) | 0 (0.0%) |
| 55 to 59 Years | 61 (71.8%) | 25 (41.0%) |
| 60 to 64 Years | 87 (90.6%) | 45 (51.7%) |
| 65 to 74 Years | 0 (0.0%) | 0 (0.0%) |
| 75 Years and over | 0 (0.0%) | 0 (0.0%) |
| Total | 515 (57.0%) | 70 (13.6%) |
Employment Status by Educational Attainment in Mi Wuk Village
According to labor force statistics for Mi Wuk Village, 88.9% of individuals (515) out of the total population between 25 and 64 years of age (579) are in the labor force, with 13.6% or 70 of them being unemployed. The group with the highest labor force participation rate are those with the educational attainment of less than high school, with 100.0% or 27 individuals in the labor force. Within the labor force, individuals with less than high school education have the highest percentage of unemployment, with 100.0% or 27 of them being unemployed.
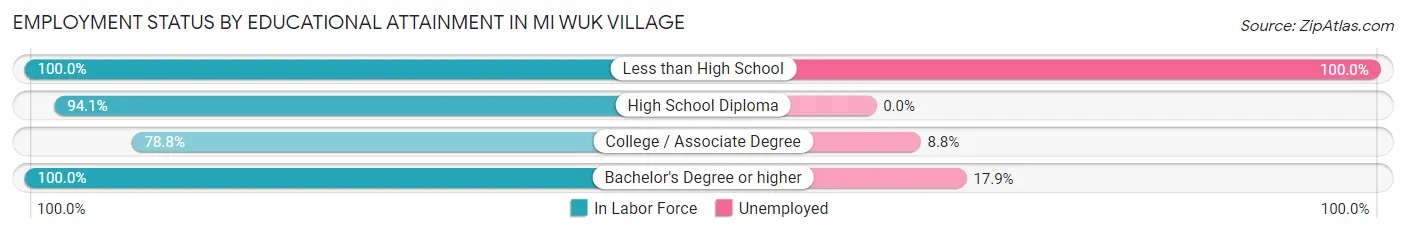
| Educational Attainment | In Labor Force | Unemployed |
| Less than High School | 27 (100.0%) | 27 (100.0%) |
| High School Diploma | 143 (94.1%) | 0 (0.0%) |
| College / Associate Degree | 205 (78.8%) | 23 (8.8%) |
| Bachelor's Degree or higher | 140 (100.0%) | 25 (17.9%) |
| Total | 515 (88.9%) | 79 (13.6%) |
Employment Occupations by Sex in Mi Wuk Village
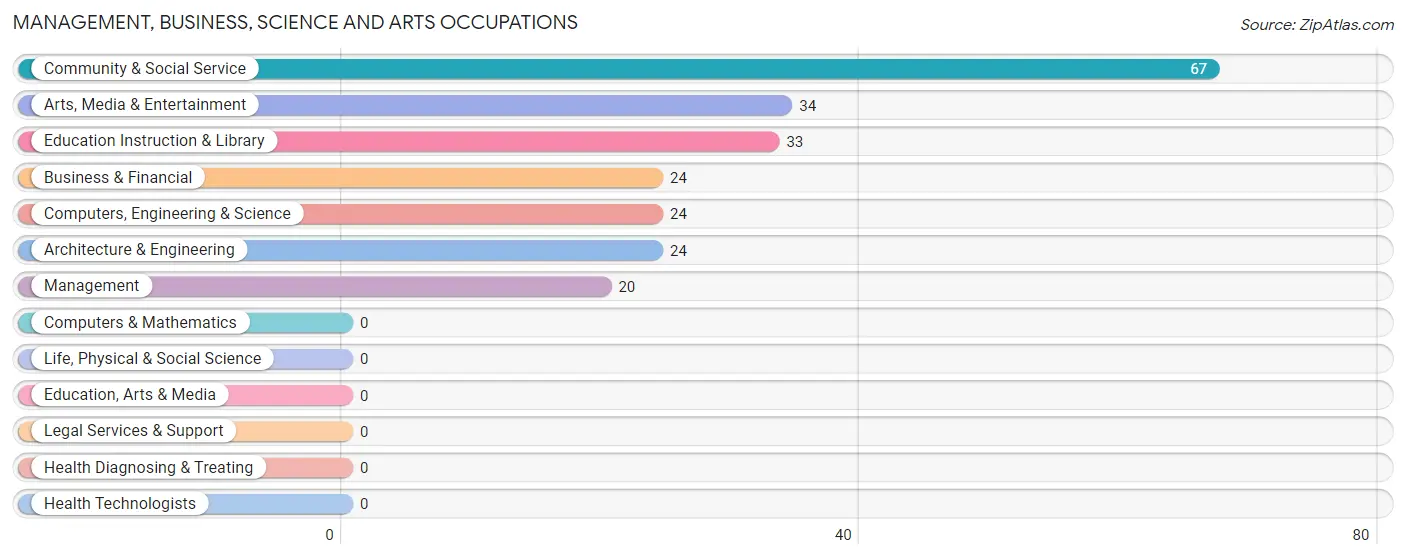
Management, Business, Science and Arts Occupations
The most common Management, Business, Science and Arts occupations in Mi Wuk Village are Community & Social Service (67 | 15.1%), Arts, Media & Entertainment (34 | 7.6%), Education Instruction & Library (33 | 7.4%), Business & Financial (24 | 5.4%), and Computers, Engineering & Science (24 | 5.4%).
Management, Business, Science and Arts Occupations by Sex
Within the Management, Business, Science and Arts occupations in Mi Wuk Village, the most male-oriented occupations are Management (100.0%), Business & Financial (100.0%), and Computers, Engineering & Science (100.0%), while the most female-oriented occupations are Community & Social Service (100.0%), Education Instruction & Library (100.0%), and Arts, Media & Entertainment (100.0%).
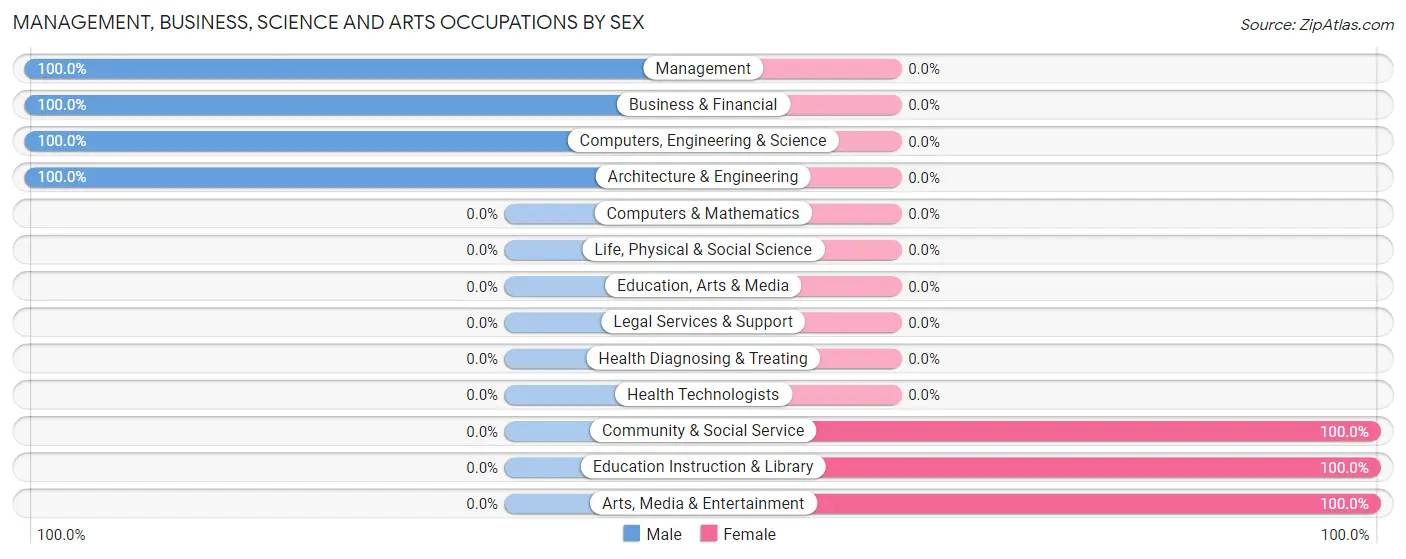
| Occupation | Male | Female |
| Management | 20 (100.0%) | 0 (0.0%) |
| Business & Financial | 24 (100.0%) | 0 (0.0%) |
| Computers, Engineering & Science | 24 (100.0%) | 0 (0.0%) |
| Computers & Mathematics | 0 (0.0%) | 0 (0.0%) |
| Architecture & Engineering | 24 (100.0%) | 0 (0.0%) |
| Life, Physical & Social Science | 0 (0.0%) | 0 (0.0%) |
| Community & Social Service | 0 (0.0%) | 67 (100.0%) |
| Education, Arts & Media | 0 (0.0%) | 0 (0.0%) |
| Legal Services & Support | 0 (0.0%) | 0 (0.0%) |
| Education Instruction & Library | 0 (0.0%) | 33 (100.0%) |
| Arts, Media & Entertainment | 0 (0.0%) | 34 (100.0%) |
| Health Diagnosing & Treating | 0 (0.0%) | 0 (0.0%) |
| Health Technologists | 0 (0.0%) | 0 (0.0%) |
| Total (Category) | 68 (50.4%) | 67 (49.6%) |
| Total (Overall) | 229 (51.5%) | 216 (48.5%) |
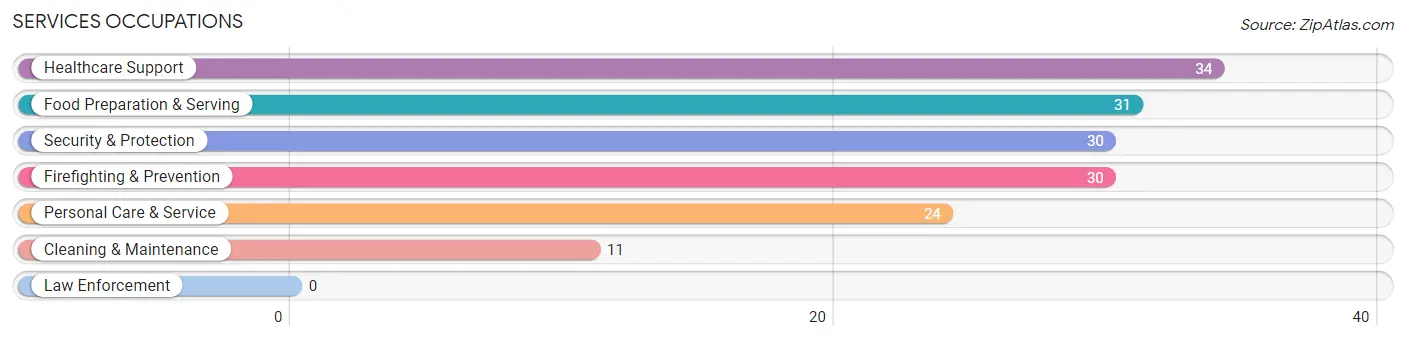
Services Occupations
The most common Services occupations in Mi Wuk Village are Healthcare Support (34 | 7.6%), Food Preparation & Serving (31 | 7.0%), Security & Protection (30 | 6.7%), Firefighting & Prevention (30 | 6.7%), and Personal Care & Service (24 | 5.4%).
Services Occupations by Sex
Within the Services occupations in Mi Wuk Village, the most male-oriented occupations are Security & Protection (100.0%), and Firefighting & Prevention (100.0%), while the most female-oriented occupations are Healthcare Support (100.0%), Food Preparation & Serving (100.0%), and Cleaning & Maintenance (100.0%).
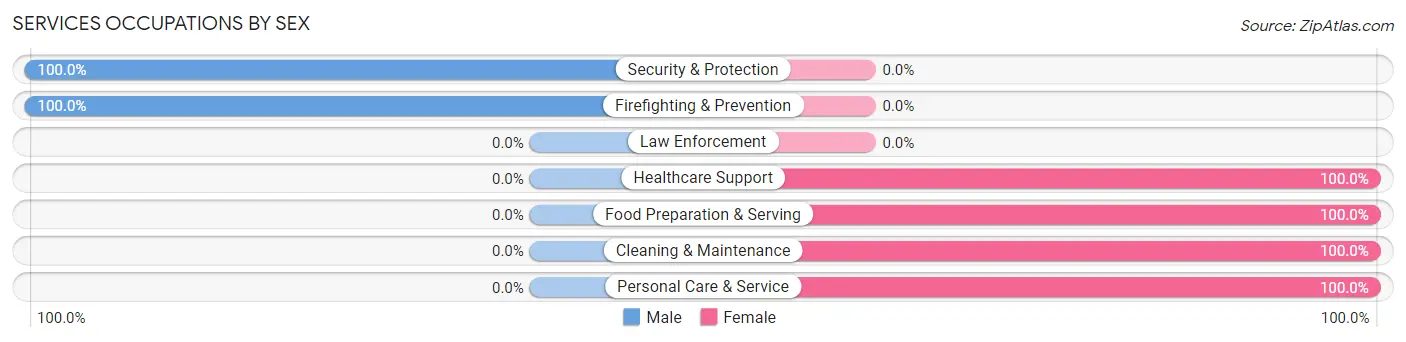
| Occupation | Male | Female |
| Healthcare Support | 0 (0.0%) | 34 (100.0%) |
| Security & Protection | 30 (100.0%) | 0 (0.0%) |
| Firefighting & Prevention | 30 (100.0%) | 0 (0.0%) |
| Law Enforcement | 0 (0.0%) | 0 (0.0%) |
| Food Preparation & Serving | 0 (0.0%) | 31 (100.0%) |
| Cleaning & Maintenance | 0 (0.0%) | 11 (100.0%) |
| Personal Care & Service | 0 (0.0%) | 24 (100.0%) |
| Total (Category) | 30 (23.1%) | 100 (76.9%) |
| Total (Overall) | 229 (51.5%) | 216 (48.5%) |
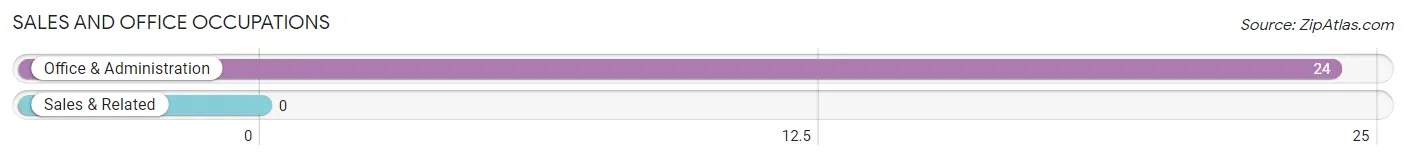
Sales and Office Occupations
The most common Sales and Office occupations in Mi Wuk Village are , and Office & Administration (24 | 5.4%).
Sales and Office Occupations by Sex
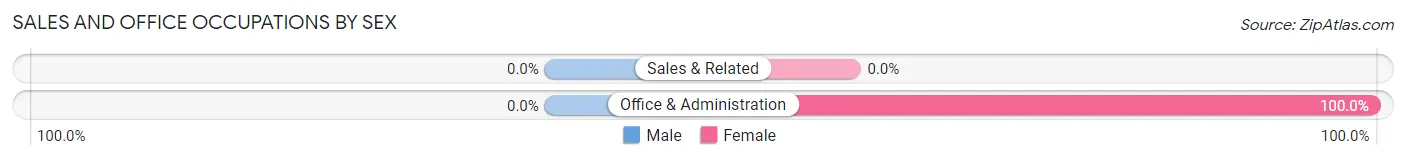
| Occupation | Male | Female |
| Sales & Related | 0 (0.0%) | 0 (0.0%) |
| Office & Administration | 0 (0.0%) | 24 (100.0%) |
| Total (Category) | 0 (0.0%) | 24 (100.0%) |
| Total (Overall) | 229 (51.5%) | 216 (48.5%) |
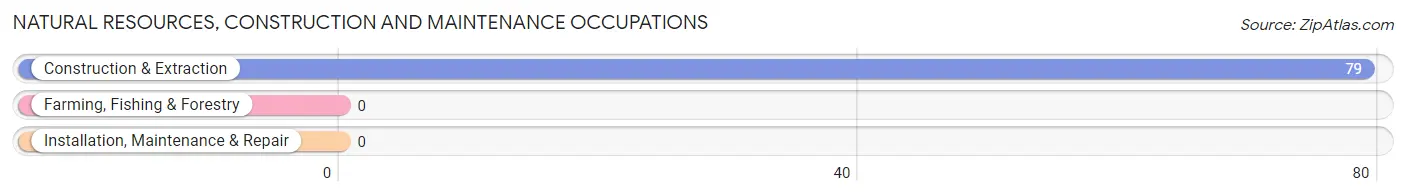
Natural Resources, Construction and Maintenance Occupations
The most common Natural Resources, Construction and Maintenance occupations in Mi Wuk Village are , and Construction & Extraction (79 | 17.7%).
Natural Resources, Construction and Maintenance Occupations by Sex
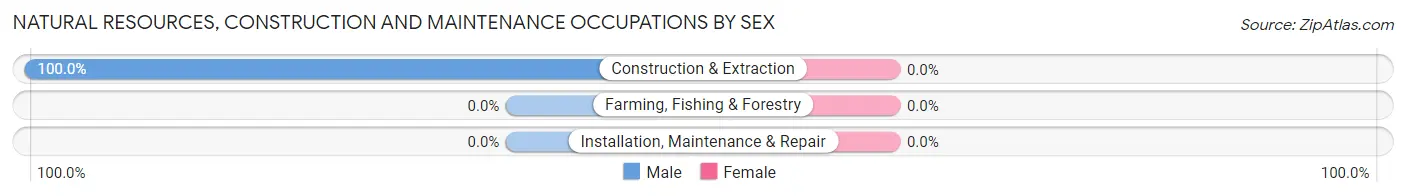
| Occupation | Male | Female |
| Farming, Fishing & Forestry | 0 (0.0%) | 0 (0.0%) |
| Construction & Extraction | 79 (100.0%) | 0 (0.0%) |
| Installation, Maintenance & Repair | 0 (0.0%) | 0 (0.0%) |
| Total (Category) | 79 (100.0%) | 0 (0.0%) |
| Total (Overall) | 229 (51.5%) | 216 (48.5%) |
Production, Transportation and Moving Occupations
The most common Production, Transportation and Moving occupations in Mi Wuk Village are Production (52 | 11.7%), and Transportation (25 | 5.6%).
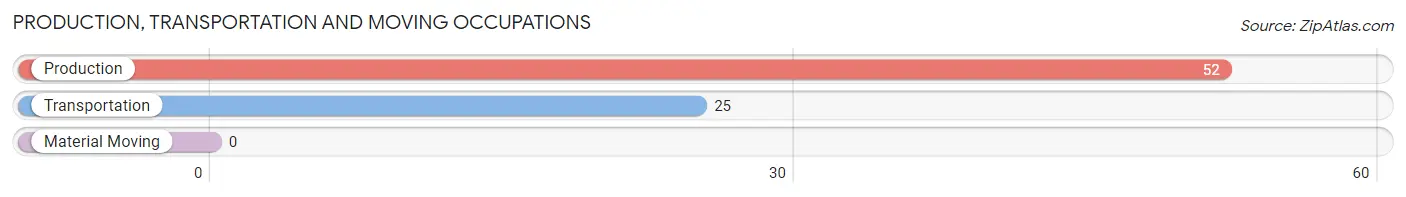
Production, Transportation and Moving Occupations by Sex
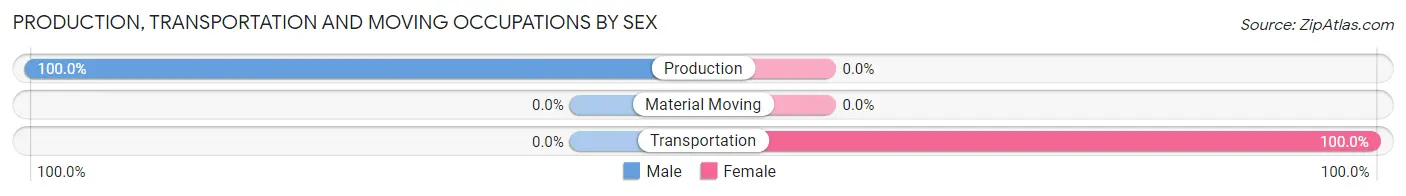
| Occupation | Male | Female |
| Production | 52 (100.0%) | 0 (0.0%) |
| Transportation | 0 (0.0%) | 25 (100.0%) |
| Material Moving | 0 (0.0%) | 0 (0.0%) |
| Total (Category) | 52 (67.5%) | 25 (32.5%) |
| Total (Overall) | 229 (51.5%) | 216 (48.5%) |
Employment Industries by Sex in Mi Wuk Village
Employment Industries in Mi Wuk Village
The major employment industries in Mi Wuk Village include Construction (79 | 17.7%), Public Administration (64 | 14.4%), Professional & Scientific (58 | 13.0%), Educational Services (57 | 12.8%), and Utilities (49 | 11.0%).
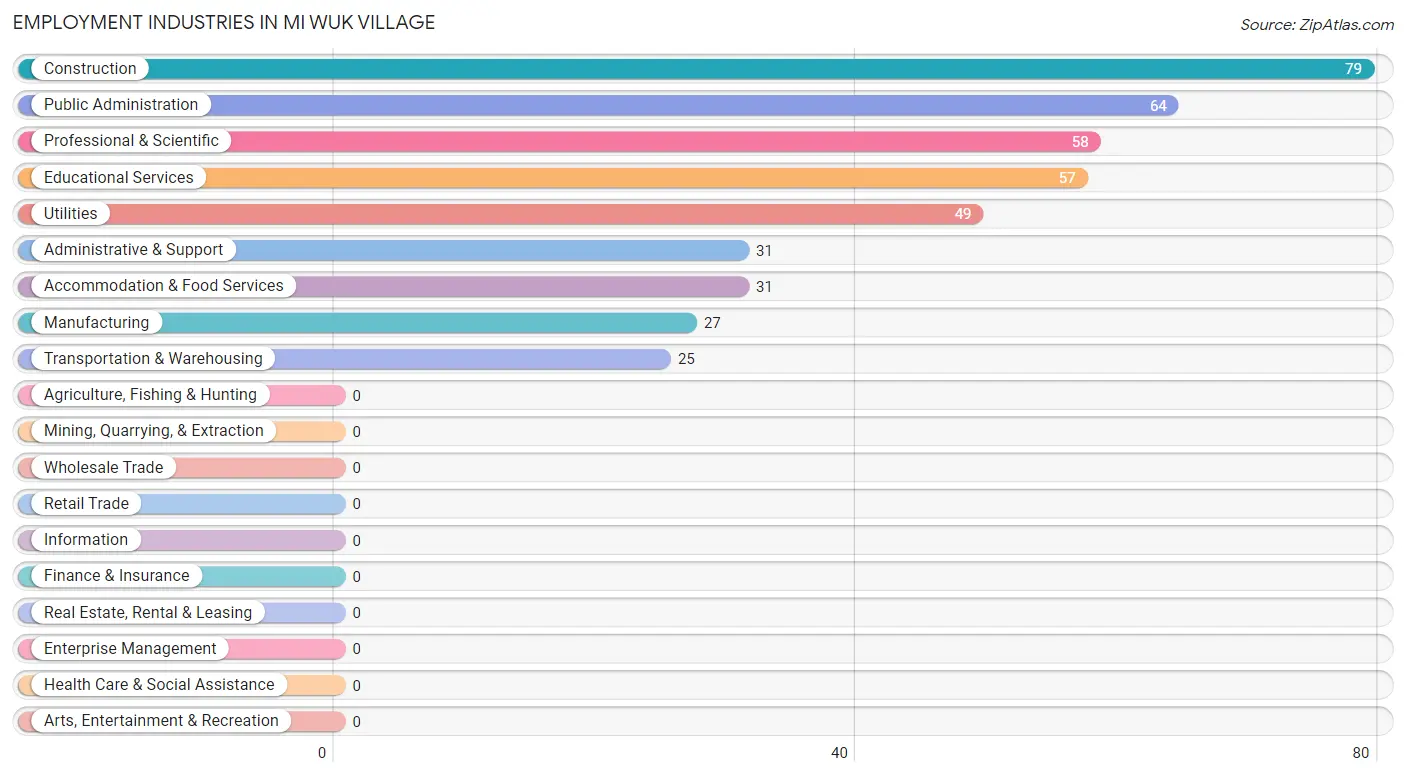
Employment Industries by Sex in Mi Wuk Village
The Mi Wuk Village industries that see more men than women are Construction (100.0%), Manufacturing (100.0%), and Utilities (100.0%), whereas the industries that tend to have a higher number of women are Transportation & Warehousing (100.0%), Educational Services (100.0%), and Accommodation & Food Services (100.0%).
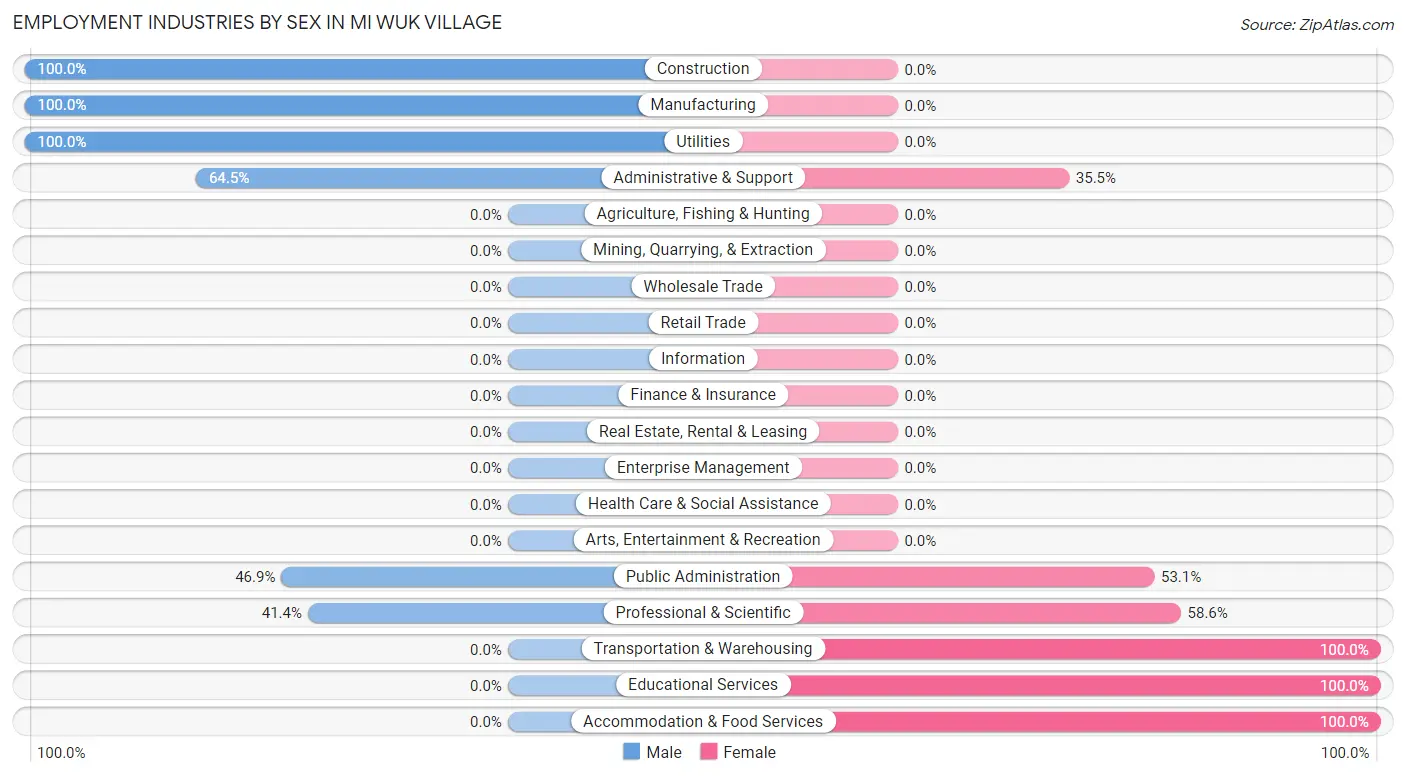
| Industry | Male | Female |
| Agriculture, Fishing & Hunting | 0 (0.0%) | 0 (0.0%) |
| Mining, Quarrying, & Extraction | 0 (0.0%) | 0 (0.0%) |
| Construction | 79 (100.0%) | 0 (0.0%) |
| Manufacturing | 27 (100.0%) | 0 (0.0%) |
| Wholesale Trade | 0 (0.0%) | 0 (0.0%) |
| Retail Trade | 0 (0.0%) | 0 (0.0%) |
| Transportation & Warehousing | 0 (0.0%) | 25 (100.0%) |
| Utilities | 49 (100.0%) | 0 (0.0%) |
| Information | 0 (0.0%) | 0 (0.0%) |
| Finance & Insurance | 0 (0.0%) | 0 (0.0%) |
| Real Estate, Rental & Leasing | 0 (0.0%) | 0 (0.0%) |
| Professional & Scientific | 24 (41.4%) | 34 (58.6%) |
| Enterprise Management | 0 (0.0%) | 0 (0.0%) |
| Administrative & Support | 20 (64.5%) | 11 (35.5%) |
| Educational Services | 0 (0.0%) | 57 (100.0%) |
| Health Care & Social Assistance | 0 (0.0%) | 0 (0.0%) |
| Arts, Entertainment & Recreation | 0 (0.0%) | 0 (0.0%) |
| Accommodation & Food Services | 0 (0.0%) | 31 (100.0%) |
| Public Administration | 30 (46.9%) | 34 (53.1%) |
| Total | 229 (51.5%) | 216 (48.5%) |
Education in Mi Wuk Village
School Enrollment in Mi Wuk Village
The most common levels of schooling among the 115 students in Mi Wuk Village are high school (35 | 30.4%), graduate / professional (33 | 28.7%), and college / undergraduate (25 | 21.7%).
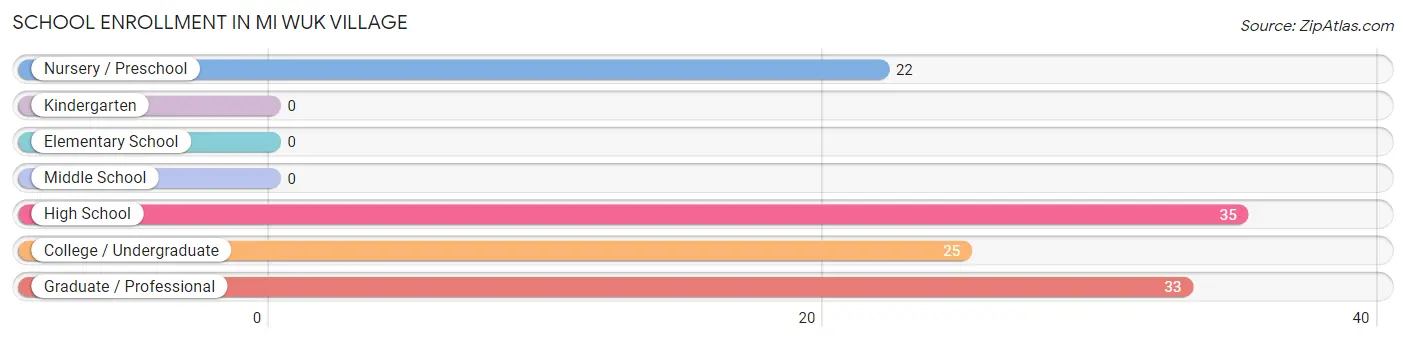
| School Level | # Students | % Students |
| Nursery / Preschool | 22 | 19.1% |
| Kindergarten | 0 | 0.0% |
| Elementary School | 0 | 0.0% |
| Middle School | 0 | 0.0% |
| High School | 35 | 30.4% |
| College / Undergraduate | 25 | 21.7% |
| Graduate / Professional | 33 | 28.7% |
| Total | 115 | 100.0% |
School Enrollment by Age by Funding Source in Mi Wuk Village
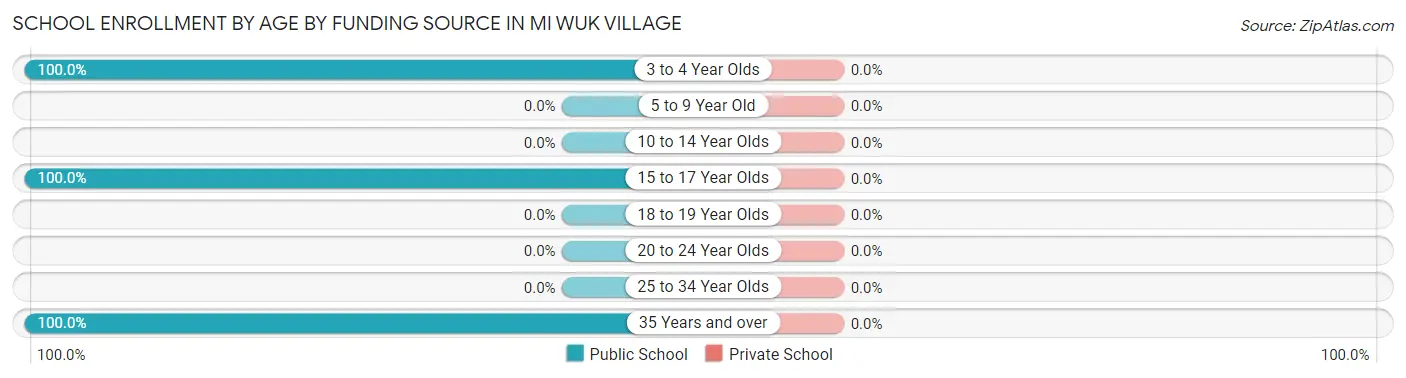
| Age Bracket | Public School | Private School |
| 3 to 4 Year Olds | 22 (100.0%) | 0 (0.0%) |
| 5 to 9 Year Old | 0 (0.0%) | 0 (0.0%) |
| 10 to 14 Year Olds | 0 (0.0%) | 0 (0.0%) |
| 15 to 17 Year Olds | 35 (100.0%) | 0 (0.0%) |
| 18 to 19 Year Olds | 0 (0.0%) | 0 (0.0%) |
| 20 to 24 Year Olds | 0 (0.0%) | 0 (0.0%) |
| 25 to 34 Year Olds | 0 (0.0%) | 0 (0.0%) |
| 35 Years and over | 58 (100.0%) | 0 (0.0%) |
| Total | 115 (100.0%) | 0 (0.0%) |
Educational Attainment by Field of Study in Mi Wuk Village
Engineering (85 | 28.1%), computers & mathematics (47 | 15.5%), visual & performing arts (47 | 15.5%), arts & humanities (41 | 13.5%), and liberal arts & history (33 | 10.9%) are the most common fields of study among 303 individuals in Mi Wuk Village who have obtained a bachelor's degree or higher.
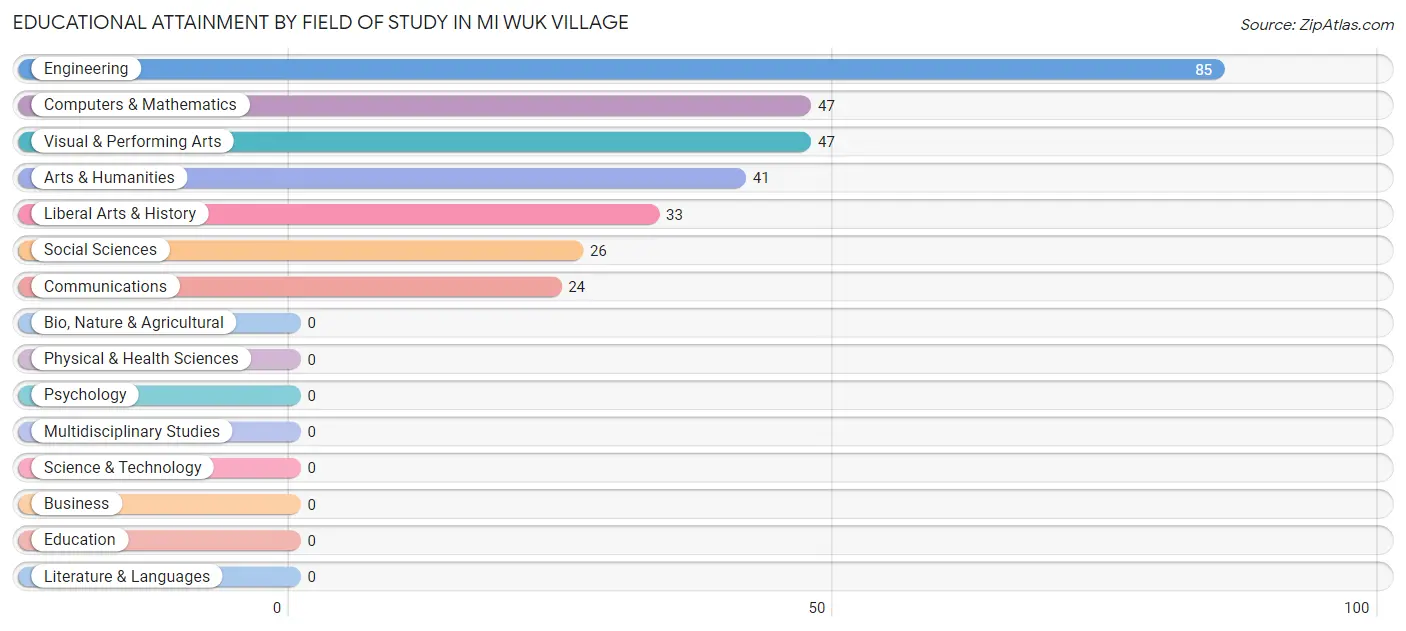
| Field of Study | # Graduates | % Graduates |
| Computers & Mathematics | 47 | 15.5% |
| Bio, Nature & Agricultural | 0 | 0.0% |
| Physical & Health Sciences | 0 | 0.0% |
| Psychology | 0 | 0.0% |
| Social Sciences | 26 | 8.6% |
| Engineering | 85 | 28.1% |
| Multidisciplinary Studies | 0 | 0.0% |
| Science & Technology | 0 | 0.0% |
| Business | 0 | 0.0% |
| Education | 0 | 0.0% |
| Literature & Languages | 0 | 0.0% |
| Liberal Arts & History | 33 | 10.9% |
| Visual & Performing Arts | 47 | 15.5% |
| Communications | 24 | 7.9% |
| Arts & Humanities | 41 | 13.5% |
| Total | 303 | 100.0% |
Transportation & Commute in Mi Wuk Village
Vehicle Availability by Sex in Mi Wuk Village
The most prevalent vehicle ownership categories in Mi Wuk Village are males with 4 vehicles (103, accounting for 45.0%) and females with 4 vehicles (46, making up 55.7%).
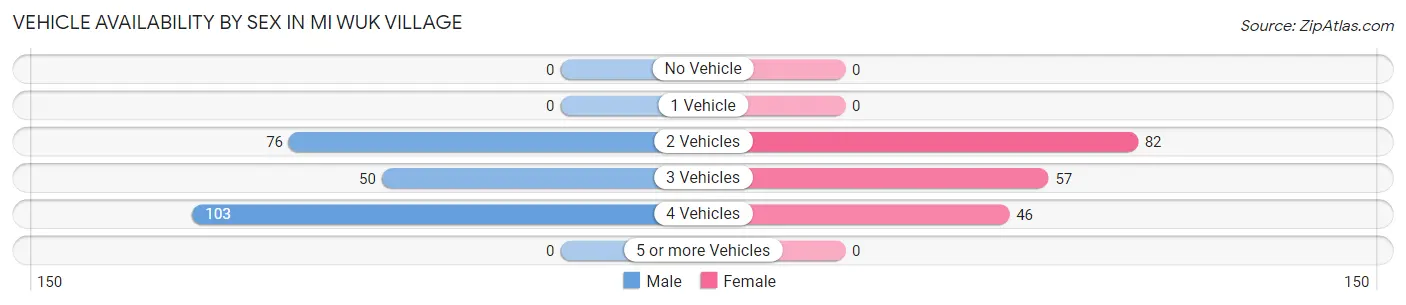
| Vehicles Available | Male | Female |
| No Vehicle | 0 (0.0%) | 0 (0.0%) |
| 1 Vehicle | 0 (0.0%) | 0 (0.0%) |
| 2 Vehicles | 76 (33.2%) | 82 (44.3%) |
| 3 Vehicles | 50 (21.8%) | 57 (30.8%) |
| 4 Vehicles | 103 (45.0%) | 46 (24.9%) |
| 5 or more Vehicles | 0 (0.0%) | 0 (0.0%) |
| Total | 229 (100.0%) | 185 (100.0%) |
Commute Time in Mi Wuk Village
The most frequently occuring commute durations in Mi Wuk Village are 15 to 19 minutes (121 commuters, 39.2%), 20 to 24 minutes (94 commuters, 30.4%), and less than 5 minutes (33 commuters, 10.7%).
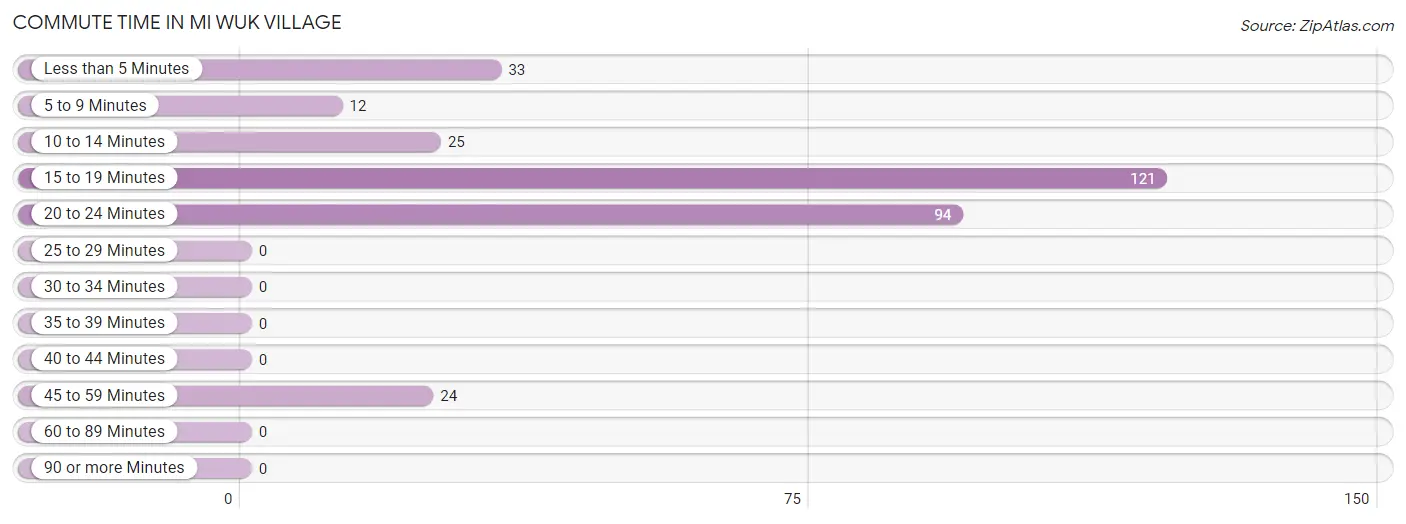
| Commute Time | # Commuters | % Commuters |
| Less than 5 Minutes | 33 | 10.7% |
| 5 to 9 Minutes | 12 | 3.9% |
| 10 to 14 Minutes | 25 | 8.1% |
| 15 to 19 Minutes | 121 | 39.2% |
| 20 to 24 Minutes | 94 | 30.4% |
| 25 to 29 Minutes | 0 | 0.0% |
| 30 to 34 Minutes | 0 | 0.0% |
| 35 to 39 Minutes | 0 | 0.0% |
| 40 to 44 Minutes | 0 | 0.0% |
| 45 to 59 Minutes | 24 | 7.8% |
| 60 to 89 Minutes | 0 | 0.0% |
| 90 or more Minutes | 0 | 0.0% |
Commute Time by Sex in Mi Wuk Village
The most common commute times in Mi Wuk Village are 20 to 24 minutes (83 commuters, 52.5%) for males and 15 to 19 minutes (70 commuters, 46.4%) for females.
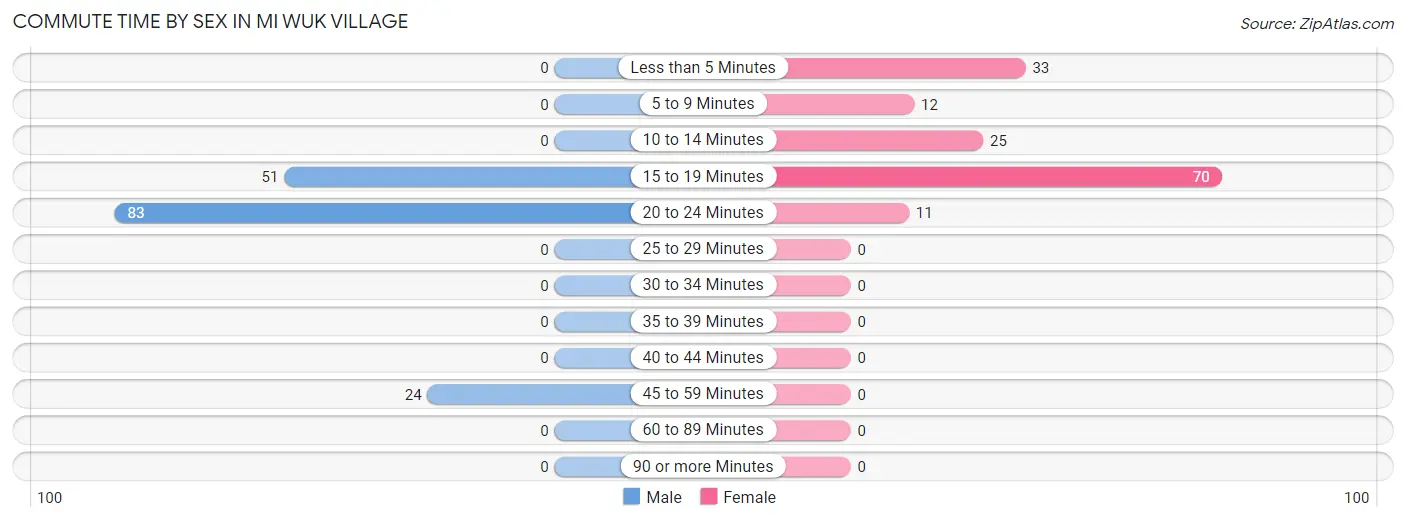
| Commute Time | Male | Female |
| Less than 5 Minutes | 0 (0.0%) | 33 (21.8%) |
| 5 to 9 Minutes | 0 (0.0%) | 12 (8.0%) |
| 10 to 14 Minutes | 0 (0.0%) | 25 (16.6%) |
| 15 to 19 Minutes | 51 (32.3%) | 70 (46.4%) |
| 20 to 24 Minutes | 83 (52.5%) | 11 (7.3%) |
| 25 to 29 Minutes | 0 (0.0%) | 0 (0.0%) |
| 30 to 34 Minutes | 0 (0.0%) | 0 (0.0%) |
| 35 to 39 Minutes | 0 (0.0%) | 0 (0.0%) |
| 40 to 44 Minutes | 0 (0.0%) | 0 (0.0%) |
| 45 to 59 Minutes | 24 (15.2%) | 0 (0.0%) |
| 60 to 89 Minutes | 0 (0.0%) | 0 (0.0%) |
| 90 or more Minutes | 0 (0.0%) | 0 (0.0%) |
Time of Departure to Work by Sex in Mi Wuk Village
The most frequent times of departure to work in Mi Wuk Village are 6:00 AM to 6:29 AM (76, 48.1%) for males and 7:30 AM to 7:59 AM (46, 30.5%) for females.
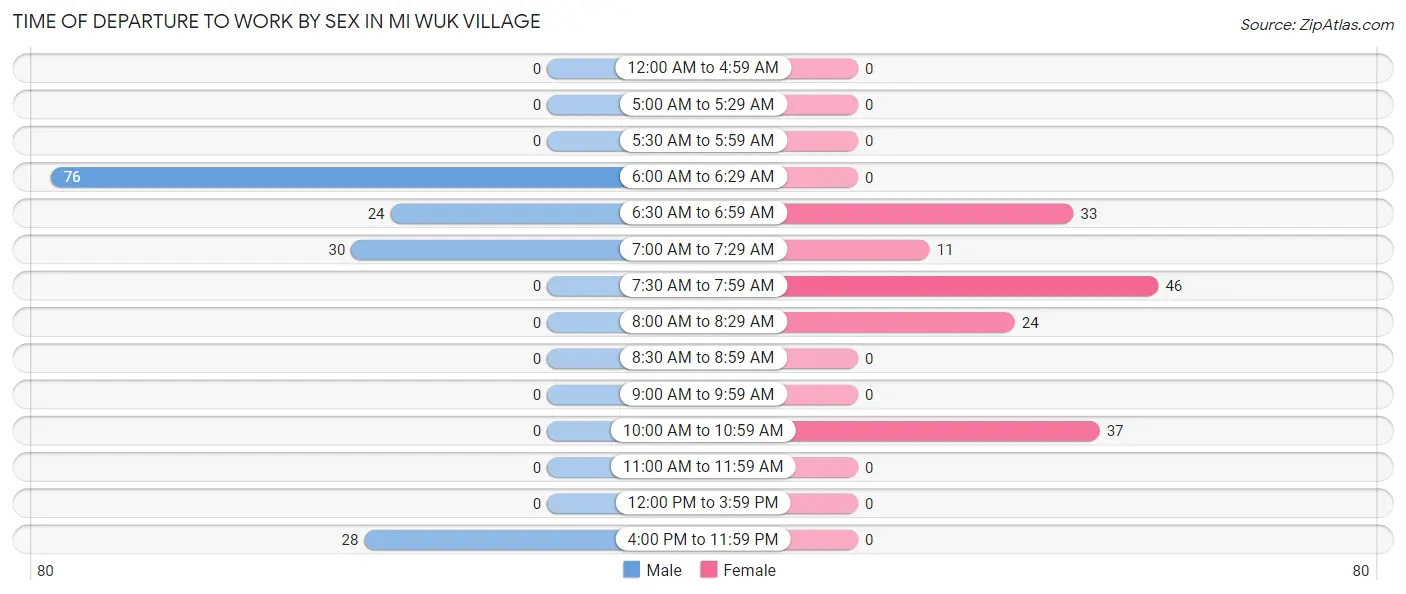
| Time of Departure | Male | Female |
| 12:00 AM to 4:59 AM | 0 (0.0%) | 0 (0.0%) |
| 5:00 AM to 5:29 AM | 0 (0.0%) | 0 (0.0%) |
| 5:30 AM to 5:59 AM | 0 (0.0%) | 0 (0.0%) |
| 6:00 AM to 6:29 AM | 76 (48.1%) | 0 (0.0%) |
| 6:30 AM to 6:59 AM | 24 (15.2%) | 33 (21.8%) |
| 7:00 AM to 7:29 AM | 30 (19.0%) | 11 (7.3%) |
| 7:30 AM to 7:59 AM | 0 (0.0%) | 46 (30.5%) |
| 8:00 AM to 8:29 AM | 0 (0.0%) | 24 (15.9%) |
| 8:30 AM to 8:59 AM | 0 (0.0%) | 0 (0.0%) |
| 9:00 AM to 9:59 AM | 0 (0.0%) | 0 (0.0%) |
| 10:00 AM to 10:59 AM | 0 (0.0%) | 37 (24.5%) |
| 11:00 AM to 11:59 AM | 0 (0.0%) | 0 (0.0%) |
| 12:00 PM to 3:59 PM | 0 (0.0%) | 0 (0.0%) |
| 4:00 PM to 11:59 PM | 28 (17.7%) | 0 (0.0%) |
| Total | 158 (100.0%) | 151 (100.0%) |
Housing Occupancy in Mi Wuk Village
Occupancy by Ownership in Mi Wuk Village
Of the total 410 dwellings in Mi Wuk Village, owner-occupied units account for 348 (84.9%), while renter-occupied units make up 62 (15.1%).
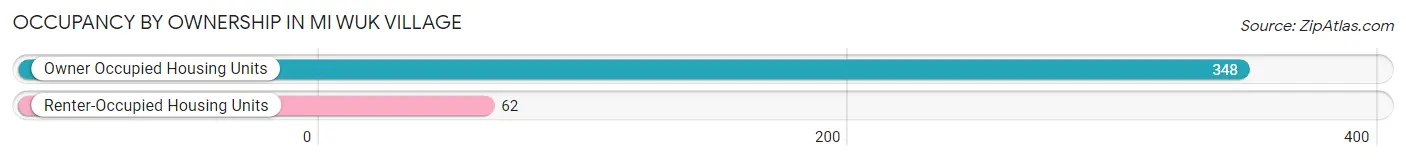
| Occupancy | # Housing Units | % Housing Units |
| Owner Occupied Housing Units | 348 | 84.9% |
| Renter-Occupied Housing Units | 62 | 15.1% |
| Total Occupied Housing Units | 410 | 100.0% |
Occupancy by Household Size in Mi Wuk Village
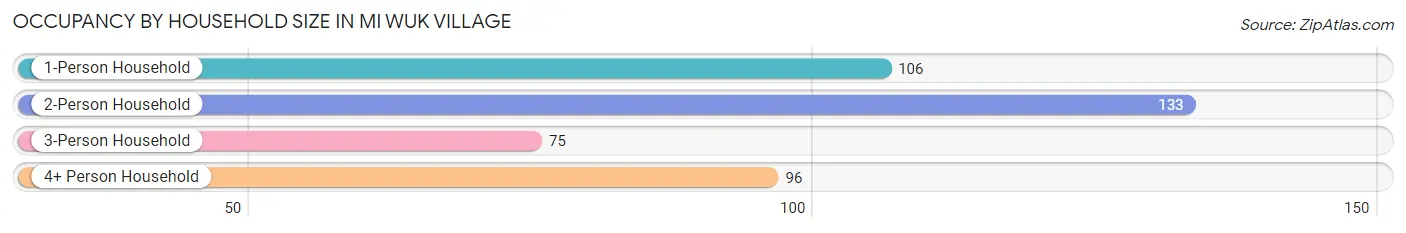
| Household Size | # Housing Units | % Housing Units |
| 1-Person Household | 106 | 25.9% |
| 2-Person Household | 133 | 32.4% |
| 3-Person Household | 75 | 18.3% |
| 4+ Person Household | 96 | 23.4% |
| Total Housing Units | 410 | 100.0% |
Occupancy by Ownership by Household Size in Mi Wuk Village
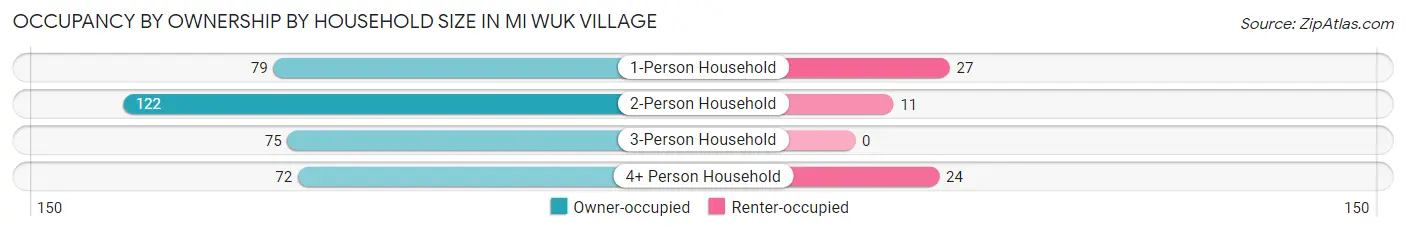
| Household Size | Owner-occupied | Renter-occupied |
| 1-Person Household | 79 (74.5%) | 27 (25.5%) |
| 2-Person Household | 122 (91.7%) | 11 (8.3%) |
| 3-Person Household | 75 (100.0%) | 0 (0.0%) |
| 4+ Person Household | 72 (75.0%) | 24 (25.0%) |
| Total Housing Units | 348 (84.9%) | 62 (15.1%) |
Occupancy by Educational Attainment in Mi Wuk Village
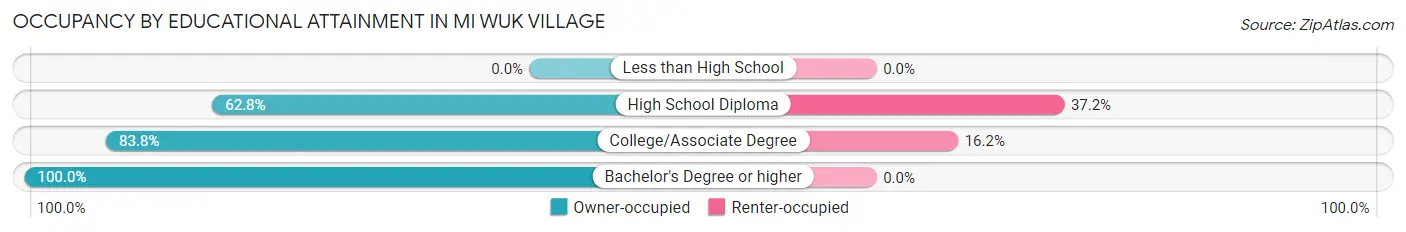
| Household Size | Owner-occupied | Renter-occupied |
| Less than High School | 0 (0.0%) | 0 (0.0%) |
| High School Diploma | 59 (62.8%) | 35 (37.2%) |
| College/Associate Degree | 140 (83.8%) | 27 (16.2%) |
| Bachelor's Degree or higher | 149 (100.0%) | 0 (0.0%) |
Occupancy by Age of Householder in Mi Wuk Village
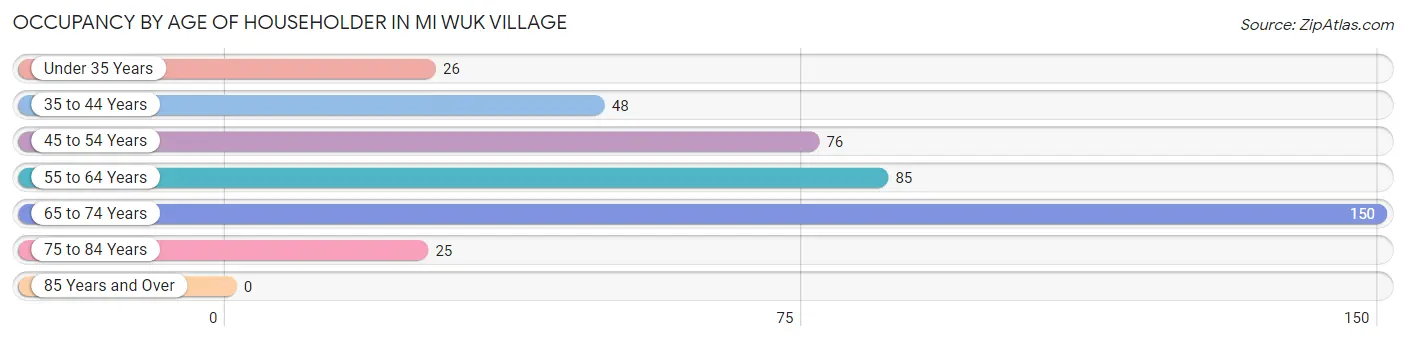
| Age Bracket | # Households | % Households |
| Under 35 Years | 26 | 6.3% |
| 35 to 44 Years | 48 | 11.7% |
| 45 to 54 Years | 76 | 18.5% |
| 55 to 64 Years | 85 | 20.7% |
| 65 to 74 Years | 150 | 36.6% |
| 75 to 84 Years | 25 | 6.1% |
| 85 Years and Over | 0 | 0.0% |
| Total | 410 | 100.0% |
Housing Finances in Mi Wuk Village
Median Income by Occupancy in Mi Wuk Village
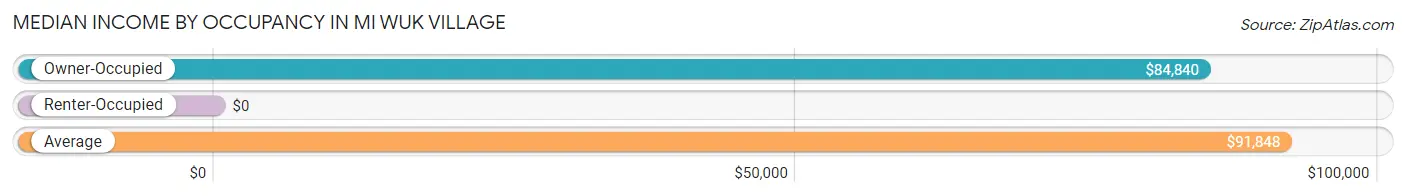
| Occupancy Type | # Households | Median Income |
| Owner-Occupied | 348 (84.9%) | $84,840 |
| Renter-Occupied | 62 (15.1%) | $0 |
| Average | 410 (100.0%) | $91,848 |
Occupancy by Householder Income Bracket in Mi Wuk Village
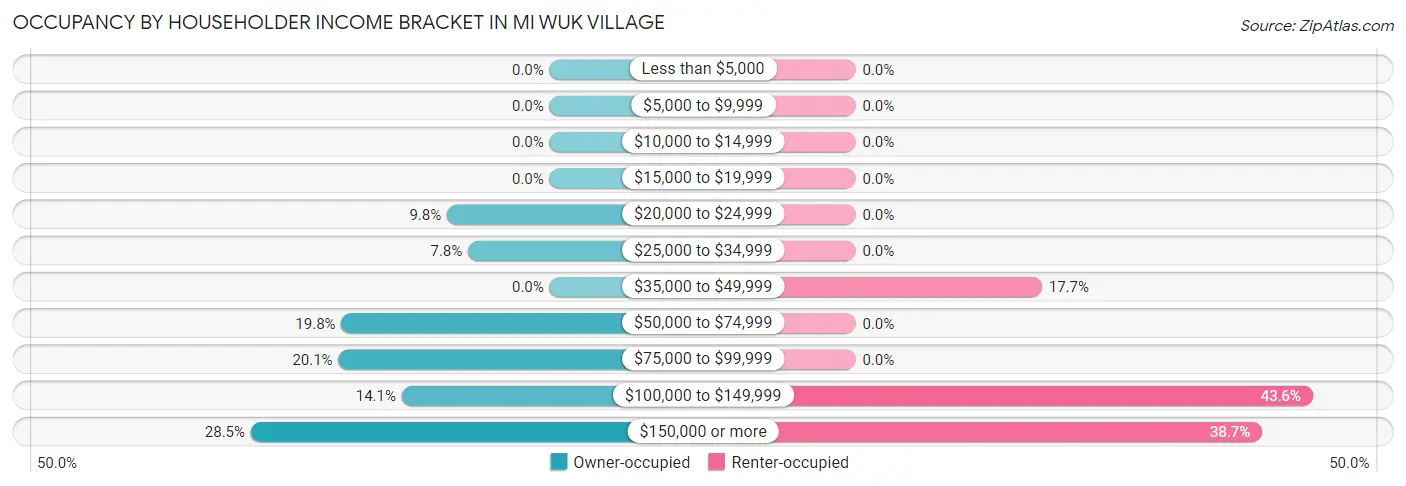
| Income Bracket | Owner-occupied | Renter-occupied |
| Less than $5,000 | 0 (0.0%) | 0 (0.0%) |
| $5,000 to $9,999 | 0 (0.0%) | 0 (0.0%) |
| $10,000 to $14,999 | 0 (0.0%) | 0 (0.0%) |
| $15,000 to $19,999 | 0 (0.0%) | 0 (0.0%) |
| $20,000 to $24,999 | 34 (9.8%) | 0 (0.0%) |
| $25,000 to $34,999 | 27 (7.8%) | 0 (0.0%) |
| $35,000 to $49,999 | 0 (0.0%) | 11 (17.7%) |
| $50,000 to $74,999 | 69 (19.8%) | 0 (0.0%) |
| $75,000 to $99,999 | 70 (20.1%) | 0 (0.0%) |
| $100,000 to $149,999 | 49 (14.1%) | 27 (43.5%) |
| $150,000 or more | 99 (28.4%) | 24 (38.7%) |
| Total | 348 (100.0%) | 62 (100.0%) |
Monthly Housing Cost Tiers in Mi Wuk Village
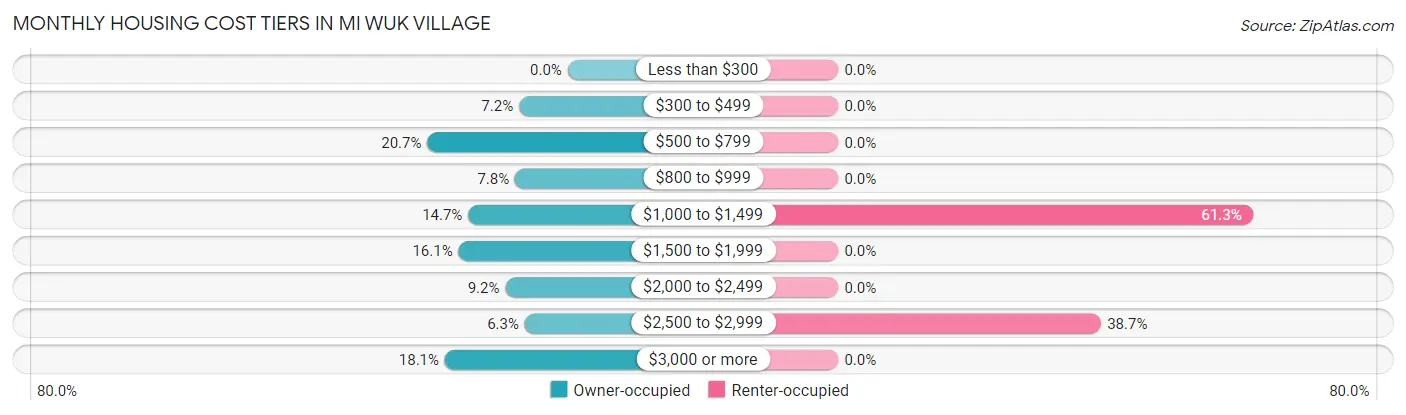
| Monthly Cost | Owner-occupied | Renter-occupied |
| Less than $300 | 0 (0.0%) | 0 (0.0%) |
| $300 to $499 | 25 (7.2%) | 0 (0.0%) |
| $500 to $799 | 72 (20.7%) | 0 (0.0%) |
| $800 to $999 | 27 (7.8%) | 0 (0.0%) |
| $1,000 to $1,499 | 51 (14.7%) | 38 (61.3%) |
| $1,500 to $1,999 | 56 (16.1%) | 0 (0.0%) |
| $2,000 to $2,499 | 32 (9.2%) | 0 (0.0%) |
| $2,500 to $2,999 | 22 (6.3%) | 24 (38.7%) |
| $3,000 or more | 63 (18.1%) | 0 (0.0%) |
| Total | 348 (100.0%) | 62 (100.0%) |
Physical Housing Characteristics in Mi Wuk Village
Housing Structures in Mi Wuk Village
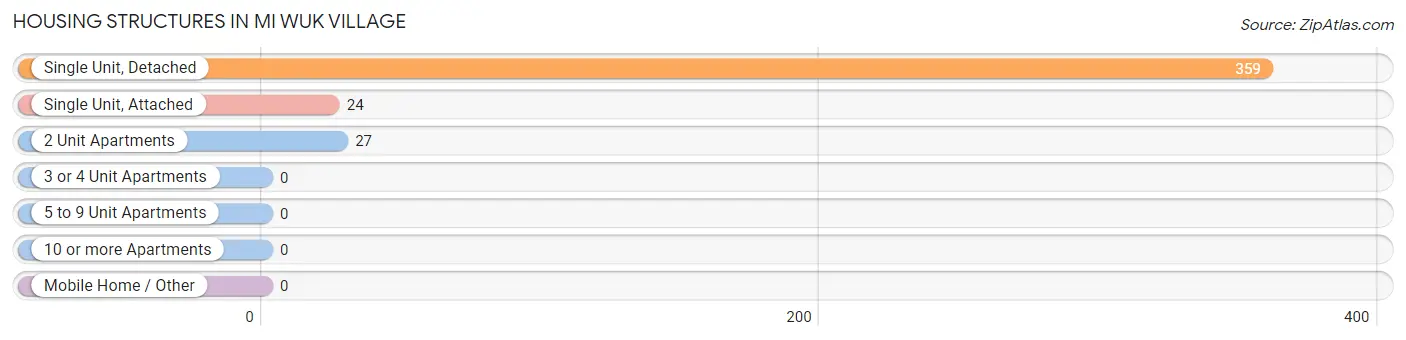
| Structure Type | # Housing Units | % Housing Units |
| Single Unit, Detached | 359 | 87.6% |
| Single Unit, Attached | 24 | 5.9% |
| 2 Unit Apartments | 27 | 6.6% |
| 3 or 4 Unit Apartments | 0 | 0.0% |
| 5 to 9 Unit Apartments | 0 | 0.0% |
| 10 or more Apartments | 0 | 0.0% |
| Mobile Home / Other | 0 | 0.0% |
| Total | 410 | 100.0% |
Housing Structures by Occupancy in Mi Wuk Village
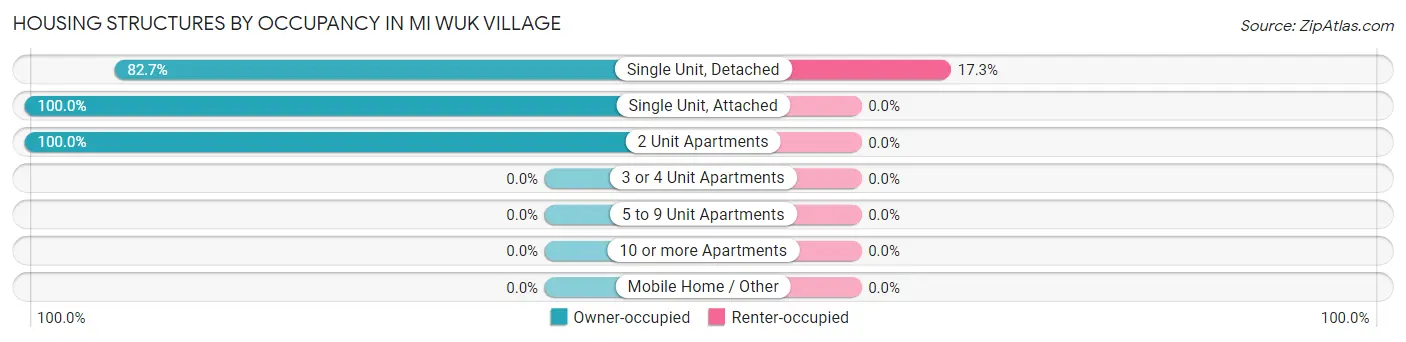
| Structure Type | Owner-occupied | Renter-occupied |
| Single Unit, Detached | 297 (82.7%) | 62 (17.3%) |
| Single Unit, Attached | 24 (100.0%) | 0 (0.0%) |
| 2 Unit Apartments | 27 (100.0%) | 0 (0.0%) |
| 3 or 4 Unit Apartments | 0 (0.0%) | 0 (0.0%) |
| 5 to 9 Unit Apartments | 0 (0.0%) | 0 (0.0%) |
| 10 or more Apartments | 0 (0.0%) | 0 (0.0%) |
| Mobile Home / Other | 0 (0.0%) | 0 (0.0%) |
| Total | 348 (84.9%) | 62 (15.1%) |
Housing Structures by Number of Rooms in Mi Wuk Village
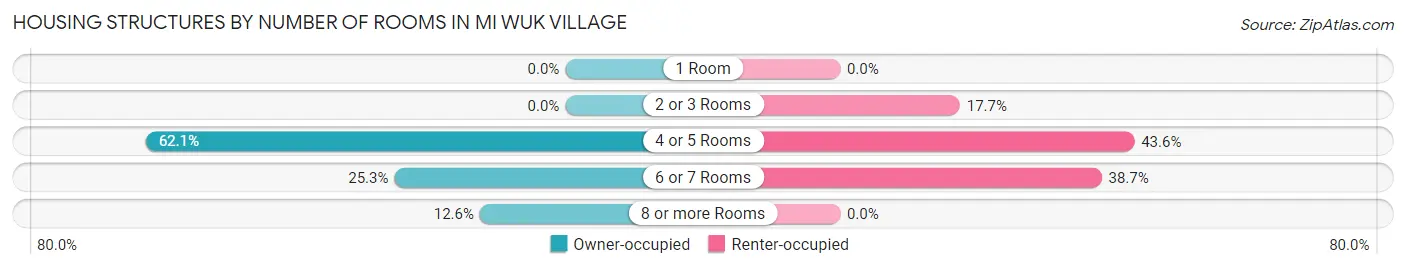
| Number of Rooms | Owner-occupied | Renter-occupied |
| 1 Room | 0 (0.0%) | 0 (0.0%) |
| 2 or 3 Rooms | 0 (0.0%) | 11 (17.7%) |
| 4 or 5 Rooms | 216 (62.1%) | 27 (43.5%) |
| 6 or 7 Rooms | 88 (25.3%) | 24 (38.7%) |
| 8 or more Rooms | 44 (12.6%) | 0 (0.0%) |
| Total | 348 (100.0%) | 62 (100.0%) |
Housing Structure by Heating Type in Mi Wuk Village
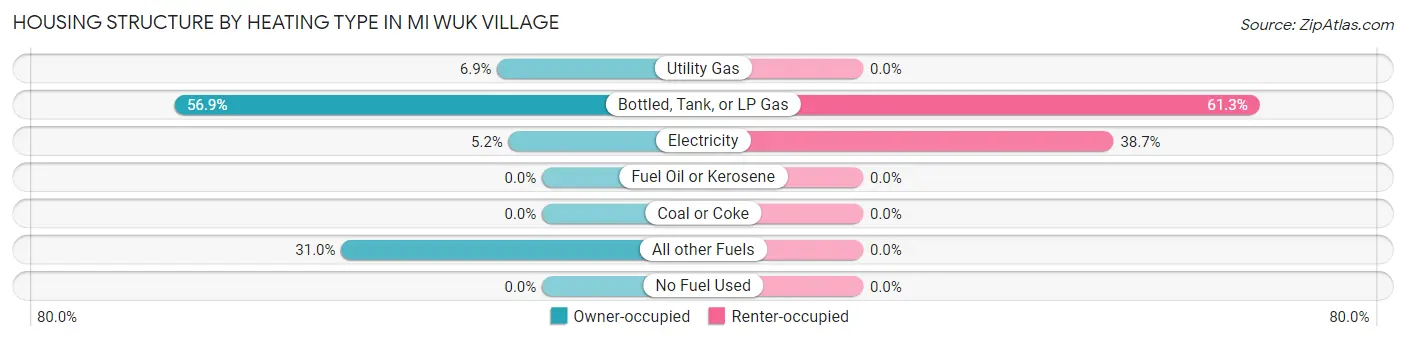
| Heating Type | Owner-occupied | Renter-occupied |
| Utility Gas | 24 (6.9%) | 0 (0.0%) |
| Bottled, Tank, or LP Gas | 198 (56.9%) | 38 (61.3%) |
| Electricity | 18 (5.2%) | 24 (38.7%) |
| Fuel Oil or Kerosene | 0 (0.0%) | 0 (0.0%) |
| Coal or Coke | 0 (0.0%) | 0 (0.0%) |
| All other Fuels | 108 (31.0%) | 0 (0.0%) |
| No Fuel Used | 0 (0.0%) | 0 (0.0%) |
| Total | 348 (100.0%) | 62 (100.0%) |
Household Vehicle Usage in Mi Wuk Village
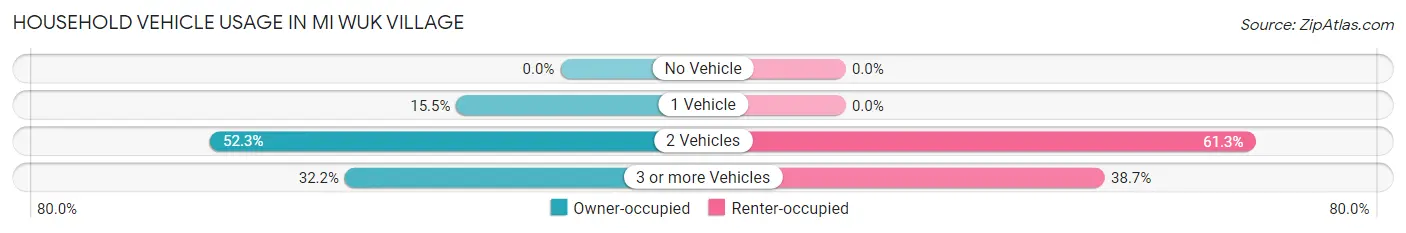
| Vehicles per Household | Owner-occupied | Renter-occupied |
| No Vehicle | 0 (0.0%) | 0 (0.0%) |
| 1 Vehicle | 54 (15.5%) | 0 (0.0%) |
| 2 Vehicles | 182 (52.3%) | 38 (61.3%) |
| 3 or more Vehicles | 112 (32.2%) | 24 (38.7%) |
| Total | 348 (100.0%) | 62 (100.0%) |
Real Estate & Mortgages in Mi Wuk Village
Real Estate and Mortgage Overview in Mi Wuk Village
| Characteristic | Without Mortgage | With Mortgage |
| Housing Units | 124 | 224 |
| Median Property Value | $540,500 | $463,200 |
| Median Household Income | $71,000 | $99 |
| Monthly Housing Costs | $651 | $63 |
| Real Estate Taxes | $2,787 | $0 |
Property Value by Mortgage Status in Mi Wuk Village
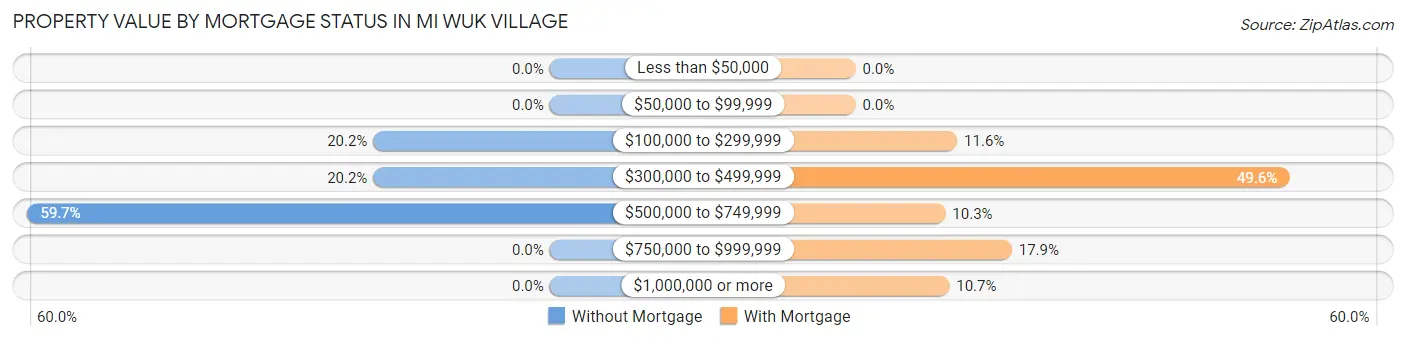
| Property Value | Without Mortgage | With Mortgage |
| Less than $50,000 | 0 (0.0%) | 0 (0.0%) |
| $50,000 to $99,999 | 0 (0.0%) | 0 (0.0%) |
| $100,000 to $299,999 | 25 (20.2%) | 26 (11.6%) |
| $300,000 to $499,999 | 25 (20.2%) | 111 (49.5%) |
| $500,000 to $749,999 | 74 (59.7%) | 23 (10.3%) |
| $750,000 to $999,999 | 0 (0.0%) | 40 (17.9%) |
| $1,000,000 or more | 0 (0.0%) | 24 (10.7%) |
| Total | 124 (100.0%) | 224 (100.0%) |
Household Income by Mortgage Status in Mi Wuk Village
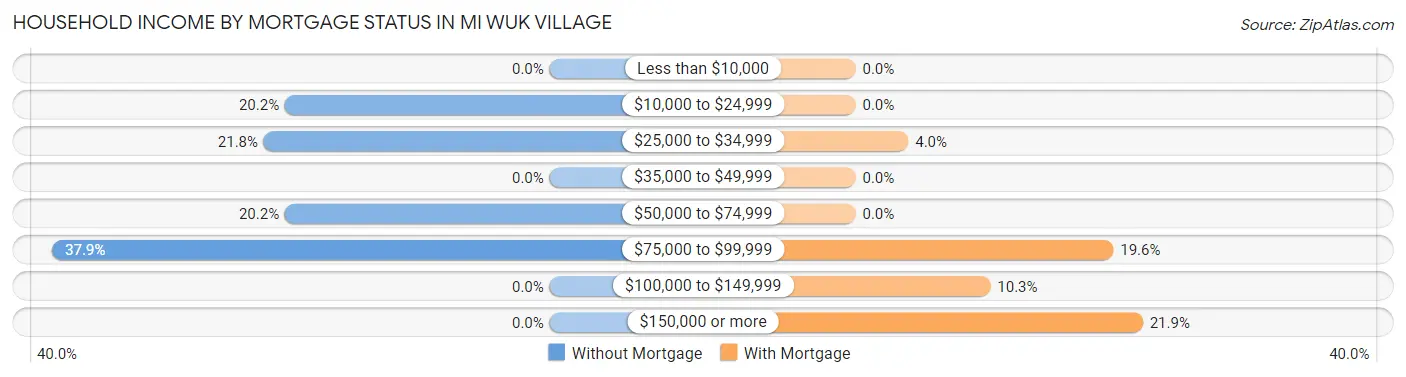
| Household Income | Without Mortgage | With Mortgage |
| Less than $10,000 | 0 (0.0%) | 0 (0.0%) |
| $10,000 to $24,999 | 25 (20.2%) | 0 (0.0%) |
| $25,000 to $34,999 | 27 (21.8%) | 9 (4.0%) |
| $35,000 to $49,999 | 0 (0.0%) | 0 (0.0%) |
| $50,000 to $74,999 | 25 (20.2%) | 0 (0.0%) |
| $75,000 to $99,999 | 47 (37.9%) | 44 (19.6%) |
| $100,000 to $149,999 | 0 (0.0%) | 23 (10.3%) |
| $150,000 or more | 0 (0.0%) | 49 (21.9%) |
| Total | 124 (100.0%) | 224 (100.0%) |
Property Value to Household Income Ratio in Mi Wuk Village
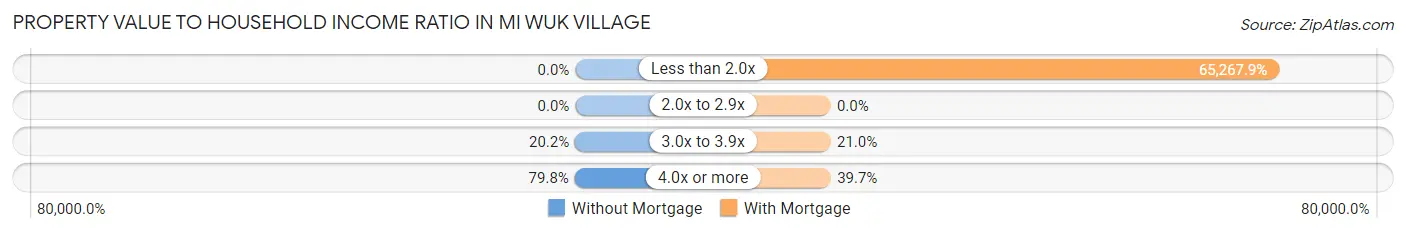
| Value-to-Income Ratio | Without Mortgage | With Mortgage |
| Less than 2.0x | 0 (0.0%) | 146,200 (65,267.9%) |
| 2.0x to 2.9x | 0 (0.0%) | 0 (0.0%) |
| 3.0x to 3.9x | 25 (20.2%) | 47 (21.0%) |
| 4.0x or more | 99 (79.8%) | 89 (39.7%) |
| Total | 124 (100.0%) | 224 (100.0%) |
Real Estate Taxes by Mortgage Status in Mi Wuk Village
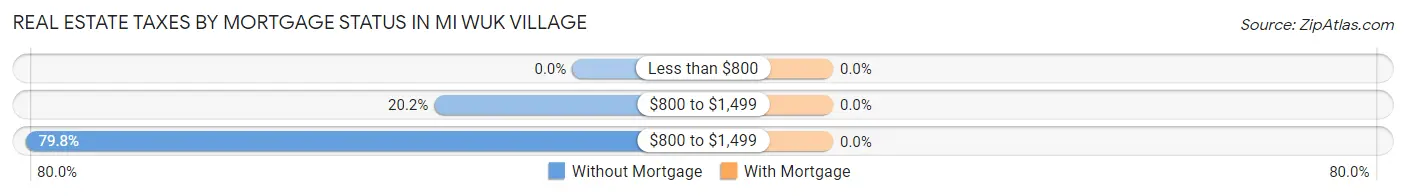
| Property Taxes | Without Mortgage | With Mortgage |
| Less than $800 | 0 (0.0%) | 0 (0.0%) |
| $800 to $1,499 | 25 (20.2%) | 0 (0.0%) |
| $800 to $1,499 | 99 (79.8%) | 0 (0.0%) |
| Total | 124 (100.0%) | 224 (100.0%) |
Health & Disability in Mi Wuk Village
Health Insurance Coverage by Age in Mi Wuk Village
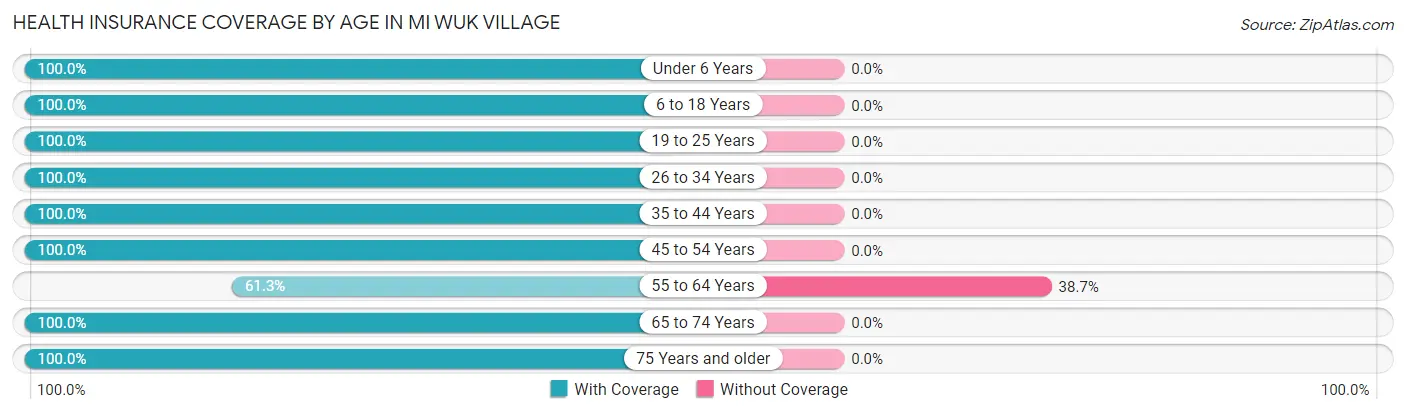
| Age Bracket | With Coverage | Without Coverage |
| Under 6 Years | 107 (100.0%) | 0 (0.0%) |
| 6 to 18 Years | 35 (100.0%) | 0 (0.0%) |
| 19 to 25 Years | 31 (100.0%) | 0 (0.0%) |
| 26 to 34 Years | 139 (100.0%) | 0 (0.0%) |
| 35 to 44 Years | 115 (100.0%) | 0 (0.0%) |
| 45 to 54 Years | 113 (100.0%) | 0 (0.0%) |
| 55 to 64 Years | 111 (61.3%) | 70 (38.7%) |
| 65 to 74 Years | 216 (100.0%) | 0 (0.0%) |
| 75 Years and older | 73 (100.0%) | 0 (0.0%) |
| Total | 940 (93.1%) | 70 (6.9%) |
Health Insurance Coverage by Citizenship Status in Mi Wuk Village
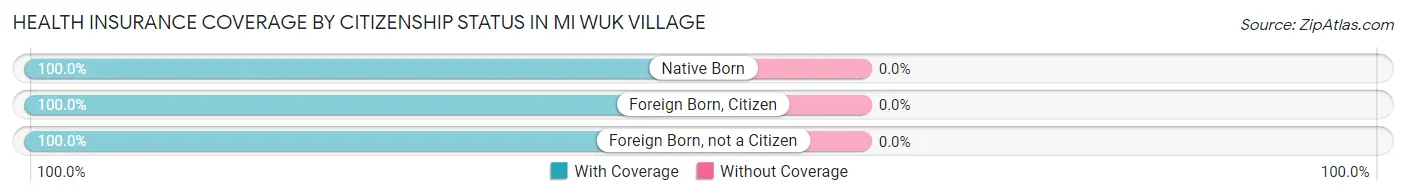
| Citizenship Status | With Coverage | Without Coverage |
| Native Born | 107 (100.0%) | 0 (0.0%) |
| Foreign Born, Citizen | 35 (100.0%) | 0 (0.0%) |
| Foreign Born, not a Citizen | 31 (100.0%) | 0 (0.0%) |
Health Insurance Coverage by Household Income in Mi Wuk Village
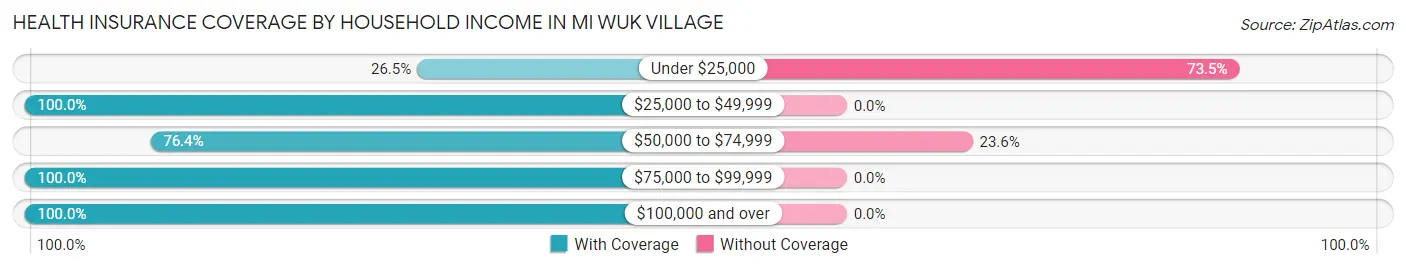
| Household Income | With Coverage | Without Coverage |
| Under $25,000 | 9 (26.5%) | 25 (73.5%) |
| $25,000 to $49,999 | 50 (100.0%) | 0 (0.0%) |
| $50,000 to $74,999 | 146 (76.4%) | 45 (23.6%) |
| $75,000 to $99,999 | 130 (100.0%) | 0 (0.0%) |
| $100,000 and over | 605 (100.0%) | 0 (0.0%) |
Public vs Private Health Insurance Coverage by Age in Mi Wuk Village
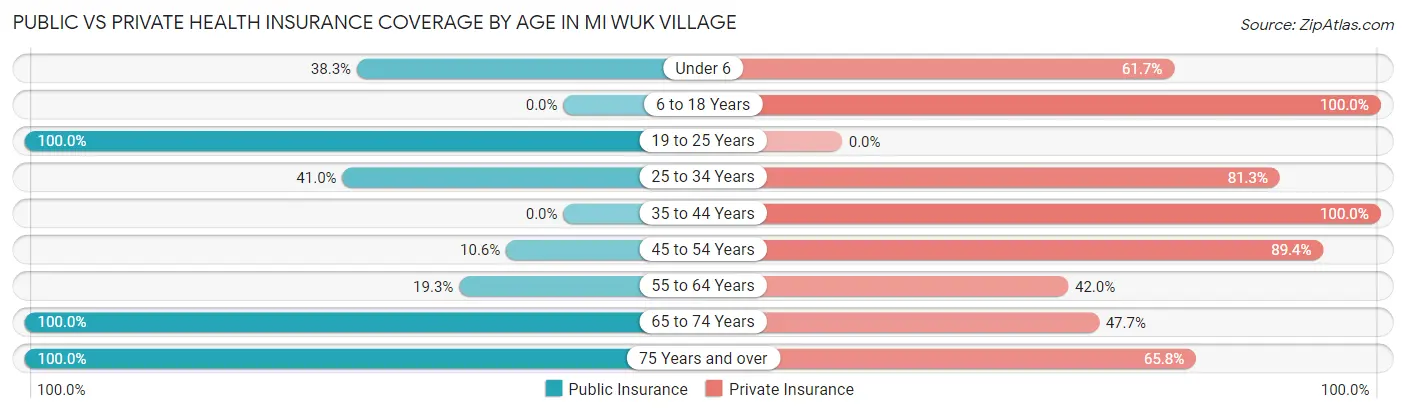
| Age Bracket | Public Insurance | Private Insurance |
| Under 6 | 41 (38.3%) | 66 (61.7%) |
| 6 to 18 Years | 0 (0.0%) | 35 (100.0%) |
| 19 to 25 Years | 31 (100.0%) | 0 (0.0%) |
| 25 to 34 Years | 57 (41.0%) | 113 (81.3%) |
| 35 to 44 Years | 0 (0.0%) | 115 (100.0%) |
| 45 to 54 Years | 12 (10.6%) | 101 (89.4%) |
| 55 to 64 Years | 35 (19.3%) | 76 (42.0%) |
| 65 to 74 Years | 216 (100.0%) | 103 (47.7%) |
| 75 Years and over | 73 (100.0%) | 48 (65.7%) |
| Total | 465 (46.0%) | 657 (65.0%) |
Disability Status by Sex by Age in Mi Wuk Village
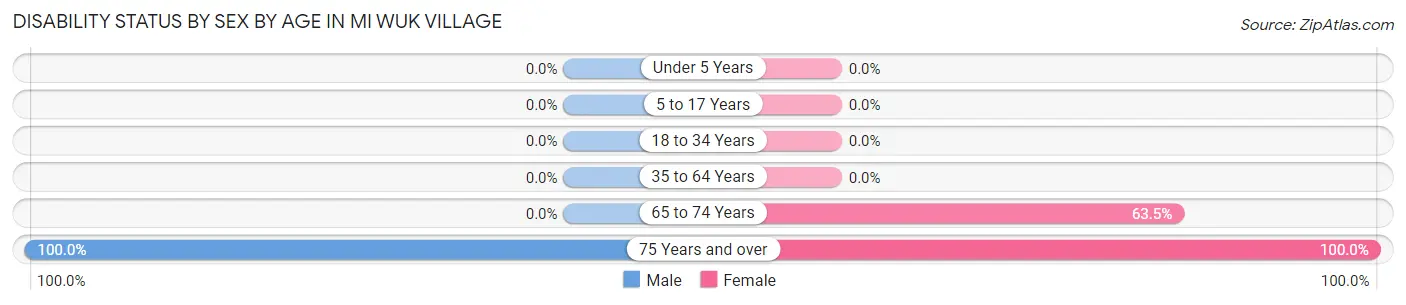
| Age Bracket | Male | Female |
| Under 5 Years | 0 (0.0%) | 0 (0.0%) |
| 5 to 17 Years | 0 (0.0%) | 0 (0.0%) |
| 18 to 34 Years | 0 (0.0%) | 0 (0.0%) |
| 35 to 64 Years | 0 (0.0%) | 0 (0.0%) |
| 65 to 74 Years | 0 (0.0%) | 47 (63.5%) |
| 75 Years and over | 23 (100.0%) | 50 (100.0%) |
Disability Class by Sex by Age in Mi Wuk Village
Disability Class: Hearing Difficulty
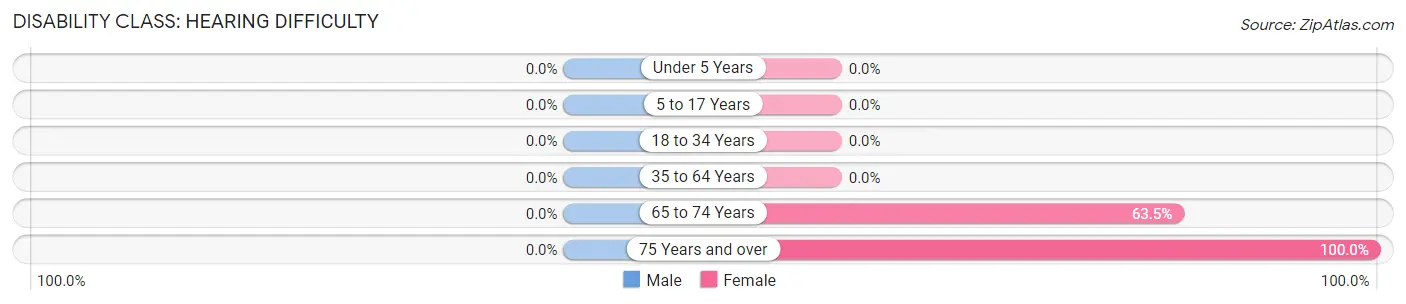
| Age Bracket | Male | Female |
| Under 5 Years | 0 (0.0%) | 0 (0.0%) |
| 5 to 17 Years | 0 (0.0%) | 0 (0.0%) |
| 18 to 34 Years | 0 (0.0%) | 0 (0.0%) |
| 35 to 64 Years | 0 (0.0%) | 0 (0.0%) |
| 65 to 74 Years | 0 (0.0%) | 47 (63.5%) |
| 75 Years and over | 0 (0.0%) | 50 (100.0%) |
Disability Class: Vision Difficulty
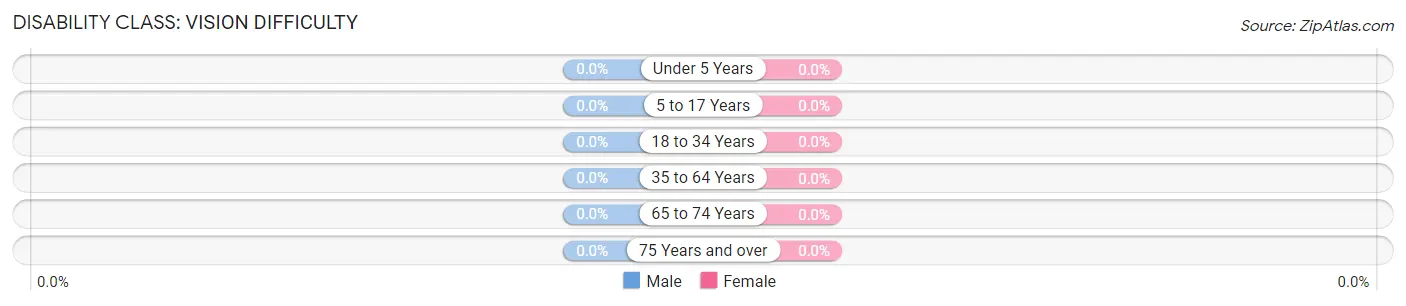
| Age Bracket | Male | Female |
| Under 5 Years | 0 (0.0%) | 0 (0.0%) |
| 5 to 17 Years | 0 (0.0%) | 0 (0.0%) |
| 18 to 34 Years | 0 (0.0%) | 0 (0.0%) |
| 35 to 64 Years | 0 (0.0%) | 0 (0.0%) |
| 65 to 74 Years | 0 (0.0%) | 0 (0.0%) |
| 75 Years and over | 0 (0.0%) | 0 (0.0%) |
Disability Class: Cognitive Difficulty
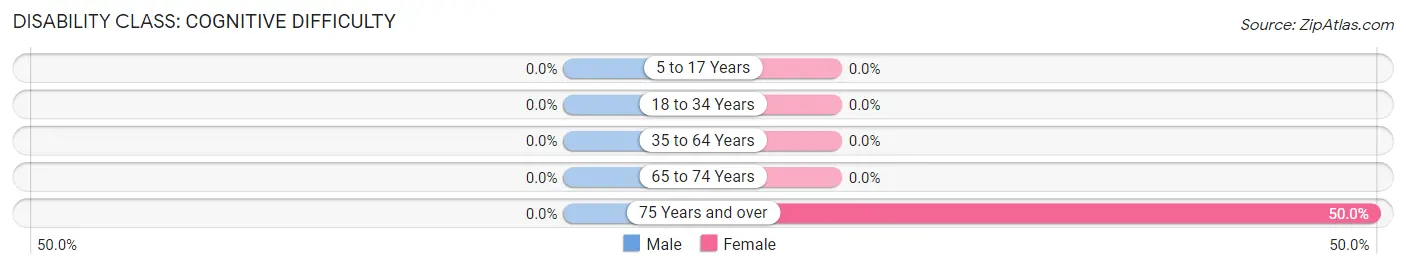
| Age Bracket | Male | Female |
| 5 to 17 Years | 0 (0.0%) | 0 (0.0%) |
| 18 to 34 Years | 0 (0.0%) | 0 (0.0%) |
| 35 to 64 Years | 0 (0.0%) | 0 (0.0%) |
| 65 to 74 Years | 0 (0.0%) | 0 (0.0%) |
| 75 Years and over | 0 (0.0%) | 25 (50.0%) |
Disability Class: Ambulatory Difficulty
| Age Bracket | Male | Female |
| 5 to 17 Years | 0 (0.0%) | 0 (0.0%) |
| 18 to 34 Years | 0 (0.0%) | 0 (0.0%) |
| 35 to 64 Years | 0 (0.0%) | 0 (0.0%) |
| 65 to 74 Years | 0 (0.0%) | 0 (0.0%) |
| 75 Years and over | 23 (100.0%) | 50 (100.0%) |
Disability Class: Self-Care Difficulty
| Age Bracket | Male | Female |
| 5 to 17 Years | 0 (0.0%) | 0 (0.0%) |
| 18 to 34 Years | 0 (0.0%) | 0 (0.0%) |
| 35 to 64 Years | 0 (0.0%) | 0 (0.0%) |
| 65 to 74 Years | 0 (0.0%) | 0 (0.0%) |
| 75 Years and over | 0 (0.0%) | 25 (50.0%) |
Technology Access in Mi Wuk Village
Computing Device Access in Mi Wuk Village
| Device Type | # Households | % Households |
| Desktop or Laptop | 347 | 84.6% |
| Smartphone | 358 | 87.3% |
| Tablet | 181 | 44.2% |
| No Computing Device | 52 | 12.7% |
| Total | 410 | 100.0% |
Internet Access in Mi Wuk Village
| Internet Type | # Households | % Households |
| Dial-Up Internet | 0 | 0.0% |
| Broadband Home | 311 | 75.8% |
| Cellular Data Only | 22 | 5.4% |
| Satellite Internet | 14 | 3.4% |
| No Internet | 63 | 15.4% |
| Total | 410 | 100.0% |
Mi Wuk Village Summary
Mi Wuk Village is a census-designated place located in Tuolumne County, California. It is situated in the Sierra Nevada Mountains, approximately 25 miles northeast of Sonora. The population was 1,485 at the 2010 census.
History
The Mi Wuk Village area was originally inhabited by the Miwok people, who were a part of the larger Miwok tribe. The Miwok were hunter-gatherers who lived in the area for thousands of years before the arrival of Europeans. The first Europeans to settle in the area were miners who arrived in the 1850s. The area was known as “Miwok Village” until the early 1900s, when it was changed to “Mi Wuk Village”.
The area was originally a logging community, and the first sawmill was built in the area in 1854. The logging industry was the main source of employment for the area until the 1950s, when the logging industry began to decline. The area then became a popular tourist destination, and the first resort was built in the area in the 1960s.
Geography
Mi Wuk Village is located at an elevation of 2,845 feet (867 m). It is situated in the Sierra Nevada Mountains, approximately 25 miles northeast of Sonora. The area is surrounded by the Stanislaus National Forest and is home to several lakes, including Pinecrest Lake, Spicer Meadow Reservoir, and Lyons Reservoir.
The climate in Mi Wuk Village is classified as warm-summer Mediterranean, with hot, dry summers and cool, wet winters. The average annual temperature is 54°F (12°C), and the average annual precipitation is 33 inches (84 cm).
Economy
The economy of Mi Wuk Village is largely based on tourism. The area is home to several resorts, including the Mi Wuk Village Resort and the Pinecrest Lake Resort. The area is also home to several restaurants, shops, and other businesses.
The area is also home to several logging companies, which provide employment for many of the residents. The logging industry is the main source of employment for the area, and it is estimated that approximately 25% of the population is employed in the logging industry.
Demographics
As of the 2010 census, there were 1,485 people, 645 households, and 431 families residing in Mi Wuk Village. The population density was 545.3 people per square mile (210.9/km2). The racial makeup of the CDP was 94.2% White, 0.3% African American, 0.7% Native American, 0.7% Asian, 0.1% Pacific Islander, 1.2% from other races, and 2.9% from two or more races. Hispanic or Latino of any race were 5.2% of the population.
The median income for a household in the CDP was $37,500, and the median income for a family was $45,000. Males had a median income of $31,250 versus $25,000 for females. The per capita income for the CDP was $19,845. About 8.3% of families and 11.2% of the population were below the poverty line, including 16.7% of those under age 18 and none of those age 65 or over.
Common Questions
What is Per Capita Income in Mi Wuk Village?
Per Capita income in Mi Wuk Village is $48,651.
What is the Median Family Income in Mi Wuk Village?
Median Family Income in Mi Wuk Village is $146,300.
What is the Median Household income in Mi Wuk Village?
Median Household Income in Mi Wuk Village is $91,848.
What is Income or Wage Gap in Mi Wuk Village?
Income or Wage Gap in Mi Wuk Village is 42.6%.
Women in Mi Wuk Village earn 57.4 cents for every dollar earned by a man.
What is Inequality or Gini Index in Mi Wuk Village?
Inequality or Gini Index in Mi Wuk Village is 0.32.
What is the Total Population of Mi Wuk Village?
Total Population of Mi Wuk Village is 1,010.
What is the Total Male Population of Mi Wuk Village?
Total Male Population of Mi Wuk Village is 503.
What is the Total Female Population of Mi Wuk Village?
Total Female Population of Mi Wuk Village is 507.
What is the Ratio of Males per 100 Females in Mi Wuk Village?
There are 99.21 Males per 100 Females in Mi Wuk Village.
What is the Ratio of Females per 100 Males in Mi Wuk Village?
There are 100.80 Females per 100 Males in Mi Wuk Village.
What is the Median Population Age in Mi Wuk Village?
Median Population Age in Mi Wuk Village is 53.6 Years.
What is the Average Family Size in Mi Wuk Village
Average Family Size in Mi Wuk Village is 3.1 People.
What is the Average Household Size in Mi Wuk Village
Average Household Size in Mi Wuk Village is 2.5 People.
How Large is the Labor Force in Mi Wuk Village?
There are 515 People in the Labor Forcein in Mi Wuk Village.
What is the Percentage of People in the Labor Force in Mi Wuk Village?
57.0% of People are in the Labor Force in Mi Wuk Village.
What is the Unemployment Rate in Mi Wuk Village?
Unemployment Rate in Mi Wuk Village is 13.6%.