Cities with the Highest Percentage of Population Employed in Security & Protection in Massachusetts
RELATED REPORTS & OPTIONS
Security & Protection
Massachusetts
Compare Cities
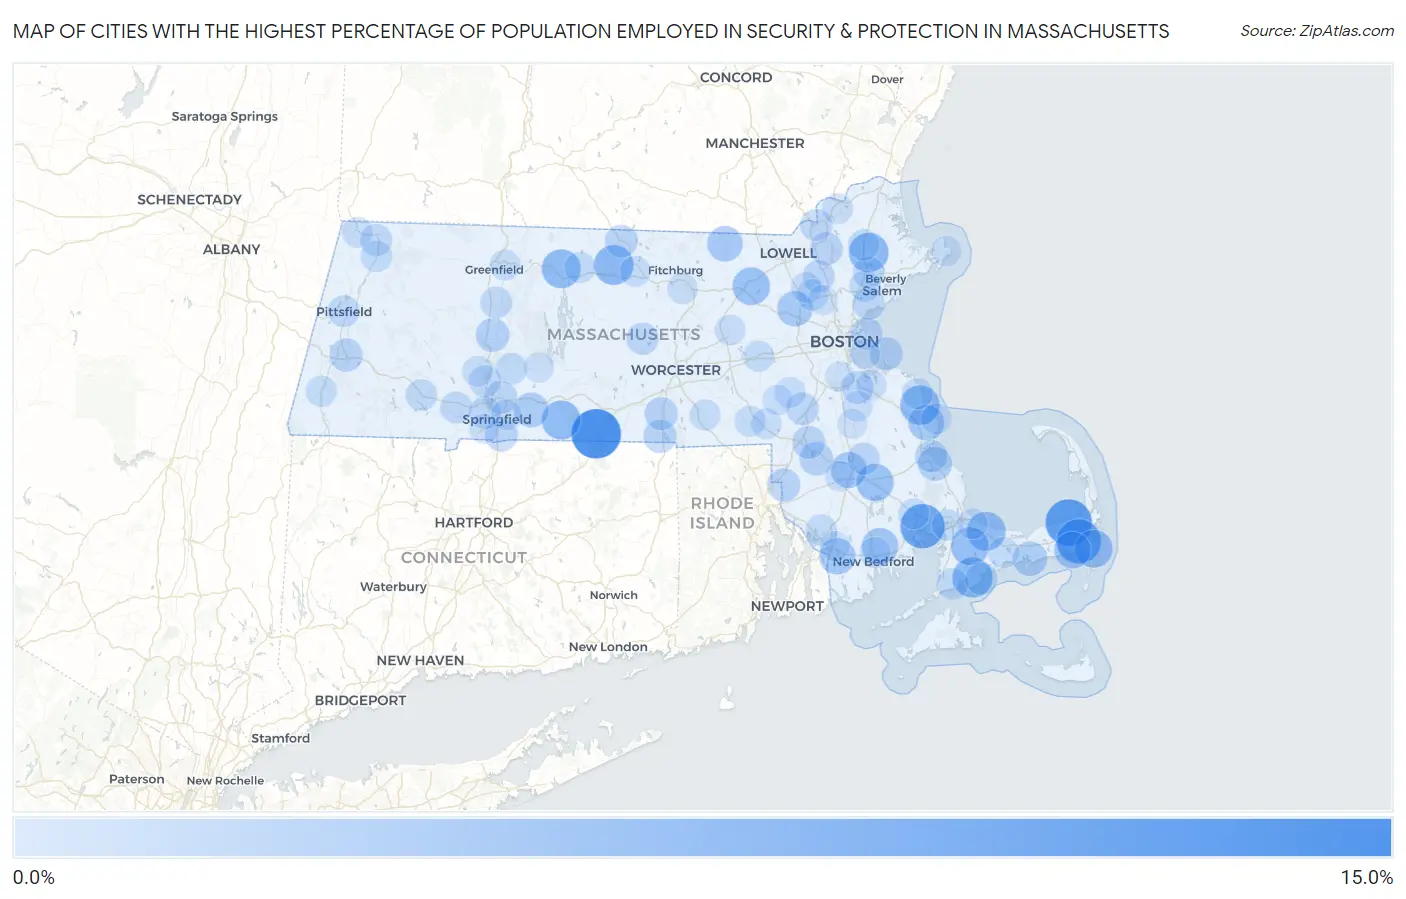
Map of Cities with the Highest Percentage of Population Employed in Security & Protection in Massachusetts
0.0%
15.0%
Cities with the Highest Percentage of Population Employed in Security & Protection in Massachusetts
| City | % Employed | vs State | vs National | |
| 1. | Holland | 11.4% | 2.0%(+9.43)#1 | 2.1%(+9.29)#843 |
| 2. | Brewster | 9.9% | 2.0%(+7.86)#2 | 2.1%(+7.73)#1,117 |
| 3. | East Harwich | 8.9% | 2.0%(+6.92)#3 | 2.1%(+6.78)#1,356 |
| 4. | Wareham Center | 8.9% | 2.0%(+6.87)#4 | 2.1%(+6.74)#1,371 |
| 5. | Oak Bluffs | 8.7% | 2.0%(+6.73)#5 | 2.1%(+6.60)#1,410 |
| 6. | Cedar Crest | 7.4% | 2.0%(+5.37)#6 | 2.1%(+5.23)#1,914 |
| 7. | Seabrook | 6.8% | 2.0%(+4.82)#7 | 2.1%(+4.68)#2,172 |
| 8. | Baldwinville | 6.6% | 2.0%(+4.63)#8 | 2.1%(+4.50)#2,282 |
| 9. | Topsfield | 6.5% | 2.0%(+4.53)#9 | 2.1%(+4.40)#2,332 |
| 10. | Marshfield Hills | 6.5% | 2.0%(+4.53)#10 | 2.1%(+4.39)#2,336 |
| 11. | Monson Center | 6.3% | 2.0%(+4.28)#11 | 2.1%(+4.14)#2,499 |
| 12. | Orange | 6.3% | 2.0%(+4.27)#12 | 2.1%(+4.13)#2,507 |
| 13. | East Sandwich | 6.2% | 2.0%(+4.14)#13 | 2.1%(+4.01)#2,585 |
| 14. | Forestdale | 5.9% | 2.0%(+3.88)#14 | 2.1%(+3.75)#2,796 |
| 15. | Chatham | 5.8% | 2.0%(+3.75)#15 | 2.1%(+3.61)#2,921 |
| 16. | Littleton Common | 5.6% | 2.0%(+3.58)#16 | 2.1%(+3.44)#3,066 |
| 17. | Middleborough Center | 5.5% | 2.0%(+3.51)#17 | 2.1%(+3.37)#3,136 |
| 18. | Harwich Port | 5.2% | 2.0%(+3.15)#18 | 2.1%(+3.01)#3,517 |
| 19. | Acushnet Center | 5.1% | 2.0%(+3.10)#19 | 2.1%(+2.96)#3,576 |
| 20. | North Westport | 4.9% | 2.0%(+2.90)#20 | 2.1%(+2.76)#3,796 |
| 21. | Raynham Center | 4.8% | 2.0%(+2.79)#21 | 2.1%(+2.65)#3,926 |
| 22. | Marshfield | 4.8% | 2.0%(+2.75)#22 | 2.1%(+2.61)#3,954 |
| 23. | Pepperell | 4.6% | 2.0%(+2.60)#23 | 2.1%(+2.47)#4,158 |
| 24. | Hanscom Afb | 4.6% | 2.0%(+2.55)#24 | 2.1%(+2.41)#4,231 |
| 25. | Wilbraham | 4.3% | 2.0%(+2.28)#25 | 2.1%(+2.15)#4,616 |
| 26. | West Yarmouth | 4.2% | 2.0%(+2.17)#26 | 2.1%(+2.04)#4,776 |
| 27. | Plymouth | 4.0% | 2.0%(+1.99)#27 | 2.1%(+1.86)#5,080 |
| 28. | Hatfield | 3.8% | 2.0%(+1.76)#28 | 2.1%(+1.63)#5,543 |
| 29. | Norton Center | 3.7% | 2.0%(+1.64)#29 | 2.1%(+1.51)#5,817 |
| 30. | Webster | 3.5% | 2.0%(+1.52)#30 | 2.1%(+1.38)#6,049 |
| 31. | Lee | 3.5% | 2.0%(+1.52)#31 | 2.1%(+1.38)#6,050 |
| 32. | Oxford | 3.5% | 2.0%(+1.51)#32 | 2.1%(+1.38)#6,061 |
| 33. | North Seekonk | 3.5% | 2.0%(+1.51)#33 | 2.1%(+1.37)#6,066 |
| 34. | Hull | 3.5% | 2.0%(+1.49)#34 | 2.1%(+1.36)#6,106 |
| 35. | Mansfield Center | 3.4% | 2.0%(+1.44)#35 | 2.1%(+1.30)#6,239 |
| 36. | Andover | 3.4% | 2.0%(+1.37)#36 | 2.1%(+1.24)#6,419 |
| 37. | Longmeadow | 3.3% | 2.0%(+1.33)#37 | 2.1%(+1.19)#6,516 |
| 38. | Winchendon | 3.3% | 2.0%(+1.30)#38 | 2.1%(+1.16)#6,607 |
| 39. | Walpole | 3.2% | 2.0%(+1.23)#39 | 2.1%(+1.10)#6,749 |
| 40. | North Plymouth | 3.2% | 2.0%(+1.21)#40 | 2.1%(+1.08)#6,796 |
| 41. | Chicopee | 3.2% | 2.0%(+1.17)#41 | 2.1%(+1.03)#6,919 |
| 42. | Bridgewater Town | 3.2% | 2.0%(+1.15)#42 | 2.1%(+1.02)#6,963 |
| 43. | Braintree Town | 3.2% | 2.0%(+1.14)#43 | 2.1%(+1.00)#6,996 |
| 44. | Popponesset | 3.1% | 2.0%(+1.12)#44 | 2.1%(+0.991)#7,047 |
| 45. | Rutland | 3.1% | 2.0%(+1.09)#45 | 2.1%(+0.958)#7,143 |
| 46. | Winthrop Town | 3.1% | 2.0%(+1.08)#46 | 2.1%(+0.942)#7,190 |
| 47. | West Springfield Town | 3.1% | 2.0%(+1.07)#47 | 2.1%(+0.932)#7,223 |
| 48. | Lynn | 3.0% | 2.0%(+1.03)#48 | 2.1%(+0.893)#7,343 |
| 49. | Methuen Town | 3.0% | 2.0%(+0.999)#49 | 2.1%(+0.865)#7,449 |
| 50. | Wilmington | 3.0% | 2.0%(+0.979)#50 | 2.1%(+0.845)#7,521 |
| 51. | Danvers | 2.9% | 2.0%(+0.922)#51 | 2.1%(+0.787)#7,703 |
| 52. | Westfield | 2.9% | 2.0%(+0.914)#52 | 2.1%(+0.779)#7,728 |
| 53. | Holyoke | 2.9% | 2.0%(+0.906)#53 | 2.1%(+0.772)#7,755 |
| 54. | North Adams | 2.9% | 2.0%(+0.881)#54 | 2.1%(+0.747)#7,836 |
| 55. | South Deerfield | 2.9% | 2.0%(+0.870)#55 | 2.1%(+0.735)#7,884 |
| 56. | Pittsfield | 2.9% | 2.0%(+0.854)#56 | 2.1%(+0.719)#7,930 |
| 57. | Blandford | 2.8% | 2.0%(+0.795)#57 | 2.1%(+0.661)#8,121 |
| 58. | Teaticket | 2.8% | 2.0%(+0.775)#58 | 2.1%(+0.641)#8,186 |
| 59. | Burlington | 2.8% | 2.0%(+0.768)#59 | 2.1%(+0.633)#8,212 |
| 60. | Adams | 2.8% | 2.0%(+0.742)#60 | 2.1%(+0.608)#8,294 |
| 61. | Granby | 2.7% | 2.0%(+0.714)#61 | 2.1%(+0.580)#8,376 |
| 62. | Buzzards Bay | 2.7% | 2.0%(+0.677)#62 | 2.1%(+0.543)#8,525 |
| 63. | Somerset | 2.7% | 2.0%(+0.677)#63 | 2.1%(+0.542)#8,527 |
| 64. | Peabody | 2.7% | 2.0%(+0.652)#64 | 2.1%(+0.518)#8,601 |
| 65. | Boxford | 2.7% | 2.0%(+0.640)#65 | 2.1%(+0.506)#8,636 |
| 66. | Athol | 2.7% | 2.0%(+0.640)#66 | 2.1%(+0.505)#8,638 |
| 67. | Great Barrington | 2.6% | 2.0%(+0.593)#67 | 2.1%(+0.458)#8,801 |
| 68. | West Wareham | 2.6% | 2.0%(+0.536)#68 | 2.1%(+0.402)#9,016 |
| 69. | Barnstable Town | 2.5% | 2.0%(+0.522)#69 | 2.1%(+0.388)#9,065 |
| 70. | Amherst | 2.5% | 2.0%(+0.519)#70 | 2.1%(+0.384)#9,081 |
| 71. | Whitinsville | 2.5% | 2.0%(+0.509)#71 | 2.1%(+0.375)#9,115 |
| 72. | Framingham | 2.5% | 2.0%(+0.502)#72 | 2.1%(+0.367)#9,150 |
| 73. | Scituate | 2.5% | 2.0%(+0.500)#73 | 2.1%(+0.366)#9,159 |
| 74. | Gardner | 2.5% | 2.0%(+0.491)#74 | 2.1%(+0.357)#9,189 |
| 75. | Bellingham | 2.5% | 2.0%(+0.484)#75 | 2.1%(+0.349)#9,218 |
| 76. | Medfield | 2.5% | 2.0%(+0.462)#76 | 2.1%(+0.327)#9,300 |
| 77. | New Bedford | 2.5% | 2.0%(+0.457)#77 | 2.1%(+0.322)#9,321 |
| 78. | Haverhill | 2.4% | 2.0%(+0.425)#78 | 2.1%(+0.290)#9,446 |
| 79. | Pinehurst | 2.4% | 2.0%(+0.422)#79 | 2.1%(+0.288)#9,453 |
| 80. | Franklin Town | 2.4% | 2.0%(+0.410)#80 | 2.1%(+0.275)#9,486 |
| 81. | Easthampton Town | 2.4% | 2.0%(+0.409)#81 | 2.1%(+0.275)#9,489 |
| 82. | Leominster | 2.4% | 2.0%(+0.398)#82 | 2.1%(+0.264)#9,537 |
| 83. | Sandwich | 2.4% | 2.0%(+0.387)#83 | 2.1%(+0.252)#9,590 |
| 84. | Williamstown | 2.4% | 2.0%(+0.376)#84 | 2.1%(+0.242)#9,641 |
| 85. | Turners Falls | 2.4% | 2.0%(+0.369)#85 | 2.1%(+0.235)#9,659 |
| 86. | Hudson | 2.4% | 2.0%(+0.342)#86 | 2.1%(+0.208)#9,772 |
| 87. | Springfield | 2.3% | 2.0%(+0.334)#87 | 2.1%(+0.199)#9,805 |
| 88. | Ocean Bluff Brant Rock | 2.3% | 2.0%(+0.326)#88 | 2.1%(+0.191)#9,840 |
| 89. | Holbrook | 2.3% | 2.0%(+0.309)#89 | 2.1%(+0.174)#9,914 |
| 90. | Taunton | 2.2% | 2.0%(+0.233)#90 | 2.1%(+0.099)#10,214 |
| 91. | Weymouth Town | 2.2% | 2.0%(+0.228)#91 | 2.1%(+0.094)#10,244 |
| 92. | Boston | 2.2% | 2.0%(+0.189)#92 | 2.1%(+0.054)#10,423 |
| 93. | Rockport | 2.2% | 2.0%(+0.187)#93 | 2.1%(+0.053)#10,431 |
| 94. | Millis Clicquot | 2.2% | 2.0%(+0.185)#94 | 2.1%(+0.051)#10,440 |
| 95. | Milton | 2.2% | 2.0%(+0.158)#95 | 2.1%(+0.023)#10,576 |
| 96. | Belchertown | 2.2% | 2.0%(+0.154)#96 | 2.1%(+0.019)#10,589 |
| 97. | Fall River | 2.2% | 2.0%(+0.144)#97 | 2.1%(+0.010)#10,635 |
| 98. | Woburn | 2.1% | 2.0%(+0.136)#98 | 2.1%(+0.002)#10,675 |
| 99. | Agawam Town | 2.1% | 2.0%(+0.092)#99 | 2.1%(-0.042)#10,854 |
| 100. | Brockton | 2.1% | 2.0%(+0.083)#100 | 2.1%(-0.052)#10,893 |
Common Questions
What are the Top 10 Cities with the Highest Percentage of Population Employed in Security & Protection in Massachusetts?
Top 10 Cities with the Highest Percentage of Population Employed in Security & Protection in Massachusetts are:
#1
11.4%
#2
9.9%
#3
8.9%
#4
8.9%
#5
6.8%
#6
6.6%
#7
6.5%
#8
6.5%
#9
6.3%
#10
6.3%
What city has the Highest Percentage of Population Employed in Security & Protection in Massachusetts?
Holland has the Highest Percentage of Population Employed in Security & Protection in Massachusetts with 11.4%.
What is the Percentage of Population Employed in Security & Protection in the State of Massachusetts?
Percentage of Population Employed in Security & Protection in Massachusetts is 2.0%.
What is the Percentage of Population Employed in Security & Protection in the United States?
Percentage of Population Employed in Security & Protection in the United States is 2.1%.