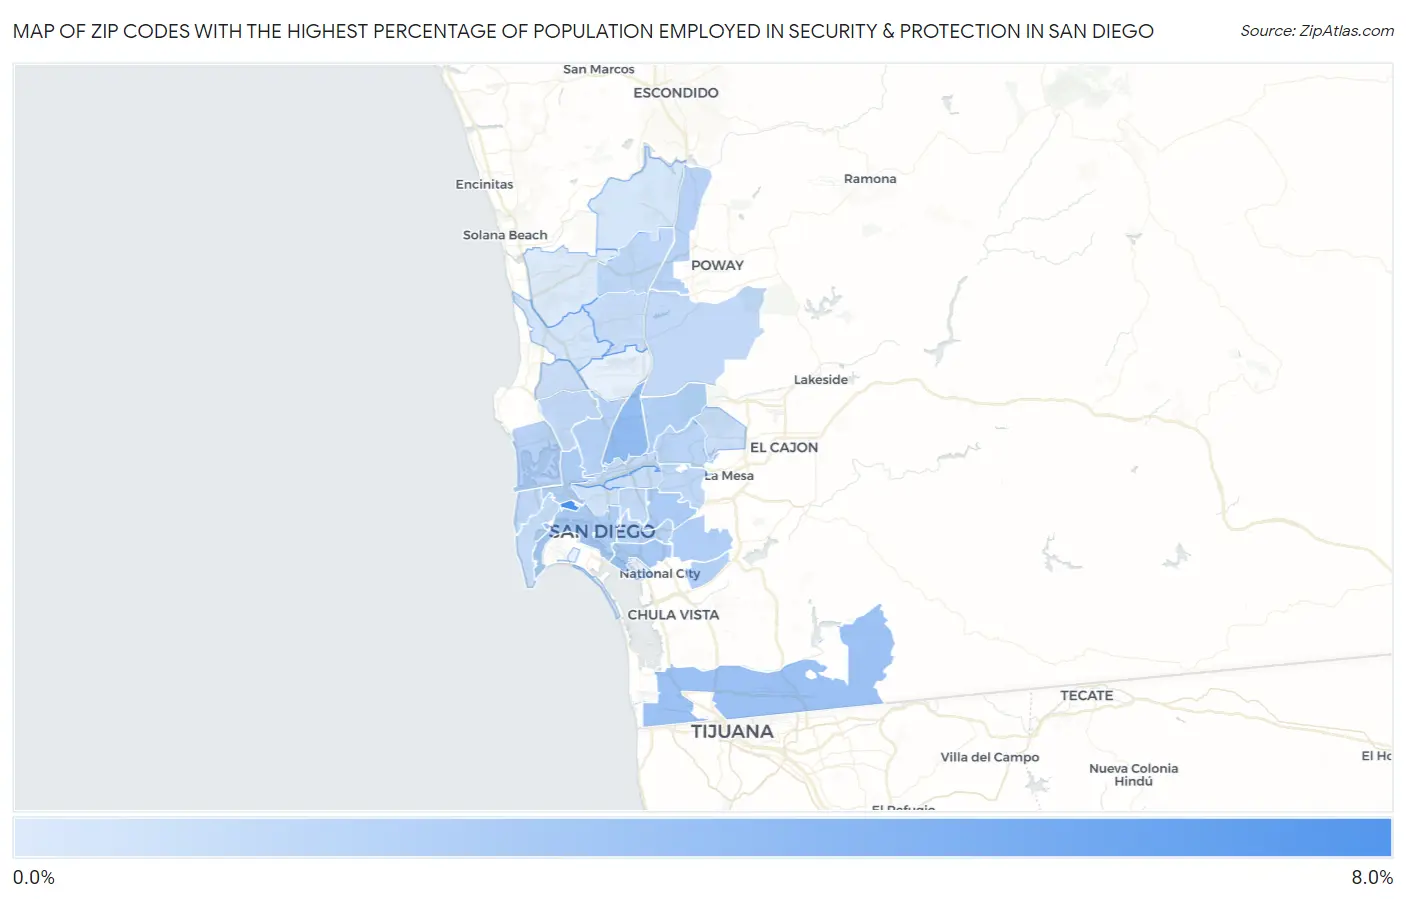
Zip Codes with the Highest Percentage of Population Employed in Security & Protection in San Diego, CA
RELATED REPORTS & OPTIONS
Security & Protection
San Diego
Compare Zip Codes
Map of Zip Codes with the Highest Percentage of Population Employed in Security & Protection in San Diego
0.22%
8.0%

Zip Codes with the Highest Percentage of Population Employed in Security & Protection in San Diego, CA
| Zip Code | % Employed | vs State | vs National | |
| 1. | 92140 | 8.0% | 2.1%(+5.89)#60 | 2.1%(+5.82)#1,179 |
| 2. | 92123 | 3.9% | 2.1%(+1.85)#217 | 2.1%(+1.78)#4,626 |
| 3. | 92154 | 3.4% | 2.1%(+1.36)#285 | 2.1%(+1.29)#5,831 |
| 4. | 92113 | 2.9% | 2.1%(+0.866)#390 | 2.1%(+0.798)#7,450 |
| 5. | 92105 | 2.6% | 2.1%(+0.530)#483 | 2.1%(+0.462)#8,957 |
| 6. | 92110 | 2.6% | 2.1%(+0.486)#500 | 2.1%(+0.418)#9,174 |
| 7. | 92114 | 2.5% | 2.1%(+0.377)#530 | 2.1%(+0.309)#9,750 |
| 8. | 92101 | 2.4% | 2.1%(+0.345)#543 | 2.1%(+0.278)#9,924 |
| 9. | 92139 | 2.3% | 2.1%(+0.210)#587 | 2.1%(+0.142)#10,702 |
| 10. | 92124 | 2.3% | 2.1%(+0.205)#591 | 2.1%(+0.137)#10,734 |
| 11. | 92111 | 2.2% | 2.1%(+0.158)#606 | 2.1%(+0.090)#11,022 |
| 12. | 92109 | 2.1% | 2.1%(+0.033)#659 | 2.1%(-0.035)#11,815 |
| 13. | 92128 | 2.1% | 2.1%(-0.023)#684 | 2.1%(-0.091)#12,200 |
| 14. | 92102 | 2.1% | 2.1%(-0.028)#690 | 2.1%(-0.096)#12,235 |
| 15. | 92120 | 2.0% | 2.1%(-0.099)#721 | 2.1%(-0.166)#12,675 |
| 16. | 92115 | 1.7% | 2.1%(-0.370)#846 | 2.1%(-0.438)#14,599 |
| 17. | 92129 | 1.7% | 2.1%(-0.404)#858 | 2.1%(-0.472)#14,852 |
| 18. | 92117 | 1.6% | 2.1%(-0.443)#880 | 2.1%(-0.511)#15,131 |
| 19. | 92107 | 1.6% | 2.1%(-0.492)#905 | 2.1%(-0.560)#15,490 |
| 20. | 92131 | 1.6% | 2.1%(-0.510)#914 | 2.1%(-0.578)#15,640 |
| 21. | 92104 | 1.5% | 2.1%(-0.537)#928 | 2.1%(-0.605)#15,851 |
| 22. | 92106 | 1.5% | 2.1%(-0.589)#959 | 2.1%(-0.657)#16,280 |
| 23. | 92108 | 1.4% | 2.1%(-0.650)#982 | 2.1%(-0.718)#16,732 |
| 24. | 92126 | 1.2% | 2.1%(-0.834)#1,074 | 2.1%(-0.902)#18,146 |
| 25. | 92116 | 1.2% | 2.1%(-0.863)#1,088 | 2.1%(-0.930)#18,378 |
| 26. | 92119 | 1.2% | 2.1%(-0.916)#1,111 | 2.1%(-0.984)#18,782 |
| 27. | 92122 | 1.1% | 2.1%(-0.988)#1,142 | 2.1%(-1.06)#19,337 |
| 28. | 92103 | 0.90% | 2.1%(-1.18)#1,218 | 2.1%(-1.25)#20,770 |
| 29. | 92121 | 0.73% | 2.1%(-1.35)#1,276 | 2.1%(-1.42)#21,888 |
| 30. | 92127 | 0.61% | 2.1%(-1.47)#1,319 | 2.1%(-1.54)#22,622 |
| 31. | 92130 | 0.22% | 2.1%(-1.86)#1,406 | 2.1%(-1.93)#24,458 |
1
Common Questions
What are the Top 10 Zip Codes with the Highest Percentage of Population Employed in Security & Protection in San Diego, CA?
Top 10 Zip Codes with the Highest Percentage of Population Employed in Security & Protection in San Diego, CA are:
What zip code has the Highest Percentage of Population Employed in Security & Protection in San Diego, CA?
92140 has the Highest Percentage of Population Employed in Security & Protection in San Diego, CA with 8.0%.
What is the Percentage of Population Employed in Security & Protection in San Diego, CA?
Percentage of Population Employed in Security & Protection in San Diego is 1.9%.
What is the Percentage of Population Employed in Security & Protection in California?
Percentage of Population Employed in Security & Protection in California is 2.1%.
What is the Percentage of Population Employed in Security & Protection in the United States?
Percentage of Population Employed in Security & Protection in the United States is 2.1%.