Cities with the Highest Percentage of Population Employed in Security & Protection in South Carolina
RELATED REPORTS & OPTIONS
Security & Protection
South Carolina
Compare Cities
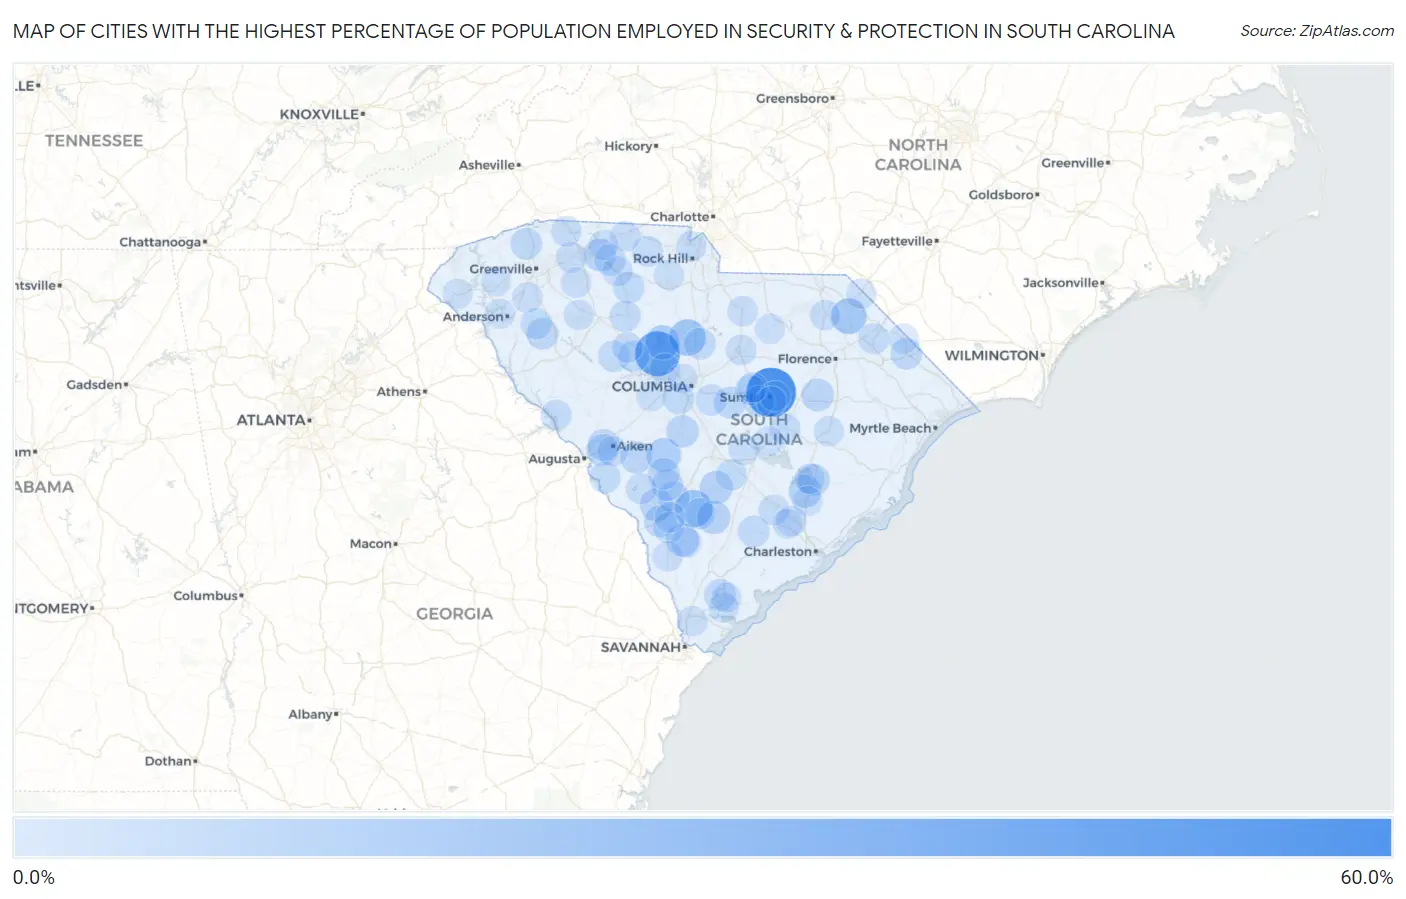
Map of Cities with the Highest Percentage of Population Employed in Security & Protection in South Carolina
0.0%
60.0%
Cities with the Highest Percentage of Population Employed in Security & Protection in South Carolina
| City | % Employed | vs State | vs National | |
| 1. | Mulberry | 53.6% | 2.1%(+51.5)#1 | 2.1%(+51.4)#24 |
| 2. | Peak | 41.2% | 2.1%(+39.1)#2 | 2.1%(+39.0)#61 |
| 3. | Ehrhardt | 21.7% | 2.1%(+19.6)#3 | 2.1%(+19.5)#238 |
| 4. | Winnsboro Mills | 19.3% | 2.1%(+17.2)#4 | 2.1%(+17.2)#295 |
| 5. | Blenheim | 17.2% | 2.1%(+15.1)#5 | 2.1%(+15.1)#370 |
| 6. | Jenkinsville | 14.3% | 2.1%(+12.2)#6 | 2.1%(+12.1)#546 |
| 7. | Centenary | 13.9% | 2.1%(+11.8)#7 | 2.1%(+11.7)#573 |
| 8. | Springfield | 13.3% | 2.1%(+11.2)#8 | 2.1%(+11.2)#626 |
| 9. | Williams | 11.1% | 2.1%(+9.01)#9 | 2.1%(+8.96)#899 |
| 10. | Branchville | 10.7% | 2.1%(+8.59)#10 | 2.1%(+8.55)#971 |
| 11. | Hampton | 10.5% | 2.1%(+8.42)#11 | 2.1%(+8.37)#1,013 |
| 12. | Pinopolis | 10.1% | 2.1%(+8.03)#12 | 2.1%(+7.98)#1,077 |
| 13. | Kline | 10.0% | 2.1%(+7.90)#13 | 2.1%(+7.85)#1,095 |
| 14. | Glendale | 9.8% | 2.1%(+7.72)#14 | 2.1%(+7.67)#1,132 |
| 15. | Olanta | 9.5% | 2.1%(+7.42)#15 | 2.1%(+7.38)#1,189 |
| 16. | Hilltop | 9.0% | 2.1%(+6.95)#16 | 2.1%(+6.90)#1,322 |
| 17. | Woodford | 9.0% | 2.1%(+6.86)#17 | 2.1%(+6.81)#1,343 |
| 18. | North Santee | 8.8% | 2.1%(+6.74)#18 | 2.1%(+6.70)#1,383 |
| 19. | Grover | 8.5% | 2.1%(+6.35)#19 | 2.1%(+6.30)#1,502 |
| 20. | Bonneau | 8.0% | 2.1%(+5.88)#20 | 2.1%(+5.83)#1,666 |
| 21. | Windsor | 7.9% | 2.1%(+5.79)#21 | 2.1%(+5.75)#1,687 |
| 22. | Graniteville | 7.8% | 2.1%(+5.74)#22 | 2.1%(+5.69)#1,714 |
| 23. | Allendale | 7.8% | 2.1%(+5.72)#23 | 2.1%(+5.67)#1,718 |
| 24. | Gloverville | 7.8% | 2.1%(+5.70)#24 | 2.1%(+5.65)#1,728 |
| 25. | Eastover | 7.7% | 2.1%(+5.56)#25 | 2.1%(+5.51)#1,777 |
| 26. | Adams Run | 7.6% | 2.1%(+5.49)#26 | 2.1%(+5.44)#1,804 |
| 27. | Olar | 7.4% | 2.1%(+5.31)#27 | 2.1%(+5.26)#1,901 |
| 28. | Hilda | 7.4% | 2.1%(+5.28)#28 | 2.1%(+5.23)#1,912 |
| 29. | Donalds | 7.3% | 2.1%(+5.20)#29 | 2.1%(+5.15)#1,946 |
| 30. | Blackville | 7.3% | 2.1%(+5.18)#30 | 2.1%(+5.13)#1,952 |
| 31. | Laurel Bay | 7.2% | 2.1%(+5.08)#31 | 2.1%(+5.03)#1,988 |
| 32. | Slater Marietta | 7.2% | 2.1%(+5.06)#32 | 2.1%(+5.01)#1,993 |
| 33. | Nichols | 7.1% | 2.1%(+5.04)#33 | 2.1%(+4.99)#2,007 |
| 34. | Ridgeway | 7.0% | 2.1%(+4.88)#34 | 2.1%(+4.83)#2,089 |
| 35. | Cottageville | 6.9% | 2.1%(+4.80)#35 | 2.1%(+4.75)#2,135 |
| 36. | Silverstreet | 6.8% | 2.1%(+4.68)#36 | 2.1%(+4.63)#2,199 |
| 37. | Whitney | 6.5% | 2.1%(+4.41)#37 | 2.1%(+4.36)#2,353 |
| 38. | Monarch Mill | 6.5% | 2.1%(+4.37)#38 | 2.1%(+4.32)#2,376 |
| 39. | Daviston | 6.5% | 2.1%(+4.35)#39 | 2.1%(+4.30)#2,392 |
| 40. | South Congaree | 6.3% | 2.1%(+4.16)#40 | 2.1%(+4.11)#2,518 |
| 41. | Prosperity | 6.2% | 2.1%(+4.13)#41 | 2.1%(+4.08)#2,542 |
| 42. | Central Pacolet | 6.2% | 2.1%(+4.05)#42 | 2.1%(+4.01)#2,589 |
| 43. | Honea Path | 6.1% | 2.1%(+3.97)#43 | 2.1%(+3.92)#2,647 |
| 44. | Manning | 6.1% | 2.1%(+3.96)#44 | 2.1%(+3.91)#2,665 |
| 45. | Fairfax | 6.1% | 2.1%(+3.96)#45 | 2.1%(+3.91)#2,666 |
| 46. | Hopkins | 6.1% | 2.1%(+3.95)#46 | 2.1%(+3.90)#2,669 |
| 47. | Arthurtown | 6.0% | 2.1%(+3.88)#47 | 2.1%(+3.83)#2,721 |
| 48. | Jackson | 6.0% | 2.1%(+3.87)#48 | 2.1%(+3.82)#2,736 |
| 49. | Whitmire | 5.9% | 2.1%(+3.81)#49 | 2.1%(+3.76)#2,789 |
| 50. | Lodge | 5.7% | 2.1%(+3.61)#50 | 2.1%(+3.57)#2,957 |
| 51. | Cane Savannah | 5.7% | 2.1%(+3.58)#51 | 2.1%(+3.53)#2,975 |
| 52. | Bowman | 5.6% | 2.1%(+3.51)#52 | 2.1%(+3.46)#3,048 |
| 53. | Latta | 5.6% | 2.1%(+3.50)#53 | 2.1%(+3.45)#3,054 |
| 54. | Snelling | 5.3% | 2.1%(+3.16)#54 | 2.1%(+3.11)#3,412 |
| 55. | Startex | 5.2% | 2.1%(+3.14)#55 | 2.1%(+3.09)#3,440 |
| 56. | Parksville | 5.1% | 2.1%(+3.03)#56 | 2.1%(+2.98)#3,557 |
| 57. | Hickory Grove | 5.1% | 2.1%(+2.98)#57 | 2.1%(+2.94)#3,606 |
| 58. | Ridgeville | 4.7% | 2.1%(+2.58)#58 | 2.1%(+2.53)#4,069 |
| 59. | Camden | 4.6% | 2.1%(+2.54)#59 | 2.1%(+2.49)#4,126 |
| 60. | Campobello | 4.6% | 2.1%(+2.50)#60 | 2.1%(+2.45)#4,189 |
| 61. | Woodruff | 4.5% | 2.1%(+2.35)#61 | 2.1%(+2.30)#4,388 |
| 62. | Estill | 4.4% | 2.1%(+2.34)#62 | 2.1%(+2.29)#4,402 |
| 63. | Lake Murray Of Richland | 4.4% | 2.1%(+2.31)#63 | 2.1%(+2.26)#4,458 |
| 64. | Helena | 4.4% | 2.1%(+2.28)#64 | 2.1%(+2.23)#4,492 |
| 65. | Sycamore | 4.3% | 2.1%(+2.25)#65 | 2.1%(+2.20)#4,546 |
| 66. | Stateburg | 4.3% | 2.1%(+2.24)#66 | 2.1%(+2.19)#4,559 |
| 67. | Aiken | 4.3% | 2.1%(+2.18)#67 | 2.1%(+2.13)#4,638 |
| 68. | Society Hill | 4.2% | 2.1%(+2.14)#68 | 2.1%(+2.09)#4,703 |
| 69. | Newberry | 4.2% | 2.1%(+2.10)#69 | 2.1%(+2.05)#4,764 |
| 70. | West Pelzer | 4.1% | 2.1%(+2.04)#70 | 2.1%(+1.99)#4,847 |
| 71. | Kershaw | 4.1% | 2.1%(+2.03)#71 | 2.1%(+1.98)#4,869 |
| 72. | Lincolnville | 4.1% | 2.1%(+1.95)#72 | 2.1%(+1.91)#5,003 |
| 73. | Jonesville | 4.0% | 2.1%(+1.89)#73 | 2.1%(+1.84)#5,116 |
| 74. | India Hook | 4.0% | 2.1%(+1.89)#74 | 2.1%(+1.84)#5,131 |
| 75. | East Sumter | 3.9% | 2.1%(+1.83)#75 | 2.1%(+1.78)#5,229 |
| 76. | Laurens | 3.9% | 2.1%(+1.81)#76 | 2.1%(+1.77)#5,260 |
| 77. | Varnville | 3.9% | 2.1%(+1.80)#77 | 2.1%(+1.76)#5,278 |
| 78. | Hardeeville | 3.8% | 2.1%(+1.73)#78 | 2.1%(+1.68)#5,442 |
| 79. | East Gaffney | 3.8% | 2.1%(+1.72)#79 | 2.1%(+1.67)#5,462 |
| 80. | Mccoll | 3.8% | 2.1%(+1.71)#80 | 2.1%(+1.67)#5,477 |
| 81. | Kingstree | 3.8% | 2.1%(+1.68)#81 | 2.1%(+1.63)#5,527 |
| 82. | Elloree | 3.7% | 2.1%(+1.62)#82 | 2.1%(+1.57)#5,657 |
| 83. | Lowrys | 3.7% | 2.1%(+1.60)#83 | 2.1%(+1.56)#5,701 |
| 84. | Bonneau Beach | 3.7% | 2.1%(+1.59)#84 | 2.1%(+1.54)#5,737 |
| 85. | Lake View | 3.7% | 2.1%(+1.59)#85 | 2.1%(+1.54)#5,739 |
| 86. | Cowpens | 3.7% | 2.1%(+1.57)#86 | 2.1%(+1.53)#5,766 |
| 87. | Centerville | 3.6% | 2.1%(+1.55)#87 | 2.1%(+1.50)#5,827 |
| 88. | Gilbert | 3.6% | 2.1%(+1.48)#88 | 2.1%(+1.44)#5,940 |
| 89. | Carolina Forest | 3.5% | 2.1%(+1.44)#89 | 2.1%(+1.39)#6,035 |
| 90. | Summerton | 3.5% | 2.1%(+1.39)#90 | 2.1%(+1.35)#6,134 |
| 91. | St Andrews | 3.5% | 2.1%(+1.38)#91 | 2.1%(+1.33)#6,173 |
| 92. | Moncks Corner | 3.5% | 2.1%(+1.37)#92 | 2.1%(+1.32)#6,199 |
| 93. | Westminster | 3.4% | 2.1%(+1.34)#93 | 2.1%(+1.30)#6,267 |
| 94. | Shell Point | 3.4% | 2.1%(+1.32)#94 | 2.1%(+1.27)#6,323 |
| 95. | Oakland | 3.4% | 2.1%(+1.28)#95 | 2.1%(+1.23)#6,433 |
| 96. | Bethune | 3.4% | 2.1%(+1.28)#96 | 2.1%(+1.23)#6,435 |
| 97. | Norris | 3.3% | 2.1%(+1.24)#97 | 2.1%(+1.20)#6,512 |
| 98. | South Sumter | 3.3% | 2.1%(+1.23)#98 | 2.1%(+1.18)#6,563 |
| 99. | Summerville | 3.3% | 2.1%(+1.20)#99 | 2.1%(+1.15)#6,626 |
| 100. | Beaufort | 3.3% | 2.1%(+1.18)#100 | 2.1%(+1.13)#6,683 |
Common Questions
What are the Top 10 Cities with the Highest Percentage of Population Employed in Security & Protection in South Carolina?
Top 10 Cities with the Highest Percentage of Population Employed in Security & Protection in South Carolina are:
#1
53.6%
#2
41.2%
#3
21.7%
#4
19.3%
#5
17.2%
#6
14.3%
#7
13.3%
#8
11.1%
#9
10.7%
#10
10.5%
What city has the Highest Percentage of Population Employed in Security & Protection in South Carolina?
Mulberry has the Highest Percentage of Population Employed in Security & Protection in South Carolina with 53.6%.
What is the Percentage of Population Employed in Security & Protection in the State of South Carolina?
Percentage of Population Employed in Security & Protection in South Carolina is 2.1%.
What is the Percentage of Population Employed in Security & Protection in the United States?
Percentage of Population Employed in Security & Protection in the United States is 2.1%.