Dunnigan, CA Map & Demographics
Dunnigan Map
Dunnigan Overview
$40,454
PER CAPITA INCOME
$78,594
AVG FAMILY INCOME
$42,375
AVG HOUSEHOLD INCOME
56.0%
WAGE / INCOME GAP [ % ]
44.0¢/ $1
WAGE / INCOME GAP [ $ ]
0.61
INEQUALITY / GINI INDEX
1,045
TOTAL POPULATION
520
MALE POPULATION
525
FEMALE POPULATION
99.05
MALES / 100 FEMALES
100.96
FEMALES / 100 MALES
42.0
MEDIAN AGE
3.7
AVG FAMILY SIZE
2.3
AVG HOUSEHOLD SIZE
376
LABOR FORCE [ PEOPLE ]
44.7%
PERCENT IN LABOR FORCE
Dunnigan Zip Codes
Income in Dunnigan
Income Overview in Dunnigan
Per Capita Income in Dunnigan is $40,454, while median incomes of families and households are $78,594 and $42,375 respectively.
| Characteristic | Number | Measure |
| Per Capita Income | 1,045 | $40,454 |
| Median Family Income | 191 | $78,594 |
| Mean Family Income | 191 | $153,555 |
| Median Household Income | 461 | $42,375 |
| Mean Household Income | 461 | $91,420 |
| Income Deficit | 191 | $0 |
| Wage / Income Gap (%) | 1,045 | 55.97% |
| Wage / Income Gap ($) | 1,045 | 44.03¢ per $1 |
| Gini / Inequality Index | 1,045 | 0.61 |
Earnings by Sex in Dunnigan
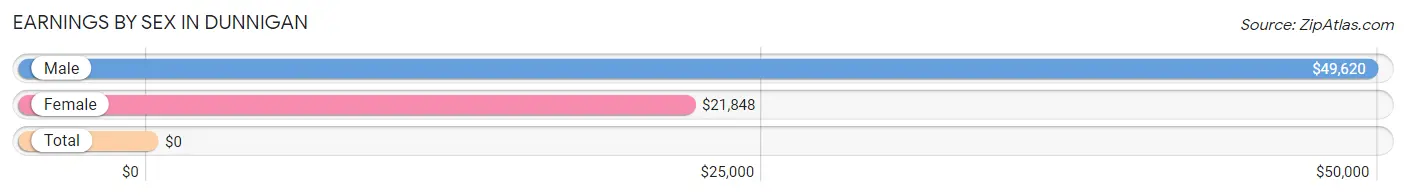
| Sex | Number | Average Earnings |
| Male | 237 (57.4%) | $49,620 |
| Female | 176 (42.6%) | $21,848 |
| Total | 413 (100.0%) | $0 |
Earnings by Sex by Income Bracket in Dunnigan
The most common earnings brackets in Dunnigan are $55,000 to $64,999 for men (33 | 13.9%) and $22,500 to $24,999 for women (39 | 22.2%).
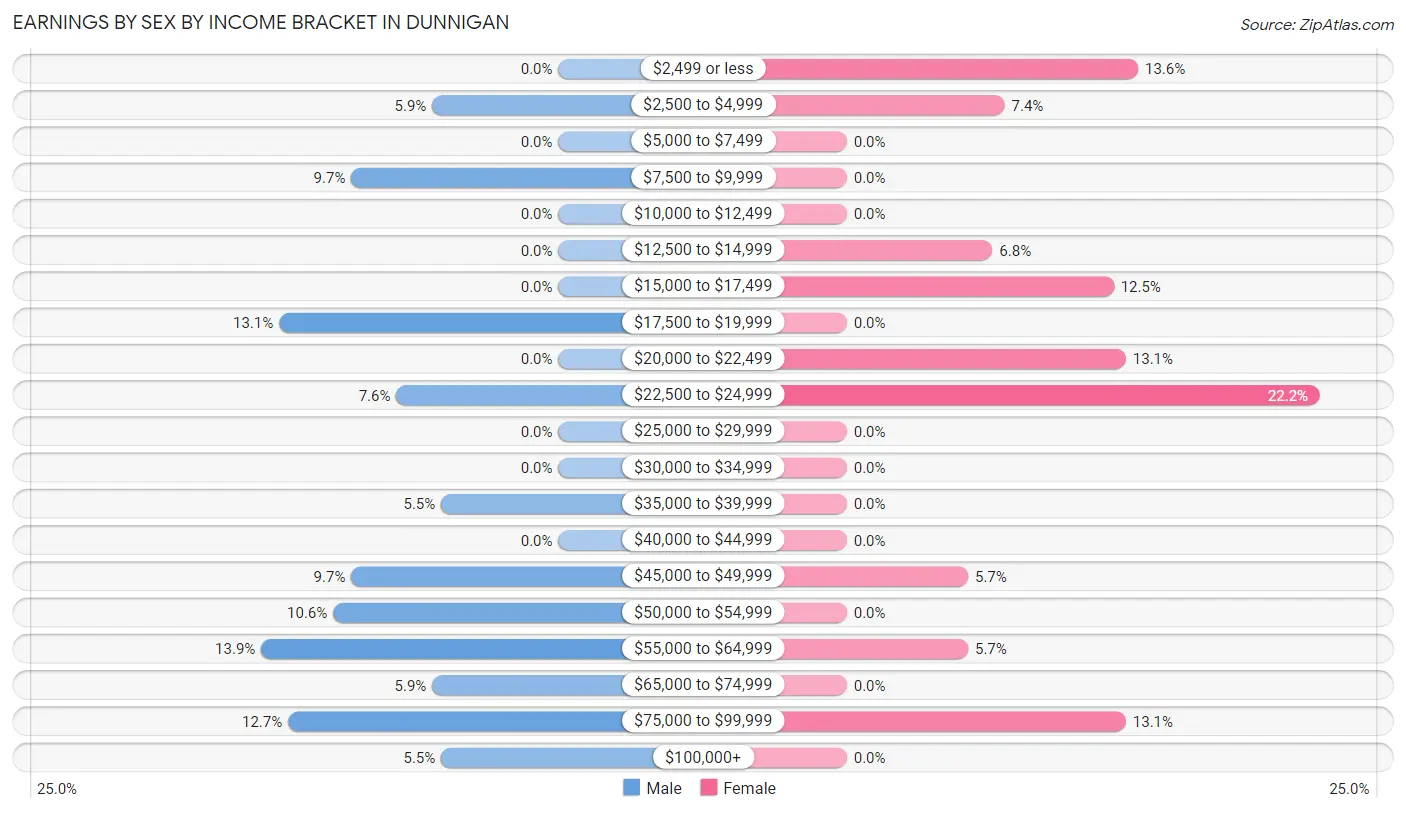
| Income | Male | Female |
| $2,499 or less | 0 (0.0%) | 24 (13.6%) |
| $2,500 to $4,999 | 14 (5.9%) | 13 (7.4%) |
| $5,000 to $7,499 | 0 (0.0%) | 0 (0.0%) |
| $7,500 to $9,999 | 23 (9.7%) | 0 (0.0%) |
| $10,000 to $12,499 | 0 (0.0%) | 0 (0.0%) |
| $12,500 to $14,999 | 0 (0.0%) | 12 (6.8%) |
| $15,000 to $17,499 | 0 (0.0%) | 22 (12.5%) |
| $17,500 to $19,999 | 31 (13.1%) | 0 (0.0%) |
| $20,000 to $22,499 | 0 (0.0%) | 23 (13.1%) |
| $22,500 to $24,999 | 18 (7.6%) | 39 (22.2%) |
| $25,000 to $29,999 | 0 (0.0%) | 0 (0.0%) |
| $30,000 to $34,999 | 0 (0.0%) | 0 (0.0%) |
| $35,000 to $39,999 | 13 (5.5%) | 0 (0.0%) |
| $40,000 to $44,999 | 0 (0.0%) | 0 (0.0%) |
| $45,000 to $49,999 | 23 (9.7%) | 10 (5.7%) |
| $50,000 to $54,999 | 25 (10.5%) | 0 (0.0%) |
| $55,000 to $64,999 | 33 (13.9%) | 10 (5.7%) |
| $65,000 to $74,999 | 14 (5.9%) | 0 (0.0%) |
| $75,000 to $99,999 | 30 (12.7%) | 23 (13.1%) |
| $100,000+ | 13 (5.5%) | 0 (0.0%) |
| Total | 237 (100.0%) | 176 (100.0%) |
Earnings by Sex by Educational Attainment in Dunnigan
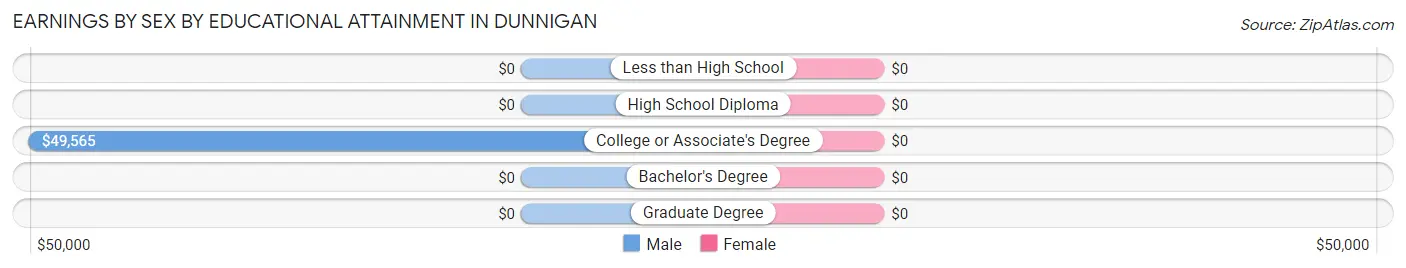
| Educational Attainment | Male Income | Female Income |
| Less than High School | - | - |
| High School Diploma | - | - |
| College or Associate's Degree | $49,565 | $0 |
| Bachelor's Degree | - | - |
| Graduate Degree | - | - |
| Total | $47,989 | $21,848 |
Family Income in Dunnigan
Family Income Brackets in Dunnigan
According to the Dunnigan family income data, there are 50 families falling into the $100,000 to $149,999 income range, which is the most common income bracket and makes up 26.2% of all families.
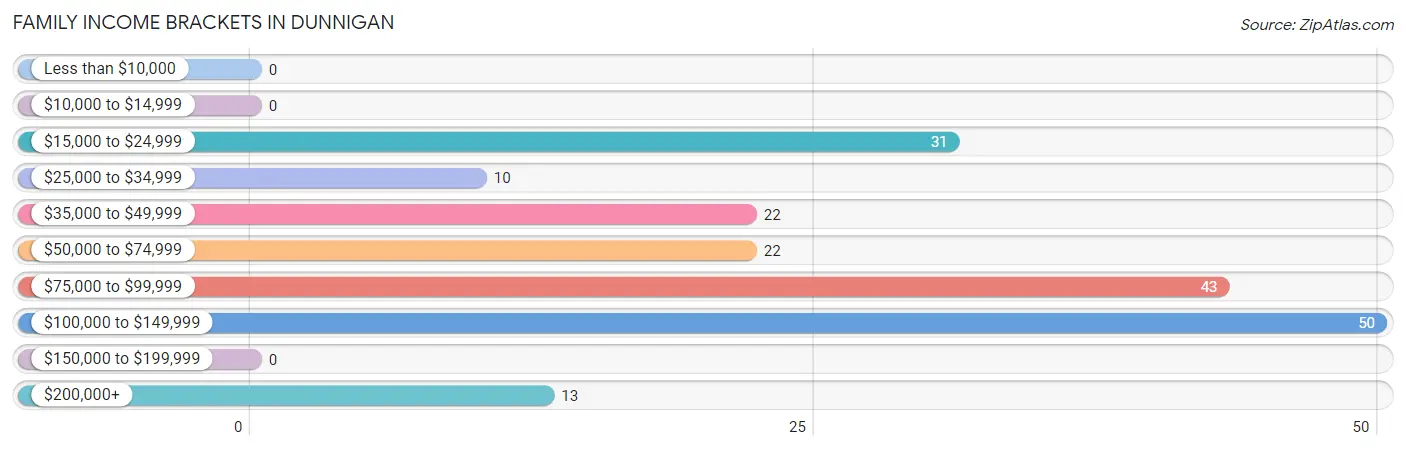
| Income Bracket | # Families | % Families |
| Less than $10,000 | 0 | 0.0% |
| $10,000 to $14,999 | 0 | 0.0% |
| $15,000 to $24,999 | 31 | 16.2% |
| $25,000 to $34,999 | 10 | 5.2% |
| $35,000 to $49,999 | 22 | 11.5% |
| $50,000 to $74,999 | 22 | 11.5% |
| $75,000 to $99,999 | 43 | 22.5% |
| $100,000 to $149,999 | 50 | 26.2% |
| $150,000 to $199,999 | 0 | 0.0% |
| $200,000+ | 13 | 6.8% |
Family Income by Famaliy Size in Dunnigan
5-person families (66 | 34.5%) account for the highest median family income in Dunnigan with $121,667 per family, while 5-person families (66 | 34.5%) have the highest median income of $24,333 per family member.
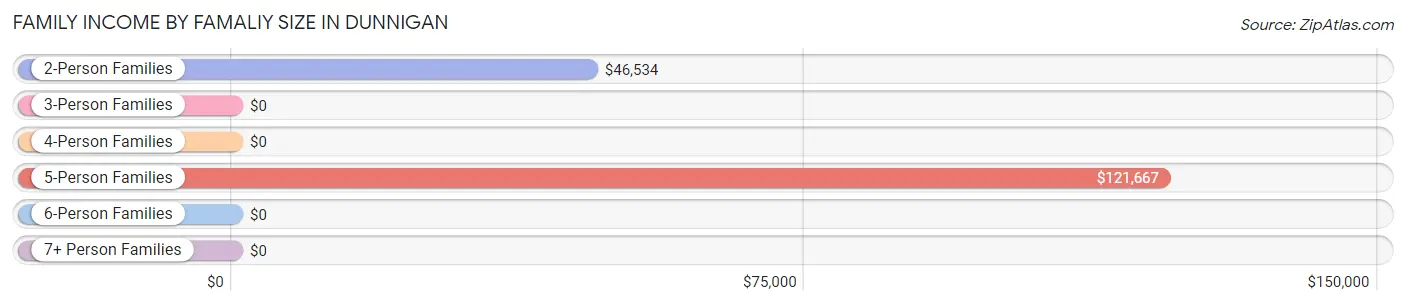
| Income Bracket | # Families | Median Income |
| 2-Person Families | 55 (28.8%) | $46,534 |
| 3-Person Families | 24 (12.6%) | $0 |
| 4-Person Families | 46 (24.1%) | $0 |
| 5-Person Families | 66 (34.5%) | $121,667 |
| 6-Person Families | 0 (0.0%) | $0 |
| 7+ Person Families | 0 (0.0%) | $0 |
| Total | 191 (100.0%) | $78,594 |
Family Income by Number of Earners in Dunnigan
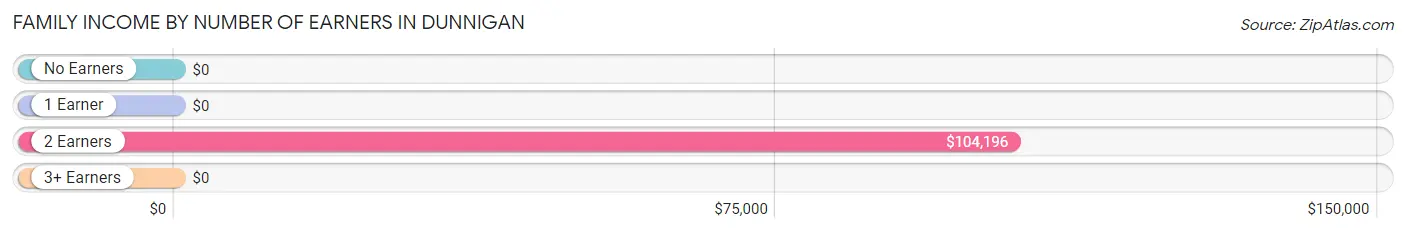
| Number of Earners | # Families | Median Income |
| No Earners | 20 (10.5%) | $0 |
| 1 Earner | 64 (33.5%) | $0 |
| 2 Earners | 107 (56.0%) | $104,196 |
| 3+ Earners | 0 (0.0%) | $0 |
| Total | 191 (100.0%) | $78,594 |
Household Income in Dunnigan
Household Income Brackets in Dunnigan
With 154 households falling in the category, the $25,000 to $34,999 income range is the most frequent in Dunnigan, accounting for 33.4% of all households. In contrast, only 12 households (2.6%) fall into the $10,000 to $14,999 income bracket, making it the least populous group.
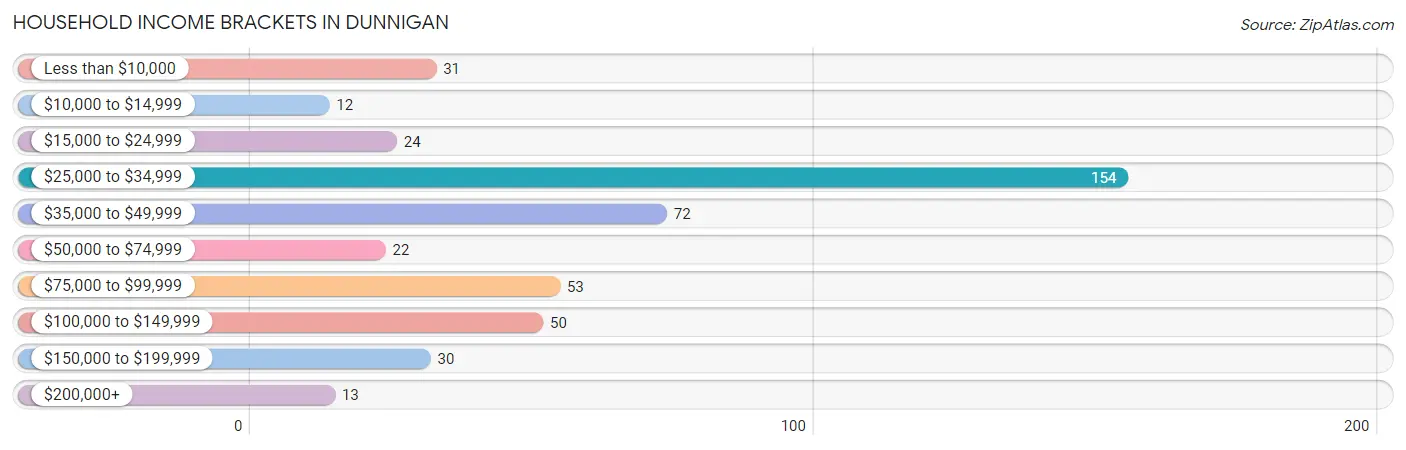
| Income Bracket | # Households | % Households |
| Less than $10,000 | 31 | 6.7% |
| $10,000 to $14,999 | 12 | 2.6% |
| $15,000 to $24,999 | 24 | 5.2% |
| $25,000 to $34,999 | 154 | 33.4% |
| $35,000 to $49,999 | 72 | 15.6% |
| $50,000 to $74,999 | 22 | 4.8% |
| $75,000 to $99,999 | 53 | 11.5% |
| $100,000 to $149,999 | 50 | 10.8% |
| $150,000 to $199,999 | 30 | 6.5% |
| $200,000+ | 13 | 2.8% |
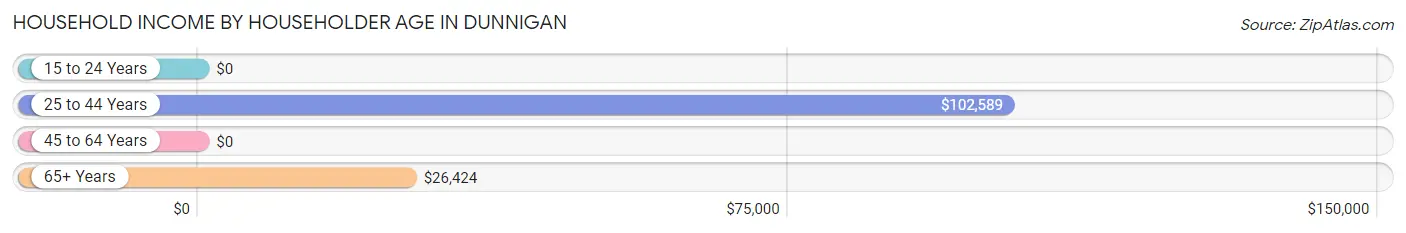
Household Income by Householder Age in Dunnigan
The median household income in Dunnigan is $42,375, with the highest median household income of $102,589 found in the 25 to 44 years age bracket for the primary householder. A total of 125 households (27.1%) fall into this category. Meanwhile, the 15 to 24 years age bracket for the primary householder has the lowest median household income of $0, with 30 households (6.5%) in this group.
| Income Bracket | # Households | Median Income |
| 15 to 24 Years | 30 (6.5%) | $0 |
| 25 to 44 Years | 125 (27.1%) | $102,589 |
| 45 to 64 Years | 142 (30.8%) | $0 |
| 65+ Years | 164 (35.6%) | $26,424 |
| Total | 461 (100.0%) | $42,375 |
Poverty in Dunnigan
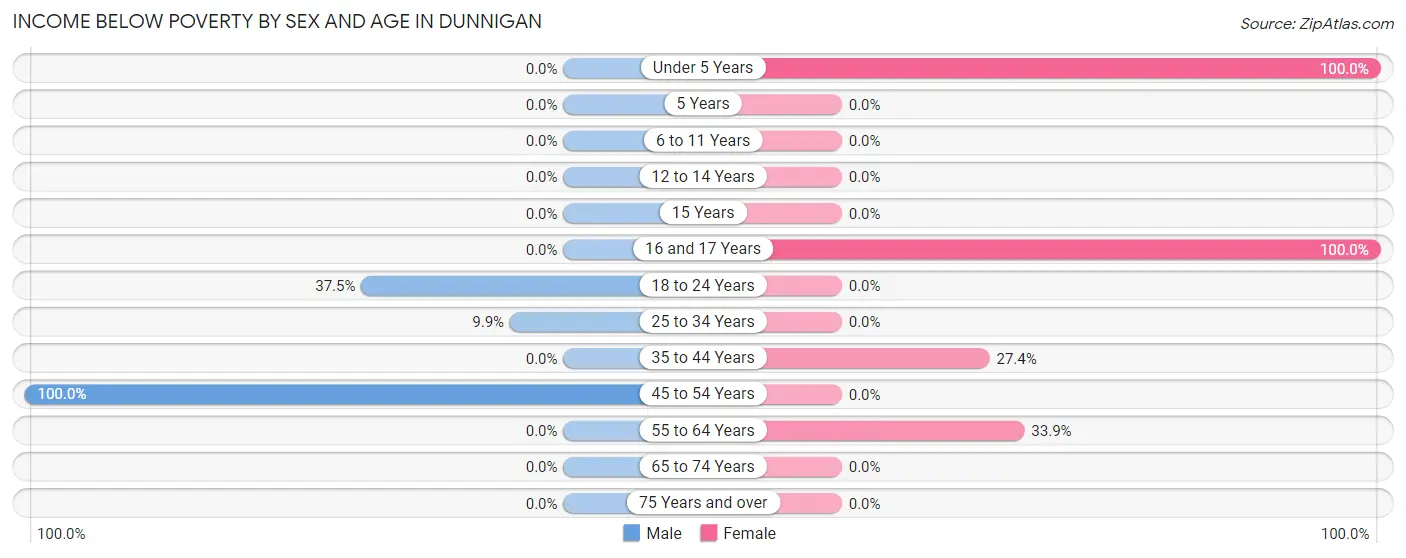
Income Below Poverty by Sex and Age in Dunnigan
With 10.2% poverty level for males and 16.2% for females among the residents of Dunnigan, 45 to 54 year old males and under 5 year old females are the most vulnerable to poverty, with 23 males (100.0%) and 33 females (100.0%) in their respective age groups living below the poverty level.
| Age Bracket | Male | Female |
| Under 5 Years | 0 (0.0%) | 33 (100.0%) |
| 5 Years | 0 (0.0%) | 0 (0.0%) |
| 6 to 11 Years | 0 (0.0%) | 0 (0.0%) |
| 12 to 14 Years | 0 (0.0%) | 0 (0.0%) |
| 15 Years | 0 (0.0%) | 0 (0.0%) |
| 16 and 17 Years | 0 (0.0%) | 15 (100.0%) |
| 18 to 24 Years | 18 (37.5%) | 0 (0.0%) |
| 25 to 34 Years | 12 (9.9%) | 0 (0.0%) |
| 35 to 44 Years | 0 (0.0%) | 17 (27.4%) |
| 45 to 54 Years | 23 (100.0%) | 0 (0.0%) |
| 55 to 64 Years | 0 (0.0%) | 20 (33.9%) |
| 65 to 74 Years | 0 (0.0%) | 0 (0.0%) |
| 75 Years and over | 0 (0.0%) | 0 (0.0%) |
| Total | 53 (10.2%) | 85 (16.2%) |
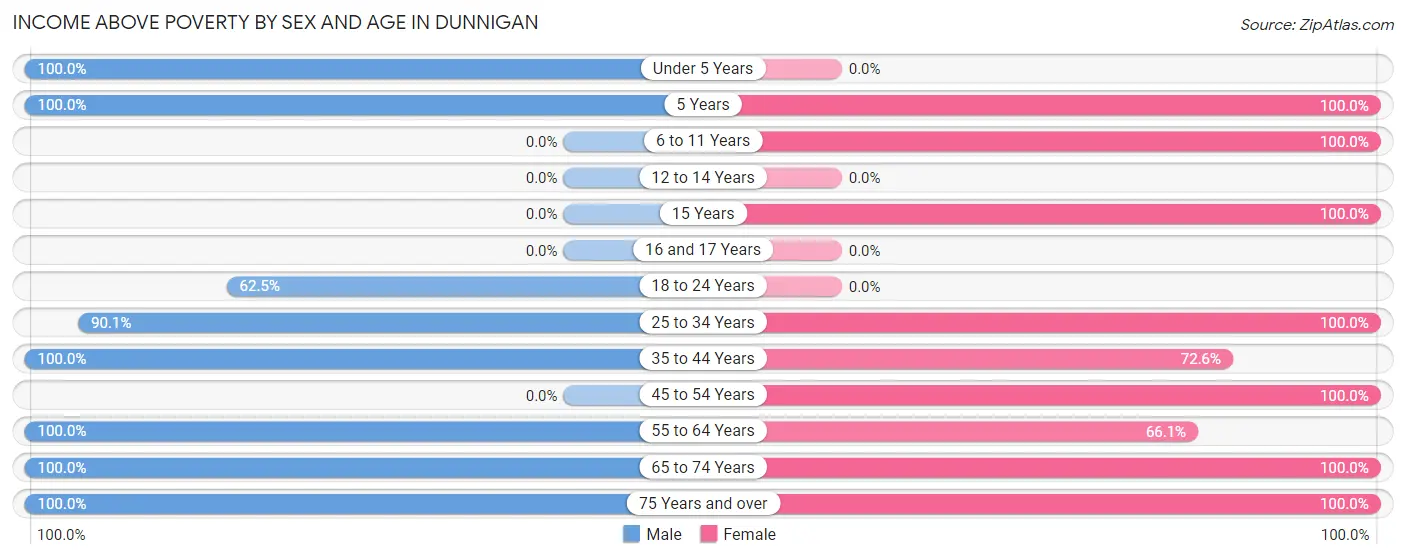
Income Above Poverty by Sex and Age in Dunnigan
According to the poverty statistics in Dunnigan, males aged under 5 years and females aged 5 years are the age groups that are most secure financially, with 100.0% of males and 100.0% of females in these age groups living above the poverty line.
| Age Bracket | Male | Female |
| Under 5 Years | 79 (100.0%) | 0 (0.0%) |
| 5 Years | 11 (100.0%) | 19 (100.0%) |
| 6 to 11 Years | 0 (0.0%) | 32 (100.0%) |
| 12 to 14 Years | 0 (0.0%) | 0 (0.0%) |
| 15 Years | 0 (0.0%) | 29 (100.0%) |
| 16 and 17 Years | 0 (0.0%) | 0 (0.0%) |
| 18 to 24 Years | 30 (62.5%) | 0 (0.0%) |
| 25 to 34 Years | 109 (90.1%) | 72 (100.0%) |
| 35 to 44 Years | 52 (100.0%) | 45 (72.6%) |
| 45 to 54 Years | 0 (0.0%) | 22 (100.0%) |
| 55 to 64 Years | 67 (100.0%) | 39 (66.1%) |
| 65 to 74 Years | 30 (100.0%) | 87 (100.0%) |
| 75 Years and over | 89 (100.0%) | 95 (100.0%) |
| Total | 467 (89.8%) | 440 (83.8%) |
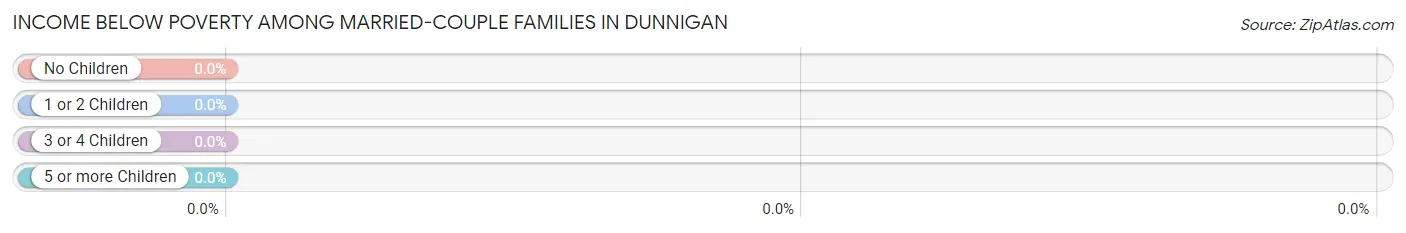
Income Below Poverty Among Married-Couple Families in Dunnigan
| Children | Above Poverty | Below Poverty |
| No Children | 79 (100.0%) | 0 (0.0%) |
| 1 or 2 Children | 32 (100.0%) | 0 (0.0%) |
| 3 or 4 Children | 37 (100.0%) | 0 (0.0%) |
| 5 or more Children | 0 (0.0%) | 0 (0.0%) |
| Total | 148 (100.0%) | 0 (0.0%) |
Income Below Poverty Among Single-Parent Households in Dunnigan
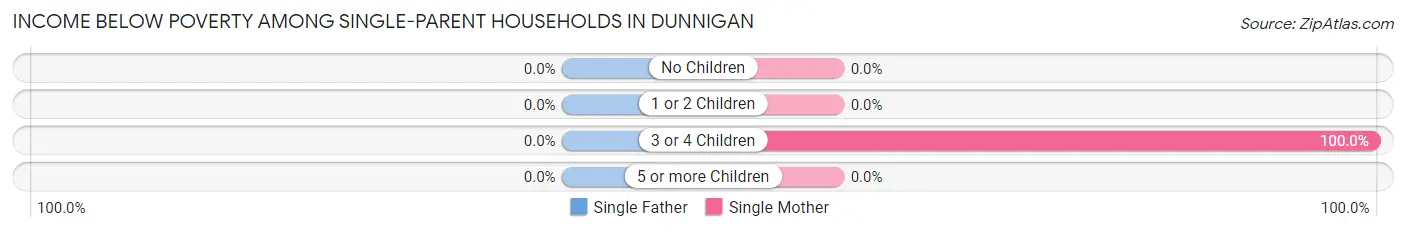
| Children | Single Father | Single Mother |
| No Children | 0 (0.0%) | 0 (0.0%) |
| 1 or 2 Children | 0 (0.0%) | 0 (0.0%) |
| 3 or 4 Children | 0 (0.0%) | 17 (100.0%) |
| 5 or more Children | 0 (0.0%) | 0 (0.0%) |
| Total | 0 (0.0%) | 17 (58.6%) |
Income Below Poverty Among Married-Couple vs Single-Parent Households in Dunnigan
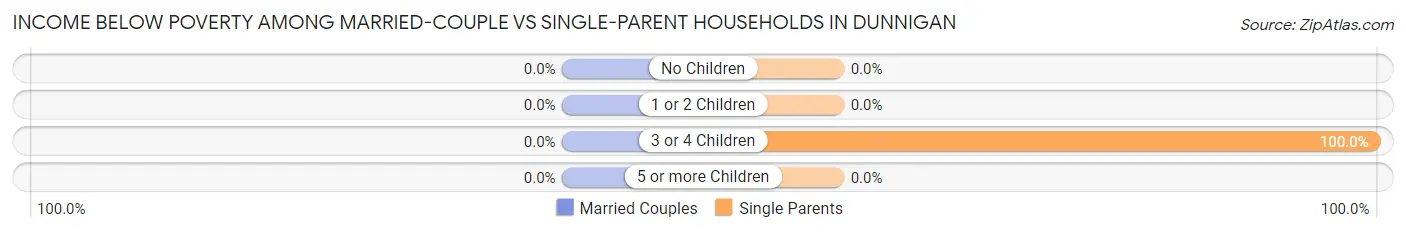
| Children | Married-Couple Families | Single-Parent Households |
| No Children | 0 (0.0%) | 0 (0.0%) |
| 1 or 2 Children | 0 (0.0%) | 0 (0.0%) |
| 3 or 4 Children | 0 (0.0%) | 17 (100.0%) |
| 5 or more Children | 0 (0.0%) | 0 (0.0%) |
| Total | 0 (0.0%) | 17 (39.5%) |
Race in Dunnigan
The most populous races in Dunnigan are White / Caucasian (838 | 80.2%), Hispanic or Latino (325 | 31.1%), and Two or more Races (140 | 13.4%).
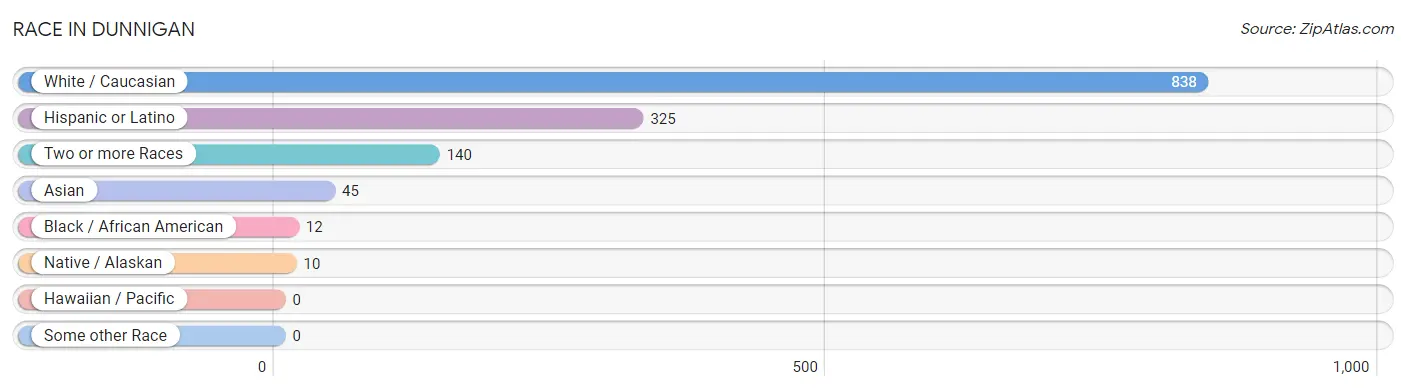
| Race | # Population | % Population |
| Asian | 45 | 4.3% |
| Black / African American | 12 | 1.1% |
| Hawaiian / Pacific | 0 | 0.0% |
| Hispanic or Latino | 325 | 31.1% |
| Native / Alaskan | 10 | 1.0% |
| White / Caucasian | 838 | 80.2% |
| Two or more Races | 140 | 13.4% |
| Some other Race | 0 | 0.0% |
| Total | 1,045 | 100.0% |
Ancestry in Dunnigan
The most populous ancestries reported in Dunnigan are Mexican (325 | 31.1%), German (248 | 23.7%), Irish (126 | 12.1%), Scottish (109 | 10.4%), and Italian (86 | 8.2%), together accounting for 85.6% of all Dunnigan residents.
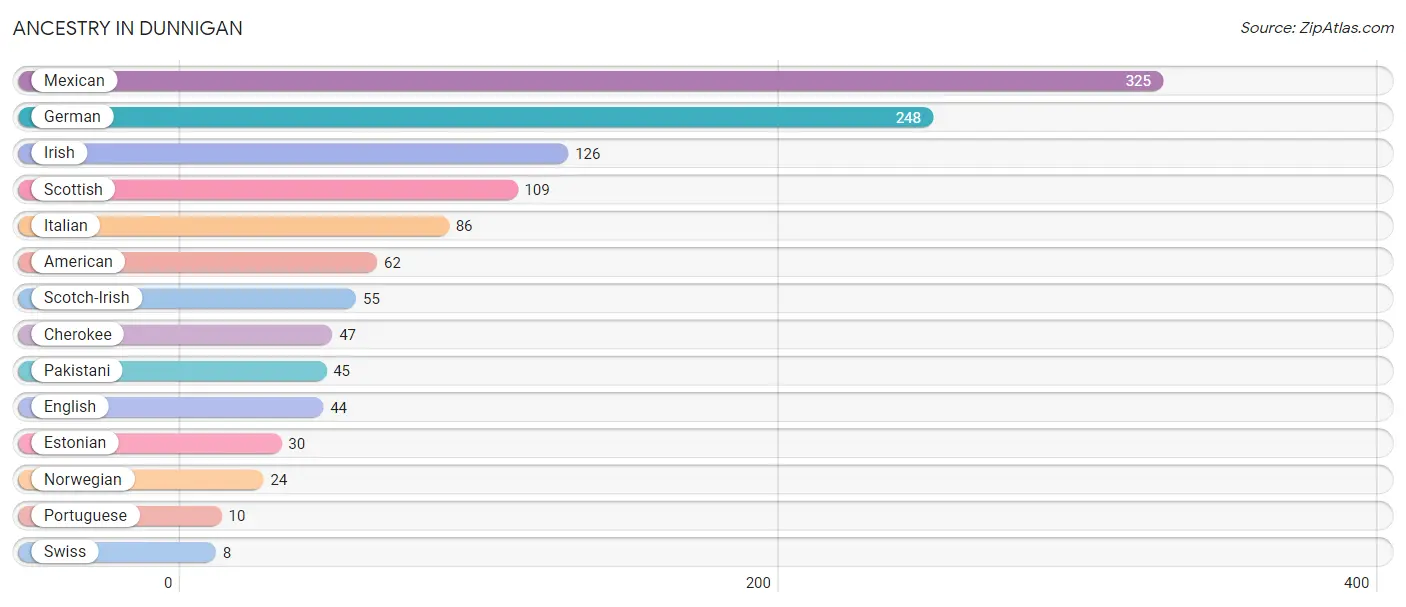
| Ancestry | # Population | % Population |
| American | 62 | 5.9% |
| Cherokee | 47 | 4.5% |
| English | 44 | 4.2% |
| Estonian | 30 | 2.9% |
| German | 248 | 23.7% |
| Irish | 126 | 12.1% |
| Italian | 86 | 8.2% |
| Mexican | 325 | 31.1% |
| Norwegian | 24 | 2.3% |
| Pakistani | 45 | 4.3% |
| Portuguese | 10 | 1.0% |
| Scotch-Irish | 55 | 5.3% |
| Scottish | 109 | 10.4% |
| Swiss | 8 | 0.8% | View All 14 Rows |
Immigrants in Dunnigan
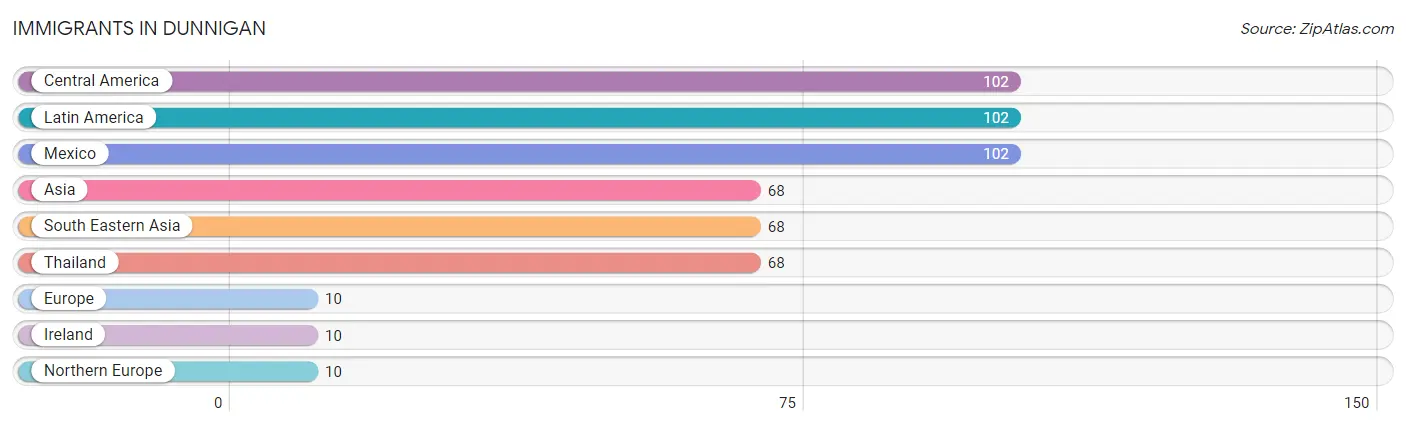
The most numerous immigrant groups reported in Dunnigan came from Central America (102 | 9.8%), Latin America (102 | 9.8%), Mexico (102 | 9.8%), Asia (68 | 6.5%), and South Eastern Asia (68 | 6.5%), together accounting for 42.3% of all Dunnigan residents.
| Immigration Origin | # Population | % Population |
| Asia | 68 | 6.5% |
| Central America | 102 | 9.8% |
| Europe | 10 | 1.0% |
| Ireland | 10 | 1.0% |
| Latin America | 102 | 9.8% |
| Mexico | 102 | 9.8% |
| Northern Europe | 10 | 1.0% |
| South Eastern Asia | 68 | 6.5% |
| Thailand | 68 | 6.5% | View All 9 Rows |
Sex and Age in Dunnigan
Sex and Age in Dunnigan
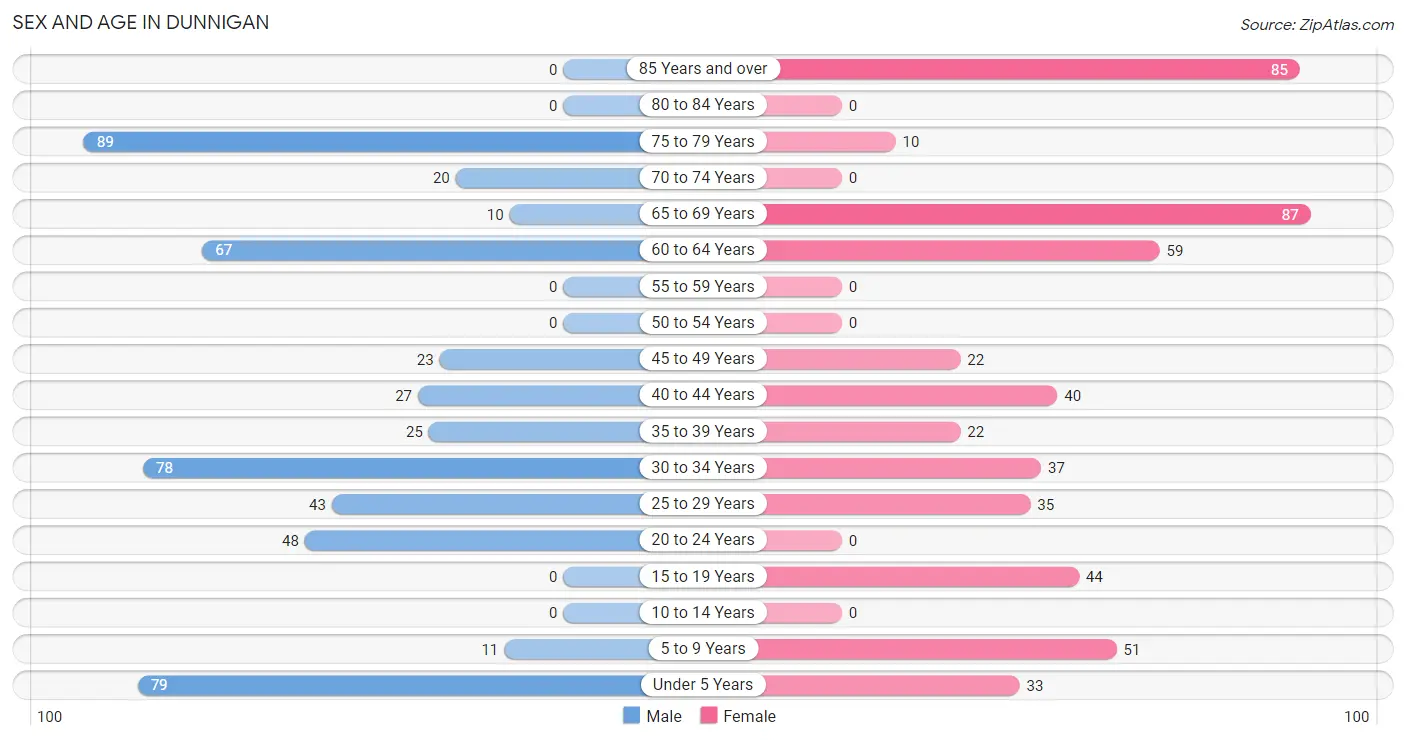
The most populous age groups in Dunnigan are 75 to 79 Years (89 | 17.1%) for men and 65 to 69 Years (87 | 16.6%) for women.
| Age Bracket | Male | Female |
| Under 5 Years | 79 (15.2%) | 33 (6.3%) |
| 5 to 9 Years | 11 (2.1%) | 51 (9.7%) |
| 10 to 14 Years | 0 (0.0%) | 0 (0.0%) |
| 15 to 19 Years | 0 (0.0%) | 44 (8.4%) |
| 20 to 24 Years | 48 (9.2%) | 0 (0.0%) |
| 25 to 29 Years | 43 (8.3%) | 35 (6.7%) |
| 30 to 34 Years | 78 (15.0%) | 37 (7.0%) |
| 35 to 39 Years | 25 (4.8%) | 22 (4.2%) |
| 40 to 44 Years | 27 (5.2%) | 40 (7.6%) |
| 45 to 49 Years | 23 (4.4%) | 22 (4.2%) |
| 50 to 54 Years | 0 (0.0%) | 0 (0.0%) |
| 55 to 59 Years | 0 (0.0%) | 0 (0.0%) |
| 60 to 64 Years | 67 (12.9%) | 59 (11.2%) |
| 65 to 69 Years | 10 (1.9%) | 87 (16.6%) |
| 70 to 74 Years | 20 (3.8%) | 0 (0.0%) |
| 75 to 79 Years | 89 (17.1%) | 10 (1.9%) |
| 80 to 84 Years | 0 (0.0%) | 0 (0.0%) |
| 85 Years and over | 0 (0.0%) | 85 (16.2%) |
| Total | 520 (100.0%) | 525 (100.0%) |
Families and Households in Dunnigan
Median Family Size in Dunnigan
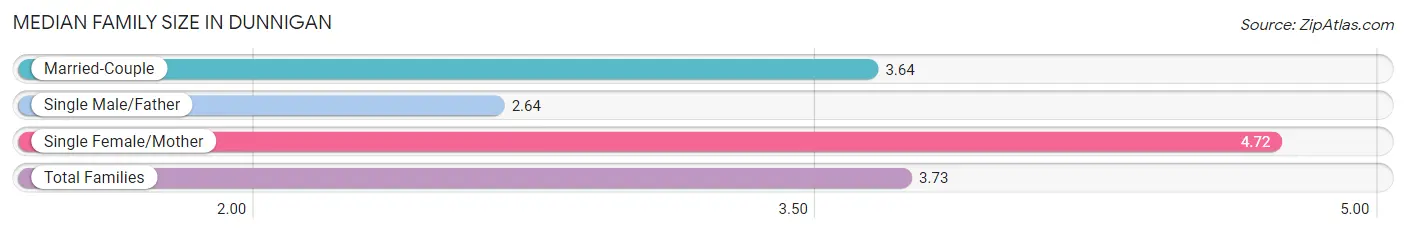
The median family size in Dunnigan is 3.73 persons per family, with single female/mother families (29 | 15.2%) accounting for the largest median family size of 4.72 persons per family. On the other hand, single male/father families (14 | 7.3%) represent the smallest median family size with 2.64 persons per family.
| Family Type | # Families | Family Size |
| Married-Couple | 148 (77.5%) | 3.64 |
| Single Male/Father | 14 (7.3%) | 2.64 |
| Single Female/Mother | 29 (15.2%) | 4.72 |
| Total Families | 191 (100.0%) | 3.73 |
Median Household Size in Dunnigan
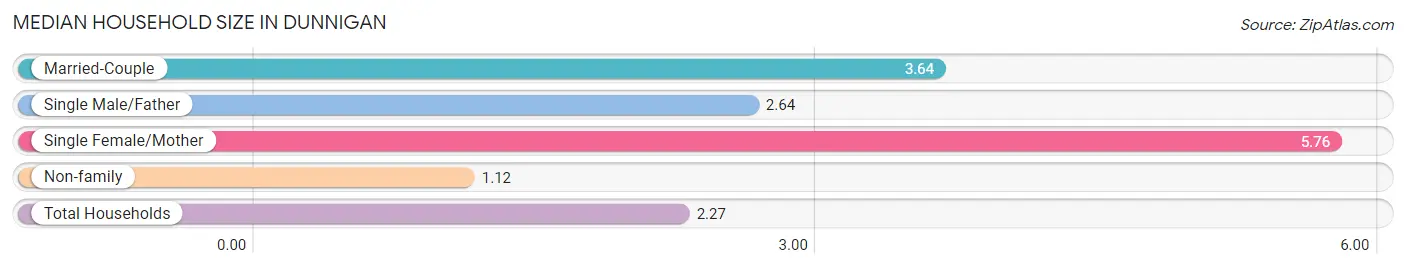
The median household size in Dunnigan is 2.27 persons per household, with single female/mother households (29 | 6.3%) accounting for the largest median household size of 5.76 persons per household. non-family households (270 | 58.6%) represent the smallest median household size with 1.12 persons per household.
| Household Type | # Households | Household Size |
| Married-Couple | 148 (32.1%) | 3.64 |
| Single Male/Father | 14 (3.0%) | 2.64 |
| Single Female/Mother | 29 (6.3%) | 5.76 |
| Non-family | 270 (58.6%) | 1.12 |
| Total Households | 461 (100.0%) | 2.27 |
Household Size by Marriage Status in Dunnigan
Out of a total of 461 households in Dunnigan, 191 (41.4%) are family households, while 270 (58.6%) are nonfamily households. The most numerous type of family households are 2-person households, comprising 55, and the most common type of nonfamily households are 1-person households, comprising 230.
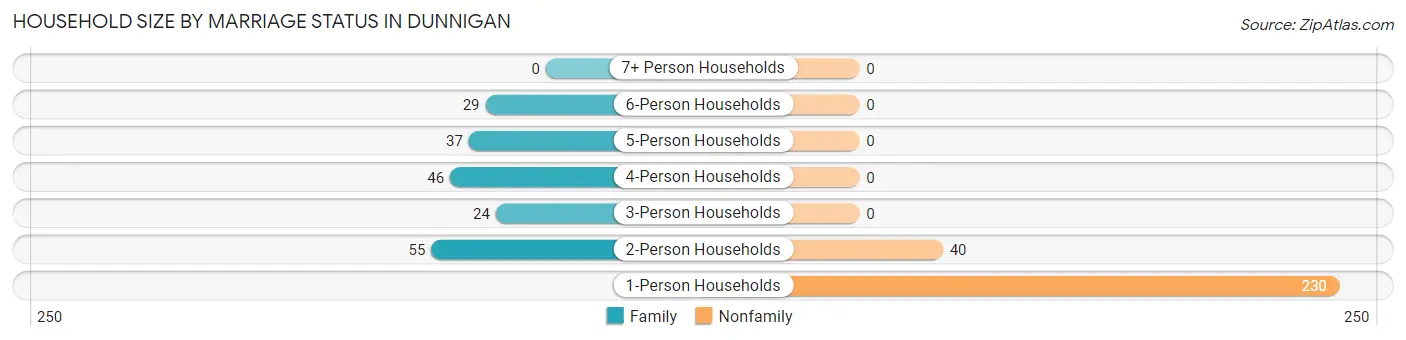
| Household Size | Family Households | Nonfamily Households |
| 1-Person Households | - | 230 (49.9%) |
| 2-Person Households | 55 (11.9%) | 40 (8.7%) |
| 3-Person Households | 24 (5.2%) | 0 (0.0%) |
| 4-Person Households | 46 (10.0%) | 0 (0.0%) |
| 5-Person Households | 37 (8.0%) | 0 (0.0%) |
| 6-Person Households | 29 (6.3%) | 0 (0.0%) |
| 7+ Person Households | 0 (0.0%) | 0 (0.0%) |
| Total | 191 (41.4%) | 270 (58.6%) |
Female Fertility in Dunnigan
Fertility by Age in Dunnigan
| Age Bracket | Women with Births | Births / 1,000 Women |
| 15 to 19 years | 0 (0.0%) | 0.0 |
| 20 to 34 years | 0 (0.0%) | 0.0 |
| 35 to 50 years | 0 (0.0%) | 0.0 |
| Total | 0 (0.0%) | 0.0 |
Fertility by Age by Marriage Status in Dunnigan
| Age Bracket | Married | Unmarried |
| 15 to 19 years | 0 (0.0%) | 0 (0.0%) |
| 20 to 34 years | 0 (0.0%) | 0 (0.0%) |
| 35 to 50 years | 0 (0.0%) | 0 (0.0%) |
| Total | 0 (0.0%) | 0 (0.0%) |
Fertility by Education in Dunnigan
| Educational Attainment | Women with Births | Births / 1,000 Women |
| Less than High School | 0 (0.0%) | 0.0 |
| High School Diploma | 0 (0.0%) | 0.0 |
| College or Associate's Degree | 0 (0.0%) | 0.0 |
| Bachelor's Degree | 0 (0.0%) | 0.0 |
| Graduate Degree | 0 (0.0%) | 0.0 |
| Total | 0 (0.0%) | 0.0 |
Fertility by Education by Marriage Status in Dunnigan
| Educational Attainment | Married | Unmarried |
| Less than High School | 0 (0.0%) | 0 (0.0%) |
| High School Diploma | 0 (0.0%) | 0 (0.0%) |
| College or Associate's Degree | 0 (0.0%) | 0 (0.0%) |
| Bachelor's Degree | 0 (0.0%) | 0 (0.0%) |
| Graduate Degree | 0 (0.0%) | 0 (0.0%) |
| Total | 0 (0.0%) | 0 (0.0%) |
Employment Characteristics in Dunnigan
Employment by Class of Employer in Dunnigan
Among the 363 employed individuals in Dunnigan, private company employees (213 | 58.7%), local government employees (43 | 11.8%), and state government employees (38 | 10.5%) make up the most common classes of employment.
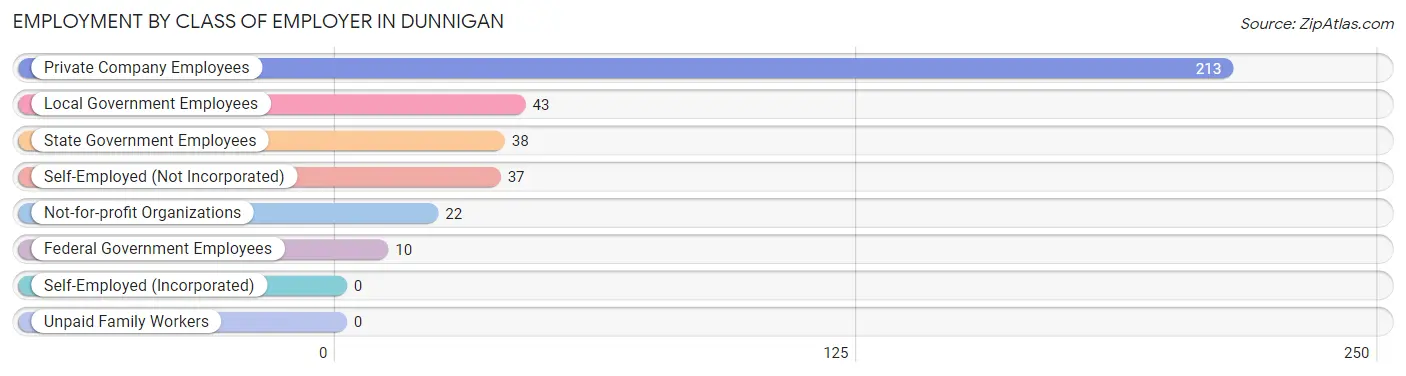
| Employer Class | # Employees | % Employees |
| Private Company Employees | 213 | 58.7% |
| Self-Employed (Incorporated) | 0 | 0.0% |
| Self-Employed (Not Incorporated) | 37 | 10.2% |
| Not-for-profit Organizations | 22 | 6.1% |
| Local Government Employees | 43 | 11.8% |
| State Government Employees | 38 | 10.5% |
| Federal Government Employees | 10 | 2.8% |
| Unpaid Family Workers | 0 | 0.0% |
| Total | 363 | 100.0% |
Employment Status by Age in Dunnigan
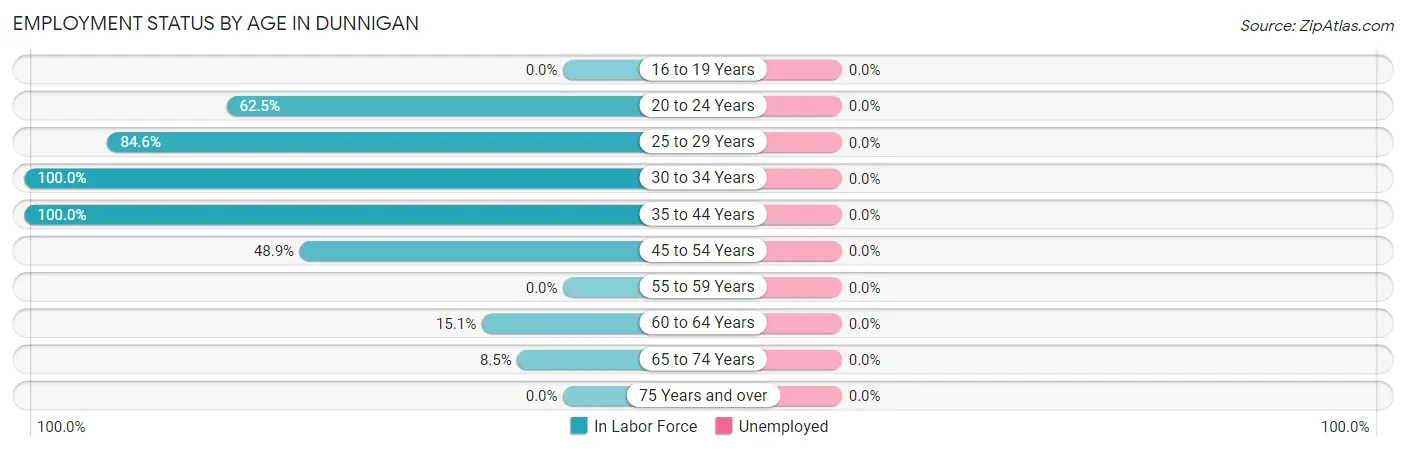
| Age Bracket | In Labor Force | Unemployed |
| 16 to 19 Years | 0 (0.0%) | 0 (0.0%) |
| 20 to 24 Years | 30 (62.5%) | 0 (0.0%) |
| 25 to 29 Years | 66 (84.6%) | 0 (0.0%) |
| 30 to 34 Years | 115 (100.0%) | 0 (0.0%) |
| 35 to 44 Years | 114 (100.0%) | 0 (0.0%) |
| 45 to 54 Years | 22 (48.9%) | 0 (0.0%) |
| 55 to 59 Years | 0 (0.0%) | 0 (0.0%) |
| 60 to 64 Years | 19 (15.1%) | 0 (0.0%) |
| 65 to 74 Years | 10 (8.5%) | 0 (0.0%) |
| 75 Years and over | 0 (0.0%) | 0 (0.0%) |
| Total | 376 (44.7%) | 0 (0.0%) |
Employment Status by Educational Attainment in Dunnigan
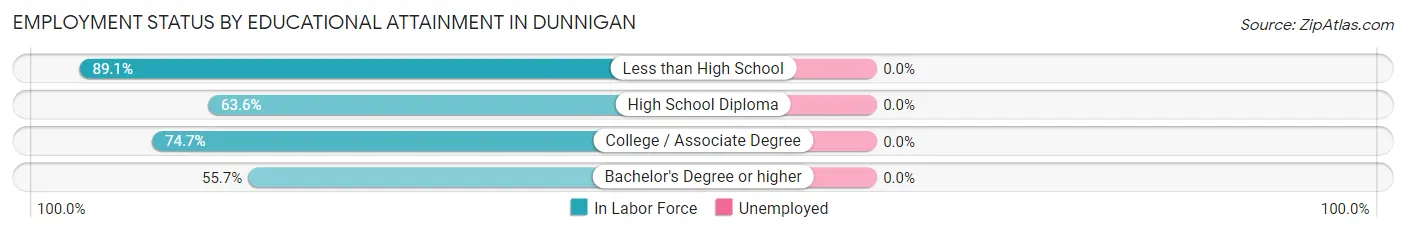
| Educational Attainment | In Labor Force | Unemployed |
| Less than High School | 82 (89.1%) | 0 (0.0%) |
| High School Diploma | 35 (63.6%) | 0 (0.0%) |
| College / Associate Degree | 136 (74.7%) | 0 (0.0%) |
| Bachelor's Degree or higher | 83 (55.7%) | 0 (0.0%) |
| Total | 336 (70.3%) | 0 (0.0%) |
Employment Occupations by Sex in Dunnigan
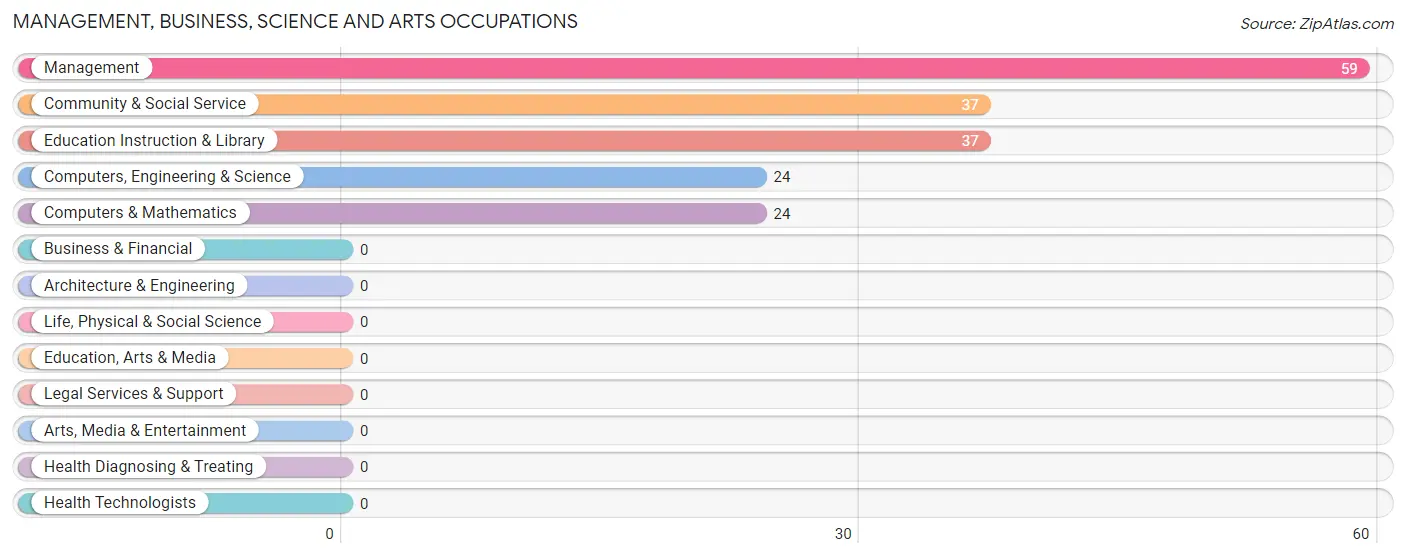
Management, Business, Science and Arts Occupations
The most common Management, Business, Science and Arts occupations in Dunnigan are Management (59 | 15.7%), Community & Social Service (37 | 9.8%), Education Instruction & Library (37 | 9.8%), Computers, Engineering & Science (24 | 6.4%), and Computers & Mathematics (24 | 6.4%).
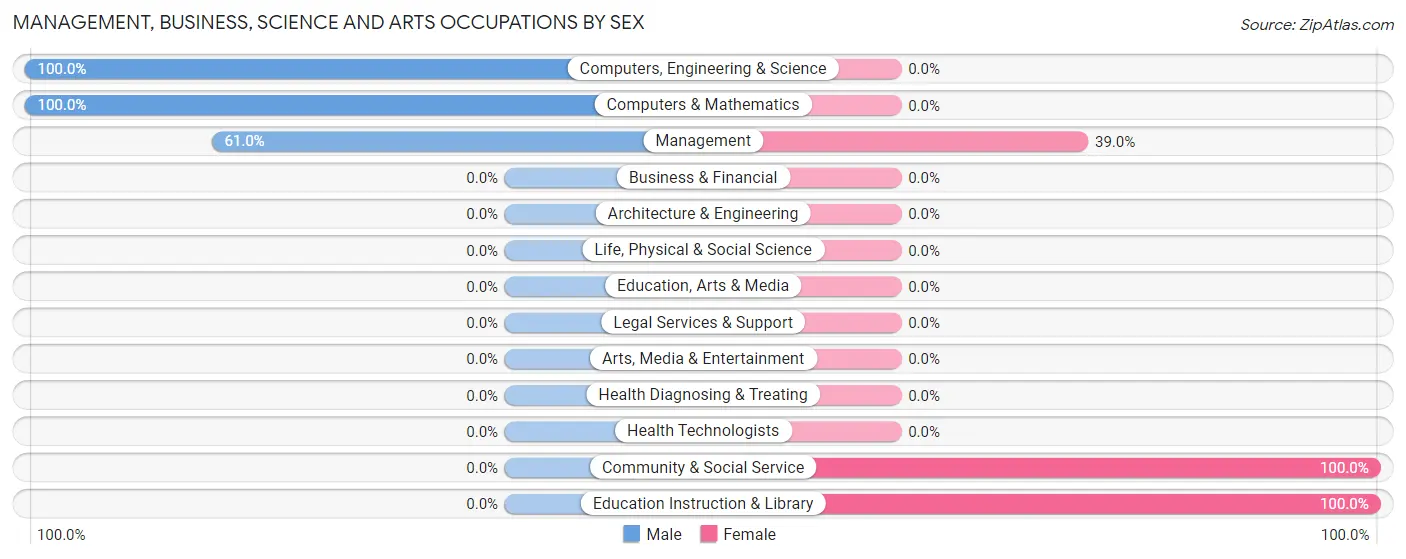
Management, Business, Science and Arts Occupations by Sex
Within the Management, Business, Science and Arts occupations in Dunnigan, the most male-oriented occupations are Computers, Engineering & Science (100.0%), Computers & Mathematics (100.0%), and Management (61.0%), while the most female-oriented occupations are Community & Social Service (100.0%), Education Instruction & Library (100.0%), and Management (39.0%).
| Occupation | Male | Female |
| Management | 36 (61.0%) | 23 (39.0%) |
| Business & Financial | 0 (0.0%) | 0 (0.0%) |
| Computers, Engineering & Science | 24 (100.0%) | 0 (0.0%) |
| Computers & Mathematics | 24 (100.0%) | 0 (0.0%) |
| Architecture & Engineering | 0 (0.0%) | 0 (0.0%) |
| Life, Physical & Social Science | 0 (0.0%) | 0 (0.0%) |
| Community & Social Service | 0 (0.0%) | 37 (100.0%) |
| Education, Arts & Media | 0 (0.0%) | 0 (0.0%) |
| Legal Services & Support | 0 (0.0%) | 0 (0.0%) |
| Education Instruction & Library | 0 (0.0%) | 37 (100.0%) |
| Arts, Media & Entertainment | 0 (0.0%) | 0 (0.0%) |
| Health Diagnosing & Treating | 0 (0.0%) | 0 (0.0%) |
| Health Technologists | 0 (0.0%) | 0 (0.0%) |
| Total (Category) | 60 (50.0%) | 60 (50.0%) |
| Total (Overall) | 200 (53.2%) | 176 (46.8%) |
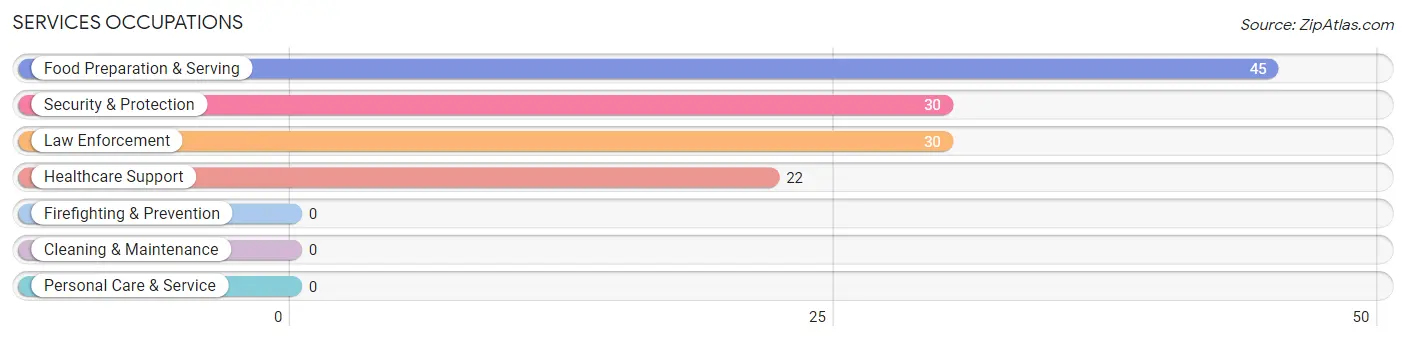
Services Occupations
The most common Services occupations in Dunnigan are Food Preparation & Serving (45 | 12.0%), Security & Protection (30 | 8.0%), Law Enforcement (30 | 8.0%), and Healthcare Support (22 | 5.9%).
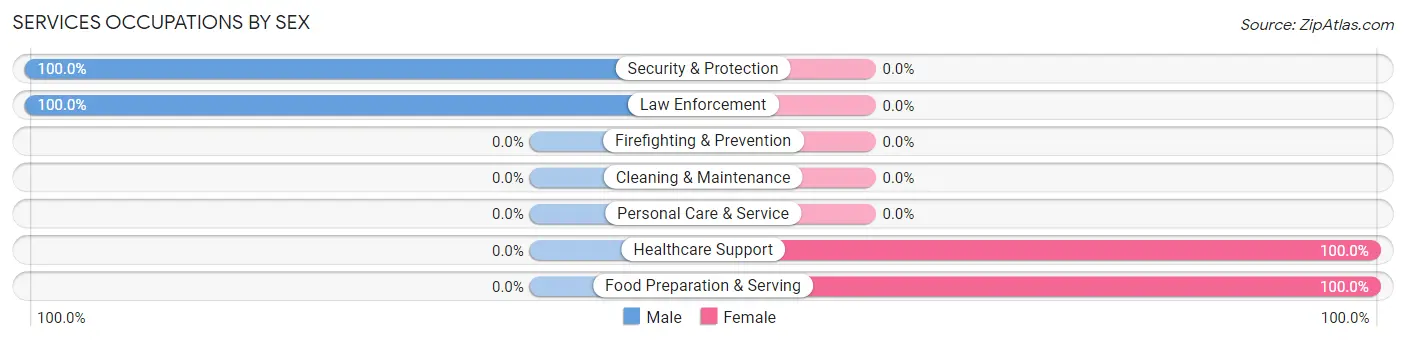
Services Occupations by Sex
Within the Services occupations in Dunnigan, the most male-oriented occupations are Security & Protection (100.0%), and Law Enforcement (100.0%), while the most female-oriented occupations are Healthcare Support (100.0%), and Food Preparation & Serving (100.0%).
| Occupation | Male | Female |
| Healthcare Support | 0 (0.0%) | 22 (100.0%) |
| Security & Protection | 30 (100.0%) | 0 (0.0%) |
| Firefighting & Prevention | 0 (0.0%) | 0 (0.0%) |
| Law Enforcement | 30 (100.0%) | 0 (0.0%) |
| Food Preparation & Serving | 0 (0.0%) | 45 (100.0%) |
| Cleaning & Maintenance | 0 (0.0%) | 0 (0.0%) |
| Personal Care & Service | 0 (0.0%) | 0 (0.0%) |
| Total (Category) | 30 (30.9%) | 67 (69.1%) |
| Total (Overall) | 200 (53.2%) | 176 (46.8%) |
Sales and Office Occupations
The most common Sales and Office occupations in Dunnigan are , and Office & Administration (23 | 6.1%).
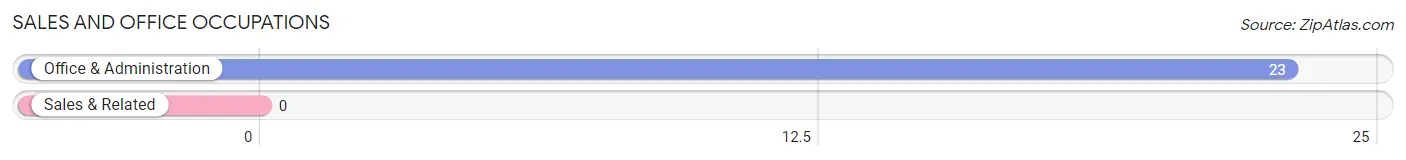
Sales and Office Occupations by Sex
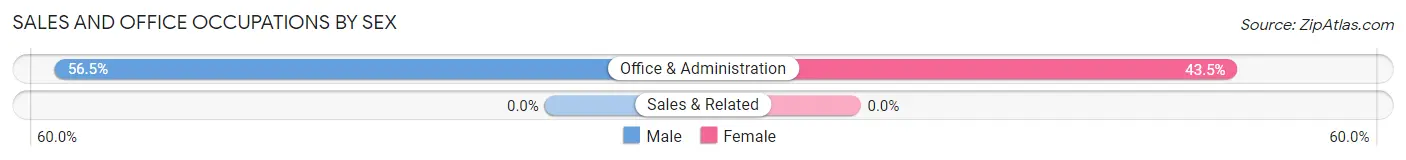
| Occupation | Male | Female |
| Sales & Related | 0 (0.0%) | 0 (0.0%) |
| Office & Administration | 13 (56.5%) | 10 (43.5%) |
| Total (Category) | 13 (56.5%) | 10 (43.5%) |
| Total (Overall) | 200 (53.2%) | 176 (46.8%) |
Natural Resources, Construction and Maintenance Occupations
The most common Natural Resources, Construction and Maintenance occupations in Dunnigan are Farming, Fishing & Forestry (82 | 21.8%), Installation, Maintenance & Repair (31 | 8.2%), and Construction & Extraction (14 | 3.7%).
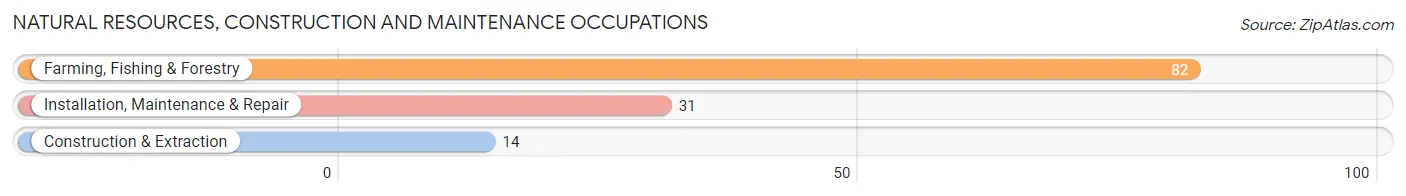
Natural Resources, Construction and Maintenance Occupations by Sex
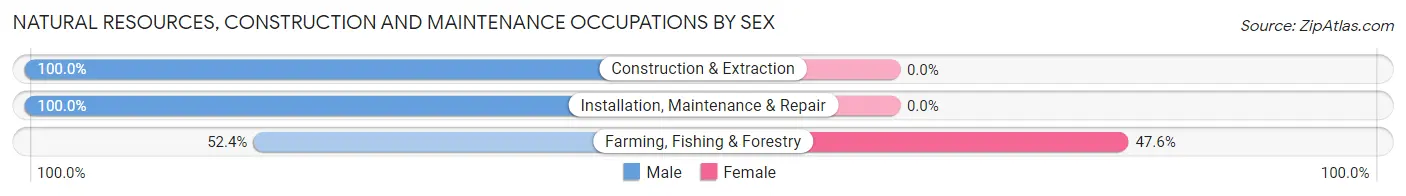
| Occupation | Male | Female |
| Farming, Fishing & Forestry | 43 (52.4%) | 39 (47.6%) |
| Construction & Extraction | 14 (100.0%) | 0 (0.0%) |
| Installation, Maintenance & Repair | 31 (100.0%) | 0 (0.0%) |
| Total (Category) | 88 (69.3%) | 39 (30.7%) |
| Total (Overall) | 200 (53.2%) | 176 (46.8%) |
Production, Transportation and Moving Occupations
The most common Production, Transportation and Moving occupations in Dunnigan are , and Production (9 | 2.4%).
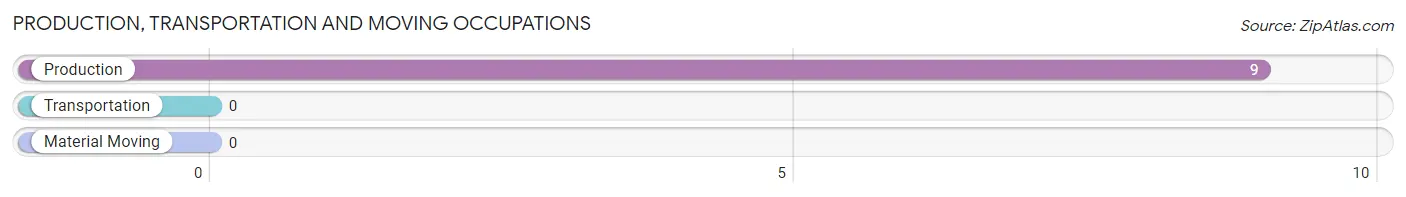
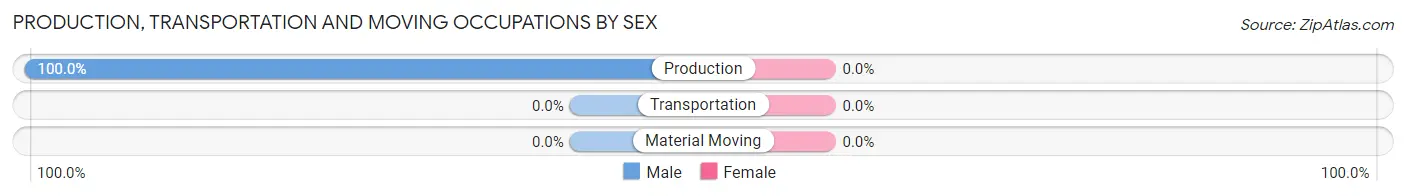
Production, Transportation and Moving Occupations by Sex
| Occupation | Male | Female |
| Production | 9 (100.0%) | 0 (0.0%) |
| Transportation | 0 (0.0%) | 0 (0.0%) |
| Material Moving | 0 (0.0%) | 0 (0.0%) |
| Total (Category) | 9 (100.0%) | 0 (0.0%) |
| Total (Overall) | 200 (53.2%) | 176 (46.8%) |
Employment Industries by Sex in Dunnigan
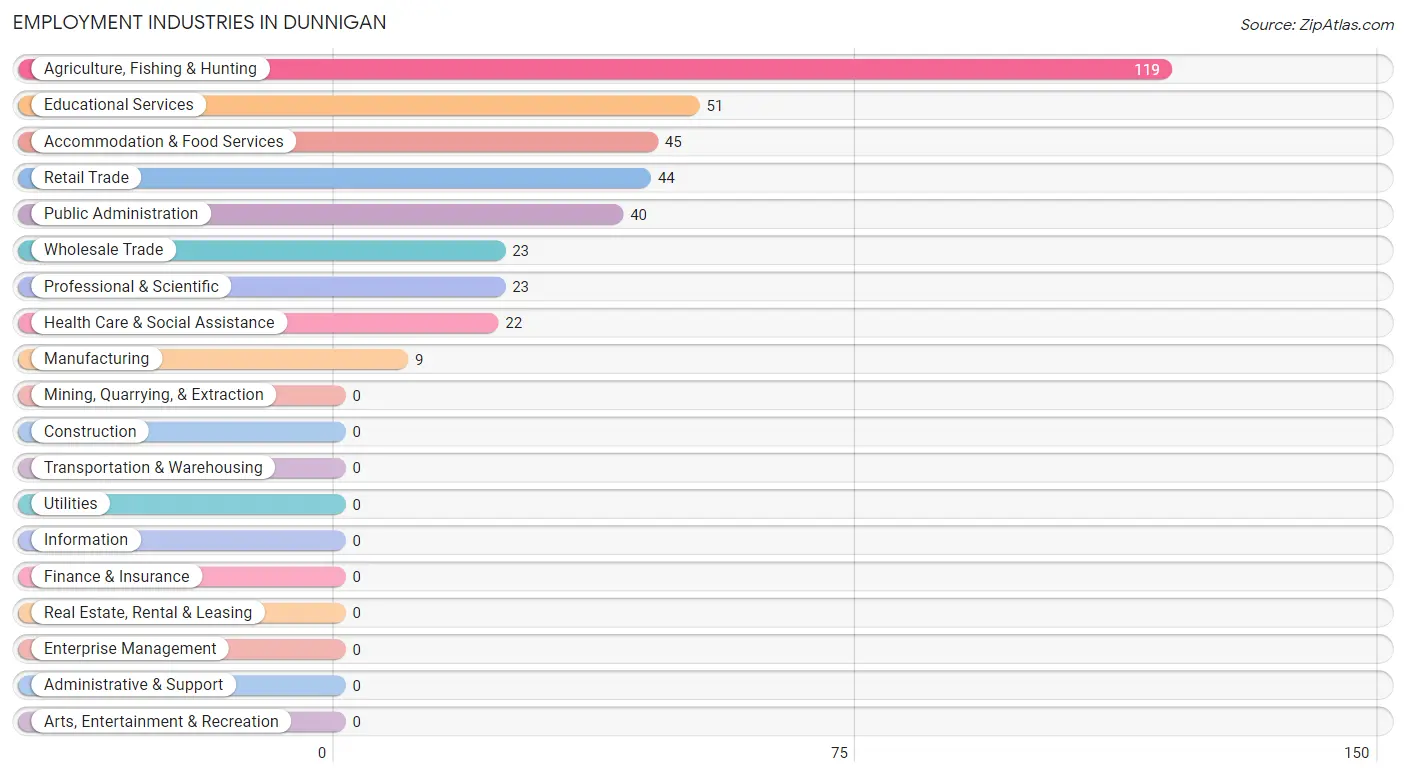
Employment Industries in Dunnigan
The major employment industries in Dunnigan include Agriculture, Fishing & Hunting (119 | 31.7%), Educational Services (51 | 13.6%), Accommodation & Food Services (45 | 12.0%), Retail Trade (44 | 11.7%), and Public Administration (40 | 10.6%).
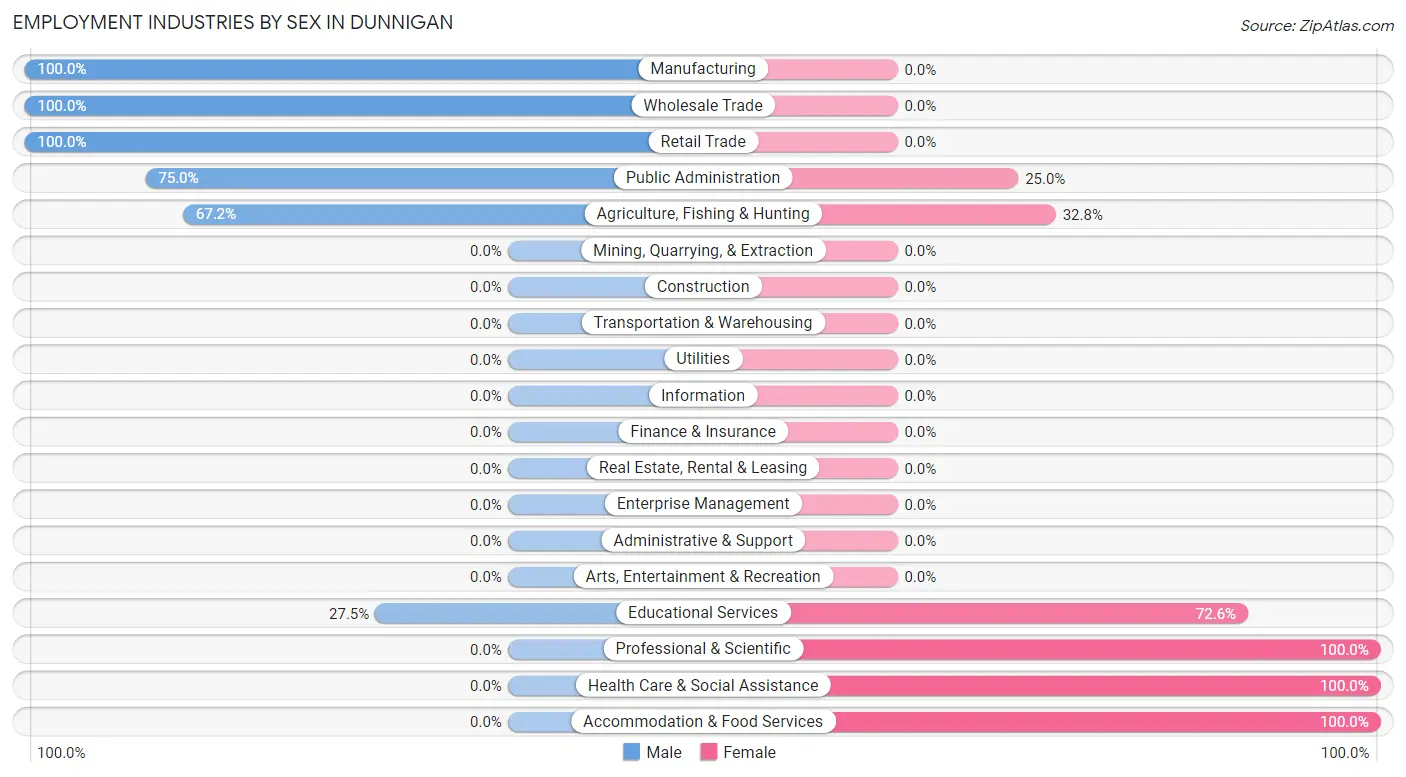
Employment Industries by Sex in Dunnigan
The Dunnigan industries that see more men than women are Manufacturing (100.0%), Wholesale Trade (100.0%), and Retail Trade (100.0%), whereas the industries that tend to have a higher number of women are Professional & Scientific (100.0%), Health Care & Social Assistance (100.0%), and Accommodation & Food Services (100.0%).
| Industry | Male | Female |
| Agriculture, Fishing & Hunting | 80 (67.2%) | 39 (32.8%) |
| Mining, Quarrying, & Extraction | 0 (0.0%) | 0 (0.0%) |
| Construction | 0 (0.0%) | 0 (0.0%) |
| Manufacturing | 9 (100.0%) | 0 (0.0%) |
| Wholesale Trade | 23 (100.0%) | 0 (0.0%) |
| Retail Trade | 44 (100.0%) | 0 (0.0%) |
| Transportation & Warehousing | 0 (0.0%) | 0 (0.0%) |
| Utilities | 0 (0.0%) | 0 (0.0%) |
| Information | 0 (0.0%) | 0 (0.0%) |
| Finance & Insurance | 0 (0.0%) | 0 (0.0%) |
| Real Estate, Rental & Leasing | 0 (0.0%) | 0 (0.0%) |
| Professional & Scientific | 0 (0.0%) | 23 (100.0%) |
| Enterprise Management | 0 (0.0%) | 0 (0.0%) |
| Administrative & Support | 0 (0.0%) | 0 (0.0%) |
| Educational Services | 14 (27.5%) | 37 (72.6%) |
| Health Care & Social Assistance | 0 (0.0%) | 22 (100.0%) |
| Arts, Entertainment & Recreation | 0 (0.0%) | 0 (0.0%) |
| Accommodation & Food Services | 0 (0.0%) | 45 (100.0%) |
| Public Administration | 30 (75.0%) | 10 (25.0%) |
| Total | 200 (53.2%) | 176 (46.8%) |
Education in Dunnigan
School Enrollment in Dunnigan
The most common levels of schooling among the 175 students in Dunnigan are nursery / preschool (53 | 30.3%), high school (44 | 25.1%), and kindergarten (38 | 21.7%).
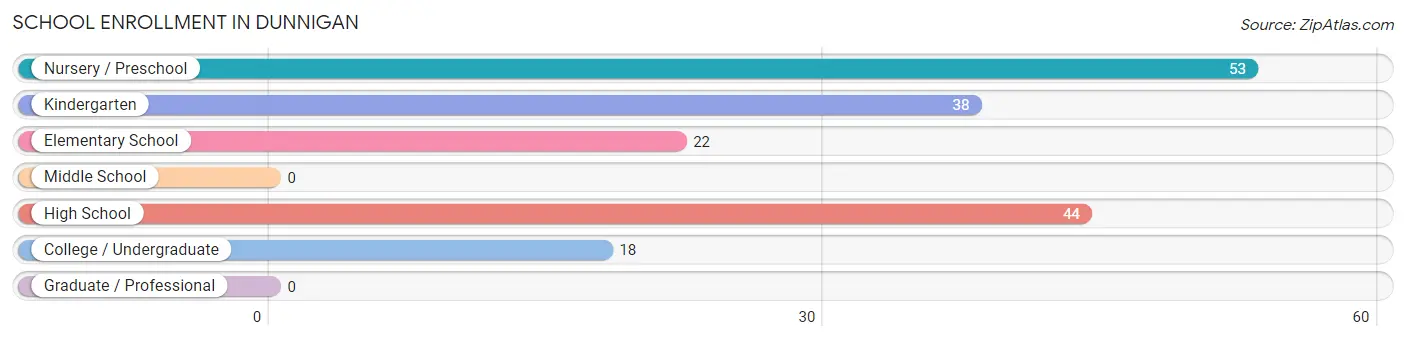
| School Level | # Students | % Students |
| Nursery / Preschool | 53 | 30.3% |
| Kindergarten | 38 | 21.7% |
| Elementary School | 22 | 12.6% |
| Middle School | 0 | 0.0% |
| High School | 44 | 25.1% |
| College / Undergraduate | 18 | 10.3% |
| Graduate / Professional | 0 | 0.0% |
| Total | 175 | 100.0% |
School Enrollment by Age by Funding Source in Dunnigan
Out of a total of 175 students who are enrolled in schools in Dunnigan, 31 (17.7%) attend a private institution, while the remaining 144 (82.3%) are enrolled in public schools. The age group of 3 to 4 year olds has the highest likelihood of being enrolled in private schools, with 12 (23.5% in the age bracket) enrolled. Conversely, the age group of 20 to 24 year olds has the lowest likelihood of being enrolled in a private school, with 18 (100.0% in the age bracket) attending a public institution.
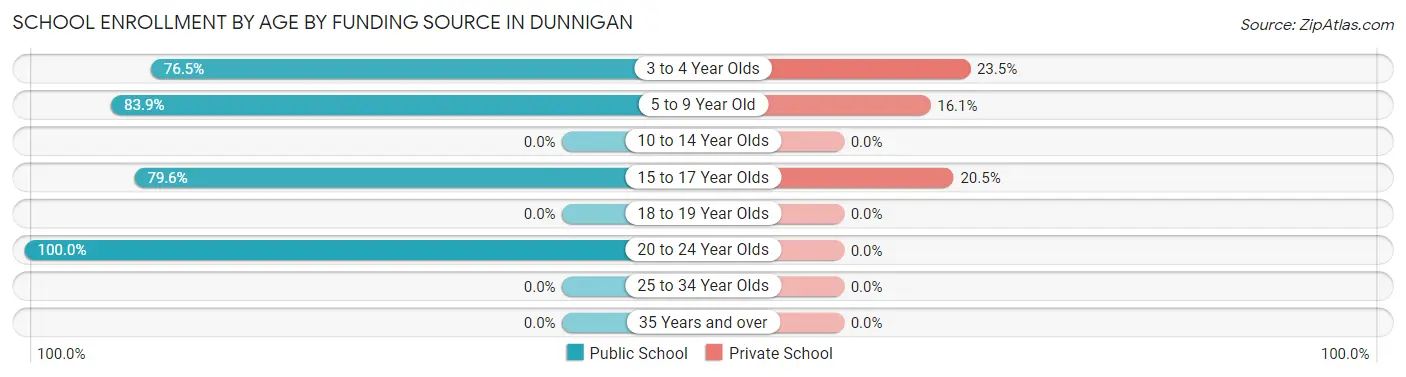
| Age Bracket | Public School | Private School |
| 3 to 4 Year Olds | 39 (76.5%) | 12 (23.5%) |
| 5 to 9 Year Old | 52 (83.9%) | 10 (16.1%) |
| 10 to 14 Year Olds | 0 (0.0%) | 0 (0.0%) |
| 15 to 17 Year Olds | 35 (79.5%) | 9 (20.4%) |
| 18 to 19 Year Olds | 0 (0.0%) | 0 (0.0%) |
| 20 to 24 Year Olds | 18 (100.0%) | 0 (0.0%) |
| 25 to 34 Year Olds | 0 (0.0%) | 0 (0.0%) |
| 35 Years and over | 0 (0.0%) | 0 (0.0%) |
| Total | 144 (82.3%) | 31 (17.7%) |
Educational Attainment by Field of Study in Dunnigan
Business (60 | 29.4%), science & technology (56 | 27.5%), bio, nature & agricultural (24 | 11.8%), physical & health sciences (23 | 11.3%), and communications (23 | 11.3%) are the most common fields of study among 204 individuals in Dunnigan who have obtained a bachelor's degree or higher.
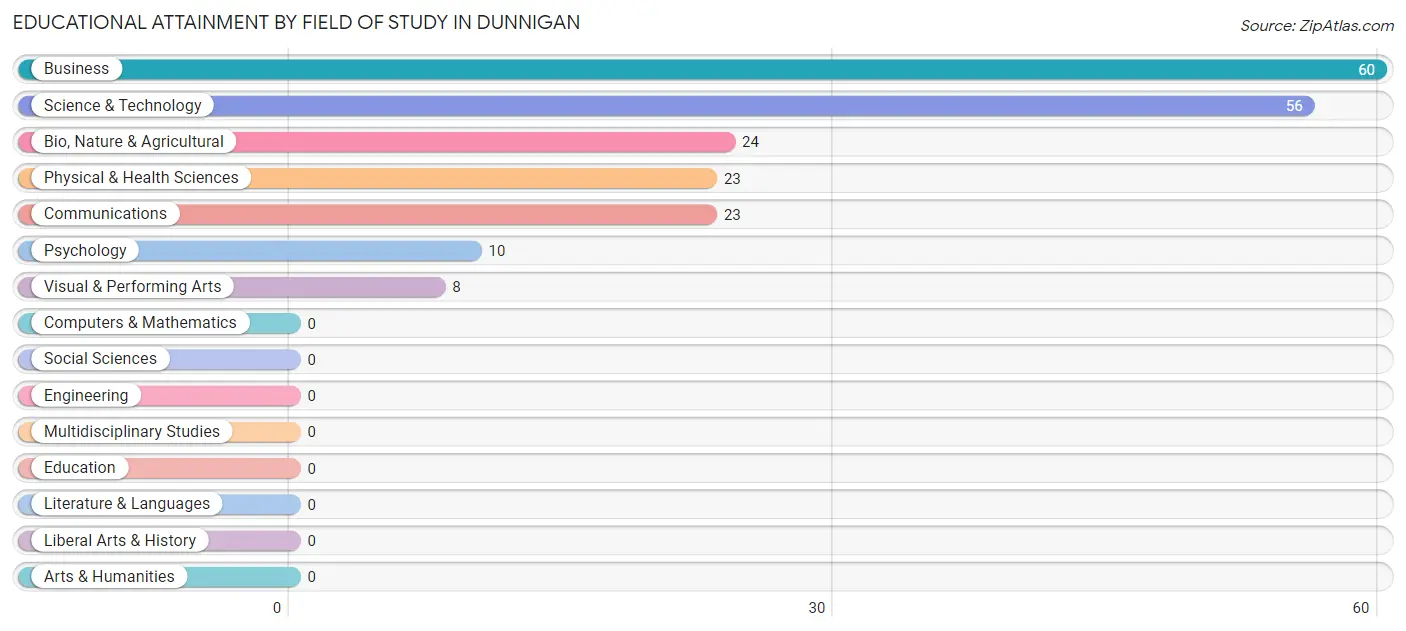
| Field of Study | # Graduates | % Graduates |
| Computers & Mathematics | 0 | 0.0% |
| Bio, Nature & Agricultural | 24 | 11.8% |
| Physical & Health Sciences | 23 | 11.3% |
| Psychology | 10 | 4.9% |
| Social Sciences | 0 | 0.0% |
| Engineering | 0 | 0.0% |
| Multidisciplinary Studies | 0 | 0.0% |
| Science & Technology | 56 | 27.5% |
| Business | 60 | 29.4% |
| Education | 0 | 0.0% |
| Literature & Languages | 0 | 0.0% |
| Liberal Arts & History | 0 | 0.0% |
| Visual & Performing Arts | 8 | 3.9% |
| Communications | 23 | 11.3% |
| Arts & Humanities | 0 | 0.0% |
| Total | 204 | 100.0% |
Transportation & Commute in Dunnigan
Vehicle Availability by Sex in Dunnigan
The most prevalent vehicle ownership categories in Dunnigan are males with 2 vehicles (117, accounting for 62.6%) and females with 2 vehicles (75, making up 66.5%).
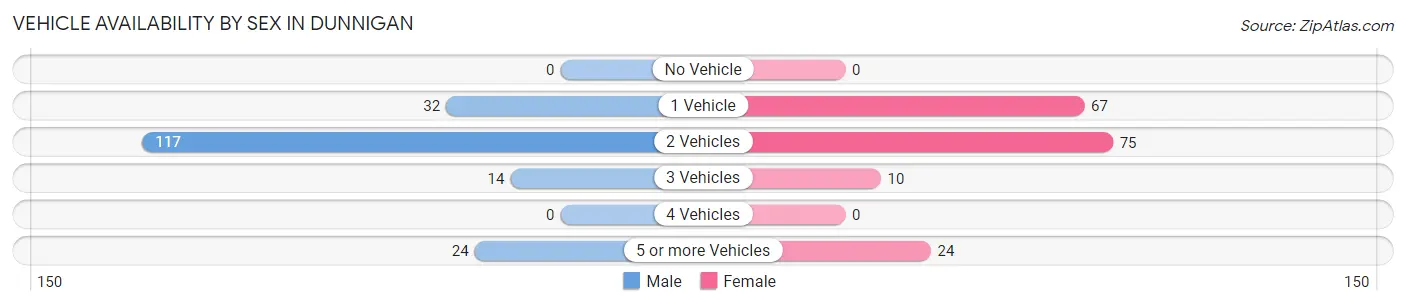
| Vehicles Available | Male | Female |
| No Vehicle | 0 (0.0%) | 0 (0.0%) |
| 1 Vehicle | 32 (17.1%) | 67 (38.1%) |
| 2 Vehicles | 117 (62.6%) | 75 (42.6%) |
| 3 Vehicles | 14 (7.5%) | 10 (5.7%) |
| 4 Vehicles | 0 (0.0%) | 0 (0.0%) |
| 5 or more Vehicles | 24 (12.8%) | 24 (13.6%) |
| Total | 187 (100.0%) | 176 (100.0%) |
Commute Time in Dunnigan
The most frequently occuring commute durations in Dunnigan are 20 to 24 minutes (149 commuters, 43.7%), less than 5 minutes (54 commuters, 15.8%), and 30 to 34 minutes (45 commuters, 13.2%).
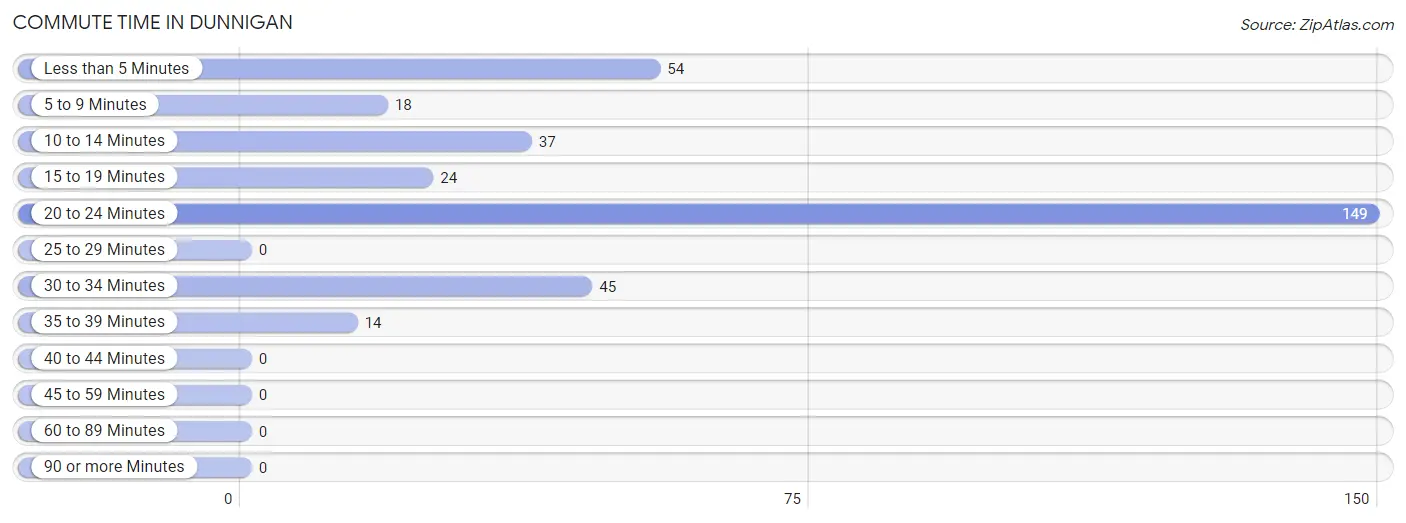
| Commute Time | # Commuters | % Commuters |
| Less than 5 Minutes | 54 | 15.8% |
| 5 to 9 Minutes | 18 | 5.3% |
| 10 to 14 Minutes | 37 | 10.8% |
| 15 to 19 Minutes | 24 | 7.0% |
| 20 to 24 Minutes | 149 | 43.7% |
| 25 to 29 Minutes | 0 | 0.0% |
| 30 to 34 Minutes | 45 | 13.2% |
| 35 to 39 Minutes | 14 | 4.1% |
| 40 to 44 Minutes | 0 | 0.0% |
| 45 to 59 Minutes | 0 | 0.0% |
| 60 to 89 Minutes | 0 | 0.0% |
| 90 or more Minutes | 0 | 0.0% |
Commute Time by Sex in Dunnigan
The most common commute times in Dunnigan are 20 to 24 minutes (64 commuters, 34.2%) for males and 20 to 24 minutes (85 commuters, 55.2%) for females.
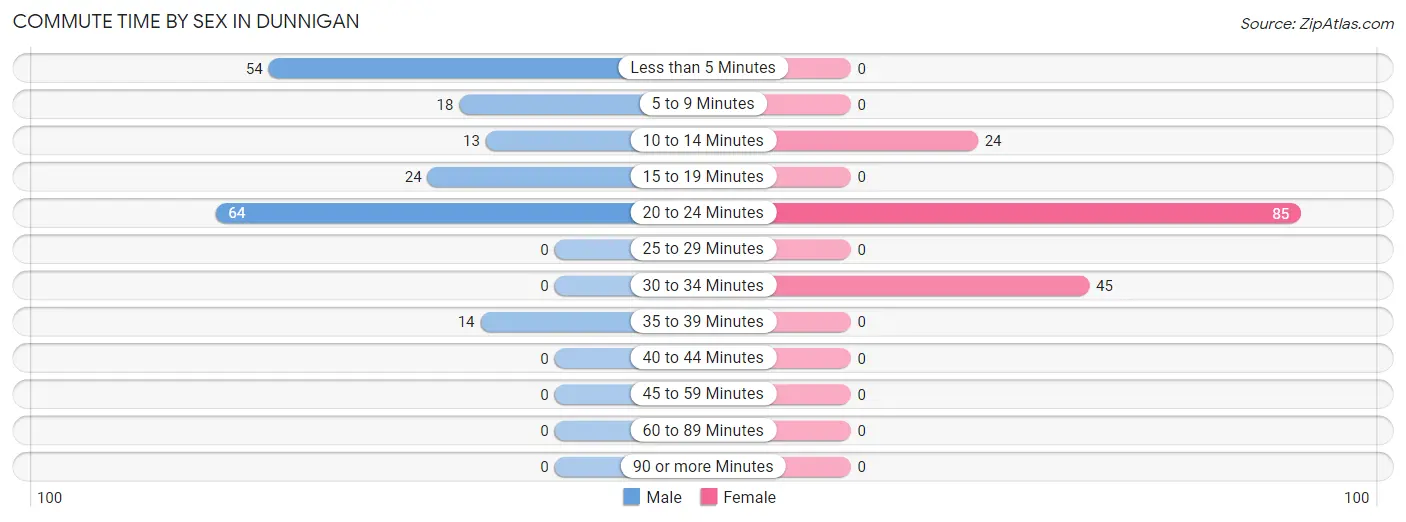
| Commute Time | Male | Female |
| Less than 5 Minutes | 54 (28.9%) | 0 (0.0%) |
| 5 to 9 Minutes | 18 (9.6%) | 0 (0.0%) |
| 10 to 14 Minutes | 13 (7.0%) | 24 (15.6%) |
| 15 to 19 Minutes | 24 (12.8%) | 0 (0.0%) |
| 20 to 24 Minutes | 64 (34.2%) | 85 (55.2%) |
| 25 to 29 Minutes | 0 (0.0%) | 0 (0.0%) |
| 30 to 34 Minutes | 0 (0.0%) | 45 (29.2%) |
| 35 to 39 Minutes | 14 (7.5%) | 0 (0.0%) |
| 40 to 44 Minutes | 0 (0.0%) | 0 (0.0%) |
| 45 to 59 Minutes | 0 (0.0%) | 0 (0.0%) |
| 60 to 89 Minutes | 0 (0.0%) | 0 (0.0%) |
| 90 or more Minutes | 0 (0.0%) | 0 (0.0%) |
Time of Departure to Work by Sex in Dunnigan
The most frequent times of departure to work in Dunnigan are 7:00 AM to 7:29 AM (84, 44.9%) for males and 12:00 AM to 4:59 AM (45, 29.2%) for females.
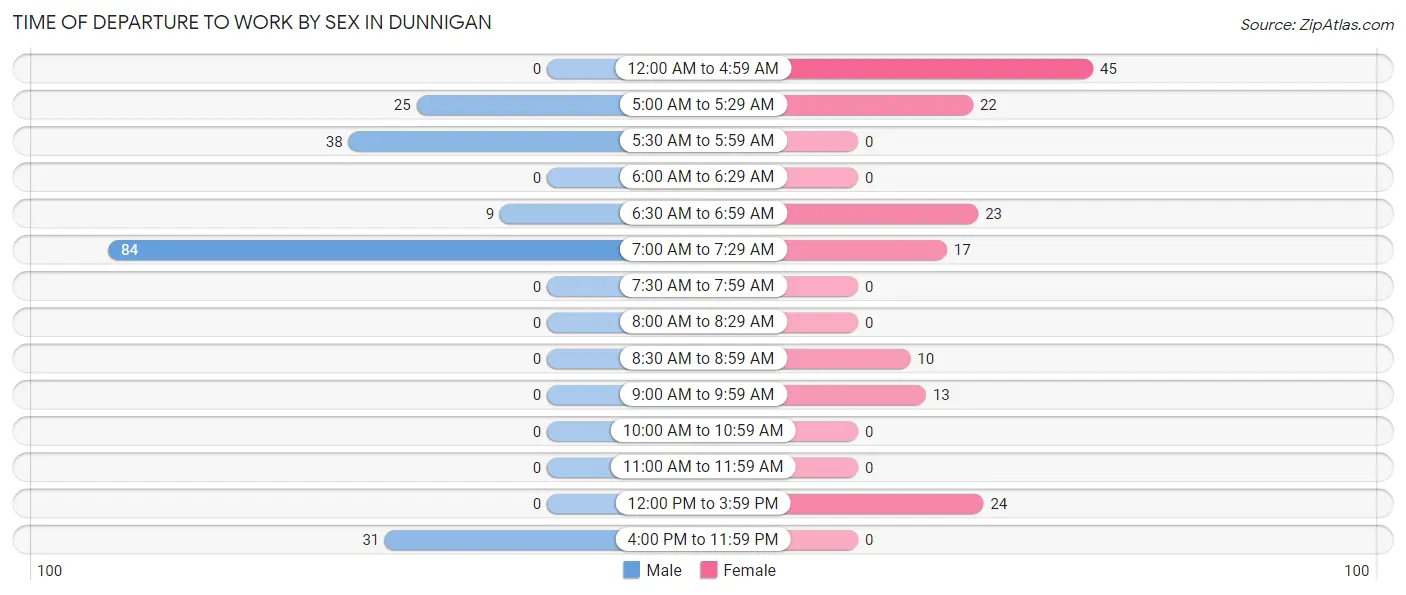
| Time of Departure | Male | Female |
| 12:00 AM to 4:59 AM | 0 (0.0%) | 45 (29.2%) |
| 5:00 AM to 5:29 AM | 25 (13.4%) | 22 (14.3%) |
| 5:30 AM to 5:59 AM | 38 (20.3%) | 0 (0.0%) |
| 6:00 AM to 6:29 AM | 0 (0.0%) | 0 (0.0%) |
| 6:30 AM to 6:59 AM | 9 (4.8%) | 23 (14.9%) |
| 7:00 AM to 7:29 AM | 84 (44.9%) | 17 (11.0%) |
| 7:30 AM to 7:59 AM | 0 (0.0%) | 0 (0.0%) |
| 8:00 AM to 8:29 AM | 0 (0.0%) | 0 (0.0%) |
| 8:30 AM to 8:59 AM | 0 (0.0%) | 10 (6.5%) |
| 9:00 AM to 9:59 AM | 0 (0.0%) | 13 (8.4%) |
| 10:00 AM to 10:59 AM | 0 (0.0%) | 0 (0.0%) |
| 11:00 AM to 11:59 AM | 0 (0.0%) | 0 (0.0%) |
| 12:00 PM to 3:59 PM | 0 (0.0%) | 24 (15.6%) |
| 4:00 PM to 11:59 PM | 31 (16.6%) | 0 (0.0%) |
| Total | 187 (100.0%) | 154 (100.0%) |
Housing Occupancy in Dunnigan
Occupancy by Ownership in Dunnigan
Of the total 461 dwellings in Dunnigan, owner-occupied units account for 265 (57.5%), while renter-occupied units make up 196 (42.5%).
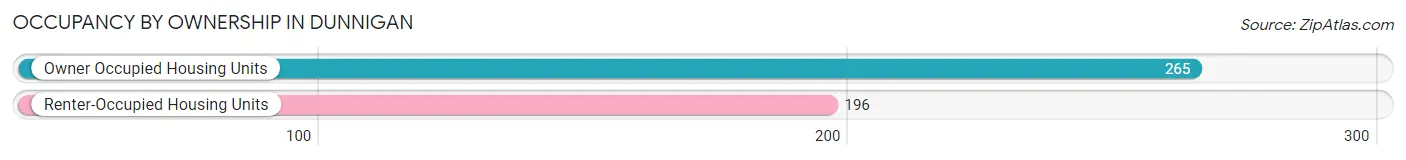
| Occupancy | # Housing Units | % Housing Units |
| Owner Occupied Housing Units | 265 | 57.5% |
| Renter-Occupied Housing Units | 196 | 42.5% |
| Total Occupied Housing Units | 461 | 100.0% |
Occupancy by Household Size in Dunnigan
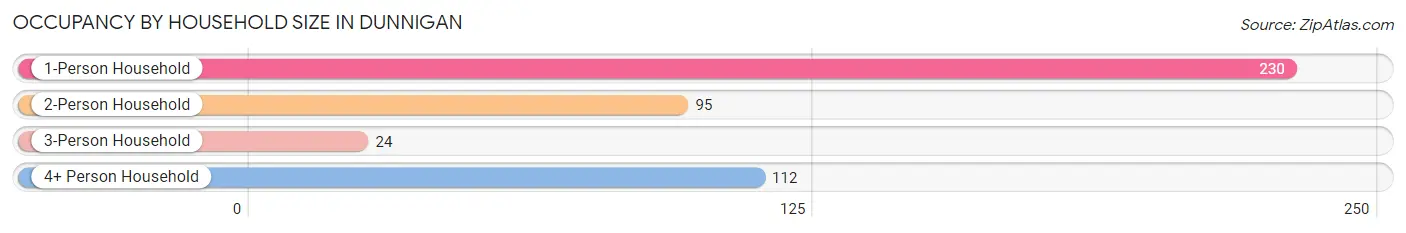
| Household Size | # Housing Units | % Housing Units |
| 1-Person Household | 230 | 49.9% |
| 2-Person Household | 95 | 20.6% |
| 3-Person Household | 24 | 5.2% |
| 4+ Person Household | 112 | 24.3% |
| Total Housing Units | 461 | 100.0% |
Occupancy by Ownership by Household Size in Dunnigan
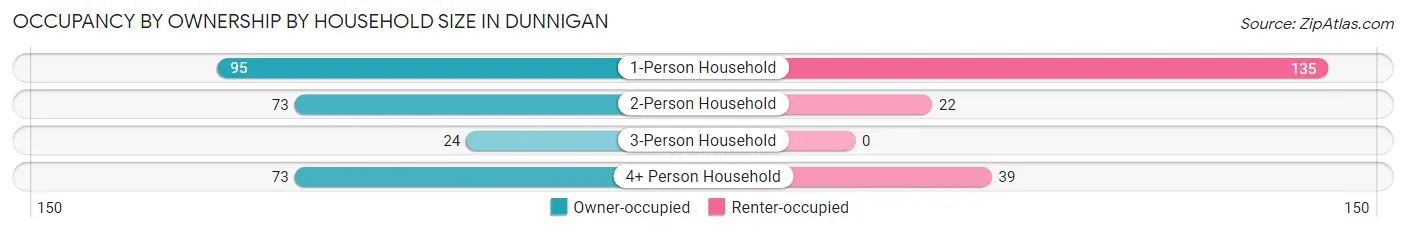
| Household Size | Owner-occupied | Renter-occupied |
| 1-Person Household | 95 (41.3%) | 135 (58.7%) |
| 2-Person Household | 73 (76.8%) | 22 (23.2%) |
| 3-Person Household | 24 (100.0%) | 0 (0.0%) |
| 4+ Person Household | 73 (65.2%) | 39 (34.8%) |
| Total Housing Units | 265 (57.5%) | 196 (42.5%) |
Occupancy by Educational Attainment in Dunnigan
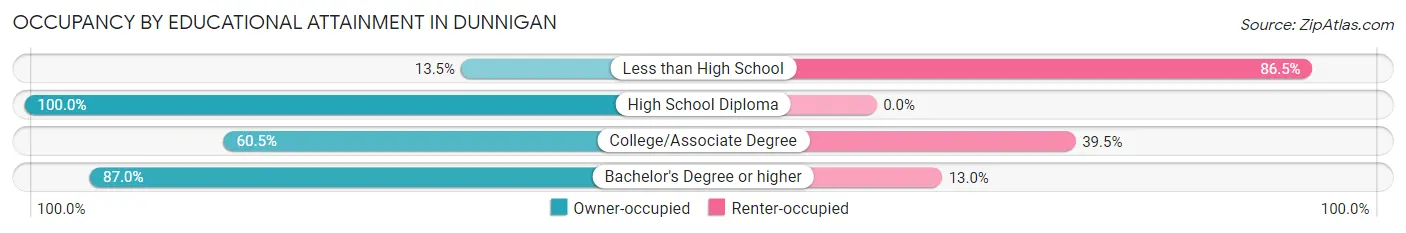
| Household Size | Owner-occupied | Renter-occupied |
| Less than High School | 20 (13.5%) | 128 (86.5%) |
| High School Diploma | 22 (100.0%) | 0 (0.0%) |
| College/Associate Degree | 69 (60.5%) | 45 (39.5%) |
| Bachelor's Degree or higher | 154 (87.0%) | 23 (13.0%) |
Occupancy by Age of Householder in Dunnigan
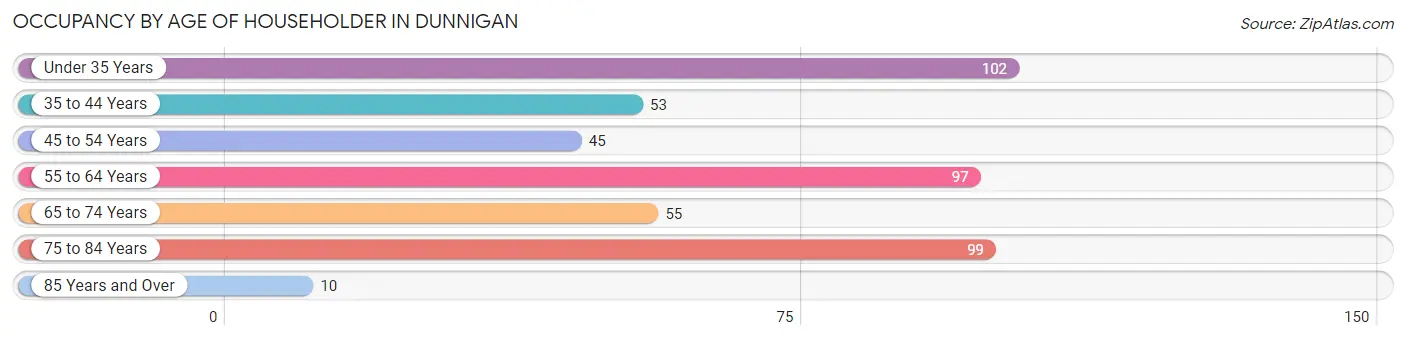
| Age Bracket | # Households | % Households |
| Under 35 Years | 102 | 22.1% |
| 35 to 44 Years | 53 | 11.5% |
| 45 to 54 Years | 45 | 9.8% |
| 55 to 64 Years | 97 | 21.0% |
| 65 to 74 Years | 55 | 11.9% |
| 75 to 84 Years | 99 | 21.5% |
| 85 Years and Over | 10 | 2.2% |
| Total | 461 | 100.0% |
Housing Finances in Dunnigan
Median Income by Occupancy in Dunnigan
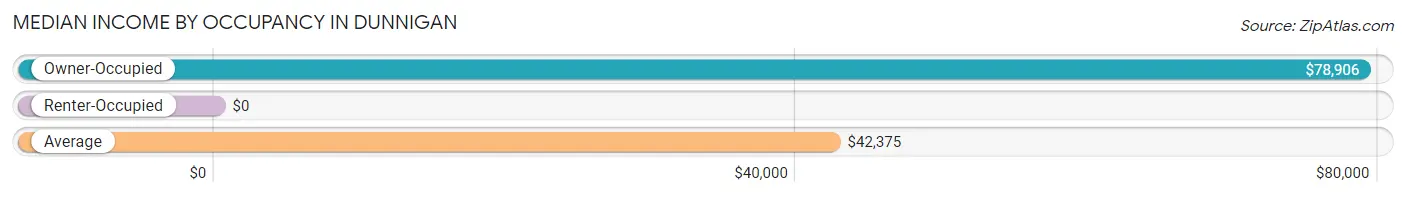
| Occupancy Type | # Households | Median Income |
| Owner-Occupied | 265 (57.5%) | $78,906 |
| Renter-Occupied | 196 (42.5%) | $0 |
| Average | 461 (100.0%) | $42,375 |
Occupancy by Householder Income Bracket in Dunnigan
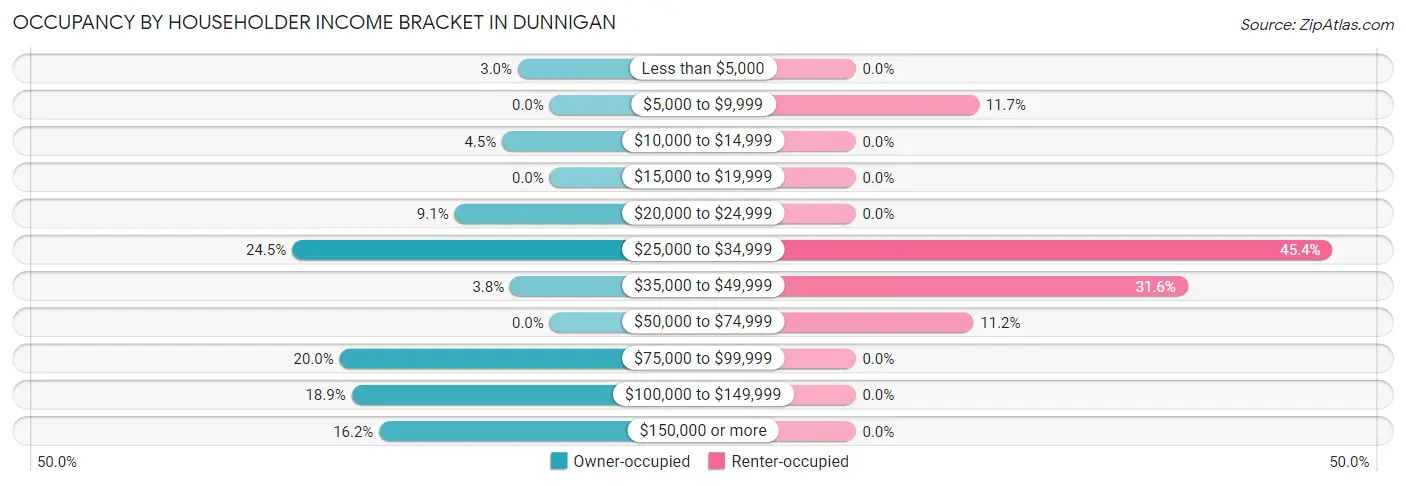
| Income Bracket | Owner-occupied | Renter-occupied |
| Less than $5,000 | 8 (3.0%) | 0 (0.0%) |
| $5,000 to $9,999 | 0 (0.0%) | 23 (11.7%) |
| $10,000 to $14,999 | 12 (4.5%) | 0 (0.0%) |
| $15,000 to $19,999 | 0 (0.0%) | 0 (0.0%) |
| $20,000 to $24,999 | 24 (9.1%) | 0 (0.0%) |
| $25,000 to $34,999 | 65 (24.5%) | 89 (45.4%) |
| $35,000 to $49,999 | 10 (3.8%) | 62 (31.6%) |
| $50,000 to $74,999 | 0 (0.0%) | 22 (11.2%) |
| $75,000 to $99,999 | 53 (20.0%) | 0 (0.0%) |
| $100,000 to $149,999 | 50 (18.9%) | 0 (0.0%) |
| $150,000 or more | 43 (16.2%) | 0 (0.0%) |
| Total | 265 (100.0%) | 196 (100.0%) |
Monthly Housing Cost Tiers in Dunnigan
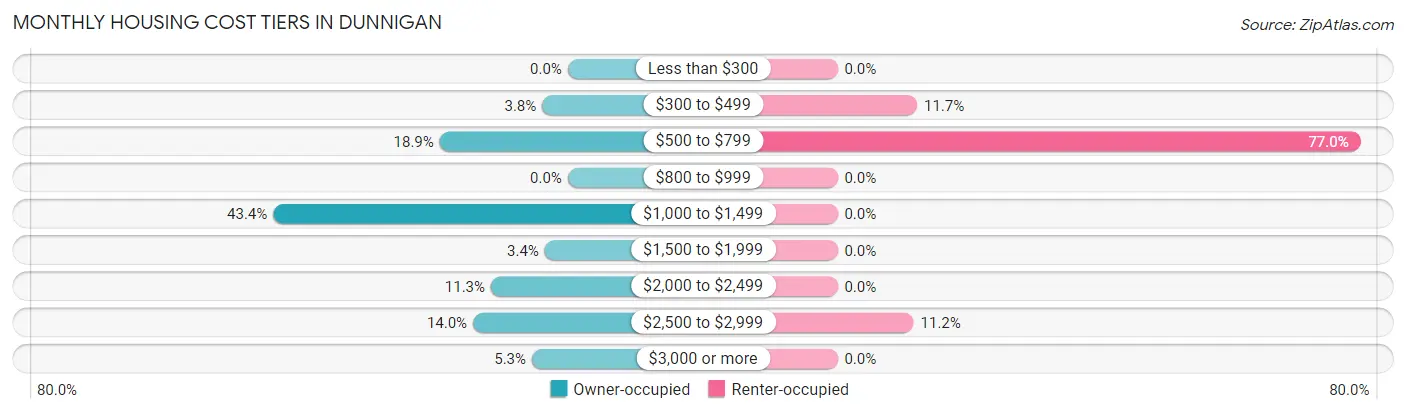
| Monthly Cost | Owner-occupied | Renter-occupied |
| Less than $300 | 0 (0.0%) | 0 (0.0%) |
| $300 to $499 | 10 (3.8%) | 23 (11.7%) |
| $500 to $799 | 50 (18.9%) | 151 (77.0%) |
| $800 to $999 | 0 (0.0%) | 0 (0.0%) |
| $1,000 to $1,499 | 115 (43.4%) | 0 (0.0%) |
| $1,500 to $1,999 | 9 (3.4%) | 0 (0.0%) |
| $2,000 to $2,499 | 30 (11.3%) | 0 (0.0%) |
| $2,500 to $2,999 | 37 (14.0%) | 22 (11.2%) |
| $3,000 or more | 14 (5.3%) | 0 (0.0%) |
| Total | 265 (100.0%) | 196 (100.0%) |
Physical Housing Characteristics in Dunnigan
Housing Structures in Dunnigan
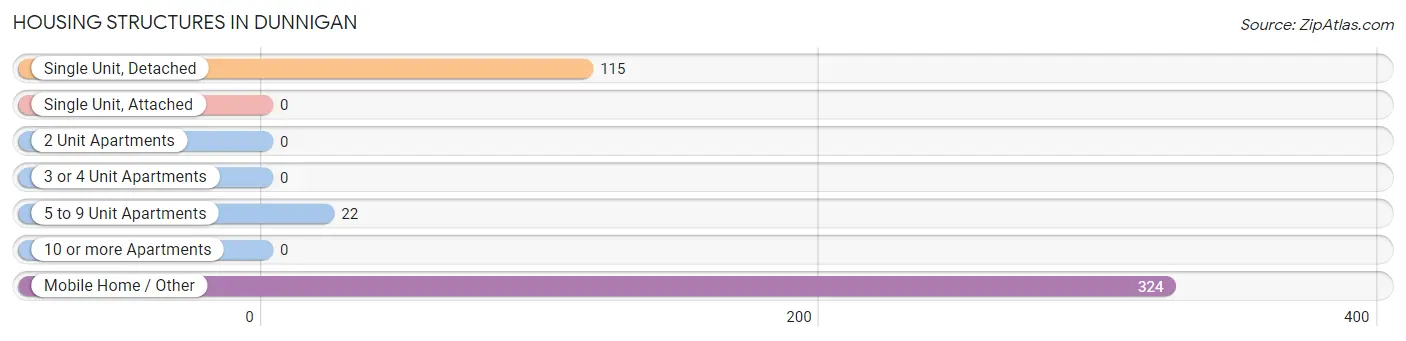
| Structure Type | # Housing Units | % Housing Units |
| Single Unit, Detached | 115 | 24.9% |
| Single Unit, Attached | 0 | 0.0% |
| 2 Unit Apartments | 0 | 0.0% |
| 3 or 4 Unit Apartments | 0 | 0.0% |
| 5 to 9 Unit Apartments | 22 | 4.8% |
| 10 or more Apartments | 0 | 0.0% |
| Mobile Home / Other | 324 | 70.3% |
| Total | 461 | 100.0% |
Housing Structures by Occupancy in Dunnigan
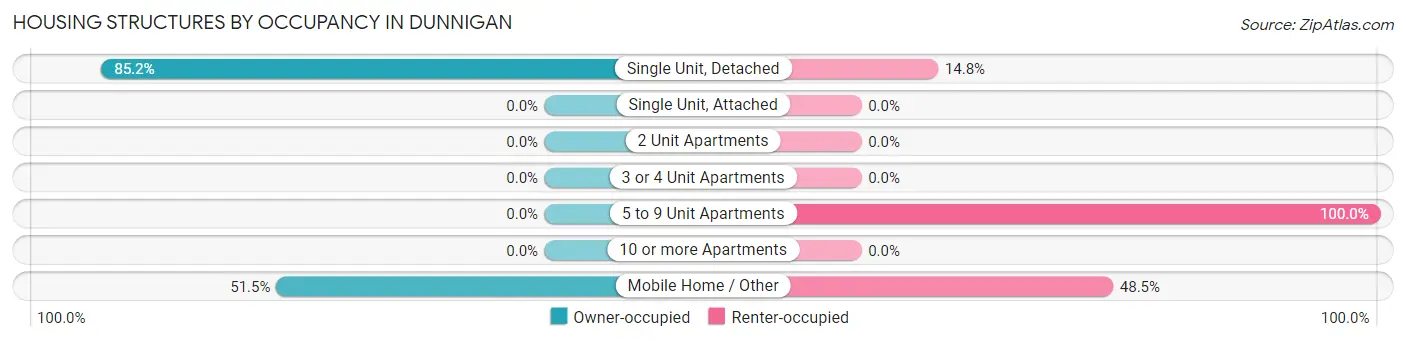
| Structure Type | Owner-occupied | Renter-occupied |
| Single Unit, Detached | 98 (85.2%) | 17 (14.8%) |
| Single Unit, Attached | 0 (0.0%) | 0 (0.0%) |
| 2 Unit Apartments | 0 (0.0%) | 0 (0.0%) |
| 3 or 4 Unit Apartments | 0 (0.0%) | 0 (0.0%) |
| 5 to 9 Unit Apartments | 0 (0.0%) | 22 (100.0%) |
| 10 or more Apartments | 0 (0.0%) | 0 (0.0%) |
| Mobile Home / Other | 167 (51.5%) | 157 (48.5%) |
| Total | 265 (57.5%) | 196 (42.5%) |
Housing Structures by Number of Rooms in Dunnigan
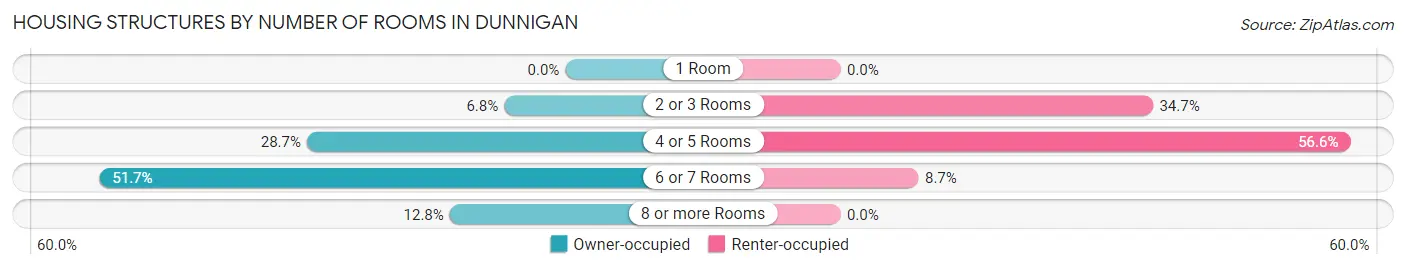
| Number of Rooms | Owner-occupied | Renter-occupied |
| 1 Room | 0 (0.0%) | 0 (0.0%) |
| 2 or 3 Rooms | 18 (6.8%) | 68 (34.7%) |
| 4 or 5 Rooms | 76 (28.7%) | 111 (56.6%) |
| 6 or 7 Rooms | 137 (51.7%) | 17 (8.7%) |
| 8 or more Rooms | 34 (12.8%) | 0 (0.0%) |
| Total | 265 (100.0%) | 196 (100.0%) |
Housing Structure by Heating Type in Dunnigan
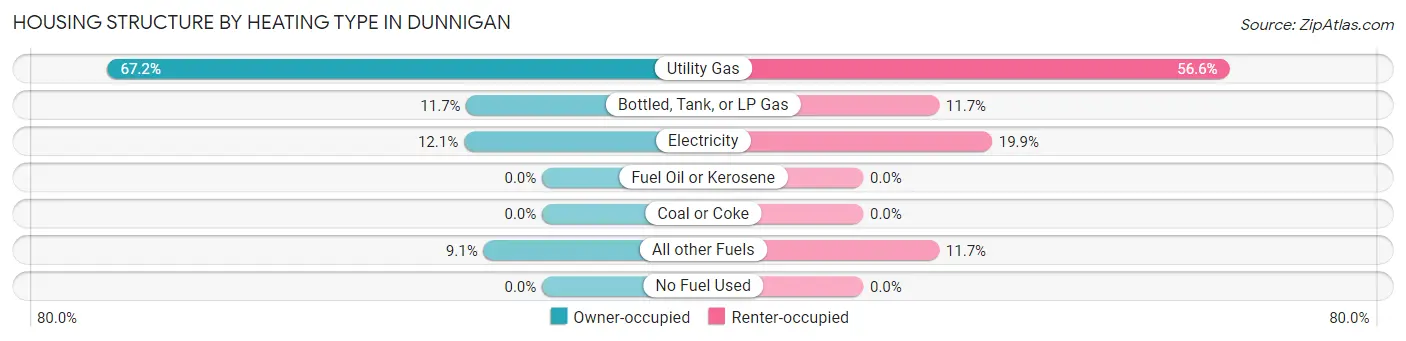
| Heating Type | Owner-occupied | Renter-occupied |
| Utility Gas | 178 (67.2%) | 111 (56.6%) |
| Bottled, Tank, or LP Gas | 31 (11.7%) | 23 (11.7%) |
| Electricity | 32 (12.1%) | 39 (19.9%) |
| Fuel Oil or Kerosene | 0 (0.0%) | 0 (0.0%) |
| Coal or Coke | 0 (0.0%) | 0 (0.0%) |
| All other Fuels | 24 (9.1%) | 23 (11.7%) |
| No Fuel Used | 0 (0.0%) | 0 (0.0%) |
| Total | 265 (100.0%) | 196 (100.0%) |
Household Vehicle Usage in Dunnigan
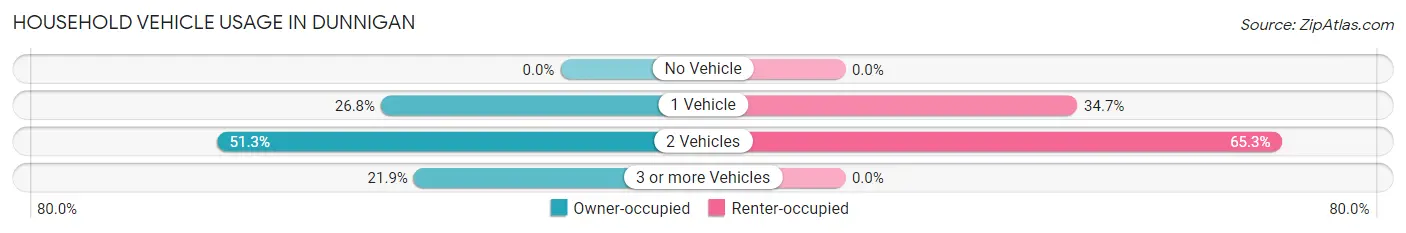
| Vehicles per Household | Owner-occupied | Renter-occupied |
| No Vehicle | 0 (0.0%) | 0 (0.0%) |
| 1 Vehicle | 71 (26.8%) | 68 (34.7%) |
| 2 Vehicles | 136 (51.3%) | 128 (65.3%) |
| 3 or more Vehicles | 58 (21.9%) | 0 (0.0%) |
| Total | 265 (100.0%) | 196 (100.0%) |
Real Estate & Mortgages in Dunnigan
Real Estate and Mortgage Overview in Dunnigan
| Characteristic | Without Mortgage | With Mortgage |
| Housing Units | 155 | 110 |
| Median Property Value | $136,600 | $427,900 |
| Median Household Income | - | - |
| Monthly Housing Costs | $1,123 | $0 |
| Real Estate Taxes | $1,154 | $0 |
Property Value by Mortgage Status in Dunnigan
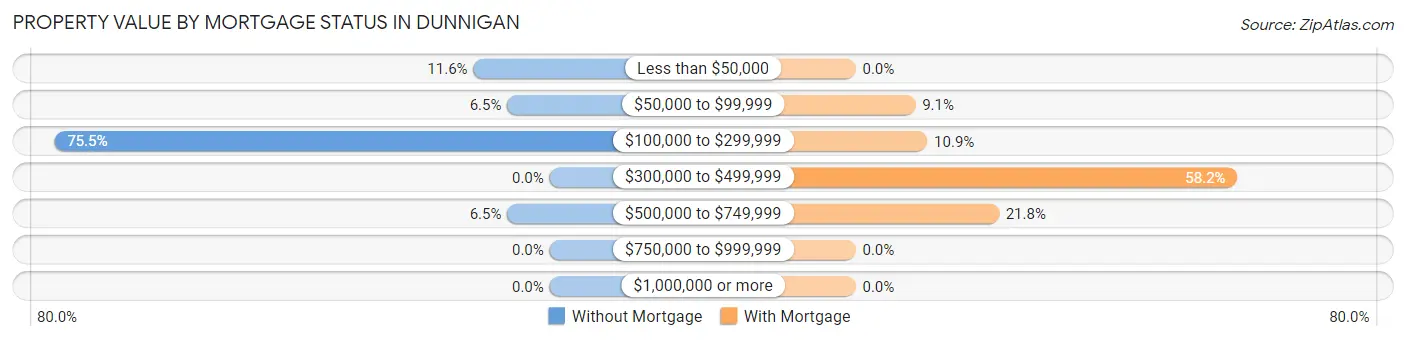
| Property Value | Without Mortgage | With Mortgage |
| Less than $50,000 | 18 (11.6%) | 0 (0.0%) |
| $50,000 to $99,999 | 10 (6.5%) | 10 (9.1%) |
| $100,000 to $299,999 | 117 (75.5%) | 12 (10.9%) |
| $300,000 to $499,999 | 0 (0.0%) | 64 (58.2%) |
| $500,000 to $749,999 | 10 (6.5%) | 24 (21.8%) |
| $750,000 to $999,999 | 0 (0.0%) | 0 (0.0%) |
| $1,000,000 or more | 0 (0.0%) | 0 (0.0%) |
| Total | 155 (100.0%) | 110 (100.0%) |
Household Income by Mortgage Status in Dunnigan
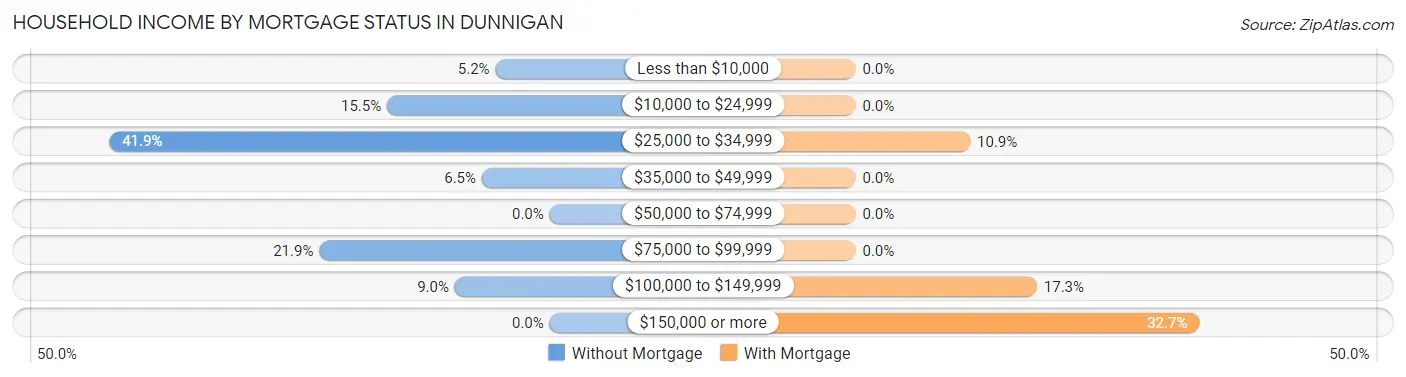
| Household Income | Without Mortgage | With Mortgage |
| Less than $10,000 | 8 (5.2%) | 0 (0.0%) |
| $10,000 to $24,999 | 24 (15.5%) | 0 (0.0%) |
| $25,000 to $34,999 | 65 (41.9%) | 12 (10.9%) |
| $35,000 to $49,999 | 10 (6.5%) | 0 (0.0%) |
| $50,000 to $74,999 | 0 (0.0%) | 0 (0.0%) |
| $75,000 to $99,999 | 34 (21.9%) | 0 (0.0%) |
| $100,000 to $149,999 | 14 (9.0%) | 19 (17.3%) |
| $150,000 or more | 0 (0.0%) | 36 (32.7%) |
| Total | 155 (100.0%) | 110 (100.0%) |
Property Value to Household Income Ratio in Dunnigan
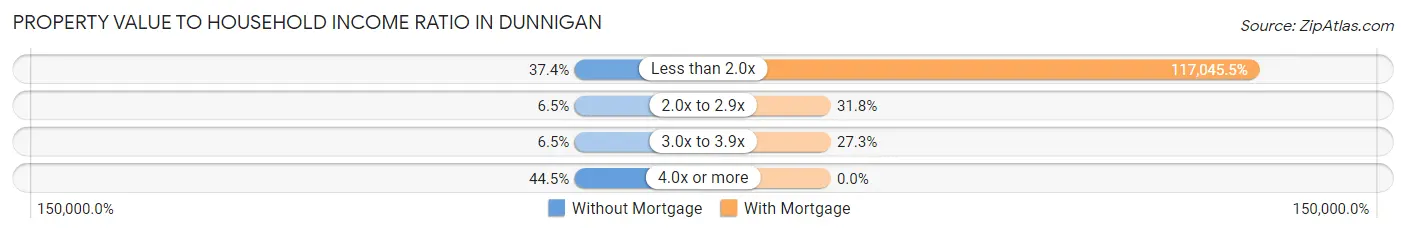
| Value-to-Income Ratio | Without Mortgage | With Mortgage |
| Less than 2.0x | 58 (37.4%) | 128,750 (117,045.5%) |
| 2.0x to 2.9x | 10 (6.5%) | 35 (31.8%) |
| 3.0x to 3.9x | 10 (6.5%) | 30 (27.3%) |
| 4.0x or more | 69 (44.5%) | 0 (0.0%) |
| Total | 155 (100.0%) | 110 (100.0%) |
Real Estate Taxes by Mortgage Status in Dunnigan
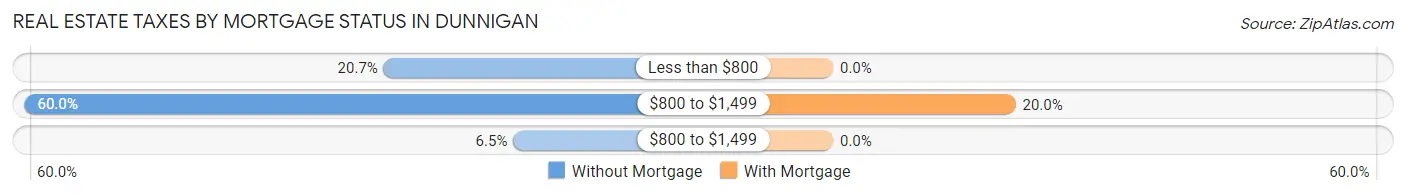
| Property Taxes | Without Mortgage | With Mortgage |
| Less than $800 | 32 (20.6%) | 0 (0.0%) |
| $800 to $1,499 | 93 (60.0%) | 22 (20.0%) |
| $800 to $1,499 | 10 (6.5%) | 0 (0.0%) |
| Total | 155 (100.0%) | 110 (100.0%) |
Health & Disability in Dunnigan
Health Insurance Coverage by Age in Dunnigan
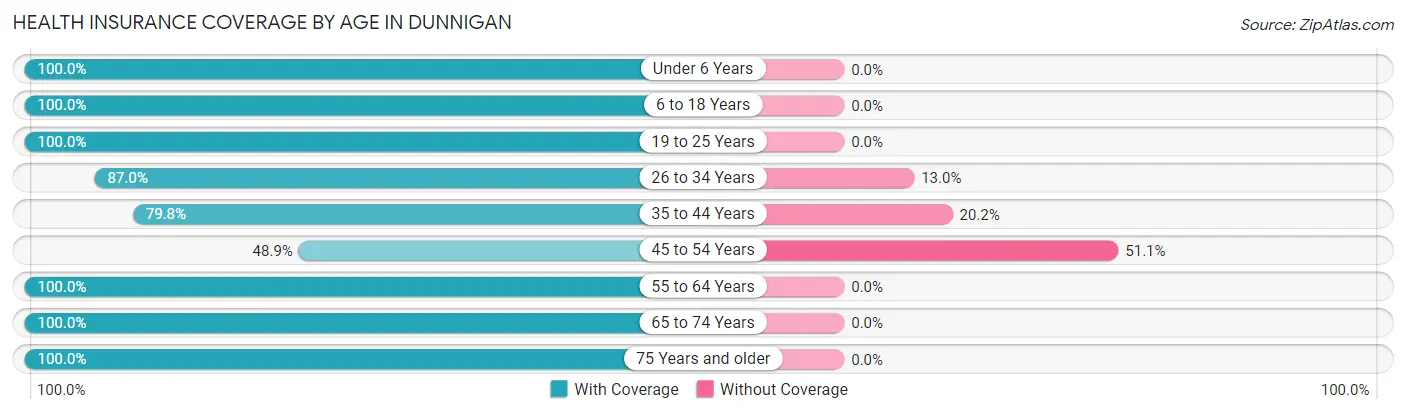
| Age Bracket | With Coverage | Without Coverage |
| Under 6 Years | 142 (100.0%) | 0 (0.0%) |
| 6 to 18 Years | 76 (100.0%) | 0 (0.0%) |
| 19 to 25 Years | 103 (100.0%) | 0 (0.0%) |
| 26 to 34 Years | 120 (87.0%) | 18 (13.0%) |
| 35 to 44 Years | 91 (79.8%) | 23 (20.2%) |
| 45 to 54 Years | 22 (48.9%) | 23 (51.1%) |
| 55 to 64 Years | 126 (100.0%) | 0 (0.0%) |
| 65 to 74 Years | 117 (100.0%) | 0 (0.0%) |
| 75 Years and older | 184 (100.0%) | 0 (0.0%) |
| Total | 981 (93.9%) | 64 (6.1%) |
Health Insurance Coverage by Citizenship Status in Dunnigan

| Citizenship Status | With Coverage | Without Coverage |
| Native Born | 142 (100.0%) | 0 (0.0%) |
| Foreign Born, Citizen | 76 (100.0%) | 0 (0.0%) |
| Foreign Born, not a Citizen | 103 (100.0%) | 0 (0.0%) |
Health Insurance Coverage by Household Income in Dunnigan
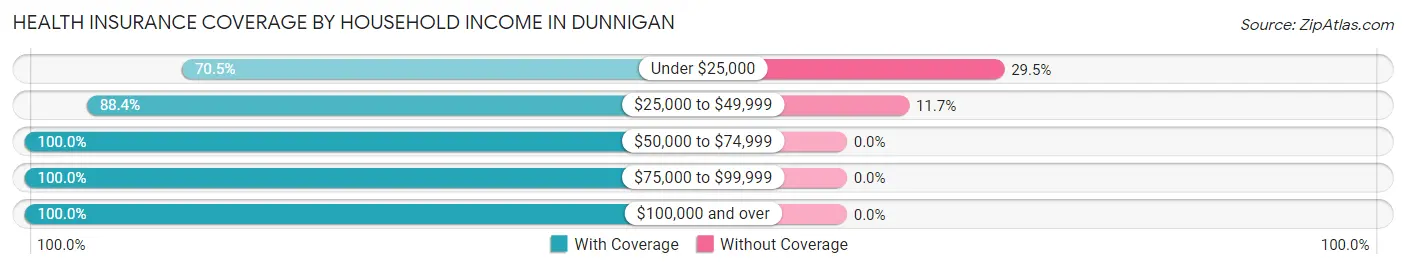
| Household Income | With Coverage | Without Coverage |
| Under $25,000 | 55 (70.5%) | 23 (29.5%) |
| $25,000 to $49,999 | 311 (88.3%) | 41 (11.7%) |
| $50,000 to $74,999 | 89 (100.0%) | 0 (0.0%) |
| $75,000 to $99,999 | 199 (100.0%) | 0 (0.0%) |
| $100,000 and over | 327 (100.0%) | 0 (0.0%) |
Public vs Private Health Insurance Coverage by Age in Dunnigan
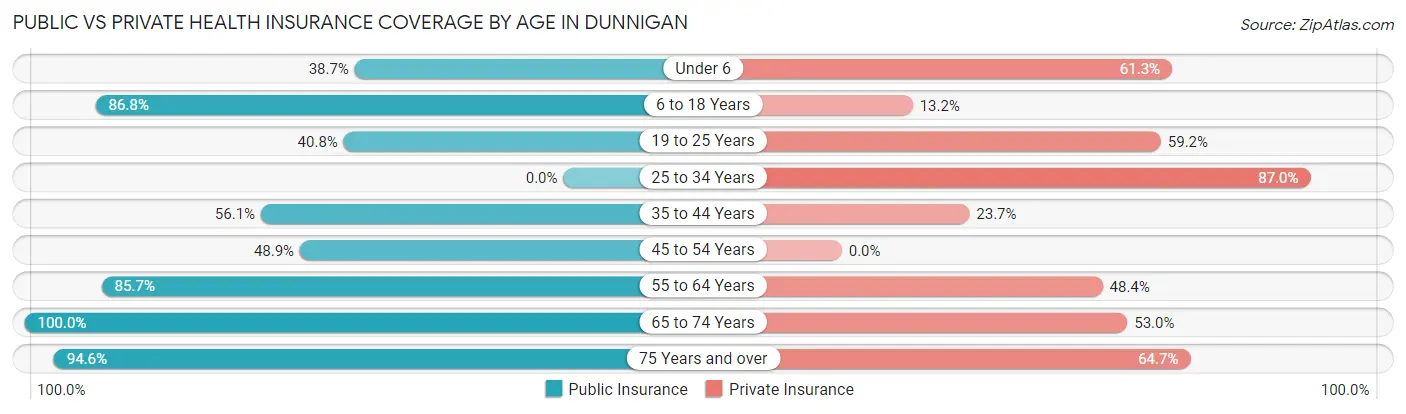
| Age Bracket | Public Insurance | Private Insurance |
| Under 6 | 55 (38.7%) | 87 (61.3%) |
| 6 to 18 Years | 66 (86.8%) | 10 (13.2%) |
| 19 to 25 Years | 42 (40.8%) | 61 (59.2%) |
| 25 to 34 Years | 0 (0.0%) | 120 (87.0%) |
| 35 to 44 Years | 64 (56.1%) | 27 (23.7%) |
| 45 to 54 Years | 22 (48.9%) | 0 (0.0%) |
| 55 to 64 Years | 108 (85.7%) | 61 (48.4%) |
| 65 to 74 Years | 117 (100.0%) | 62 (53.0%) |
| 75 Years and over | 174 (94.6%) | 119 (64.7%) |
| Total | 648 (62.0%) | 547 (52.3%) |
Disability Status by Sex by Age in Dunnigan
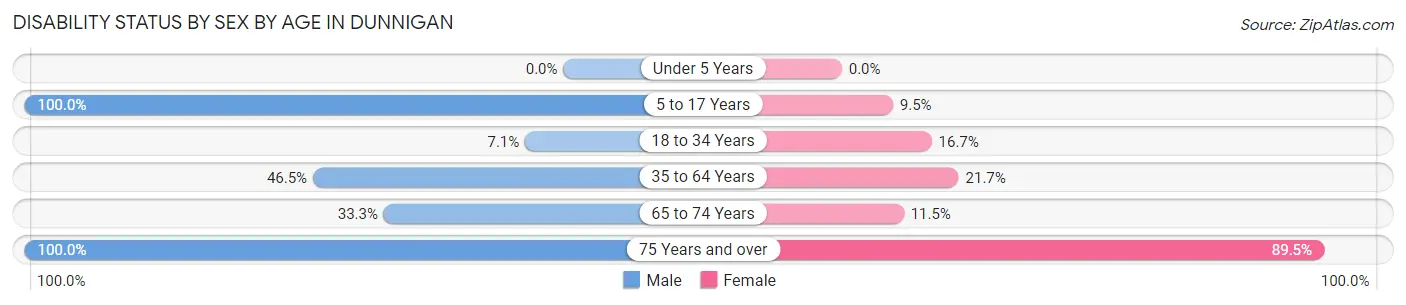
| Age Bracket | Male | Female |
| Under 5 Years | 0 (0.0%) | 0 (0.0%) |
| 5 to 17 Years | 11 (100.0%) | 9 (9.5%) |
| 18 to 34 Years | 12 (7.1%) | 12 (16.7%) |
| 35 to 64 Years | 66 (46.5%) | 31 (21.7%) |
| 65 to 74 Years | 10 (33.3%) | 10 (11.5%) |
| 75 Years and over | 89 (100.0%) | 85 (89.5%) |
Disability Class by Sex by Age in Dunnigan
Disability Class: Hearing Difficulty
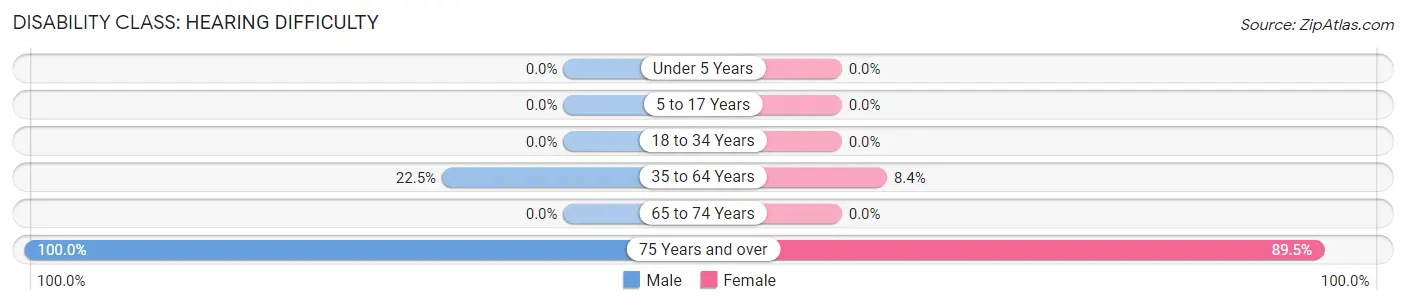
| Age Bracket | Male | Female |
| Under 5 Years | 0 (0.0%) | 0 (0.0%) |
| 5 to 17 Years | 0 (0.0%) | 0 (0.0%) |
| 18 to 34 Years | 0 (0.0%) | 0 (0.0%) |
| 35 to 64 Years | 32 (22.5%) | 12 (8.4%) |
| 65 to 74 Years | 0 (0.0%) | 0 (0.0%) |
| 75 Years and over | 89 (100.0%) | 85 (89.5%) |
Disability Class: Vision Difficulty
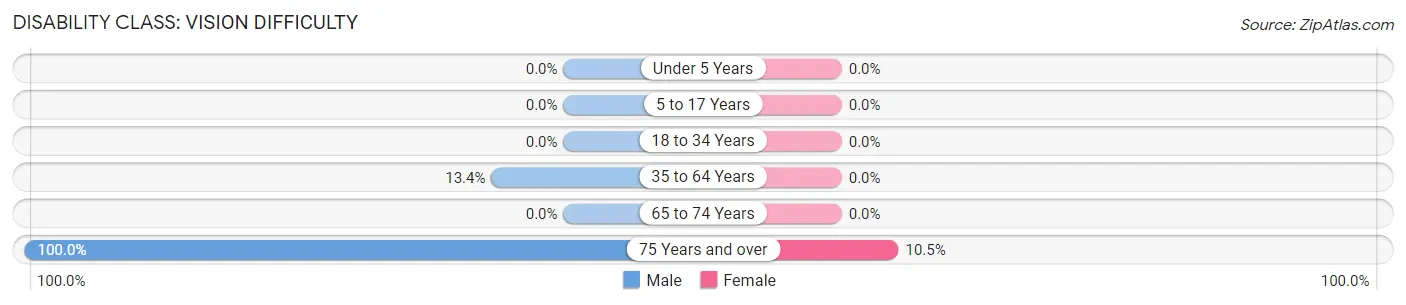
| Age Bracket | Male | Female |
| Under 5 Years | 0 (0.0%) | 0 (0.0%) |
| 5 to 17 Years | 0 (0.0%) | 0 (0.0%) |
| 18 to 34 Years | 0 (0.0%) | 0 (0.0%) |
| 35 to 64 Years | 19 (13.4%) | 0 (0.0%) |
| 65 to 74 Years | 0 (0.0%) | 0 (0.0%) |
| 75 Years and over | 89 (100.0%) | 10 (10.5%) |
Disability Class: Cognitive Difficulty
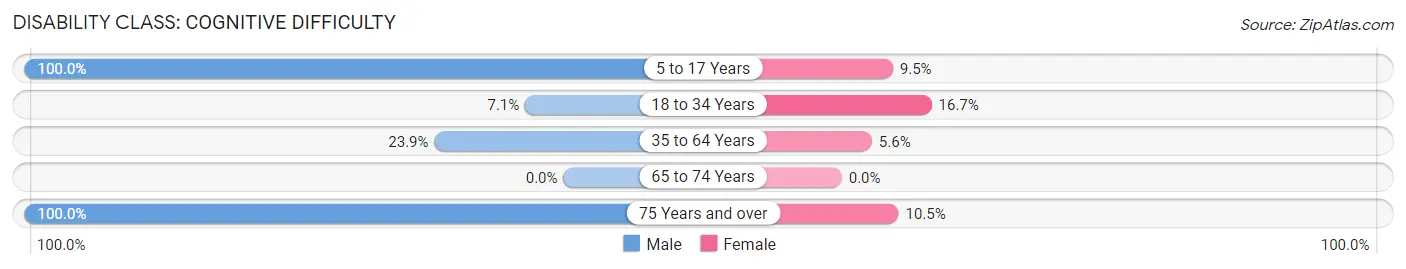
| Age Bracket | Male | Female |
| 5 to 17 Years | 11 (100.0%) | 9 (9.5%) |
| 18 to 34 Years | 12 (7.1%) | 12 (16.7%) |
| 35 to 64 Years | 34 (23.9%) | 8 (5.6%) |
| 65 to 74 Years | 0 (0.0%) | 0 (0.0%) |
| 75 Years and over | 89 (100.0%) | 10 (10.5%) |
Disability Class: Ambulatory Difficulty
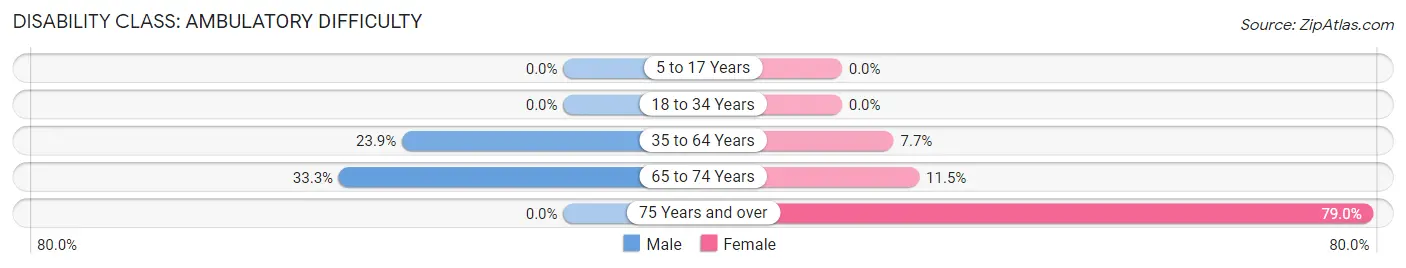
| Age Bracket | Male | Female |
| 5 to 17 Years | 0 (0.0%) | 0 (0.0%) |
| 18 to 34 Years | 0 (0.0%) | 0 (0.0%) |
| 35 to 64 Years | 34 (23.9%) | 11 (7.7%) |
| 65 to 74 Years | 10 (33.3%) | 10 (11.5%) |
| 75 Years and over | 0 (0.0%) | 75 (78.9%) |
Disability Class: Self-Care Difficulty
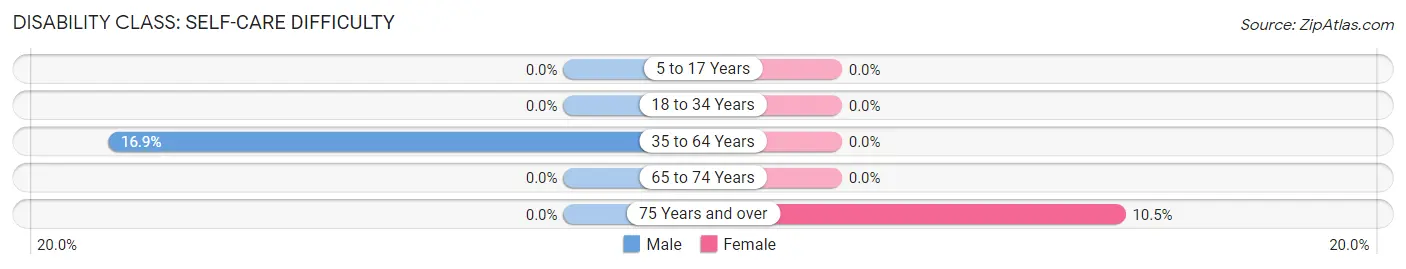
| Age Bracket | Male | Female |
| 5 to 17 Years | 0 (0.0%) | 0 (0.0%) |
| 18 to 34 Years | 0 (0.0%) | 0 (0.0%) |
| 35 to 64 Years | 24 (16.9%) | 0 (0.0%) |
| 65 to 74 Years | 0 (0.0%) | 0 (0.0%) |
| 75 Years and over | 0 (0.0%) | 10 (10.5%) |
Technology Access in Dunnigan
Computing Device Access in Dunnigan
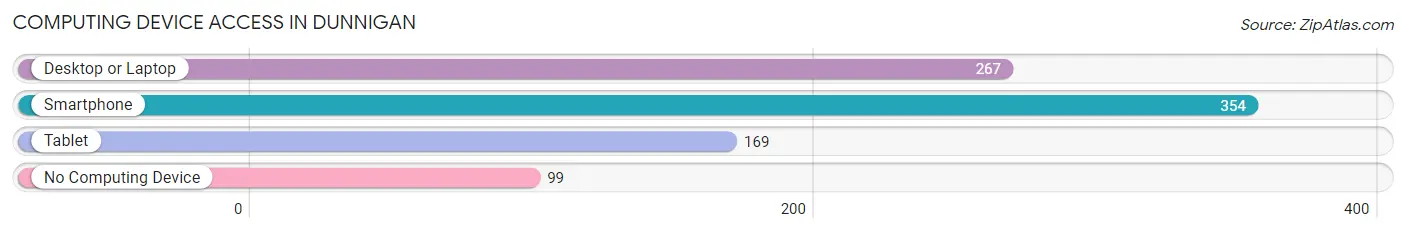
| Device Type | # Households | % Households |
| Desktop or Laptop | 267 | 57.9% |
| Smartphone | 354 | 76.8% |
| Tablet | 169 | 36.7% |
| No Computing Device | 99 | 21.5% |
| Total | 461 | 100.0% |
Internet Access in Dunnigan
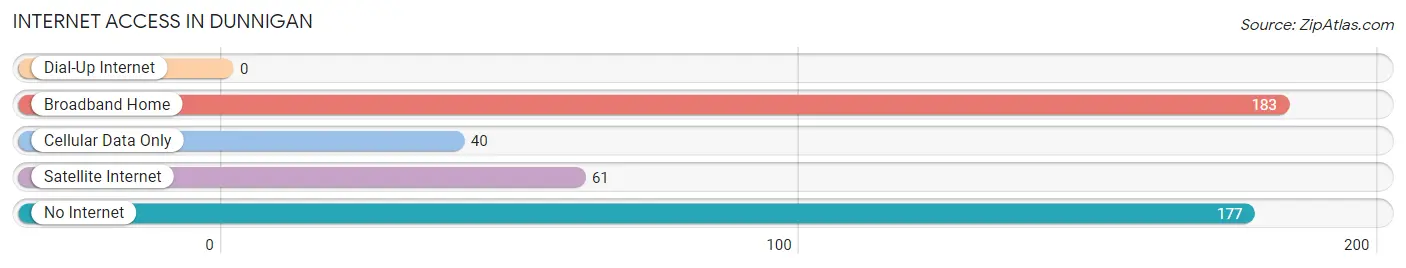
| Internet Type | # Households | % Households |
| Dial-Up Internet | 0 | 0.0% |
| Broadband Home | 183 | 39.7% |
| Cellular Data Only | 40 | 8.7% |
| Satellite Internet | 61 | 13.2% |
| No Internet | 177 | 38.4% |
| Total | 461 | 100.0% |
Dunnigan Summary
Dunnigan is a small unincorporated community located in Yolo County, California. It is situated in the northern part of the county, approximately 20 miles west of the county seat of Woodland. The population of Dunnigan was estimated to be 1,093 in 2019.
History
Dunnigan was founded in 1871 by William Dunnigan, a rancher from Missouri. He purchased a large tract of land in the area and began to develop it for agricultural purposes. The town was originally known as "Dunnigan's Station" and was a stop on the Central Pacific Railroad. In 1876, the town was officially incorporated as Dunnigan.
The town grew slowly over the years, but it was not until the 1950s that it began to experience significant growth. This was due to the construction of Interstate 5, which ran through the town. This made Dunnigan a convenient stop for travelers and businesses.
Geography
Dunnigan is located in the northern part of Yolo County, approximately 20 miles west of the county seat of Woodland. It is situated in the Central Valley of California, between the Sierra Nevada Mountains to the east and the Coast Range to the west. The town is located at an elevation of approximately 100 feet above sea level.
The climate in Dunnigan is classified as Mediterranean, with hot, dry summers and mild, wet winters. The average annual temperature is around 60 degrees Fahrenheit, with an average high of around 90 degrees in the summer and an average low of around 40 degrees in the winter.
Economy
The economy of Dunnigan is largely based on agriculture. The town is home to several large farms, which produce a variety of crops, including tomatoes, corn, wheat, and alfalfa. The town is also home to several wineries, which produce a variety of wines.
In addition to agriculture, Dunnigan is home to several small businesses, including restaurants, gas stations, and convenience stores. The town is also home to a few manufacturing companies, which produce a variety of products, including furniture and clothing.
Demographics
As of 2019, the population of Dunnigan was estimated to be 1,093. The racial makeup of the town was 79.3% White, 0.7% African American, 0.3% Native American, 0.7% Asian, 0.1% Pacific Islander, 16.2% from other races, and 2.9% from two or more races. Hispanic or Latino of any race were 33.2% of the population.
The median household income in Dunnigan was $50,938, and the median family income was $54,844. The per capita income was $20,945. About 16.2% of families and 19.2% of the population were below the poverty line, including 28.3% of those under age 18 and 8.3% of those age 65 or over.
Common Questions
What is Per Capita Income in Dunnigan?
Per Capita income in Dunnigan is $40,454.
What is the Median Family Income in Dunnigan?
Median Family Income in Dunnigan is $78,594.
What is the Median Household income in Dunnigan?
Median Household Income in Dunnigan is $42,375.
What is Income or Wage Gap in Dunnigan?
Income or Wage Gap in Dunnigan is 56.0%.
Women in Dunnigan earn 44.0 cents for every dollar earned by a man.
What is Inequality or Gini Index in Dunnigan?
Inequality or Gini Index in Dunnigan is 0.61.
What is the Total Population of Dunnigan?
Total Population of Dunnigan is 1,045.
What is the Total Male Population of Dunnigan?
Total Male Population of Dunnigan is 520.
What is the Total Female Population of Dunnigan?
Total Female Population of Dunnigan is 525.
What is the Ratio of Males per 100 Females in Dunnigan?
There are 99.05 Males per 100 Females in Dunnigan.
What is the Ratio of Females per 100 Males in Dunnigan?
There are 100.96 Females per 100 Males in Dunnigan.
What is the Median Population Age in Dunnigan?
Median Population Age in Dunnigan is 42.0 Years.
What is the Average Family Size in Dunnigan
Average Family Size in Dunnigan is 3.7 People.
What is the Average Household Size in Dunnigan
Average Household Size in Dunnigan is 2.3 People.
How Large is the Labor Force in Dunnigan?
There are 376 People in the Labor Forcein in Dunnigan.
What is the Percentage of People in the Labor Force in Dunnigan?
44.7% of People are in the Labor Force in Dunnigan.