Cities with the Highest Percentage of Population Employed in Security & Protection in New York
RELATED REPORTS & OPTIONS
Security & Protection
New York
Compare Cities
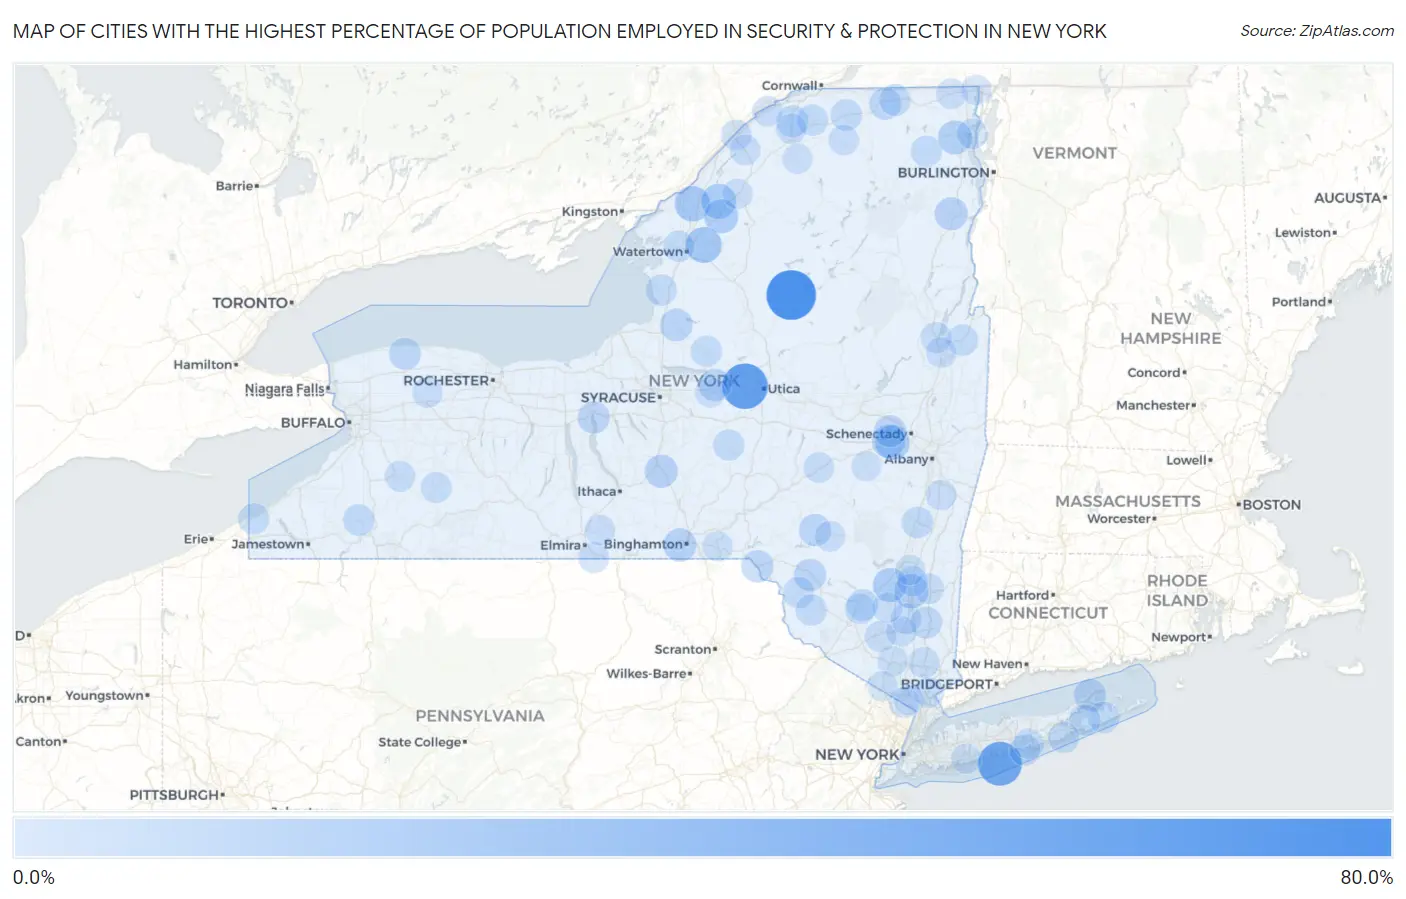
Map of Cities with the Highest Percentage of Population Employed in Security & Protection in New York
0.0%
80.0%
Cities with the Highest Percentage of Population Employed in Security & Protection in New York
| City | % Employed | vs State | vs National | |
| 1. | Thendara | 68.3% | 2.9%(+65.3)#1 | 2.1%(+66.1)#11 |
| 2. | Westmoreland | 56.1% | 2.9%(+53.2)#2 | 2.1%(+54.0)#22 |
| 3. | Ocean Beach | 50.0% | 2.9%(+47.1)#3 | 2.1%(+47.9)#31 |
| 4. | South Ilion | 45.5% | 2.9%(+42.5)#4 | 2.1%(+43.3)#40 |
| 5. | Felts Mills | 25.3% | 2.9%(+22.3)#5 | 2.1%(+23.1)#175 |
| 6. | Plessis | 23.7% | 2.9%(+20.8)#6 | 2.1%(+21.6)#207 |
| 7. | Oxbow | 22.0% | 2.9%(+19.0)#7 | 2.1%(+19.8)#235 |
| 8. | Duane Lake | 21.1% | 2.9%(+18.1)#8 | 2.1%(+18.9)#252 |
| 9. | Hyde Park | 20.0% | 2.9%(+17.1)#9 | 2.1%(+17.9)#272 |
| 10. | High Falls | 20.0% | 2.9%(+17.1)#10 | 2.1%(+17.9)#274 |
| 11. | Antwerp | 19.5% | 2.9%(+16.6)#11 | 2.1%(+17.4)#288 |
| 12. | Morrisonville | 19.1% | 2.9%(+16.1)#12 | 2.1%(+16.9)#305 |
| 13. | Duanesburg | 17.1% | 2.9%(+14.2)#13 | 2.1%(+15.0)#381 |
| 14. | Binghamton University | 16.9% | 2.9%(+14.0)#14 | 2.1%(+14.7)#390 |
| 15. | Blodgett Mills | 16.5% | 2.9%(+13.6)#15 | 2.1%(+14.4)#407 |
| 16. | Elizabethtown | 16.4% | 2.9%(+13.5)#16 | 2.1%(+14.3)#411 |
| 17. | Round Top | 15.9% | 2.9%(+13.0)#17 | 2.1%(+13.8)#438 |
| 18. | Altmar | 15.4% | 2.9%(+12.5)#18 | 2.1%(+13.2)#463 |
| 19. | Woodbourne | 14.7% | 2.9%(+11.8)#19 | 2.1%(+12.5)#506 |
| 20. | Jefferson | 14.5% | 2.9%(+11.6)#20 | 2.1%(+12.4)#522 |
| 21. | Durhamville | 14.5% | 2.9%(+11.6)#21 | 2.1%(+12.3)#527 |
| 22. | Livingston Manor | 14.1% | 2.9%(+11.2)#22 | 2.1%(+12.0)#556 |
| 23. | Hancock | 13.9% | 2.9%(+11.0)#23 | 2.1%(+11.8)#570 |
| 24. | Mariaville Lake | 13.9% | 2.9%(+11.0)#24 | 2.1%(+11.7)#571 |
| 25. | Mclean | 13.9% | 2.9%(+10.9)#25 | 2.1%(+11.7)#577 |
| 26. | Andes | 13.7% | 2.9%(+10.8)#26 | 2.1%(+11.6)#590 |
| 27. | Greenport West | 13.7% | 2.9%(+10.8)#27 | 2.1%(+11.5)#592 |
| 28. | Cayuga | 13.6% | 2.9%(+10.7)#28 | 2.1%(+11.4)#605 |
| 29. | Lyndonville | 13.1% | 2.9%(+10.2)#29 | 2.1%(+10.9)#656 |
| 30. | Hopewell Junction | 13.0% | 2.9%(+10.1)#30 | 2.1%(+10.9)#661 |
| 31. | Burke | 13.0% | 2.9%(+10.1)#31 | 2.1%(+10.8)#664 |
| 32. | Norfolk | 12.8% | 2.9%(+9.85)#32 | 2.1%(+10.6)#686 |
| 33. | Brushton | 12.0% | 2.9%(+9.09)#33 | 2.1%(+9.85)#756 |
| 34. | New Hamburg | 12.0% | 2.9%(+9.08)#34 | 2.1%(+9.84)#762 |
| 35. | Ellenville | 12.0% | 2.9%(+9.06)#35 | 2.1%(+9.83)#763 |
| 36. | Chateaugay | 12.0% | 2.9%(+9.05)#36 | 2.1%(+9.81)#765 |
| 37. | Wainscott | 11.9% | 2.9%(+8.99)#37 | 2.1%(+9.76)#774 |
| 38. | Jefferson Heights | 11.8% | 2.9%(+8.86)#38 | 2.1%(+9.63)#789 |
| 39. | Mount Vision | 11.7% | 2.9%(+8.76)#39 | 2.1%(+9.52)#814 |
| 40. | Little Valley | 11.6% | 2.9%(+8.72)#40 | 2.1%(+9.48)#818 |
| 41. | Cadyville | 11.6% | 2.9%(+8.71)#41 | 2.1%(+9.47)#824 |
| 42. | Brownville | 11.4% | 2.9%(+8.51)#42 | 2.1%(+9.27)#848 |
| 43. | Jeffersonville | 11.4% | 2.9%(+8.48)#43 | 2.1%(+9.24)#853 |
| 44. | Sleepy Hollow Lake | 11.3% | 2.9%(+8.35)#44 | 2.1%(+9.12)#869 |
| 45. | Fort Ann | 11.3% | 2.9%(+8.35)#45 | 2.1%(+9.11)#870 |
| 46. | Winthrop | 11.2% | 2.9%(+8.29)#46 | 2.1%(+9.05)#882 |
| 47. | Earlville | 11.2% | 2.9%(+8.26)#47 | 2.1%(+9.03)#886 |
| 48. | Ellisburg | 11.1% | 2.9%(+8.20)#48 | 2.1%(+8.96)#902 |
| 49. | Camden | 11.0% | 2.9%(+8.08)#49 | 2.1%(+8.84)#925 |
| 50. | Redford | 11.0% | 2.9%(+8.05)#50 | 2.1%(+8.81)#933 |
| 51. | Smallwood | 10.9% | 2.9%(+7.96)#51 | 2.1%(+8.72)#941 |
| 52. | North Sea | 10.8% | 2.9%(+7.90)#52 | 2.1%(+8.66)#953 |
| 53. | Quogue | 10.8% | 2.9%(+7.87)#53 | 2.1%(+8.63)#958 |
| 54. | Ripley | 10.7% | 2.9%(+7.78)#54 | 2.1%(+8.54)#972 |
| 55. | Bellport | 10.5% | 2.9%(+7.56)#55 | 2.1%(+8.32)#1,018 |
| 56. | Walworth | 10.2% | 2.9%(+7.30)#56 | 2.1%(+8.06)#1,055 |
| 57. | Shrub Oak | 10.2% | 2.9%(+7.28)#57 | 2.1%(+8.04)#1,060 |
| 58. | Wellsburg | 10.2% | 2.9%(+7.27)#58 | 2.1%(+8.04)#1,062 |
| 59. | Lake George | 10.1% | 2.9%(+7.23)#59 | 2.1%(+7.99)#1,074 |
| 60. | Fillmore | 10.1% | 2.9%(+7.23)#60 | 2.1%(+7.99)#1,075 |
| 61. | Cumberland Head | 10.1% | 2.9%(+7.19)#61 | 2.1%(+7.95)#1,081 |
| 62. | Cragsmoor | 9.8% | 2.9%(+6.91)#62 | 2.1%(+7.68)#1,129 |
| 63. | Marlboro | 9.8% | 2.9%(+6.90)#63 | 2.1%(+7.66)#1,136 |
| 64. | Maybrook | 9.7% | 2.9%(+6.74)#64 | 2.1%(+7.51)#1,165 |
| 65. | Worcester | 9.6% | 2.9%(+6.69)#65 | 2.1%(+7.45)#1,181 |
| 66. | Arcade | 9.5% | 2.9%(+6.57)#66 | 2.1%(+7.33)#1,202 |
| 67. | Salt Point | 9.5% | 2.9%(+6.54)#67 | 2.1%(+7.30)#1,209 |
| 68. | Ogdensburg | 9.4% | 2.9%(+6.53)#68 | 2.1%(+7.30)#1,212 |
| 69. | Heuvelton | 9.3% | 2.9%(+6.40)#69 | 2.1%(+7.16)#1,239 |
| 70. | St Regis Falls | 9.3% | 2.9%(+6.35)#70 | 2.1%(+7.11)#1,251 |
| 71. | North Granville | 9.1% | 2.9%(+6.23)#71 | 2.1%(+7.00)#1,275 |
| 72. | Highland-On-The-Lake | 9.1% | 2.9%(+6.17)#72 | 2.1%(+6.94)#1,315 |
| 73. | Norwood | 9.1% | 2.9%(+6.16)#73 | 2.1%(+6.93)#1,317 |
| 74. | Valatie | 9.0% | 2.9%(+6.13)#74 | 2.1%(+6.89)#1,323 |
| 75. | Brewster Heights | 9.0% | 2.9%(+6.08)#75 | 2.1%(+6.84)#1,339 |
| 76. | Glens Falls North | 8.9% | 2.9%(+6.02)#76 | 2.1%(+6.78)#1,357 |
| 77. | Elba | 8.9% | 2.9%(+6.00)#77 | 2.1%(+6.77)#1,363 |
| 78. | Pearl River | 8.9% | 2.9%(+5.96)#78 | 2.1%(+6.72)#1,380 |
| 79. | Mooers | 8.7% | 2.9%(+5.84)#79 | 2.1%(+6.60)#1,406 |
| 80. | Balmville | 8.7% | 2.9%(+5.83)#80 | 2.1%(+6.60)#1,412 |
| 81. | Margaretville | 8.7% | 2.9%(+5.83)#81 | 2.1%(+6.59)#1,414 |
| 82. | Waddington | 8.7% | 2.9%(+5.83)#82 | 2.1%(+6.59)#1,415 |
| 83. | Erin | 8.7% | 2.9%(+5.83)#83 | 2.1%(+6.59)#1,417 |
| 84. | Brookhaven | 8.7% | 2.9%(+5.79)#84 | 2.1%(+6.55)#1,428 |
| 85. | Stittville | 8.6% | 2.9%(+5.69)#85 | 2.1%(+6.45)#1,456 |
| 86. | Rouses Point | 8.6% | 2.9%(+5.68)#86 | 2.1%(+6.44)#1,458 |
| 87. | Staatsburg | 8.5% | 2.9%(+5.64)#87 | 2.1%(+6.40)#1,470 |
| 88. | Thornwood | 8.4% | 2.9%(+5.52)#88 | 2.1%(+6.28)#1,511 |
| 89. | Windsor | 8.4% | 2.9%(+5.47)#89 | 2.1%(+6.24)#1,520 |
| 90. | Chelsea Cove | 8.4% | 2.9%(+5.46)#90 | 2.1%(+6.22)#1,528 |
| 91. | Woodbury | 8.3% | 2.9%(+5.42)#91 | 2.1%(+6.18)#1,533 |
| 92. | Rhinecliff | 8.3% | 2.9%(+5.38)#92 | 2.1%(+6.15)#1,560 |
| 93. | Sloatsburg | 8.2% | 2.9%(+5.30)#93 | 2.1%(+6.06)#1,586 |
| 94. | Colton | 8.2% | 2.9%(+5.30)#94 | 2.1%(+6.06)#1,587 |
| 95. | Gardiner | 8.2% | 2.9%(+5.29)#95 | 2.1%(+6.05)#1,589 |
| 96. | Blauvelt | 8.1% | 2.9%(+5.23)#96 | 2.1%(+5.99)#1,607 |
| 97. | Massapequa Park | 8.1% | 2.9%(+5.21)#97 | 2.1%(+5.97)#1,614 |
| 98. | Gouverneur | 8.1% | 2.9%(+5.15)#98 | 2.1%(+5.91)#1,638 |
| 99. | Wampsville | 8.0% | 2.9%(+5.06)#99 | 2.1%(+5.82)#1,670 |
| 100. | Middleburgh | 7.9% | 2.9%(+5.00)#100 | 2.1%(+5.76)#1,686 |
Common Questions
What are the Top 10 Cities with the Highest Percentage of Population Employed in Security & Protection in New York?
Top 10 Cities with the Highest Percentage of Population Employed in Security & Protection in New York are:
#1
68.3%
#2
56.1%
#3
50.0%
#4
25.3%
#5
23.7%
#6
22.0%
#7
21.1%
#8
20.0%
#9
20.0%
#10
19.5%
What city has the Highest Percentage of Population Employed in Security & Protection in New York?
Thendara has the Highest Percentage of Population Employed in Security & Protection in New York with 68.3%.
What is the Percentage of Population Employed in Security & Protection in the State of New York?
Percentage of Population Employed in Security & Protection in New York is 2.9%.
What is the Percentage of Population Employed in Security & Protection in the United States?
Percentage of Population Employed in Security & Protection in the United States is 2.1%.