Janesville, CA Map & Demographics
Janesville Map
Janesville Overview
$36,312
PER CAPITA INCOME
$74,091
AVG FAMILY INCOME
$64,180
AVG HOUSEHOLD INCOME
23.2%
WAGE / INCOME GAP [ % ]
76.8¢/ $1
WAGE / INCOME GAP [ $ ]
0.41
INEQUALITY / GINI INDEX
2,641
TOTAL POPULATION
1,338
MALE POPULATION
1,303
FEMALE POPULATION
102.69
MALES / 100 FEMALES
97.38
FEMALES / 100 MALES
50.7
MEDIAN AGE
2.9
AVG FAMILY SIZE
2.5
AVG HOUSEHOLD SIZE
1,062
LABOR FORCE [ PEOPLE ]
47.3%
PERCENT IN LABOR FORCE
5.9%
UNEMPLOYMENT RATE
Janesville Zip Codes
Janesville Area Codes
Income in Janesville
Income Overview in Janesville
Per Capita Income in Janesville is $36,312, while median incomes of families and households are $74,091 and $64,180 respectively.
| Characteristic | Number | Measure |
| Per Capita Income | 2,641 | $36,312 |
| Median Family Income | 758 | $74,091 |
| Mean Family Income | 758 | $89,981 |
| Median Household Income | 1,053 | $64,180 |
| Mean Household Income | 1,053 | $85,183 |
| Income Deficit | 758 | $0 |
| Wage / Income Gap (%) | 2,641 | 23.18% |
| Wage / Income Gap ($) | 2,641 | 76.82¢ per $1 |
| Gini / Inequality Index | 2,641 | 0.41 |
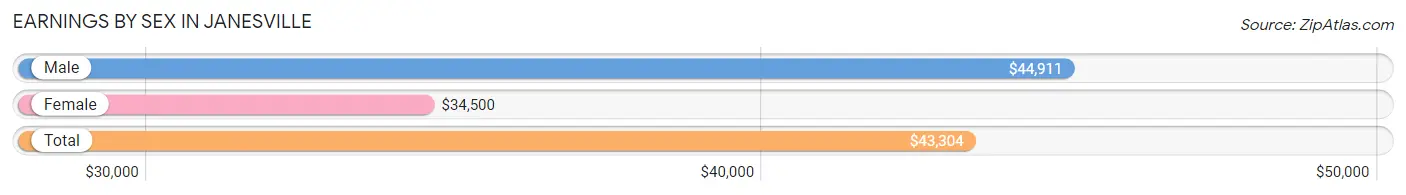
Earnings by Sex in Janesville
Average Earnings in Janesville are $43,304, $44,911 for men and $34,500 for women, a difference of 23.2%.
| Sex | Number | Average Earnings |
| Male | 524 (48.7%) | $44,911 |
| Female | 552 (51.3%) | $34,500 |
| Total | 1,076 (100.0%) | $43,304 |
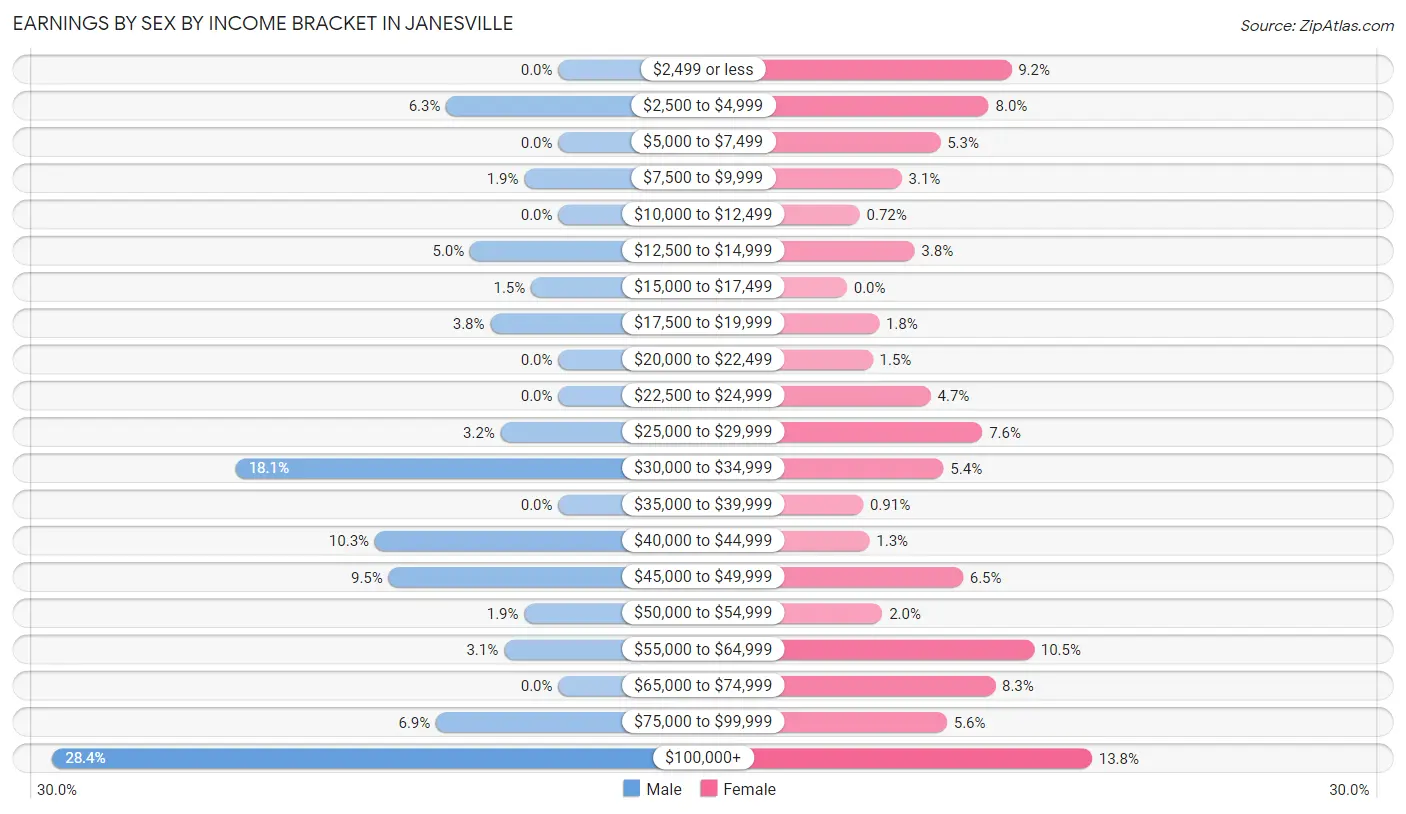
Earnings by Sex by Income Bracket in Janesville
The most common earnings brackets in Janesville are $100,000+ for men (149 | 28.4%) and $100,000+ for women (76 | 13.8%).
| Income | Male | Female |
| $2,499 or less | 0 (0.0%) | 51 (9.2%) |
| $2,500 to $4,999 | 33 (6.3%) | 44 (8.0%) |
| $5,000 to $7,499 | 0 (0.0%) | 29 (5.2%) |
| $7,500 to $9,999 | 10 (1.9%) | 17 (3.1%) |
| $10,000 to $12,499 | 0 (0.0%) | 4 (0.7%) |
| $12,500 to $14,999 | 26 (5.0%) | 21 (3.8%) |
| $15,000 to $17,499 | 8 (1.5%) | 0 (0.0%) |
| $17,500 to $19,999 | 20 (3.8%) | 10 (1.8%) |
| $20,000 to $22,499 | 0 (0.0%) | 8 (1.5%) |
| $22,500 to $24,999 | 0 (0.0%) | 26 (4.7%) |
| $25,000 to $29,999 | 17 (3.2%) | 42 (7.6%) |
| $30,000 to $34,999 | 95 (18.1%) | 30 (5.4%) |
| $35,000 to $39,999 | 0 (0.0%) | 5 (0.9%) |
| $40,000 to $44,999 | 54 (10.3%) | 7 (1.3%) |
| $45,000 to $49,999 | 50 (9.5%) | 36 (6.5%) |
| $50,000 to $54,999 | 10 (1.9%) | 11 (2.0%) |
| $55,000 to $64,999 | 16 (3.0%) | 58 (10.5%) |
| $65,000 to $74,999 | 0 (0.0%) | 46 (8.3%) |
| $75,000 to $99,999 | 36 (6.9%) | 31 (5.6%) |
| $100,000+ | 149 (28.4%) | 76 (13.8%) |
| Total | 524 (100.0%) | 552 (100.0%) |
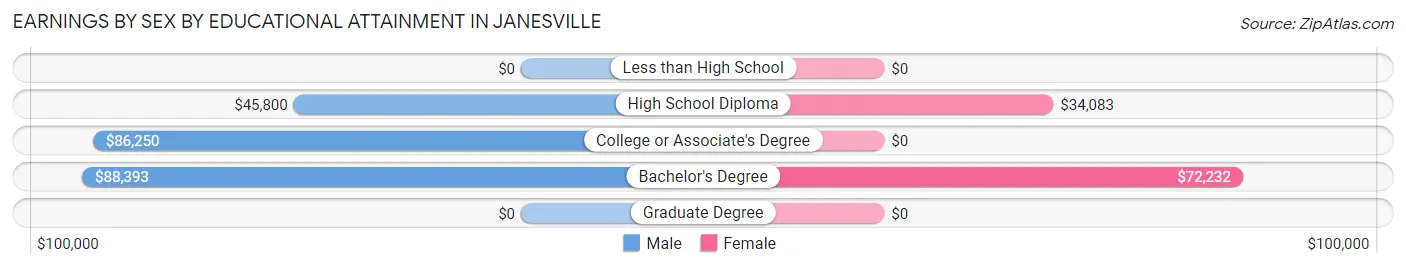
Earnings by Sex by Educational Attainment in Janesville
Average earnings in Janesville are $45,850 for men and $43,750 for women, a difference of 4.6%. Men with an educational attainment of bachelor's degree enjoy the highest average annual earnings of $88,393, while those with high school diploma education earn the least with $45,800. Women with an educational attainment of bachelor's degree earn the most with the average annual earnings of $72,232, while those with high school diploma education have the smallest earnings of $34,083.
| Educational Attainment | Male Income | Female Income |
| Less than High School | - | - |
| High School Diploma | $45,800 | $34,083 |
| College or Associate's Degree | $86,250 | $0 |
| Bachelor's Degree | $88,393 | $72,232 |
| Graduate Degree | - | - |
| Total | $45,850 | $43,750 |
Family Income in Janesville
Family Income Brackets in Janesville
According to the Janesville family income data, there are 148 families falling into the $25,000 to $34,999 income range, which is the most common income bracket and makes up 19.5% of all families.
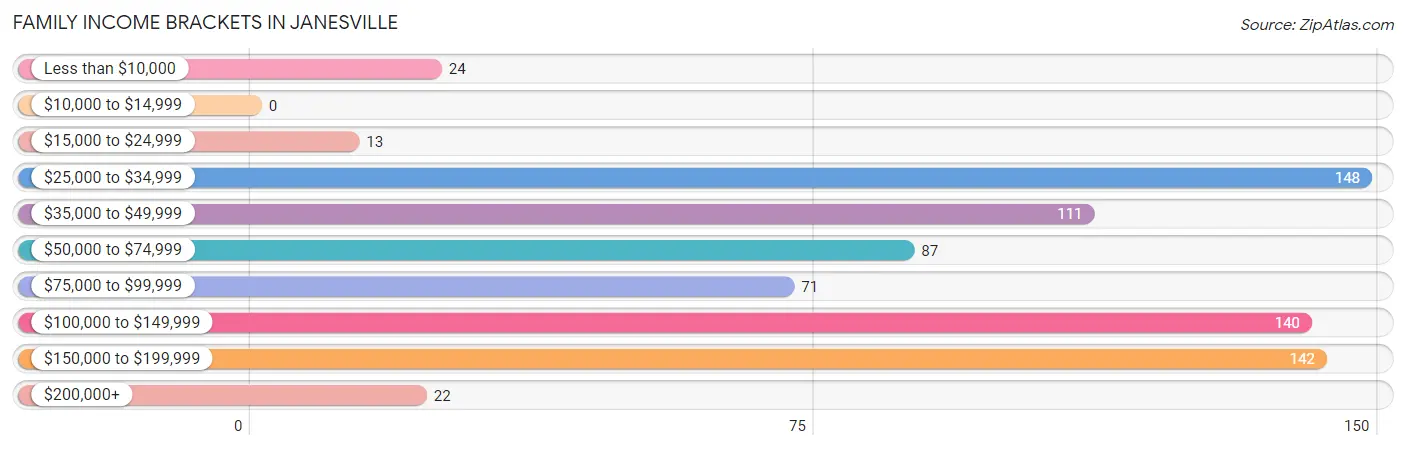
| Income Bracket | # Families | % Families |
| Less than $10,000 | 24 | 3.2% |
| $10,000 to $14,999 | 0 | 0.0% |
| $15,000 to $24,999 | 13 | 1.7% |
| $25,000 to $34,999 | 148 | 19.5% |
| $35,000 to $49,999 | 111 | 14.6% |
| $50,000 to $74,999 | 87 | 11.5% |
| $75,000 to $99,999 | 71 | 9.4% |
| $100,000 to $149,999 | 140 | 18.5% |
| $150,000 to $199,999 | 142 | 18.7% |
| $200,000+ | 22 | 2.9% |
Family Income by Famaliy Size in Janesville
3-person families (184 | 24.3%) account for the highest median family income in Janesville with $82,917 per family, while 2-person families (467 | 61.6%) have the highest median income of $36,648 per family member.
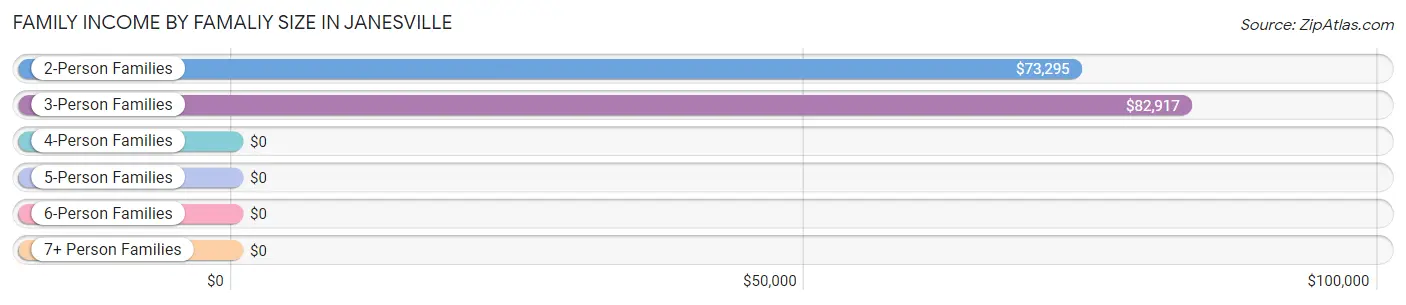
| Income Bracket | # Families | Median Income |
| 2-Person Families | 467 (61.6%) | $73,295 |
| 3-Person Families | 184 (24.3%) | $82,917 |
| 4-Person Families | 89 (11.7%) | $0 |
| 5-Person Families | 14 (1.8%) | $0 |
| 6-Person Families | 4 (0.5%) | $0 |
| 7+ Person Families | 0 (0.0%) | $0 |
| Total | 758 (100.0%) | $74,091 |
Family Income by Number of Earners in Janesville
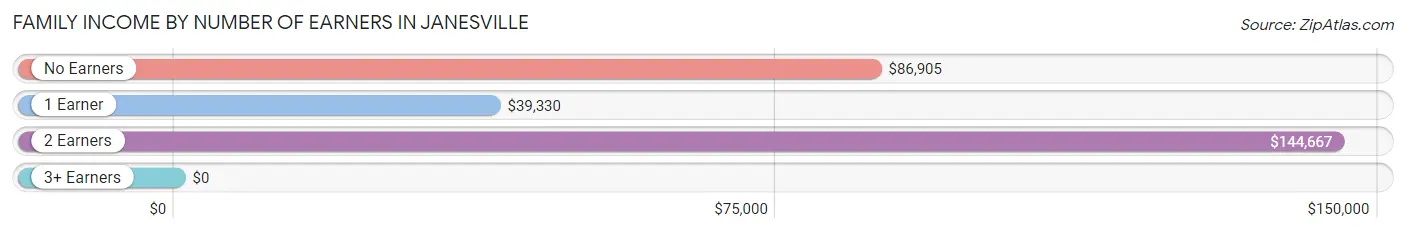
| Number of Earners | # Families | Median Income |
| No Earners | 134 (17.7%) | $86,905 |
| 1 Earner | 441 (58.2%) | $39,330 |
| 2 Earners | 168 (22.2%) | $144,667 |
| 3+ Earners | 15 (2.0%) | $0 |
| Total | 758 (100.0%) | $74,091 |
Household Income in Janesville
Household Income Brackets in Janesville
With 184 households falling in the category, the $35,000 to $49,999 income range is the most frequent in Janesville, accounting for 17.5% of all households. In contrast, only 18 households (1.7%) fall into the $10,000 to $14,999 income bracket, making it the least populous group.
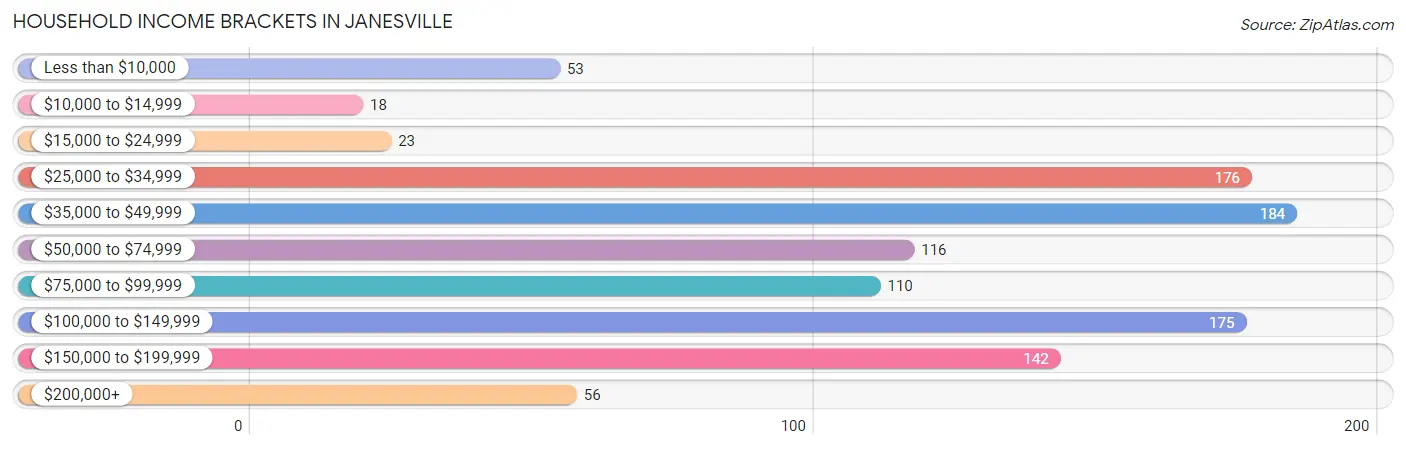
| Income Bracket | # Households | % Households |
| Less than $10,000 | 53 | 5.0% |
| $10,000 to $14,999 | 18 | 1.7% |
| $15,000 to $24,999 | 23 | 2.2% |
| $25,000 to $34,999 | 176 | 16.7% |
| $35,000 to $49,999 | 184 | 17.5% |
| $50,000 to $74,999 | 116 | 11.0% |
| $75,000 to $99,999 | 110 | 10.4% |
| $100,000 to $149,999 | 175 | 16.6% |
| $150,000 to $199,999 | 142 | 13.5% |
| $200,000+ | 56 | 5.3% |
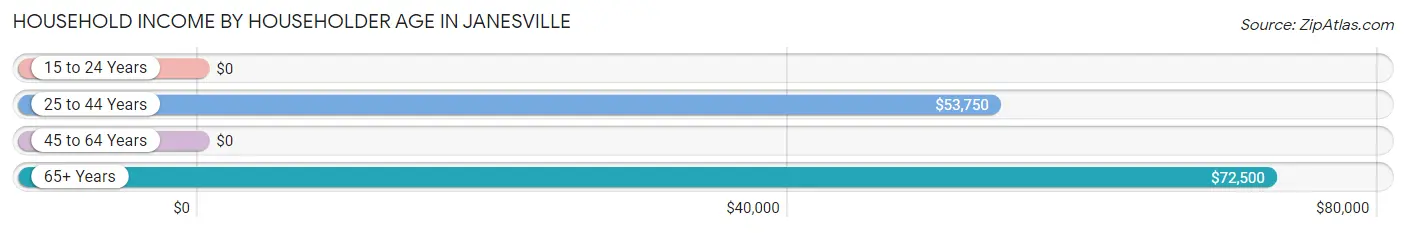
Household Income by Householder Age in Janesville
The median household income in Janesville is $64,180, with the highest median household income of $72,500 found in the 65+ years age bracket for the primary householder. A total of 352 households (33.4%) fall into this category. Meanwhile, the 15 to 24 years age bracket for the primary householder has the lowest median household income of $0, with 28 households (2.7%) in this group.
| Income Bracket | # Households | Median Income |
| 15 to 24 Years | 28 (2.7%) | $0 |
| 25 to 44 Years | 242 (23.0%) | $53,750 |
| 45 to 64 Years | 431 (40.9%) | $0 |
| 65+ Years | 352 (33.4%) | $72,500 |
| Total | 1,053 (100.0%) | $64,180 |
Poverty in Janesville
Income Below Poverty by Sex and Age in Janesville
With 7.5% poverty level for males and 7.7% for females among the residents of Janesville, 55 to 64 year old males and 18 to 24 year old females are the most vulnerable to poverty, with 72 males (22.6%) and 16 females (32.7%) in their respective age groups living below the poverty level.
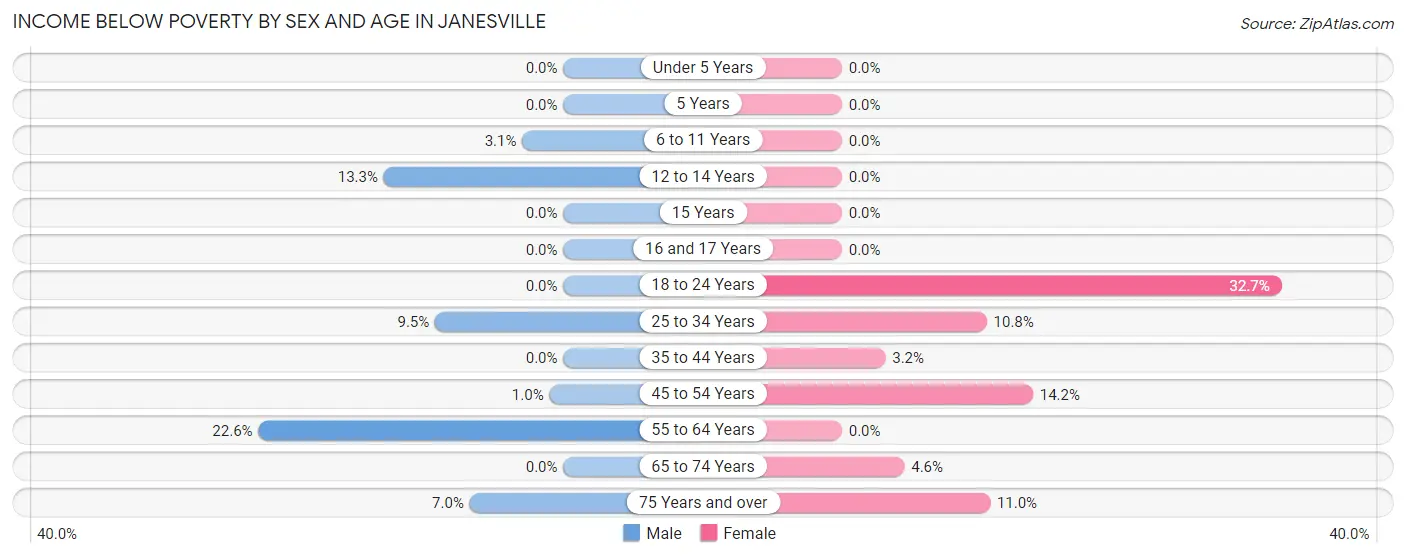
| Age Bracket | Male | Female |
| Under 5 Years | 0 (0.0%) | 0 (0.0%) |
| 5 Years | 0 (0.0%) | 0 (0.0%) |
| 6 to 11 Years | 4 (3.0%) | 0 (0.0%) |
| 12 to 14 Years | 4 (13.3%) | 0 (0.0%) |
| 15 Years | 0 (0.0%) | 0 (0.0%) |
| 16 and 17 Years | 0 (0.0%) | 0 (0.0%) |
| 18 to 24 Years | 0 (0.0%) | 16 (32.7%) |
| 25 to 34 Years | 6 (9.5%) | 23 (10.7%) |
| 35 to 44 Years | 0 (0.0%) | 4 (3.2%) |
| 45 to 54 Years | 2 (1.0%) | 40 (14.2%) |
| 55 to 64 Years | 72 (22.6%) | 0 (0.0%) |
| 65 to 74 Years | 0 (0.0%) | 7 (4.6%) |
| 75 Years and over | 13 (7.0%) | 11 (11.0%) |
| Total | 101 (7.5%) | 101 (7.7%) |
Income Above Poverty by Sex and Age in Janesville
According to the poverty statistics in Janesville, males aged under 5 years and females aged under 5 years are the age groups that are most secure financially, with 100.0% of males and 100.0% of females in these age groups living above the poverty line.
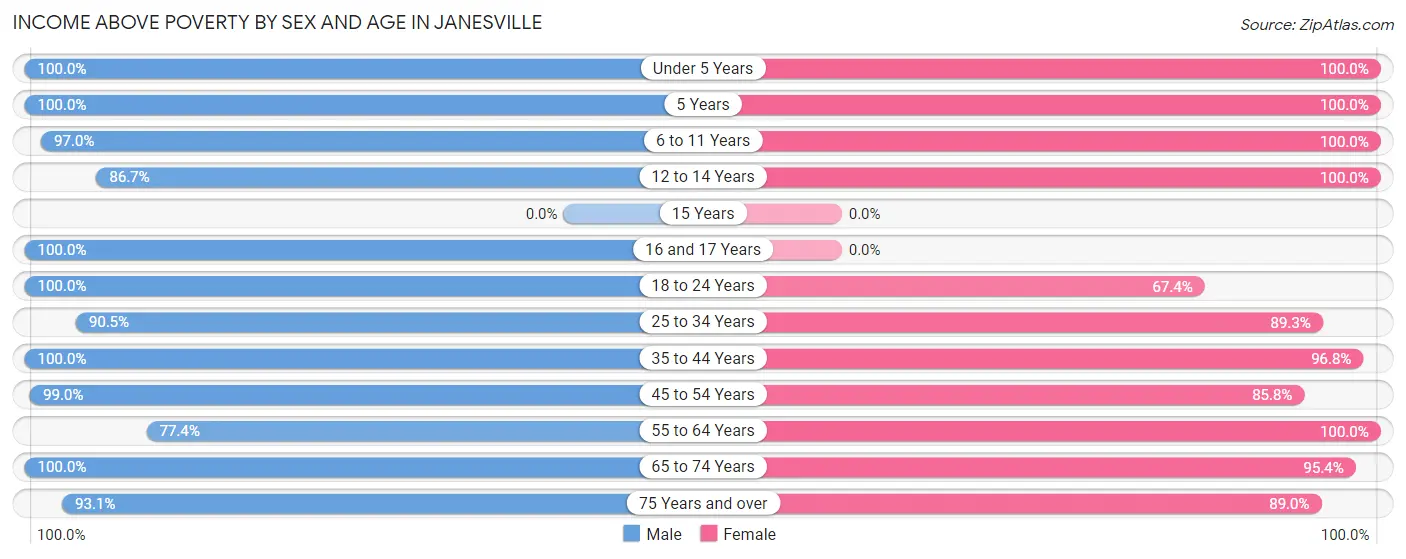
| Age Bracket | Male | Female |
| Under 5 Years | 14 (100.0%) | 99 (100.0%) |
| 5 Years | 8 (100.0%) | 28 (100.0%) |
| 6 to 11 Years | 127 (97.0%) | 36 (100.0%) |
| 12 to 14 Years | 26 (86.7%) | 50 (100.0%) |
| 15 Years | 0 (0.0%) | 0 (0.0%) |
| 16 and 17 Years | 5 (100.0%) | 0 (0.0%) |
| 18 to 24 Years | 184 (100.0%) | 33 (67.3%) |
| 25 to 34 Years | 57 (90.5%) | 191 (89.2%) |
| 35 to 44 Years | 77 (100.0%) | 120 (96.8%) |
| 45 to 54 Years | 192 (99.0%) | 242 (85.8%) |
| 55 to 64 Years | 246 (77.4%) | 170 (100.0%) |
| 65 to 74 Years | 127 (100.0%) | 144 (95.4%) |
| 75 Years and over | 174 (93.0%) | 89 (89.0%) |
| Total | 1,237 (92.4%) | 1,202 (92.2%) |
Income Below Poverty Among Married-Couple Families in Janesville
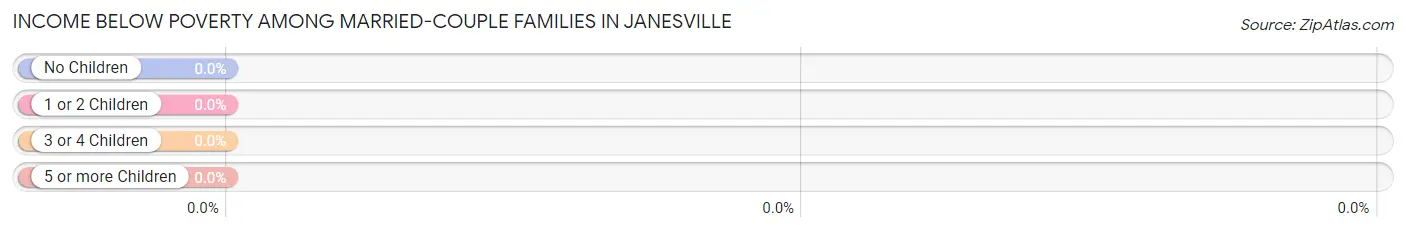
| Children | Above Poverty | Below Poverty |
| No Children | 528 (100.0%) | 0 (0.0%) |
| 1 or 2 Children | 75 (100.0%) | 0 (0.0%) |
| 3 or 4 Children | 16 (100.0%) | 0 (0.0%) |
| 5 or more Children | 0 (0.0%) | 0 (0.0%) |
| Total | 619 (100.0%) | 0 (0.0%) |
Income Below Poverty Among Single-Parent Households in Janesville
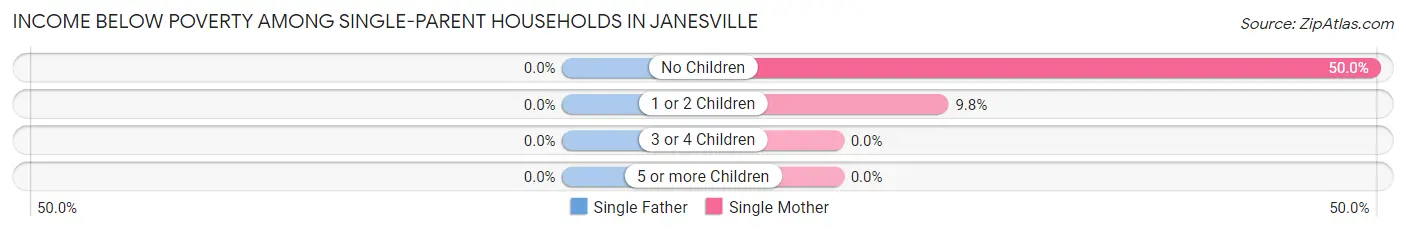
| Children | Single Father | Single Mother |
| No Children | 0 (0.0%) | 24 (50.0%) |
| 1 or 2 Children | 0 (0.0%) | 4 (9.8%) |
| 3 or 4 Children | 0 (0.0%) | 0 (0.0%) |
| 5 or more Children | 0 (0.0%) | 0 (0.0%) |
| Total | 0 (0.0%) | 28 (23.5%) |
Income Below Poverty Among Married-Couple vs Single-Parent Households in Janesville
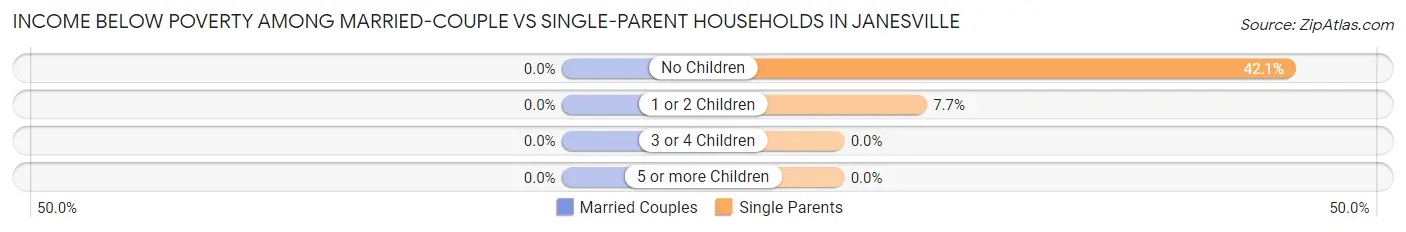
| Children | Married-Couple Families | Single-Parent Households |
| No Children | 0 (0.0%) | 24 (42.1%) |
| 1 or 2 Children | 0 (0.0%) | 4 (7.7%) |
| 3 or 4 Children | 0 (0.0%) | 0 (0.0%) |
| 5 or more Children | 0 (0.0%) | 0 (0.0%) |
| Total | 0 (0.0%) | 28 (20.1%) |
Race in Janesville
The most populous races in Janesville are White / Caucasian (2,152 | 81.5%), Hispanic or Latino (316 | 12.0%), and Some other Race (213 | 8.1%).
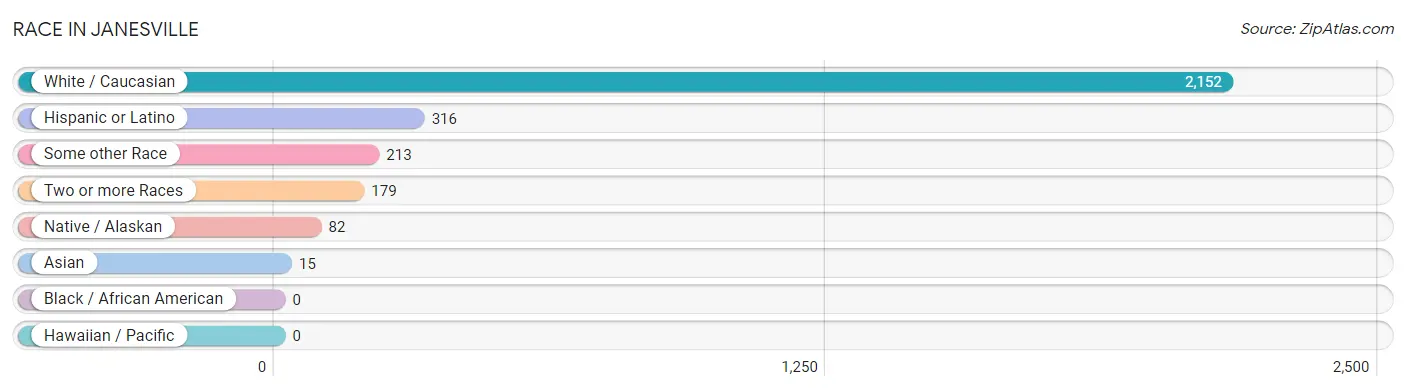
| Race | # Population | % Population |
| Asian | 15 | 0.6% |
| Black / African American | 0 | 0.0% |
| Hawaiian / Pacific | 0 | 0.0% |
| Hispanic or Latino | 316 | 12.0% |
| Native / Alaskan | 82 | 3.1% |
| White / Caucasian | 2,152 | 81.5% |
| Two or more Races | 179 | 6.8% |
| Some other Race | 213 | 8.1% |
| Total | 2,641 | 100.0% |
Ancestry in Janesville
The most populous ancestries reported in Janesville are English (450 | 17.0%), German (321 | 12.1%), Mexican (313 | 11.8%), Irish (243 | 9.2%), and Italian (197 | 7.5%), together accounting for 57.7% of all Janesville residents.
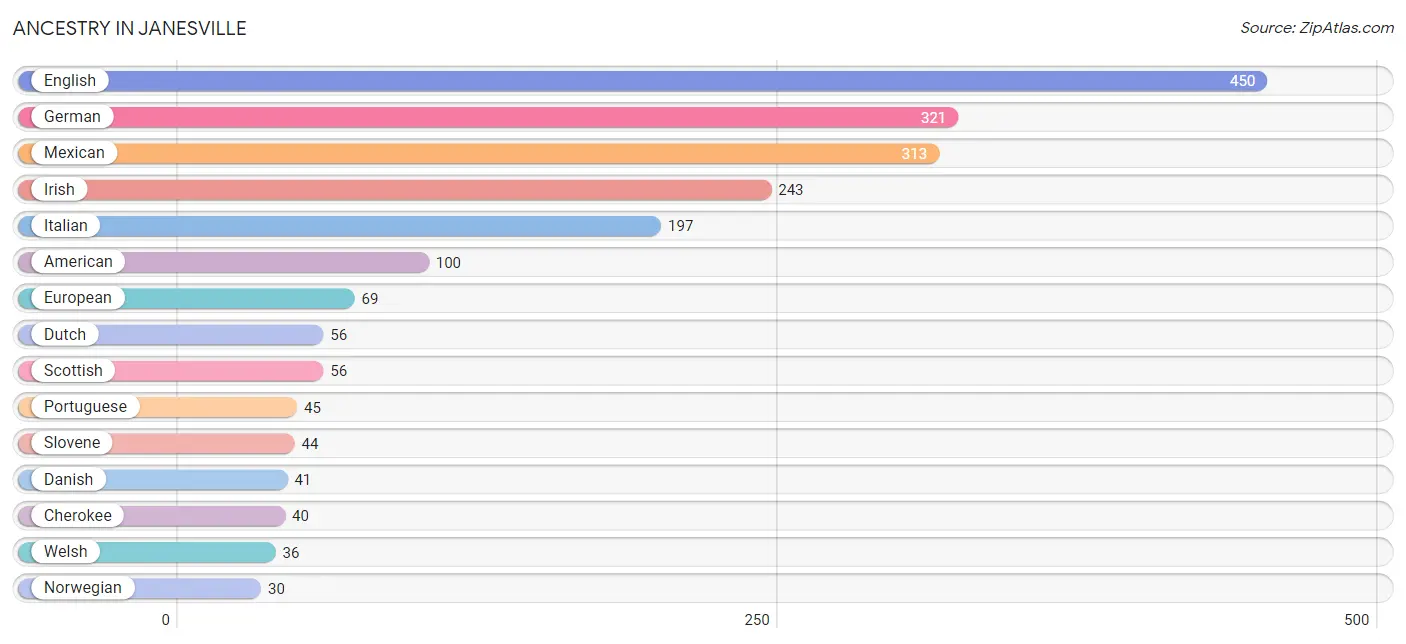
| Ancestry | # Population | % Population |
| American | 100 | 3.8% |
| Basque | 14 | 0.5% |
| Central American | 3 | 0.1% |
| Cherokee | 40 | 1.5% |
| Cheyenne | 24 | 0.9% |
| Choctaw | 26 | 1.0% |
| Czechoslovakian | 10 | 0.4% |
| Danish | 41 | 1.5% |
| Dutch | 56 | 2.1% |
| English | 450 | 17.0% |
| European | 69 | 2.6% |
| Finnish | 5 | 0.2% |
| French | 23 | 0.9% |
| French Canadian | 9 | 0.3% |
| German | 321 | 12.1% |
| Irish | 243 | 9.2% |
| Iroquois | 9 | 0.3% |
| Italian | 197 | 7.5% |
| Mexican | 313 | 11.8% |
| Norwegian | 30 | 1.1% |
| Paiute | 23 | 0.9% |
| Polish | 29 | 1.1% |
| Portuguese | 45 | 1.7% |
| Salvadoran | 3 | 0.1% |
| Scandinavian | 2 | 0.1% |
| Scotch-Irish | 8 | 0.3% |
| Scottish | 56 | 2.1% |
| Sioux | 30 | 1.1% |
| Slovene | 44 | 1.7% |
| Sri Lankan | 15 | 0.6% |
| Swedish | 18 | 0.7% |
| Swiss | 24 | 0.9% |
| Welsh | 36 | 1.4% |
| Yaqui | 24 | 0.9% | View All 34 Rows |
Immigrants in Janesville
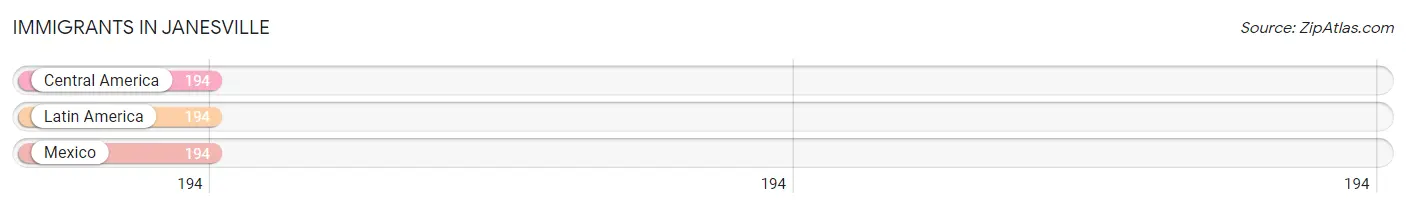
The most numerous immigrant groups reported in Janesville came from Central America (194 | 7.3%), Latin America (194 | 7.3%), and Mexico (194 | 7.3%), together accounting for 22.0% of all Janesville residents.
| Immigration Origin | # Population | % Population |
| Central America | 194 | 7.3% |
| Latin America | 194 | 7.3% |
| Mexico | 194 | 7.3% | View All 3 Rows |
Sex and Age in Janesville
Sex and Age in Janesville
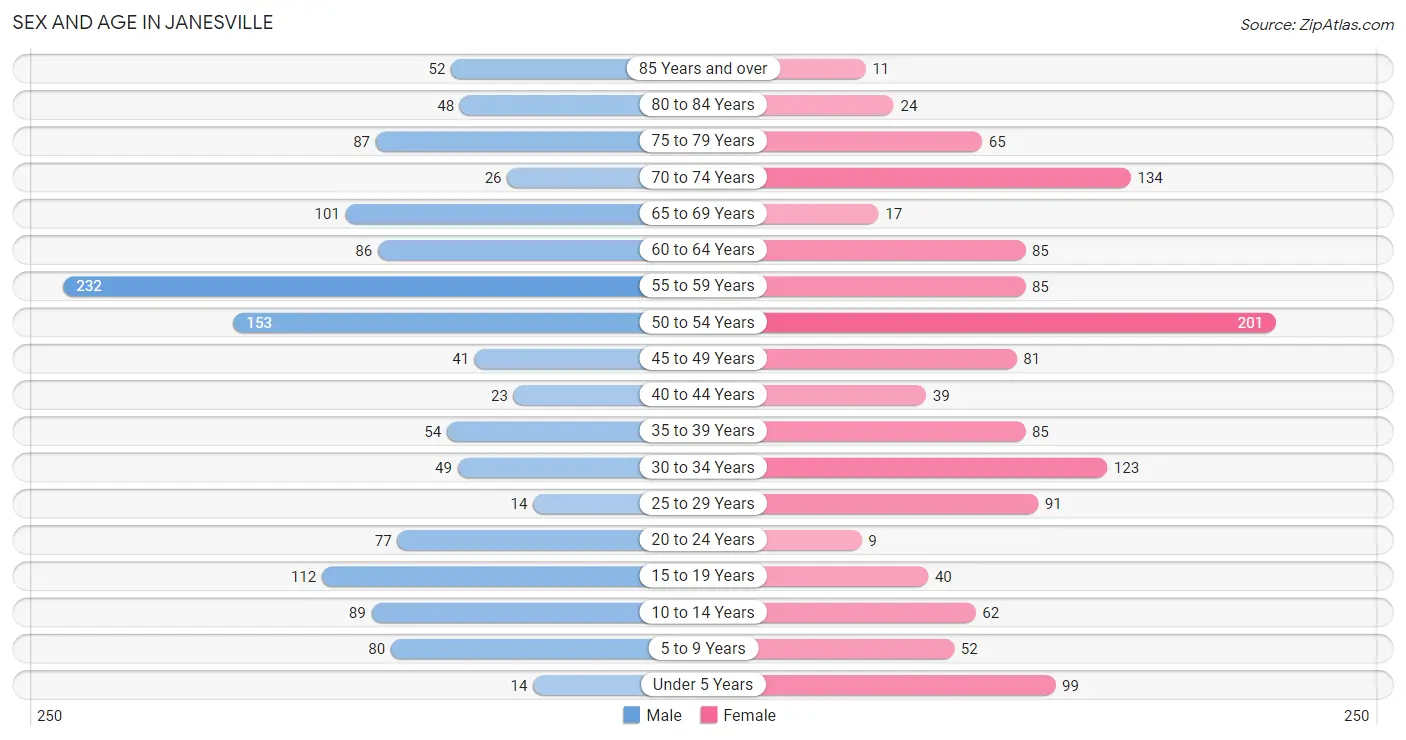
The most populous age groups in Janesville are 55 to 59 Years (232 | 17.3%) for men and 50 to 54 Years (201 | 15.4%) for women.
| Age Bracket | Male | Female |
| Under 5 Years | 14 (1.1%) | 99 (7.6%) |
| 5 to 9 Years | 80 (6.0%) | 52 (4.0%) |
| 10 to 14 Years | 89 (6.7%) | 62 (4.8%) |
| 15 to 19 Years | 112 (8.4%) | 40 (3.1%) |
| 20 to 24 Years | 77 (5.8%) | 9 (0.7%) |
| 25 to 29 Years | 14 (1.1%) | 91 (7.0%) |
| 30 to 34 Years | 49 (3.7%) | 123 (9.4%) |
| 35 to 39 Years | 54 (4.0%) | 85 (6.5%) |
| 40 to 44 Years | 23 (1.7%) | 39 (3.0%) |
| 45 to 49 Years | 41 (3.1%) | 81 (6.2%) |
| 50 to 54 Years | 153 (11.4%) | 201 (15.4%) |
| 55 to 59 Years | 232 (17.3%) | 85 (6.5%) |
| 60 to 64 Years | 86 (6.4%) | 85 (6.5%) |
| 65 to 69 Years | 101 (7.5%) | 17 (1.3%) |
| 70 to 74 Years | 26 (1.9%) | 134 (10.3%) |
| 75 to 79 Years | 87 (6.5%) | 65 (5.0%) |
| 80 to 84 Years | 48 (3.6%) | 24 (1.8%) |
| 85 Years and over | 52 (3.9%) | 11 (0.8%) |
| Total | 1,338 (100.0%) | 1,303 (100.0%) |
Families and Households in Janesville
Median Family Size in Janesville
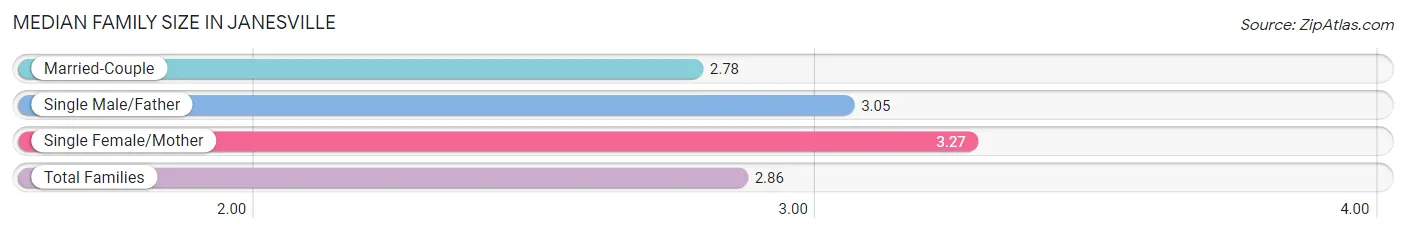
The median family size in Janesville is 2.86 persons per family, with single female/mother families (119 | 15.7%) accounting for the largest median family size of 3.27 persons per family. On the other hand, married-couple families (619 | 81.7%) represent the smallest median family size with 2.78 persons per family.
| Family Type | # Families | Family Size |
| Married-Couple | 619 (81.7%) | 2.78 |
| Single Male/Father | 20 (2.6%) | 3.05 |
| Single Female/Mother | 119 (15.7%) | 3.27 |
| Total Families | 758 (100.0%) | 2.86 |
Median Household Size in Janesville
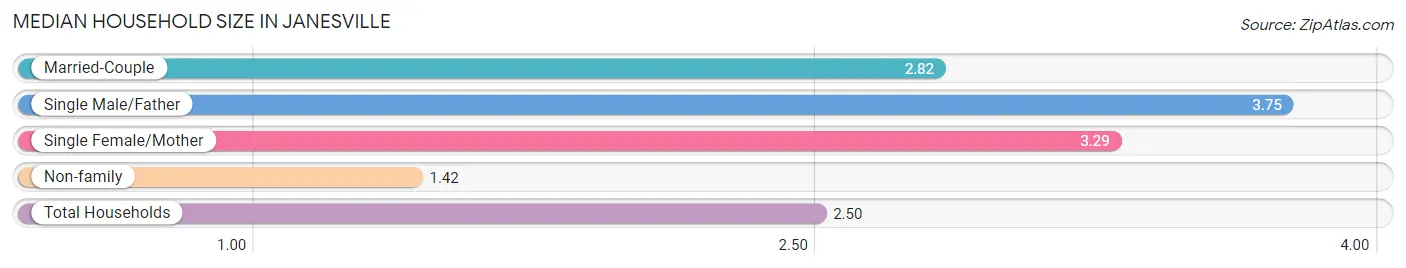
The median household size in Janesville is 2.50 persons per household, with single male/father households (20 | 1.9%) accounting for the largest median household size of 3.75 persons per household. non-family households (295 | 28.0%) represent the smallest median household size with 1.42 persons per household.
| Household Type | # Households | Household Size |
| Married-Couple | 619 (58.8%) | 2.82 |
| Single Male/Father | 20 (1.9%) | 3.75 |
| Single Female/Mother | 119 (11.3%) | 3.29 |
| Non-family | 295 (28.0%) | 1.42 |
| Total Households | 1,053 (100.0%) | 2.50 |
Household Size by Marriage Status in Janesville
Out of a total of 1,053 households in Janesville, 758 (72.0%) are family households, while 295 (28.0%) are nonfamily households. The most numerous type of family households are 2-person households, comprising 457, and the most common type of nonfamily households are 1-person households, comprising 186.
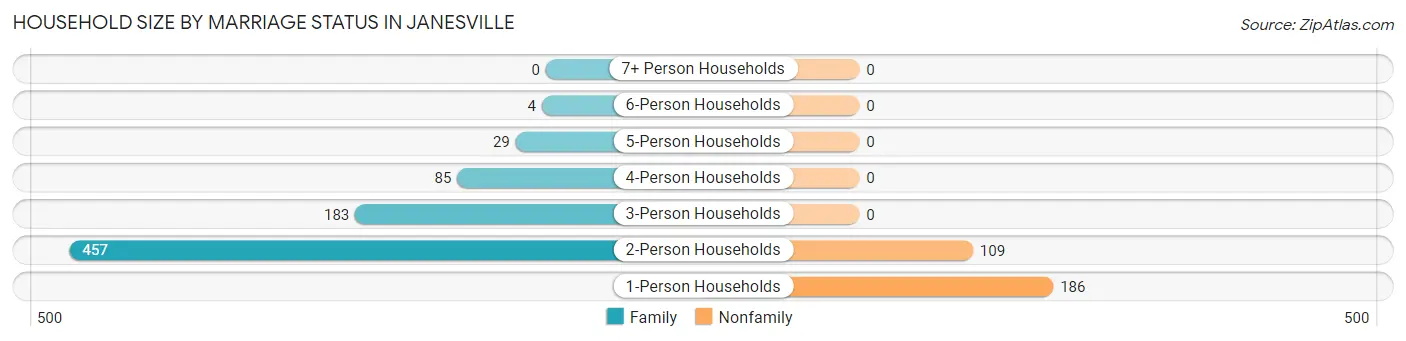
| Household Size | Family Households | Nonfamily Households |
| 1-Person Households | - | 186 (17.7%) |
| 2-Person Households | 457 (43.4%) | 109 (10.3%) |
| 3-Person Households | 183 (17.4%) | 0 (0.0%) |
| 4-Person Households | 85 (8.1%) | 0 (0.0%) |
| 5-Person Households | 29 (2.8%) | 0 (0.0%) |
| 6-Person Households | 4 (0.4%) | 0 (0.0%) |
| 7+ Person Households | 0 (0.0%) | 0 (0.0%) |
| Total | 758 (72.0%) | 295 (28.0%) |
Female Fertility in Janesville
Fertility by Age in Janesville
Average fertility rate in Janesville is 35.0 births per 1,000 women. Women in the age bracket of 20 to 34 years have the highest fertility rate with 81.0 births per 1,000 women. Women in the age bracket of 20 to 34 years acount for 100.0% of all women with births.
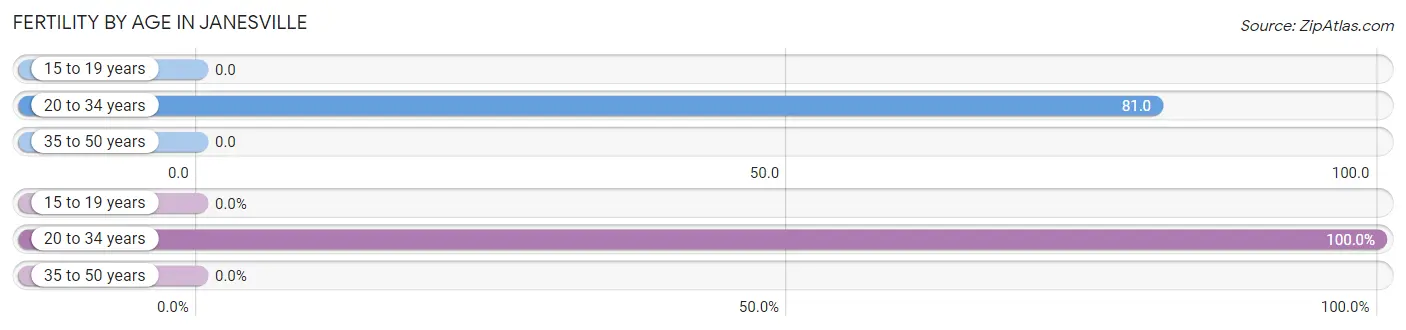
| Age Bracket | Women with Births | Births / 1,000 Women |
| 15 to 19 years | 0 (0.0%) | 0.0 |
| 20 to 34 years | 18 (100.0%) | 81.0 |
| 35 to 50 years | 0 (0.0%) | 0.0 |
| Total | 18 (100.0%) | 35.0 |
Fertility by Age by Marriage Status in Janesville
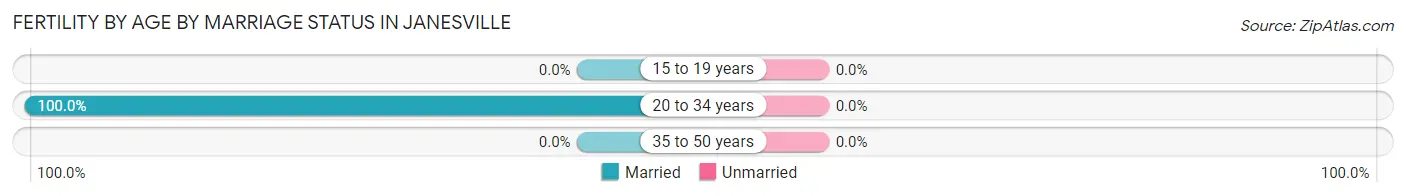
| Age Bracket | Married | Unmarried |
| 15 to 19 years | 0 (0.0%) | 0 (0.0%) |
| 20 to 34 years | 18 (100.0%) | 0 (0.0%) |
| 35 to 50 years | 0 (0.0%) | 0 (0.0%) |
| Total | 18 (100.0%) | 0 (0.0%) |
Fertility by Education in Janesville
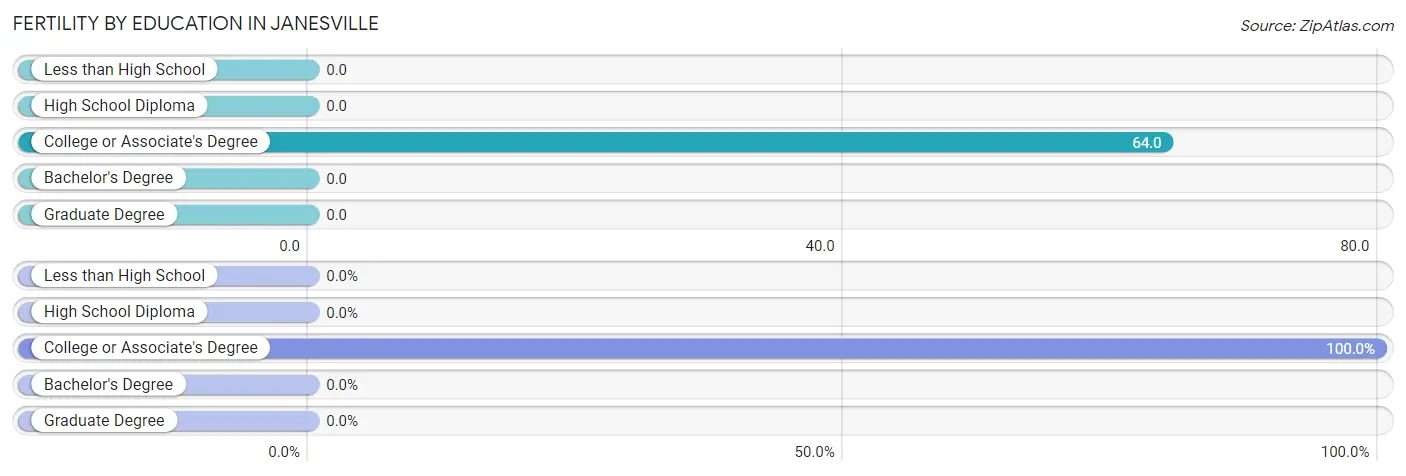
| Educational Attainment | Women with Births | Births / 1,000 Women |
| Less than High School | 0 (0.0%) | 0.0 |
| High School Diploma | 0 (0.0%) | 0.0 |
| College or Associate's Degree | 18 (100.0%) | 64.0 |
| Bachelor's Degree | 0 (0.0%) | 0.0 |
| Graduate Degree | 0 (0.0%) | 0.0 |
| Total | 18 (100.0%) | 35.0 |
Fertility by Education by Marriage Status in Janesville
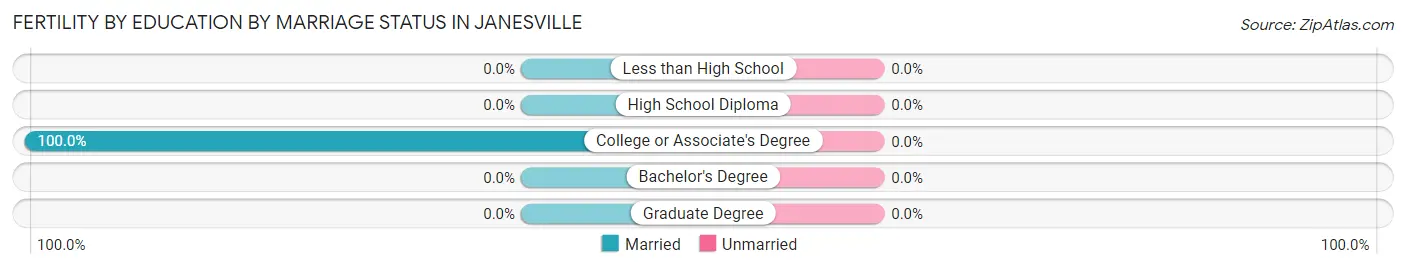
| Educational Attainment | Married | Unmarried |
| Less than High School | 0 (0.0%) | 0 (0.0%) |
| High School Diploma | 0 (0.0%) | 0 (0.0%) |
| College or Associate's Degree | 18 (100.0%) | 0 (0.0%) |
| Bachelor's Degree | 0 (0.0%) | 0 (0.0%) |
| Graduate Degree | 0 (0.0%) | 0 (0.0%) |
| Total | 18 (100.0%) | 0 (0.0%) |
Employment Characteristics in Janesville
Employment by Class of Employer in Janesville
Among the 970 employed individuals in Janesville, private company employees (428 | 44.1%), local government employees (225 | 23.2%), and state government employees (140 | 14.4%) make up the most common classes of employment.
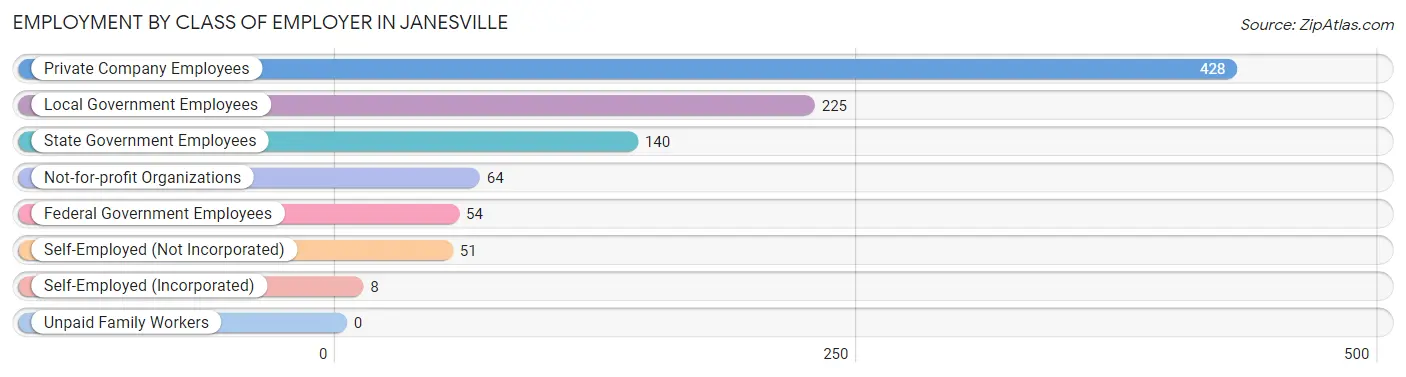
| Employer Class | # Employees | % Employees |
| Private Company Employees | 428 | 44.1% |
| Self-Employed (Incorporated) | 8 | 0.8% |
| Self-Employed (Not Incorporated) | 51 | 5.3% |
| Not-for-profit Organizations | 64 | 6.6% |
| Local Government Employees | 225 | 23.2% |
| State Government Employees | 140 | 14.4% |
| Federal Government Employees | 54 | 5.6% |
| Unpaid Family Workers | 0 | 0.0% |
| Total | 970 | 100.0% |
Employment Status by Age in Janesville
According to the labor force statistics for Janesville, out of the total population over 16 years of age (2,245), 47.3% or 1,062 individuals are in the labor force, with 5.9% or 63 of them unemployed. The age group with the highest labor force participation rate is 35 to 44 years, with 86.6% or 174 individuals in the labor force. Within the labor force, the 60 to 64 years age range has the highest percentage of unemployed individuals, with 21.7% or 10 of them being unemployed.
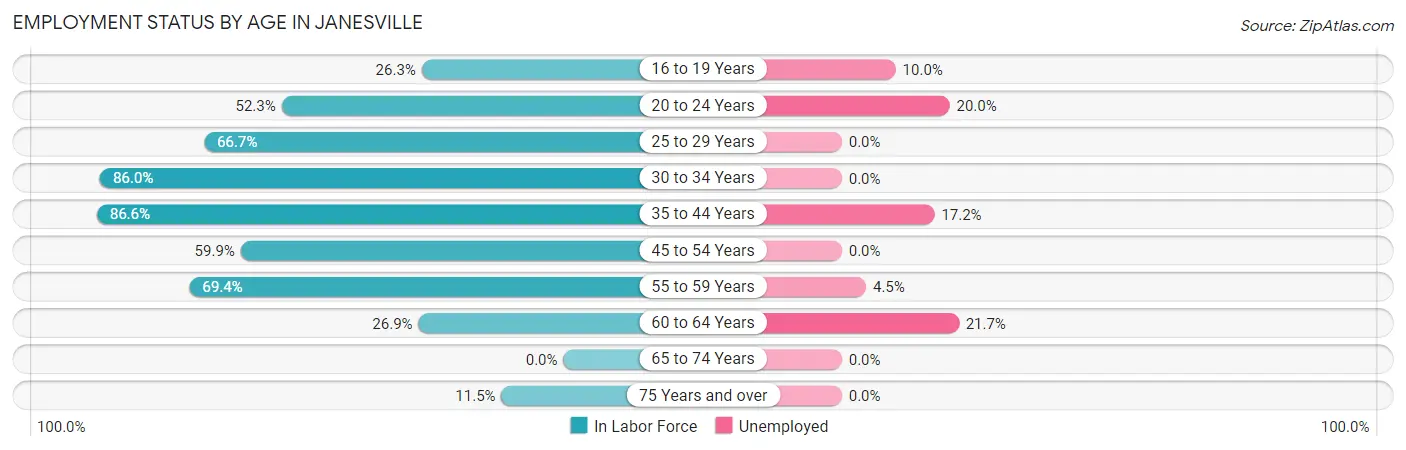
| Age Bracket | In Labor Force | Unemployed |
| 16 to 19 Years | 40 (26.3%) | 4 (10.0%) |
| 20 to 24 Years | 45 (52.3%) | 9 (20.0%) |
| 25 to 29 Years | 70 (66.7%) | 0 (0.0%) |
| 30 to 34 Years | 148 (86.0%) | 0 (0.0%) |
| 35 to 44 Years | 174 (86.6%) | 30 (17.2%) |
| 45 to 54 Years | 285 (59.9%) | 0 (0.0%) |
| 55 to 59 Years | 220 (69.4%) | 10 (4.5%) |
| 60 to 64 Years | 46 (26.9%) | 10 (21.7%) |
| 65 to 74 Years | 0 (0.0%) | 0 (0.0%) |
| 75 Years and over | 33 (11.5%) | 0 (0.0%) |
| Total | 1,062 (47.3%) | 63 (5.9%) |
Employment Status by Educational Attainment in Janesville
According to labor force statistics for Janesville, 65.4% of individuals (943) out of the total population between 25 and 64 years of age (1,442) are in the labor force, with 5.3% or 50 of them being unemployed. The group with the highest labor force participation rate are those with the educational attainment of bachelor's degree or higher, with 81.0% or 124 individuals in the labor force. Within the labor force, individuals with high school diploma education have the highest percentage of unemployment, with 12.4% or 40 of them being unemployed.
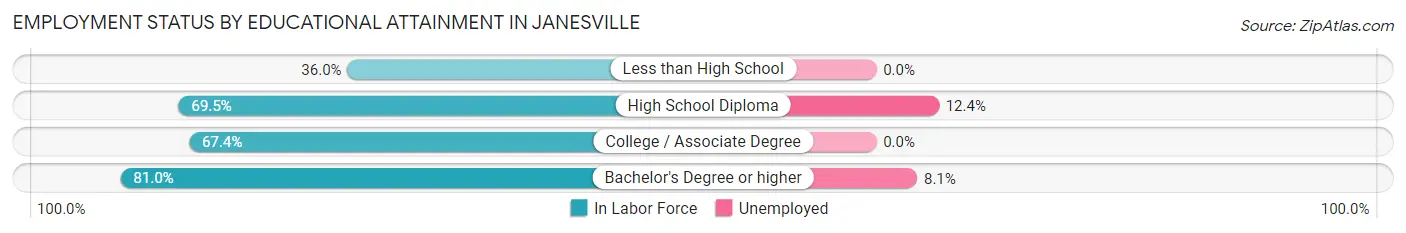
| Educational Attainment | In Labor Force | Unemployed |
| Less than High School | 68 (36.0%) | 0 (0.0%) |
| High School Diploma | 323 (69.5%) | 58 (12.4%) |
| College / Associate Degree | 428 (67.4%) | 0 (0.0%) |
| Bachelor's Degree or higher | 124 (81.0%) | 12 (8.1%) |
| Total | 943 (65.4%) | 76 (5.3%) |
Employment Occupations by Sex in Janesville
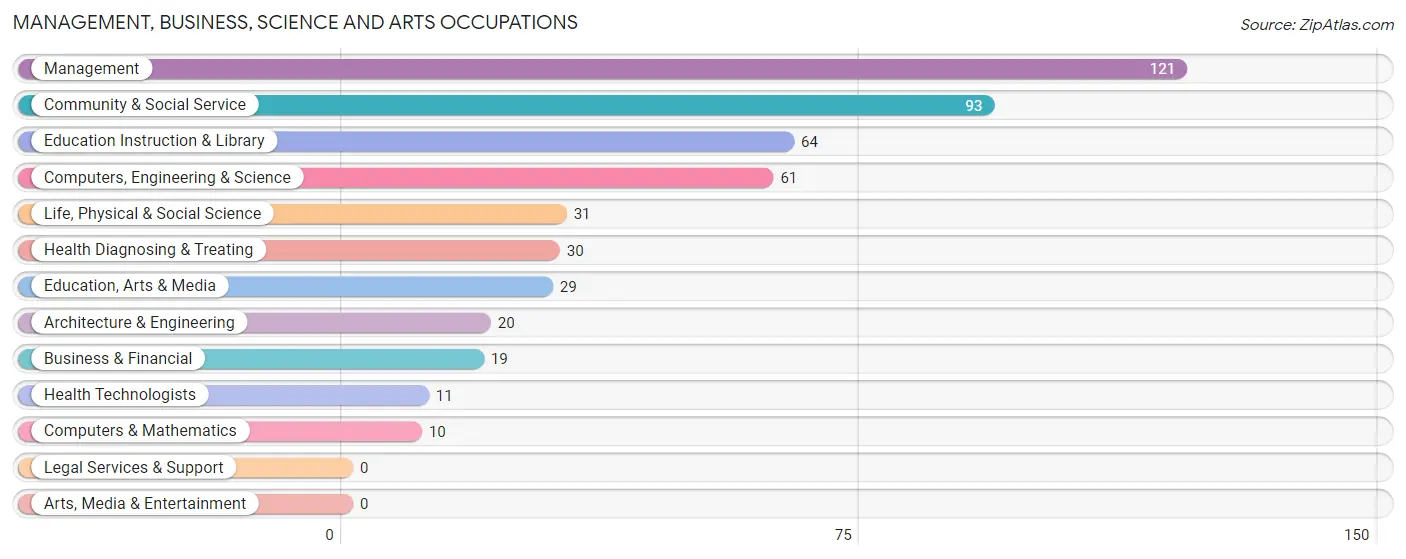
Management, Business, Science and Arts Occupations
The most common Management, Business, Science and Arts occupations in Janesville are Management (121 | 12.1%), Community & Social Service (93 | 9.3%), Education Instruction & Library (64 | 6.4%), Computers, Engineering & Science (61 | 6.1%), and Life, Physical & Social Science (31 | 3.1%).
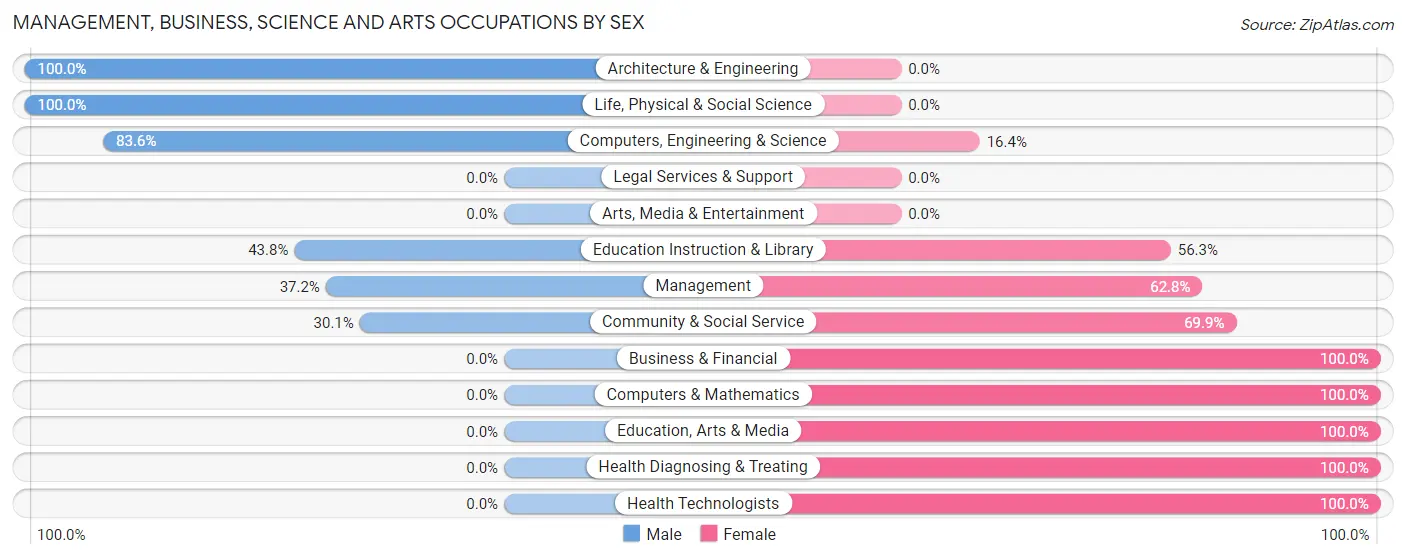
Management, Business, Science and Arts Occupations by Sex
Within the Management, Business, Science and Arts occupations in Janesville, the most male-oriented occupations are Architecture & Engineering (100.0%), Life, Physical & Social Science (100.0%), and Computers, Engineering & Science (83.6%), while the most female-oriented occupations are Business & Financial (100.0%), Computers & Mathematics (100.0%), and Education, Arts & Media (100.0%).
| Occupation | Male | Female |
| Management | 45 (37.2%) | 76 (62.8%) |
| Business & Financial | 0 (0.0%) | 19 (100.0%) |
| Computers, Engineering & Science | 51 (83.6%) | 10 (16.4%) |
| Computers & Mathematics | 0 (0.0%) | 10 (100.0%) |
| Architecture & Engineering | 20 (100.0%) | 0 (0.0%) |
| Life, Physical & Social Science | 31 (100.0%) | 0 (0.0%) |
| Community & Social Service | 28 (30.1%) | 65 (69.9%) |
| Education, Arts & Media | 0 (0.0%) | 29 (100.0%) |
| Legal Services & Support | 0 (0.0%) | 0 (0.0%) |
| Education Instruction & Library | 28 (43.8%) | 36 (56.2%) |
| Arts, Media & Entertainment | 0 (0.0%) | 0 (0.0%) |
| Health Diagnosing & Treating | 0 (0.0%) | 30 (100.0%) |
| Health Technologists | 0 (0.0%) | 11 (100.0%) |
| Total (Category) | 124 (38.3%) | 200 (61.7%) |
| Total (Overall) | 501 (50.2%) | 497 (49.8%) |
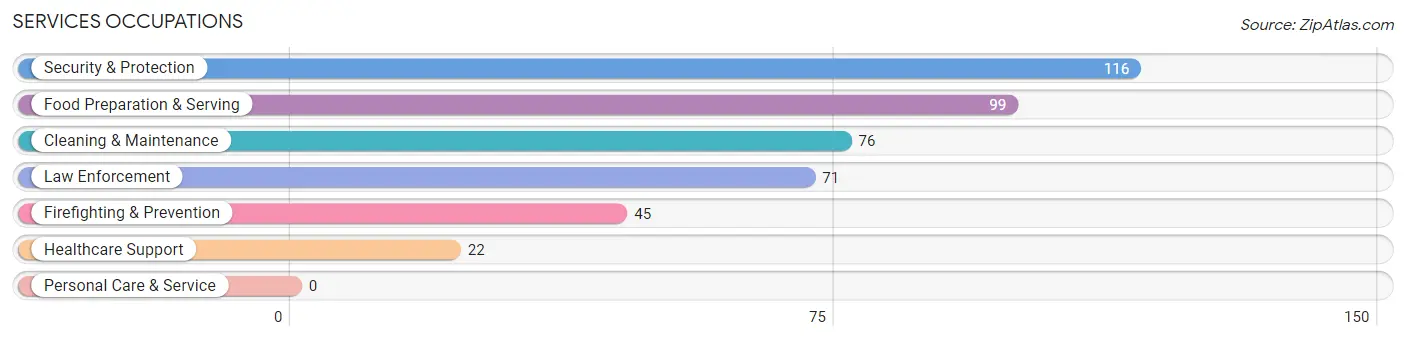
Services Occupations
The most common Services occupations in Janesville are Security & Protection (116 | 11.6%), Food Preparation & Serving (99 | 9.9%), Cleaning & Maintenance (76 | 7.6%), Law Enforcement (71 | 7.1%), and Firefighting & Prevention (45 | 4.5%).
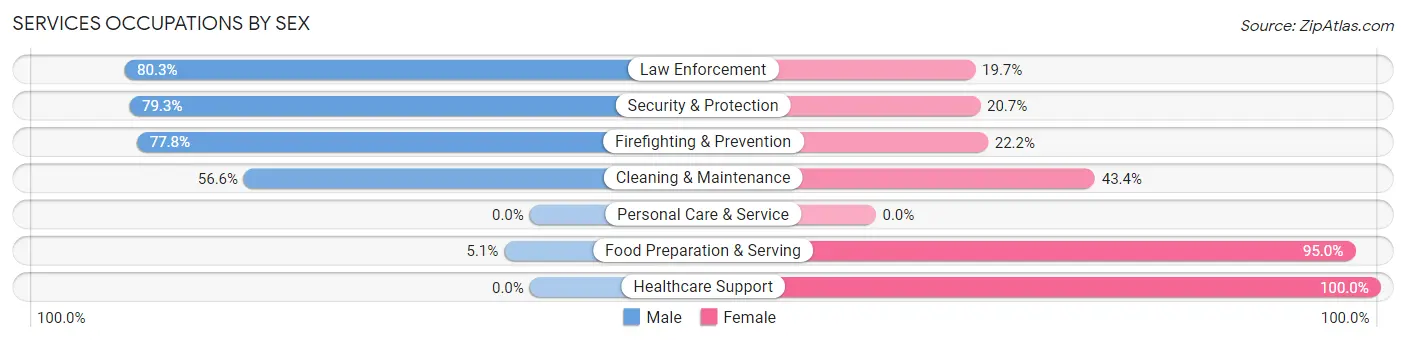
Services Occupations by Sex
Within the Services occupations in Janesville, the most male-oriented occupations are Law Enforcement (80.3%), Security & Protection (79.3%), and Firefighting & Prevention (77.8%), while the most female-oriented occupations are Healthcare Support (100.0%), Food Preparation & Serving (95.0%), and Cleaning & Maintenance (43.4%).
| Occupation | Male | Female |
| Healthcare Support | 0 (0.0%) | 22 (100.0%) |
| Security & Protection | 92 (79.3%) | 24 (20.7%) |
| Firefighting & Prevention | 35 (77.8%) | 10 (22.2%) |
| Law Enforcement | 57 (80.3%) | 14 (19.7%) |
| Food Preparation & Serving | 5 (5.1%) | 94 (95.0%) |
| Cleaning & Maintenance | 43 (56.6%) | 33 (43.4%) |
| Personal Care & Service | 0 (0.0%) | 0 (0.0%) |
| Total (Category) | 140 (44.7%) | 173 (55.3%) |
| Total (Overall) | 501 (50.2%) | 497 (49.8%) |
Sales and Office Occupations
The most common Sales and Office occupations in Janesville are Sales & Related (112 | 11.2%), and Office & Administration (81 | 8.1%).
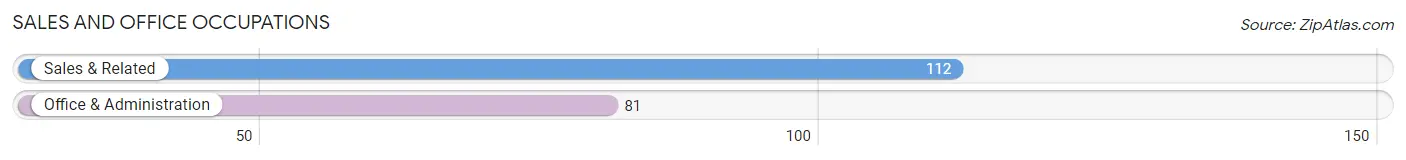
Sales and Office Occupations by Sex

| Occupation | Male | Female |
| Sales & Related | 57 (50.9%) | 55 (49.1%) |
| Office & Administration | 12 (14.8%) | 69 (85.2%) |
| Total (Category) | 69 (35.7%) | 124 (64.2%) |
| Total (Overall) | 501 (50.2%) | 497 (49.8%) |
Natural Resources, Construction and Maintenance Occupations
The most common Natural Resources, Construction and Maintenance occupations in Janesville are Construction & Extraction (48 | 4.8%), and Installation, Maintenance & Repair (8 | 0.8%).
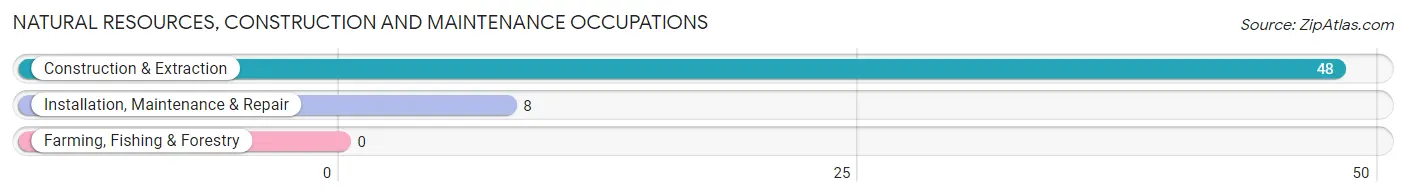
Natural Resources, Construction and Maintenance Occupations by Sex

| Occupation | Male | Female |
| Farming, Fishing & Forestry | 0 (0.0%) | 0 (0.0%) |
| Construction & Extraction | 48 (100.0%) | 0 (0.0%) |
| Installation, Maintenance & Repair | 8 (100.0%) | 0 (0.0%) |
| Total (Category) | 56 (100.0%) | 0 (0.0%) |
| Total (Overall) | 501 (50.2%) | 497 (49.8%) |
Production, Transportation and Moving Occupations
The most common Production, Transportation and Moving occupations in Janesville are Transportation (88 | 8.8%), Production (13 | 1.3%), and Material Moving (11 | 1.1%).
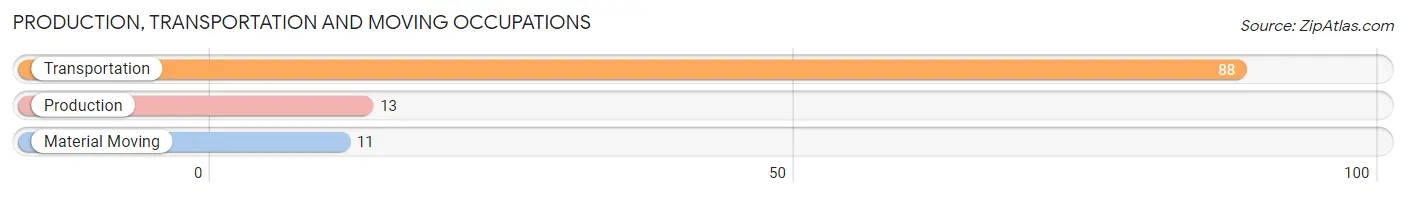
Production, Transportation and Moving Occupations by Sex
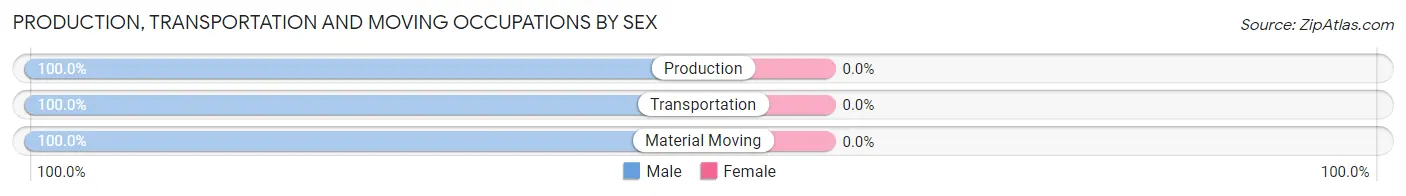
| Occupation | Male | Female |
| Production | 13 (100.0%) | 0 (0.0%) |
| Transportation | 88 (100.0%) | 0 (0.0%) |
| Material Moving | 11 (100.0%) | 0 (0.0%) |
| Total (Category) | 112 (100.0%) | 0 (0.0%) |
| Total (Overall) | 501 (50.2%) | 497 (49.8%) |
Employment Industries by Sex in Janesville
Employment Industries in Janesville
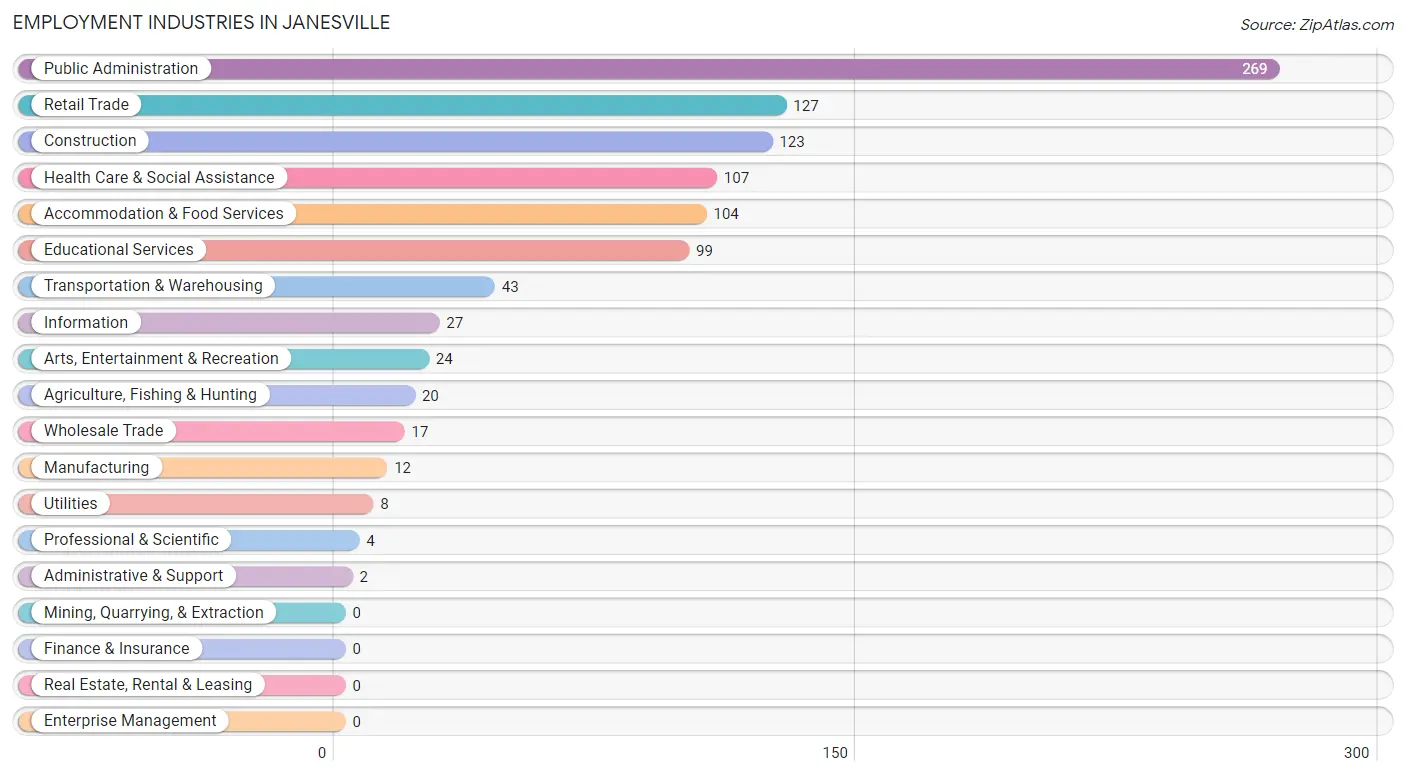
The major employment industries in Janesville include Public Administration (269 | 27.0%), Retail Trade (127 | 12.7%), Construction (123 | 12.3%), Health Care & Social Assistance (107 | 10.7%), and Accommodation & Food Services (104 | 10.4%).
Employment Industries by Sex in Janesville
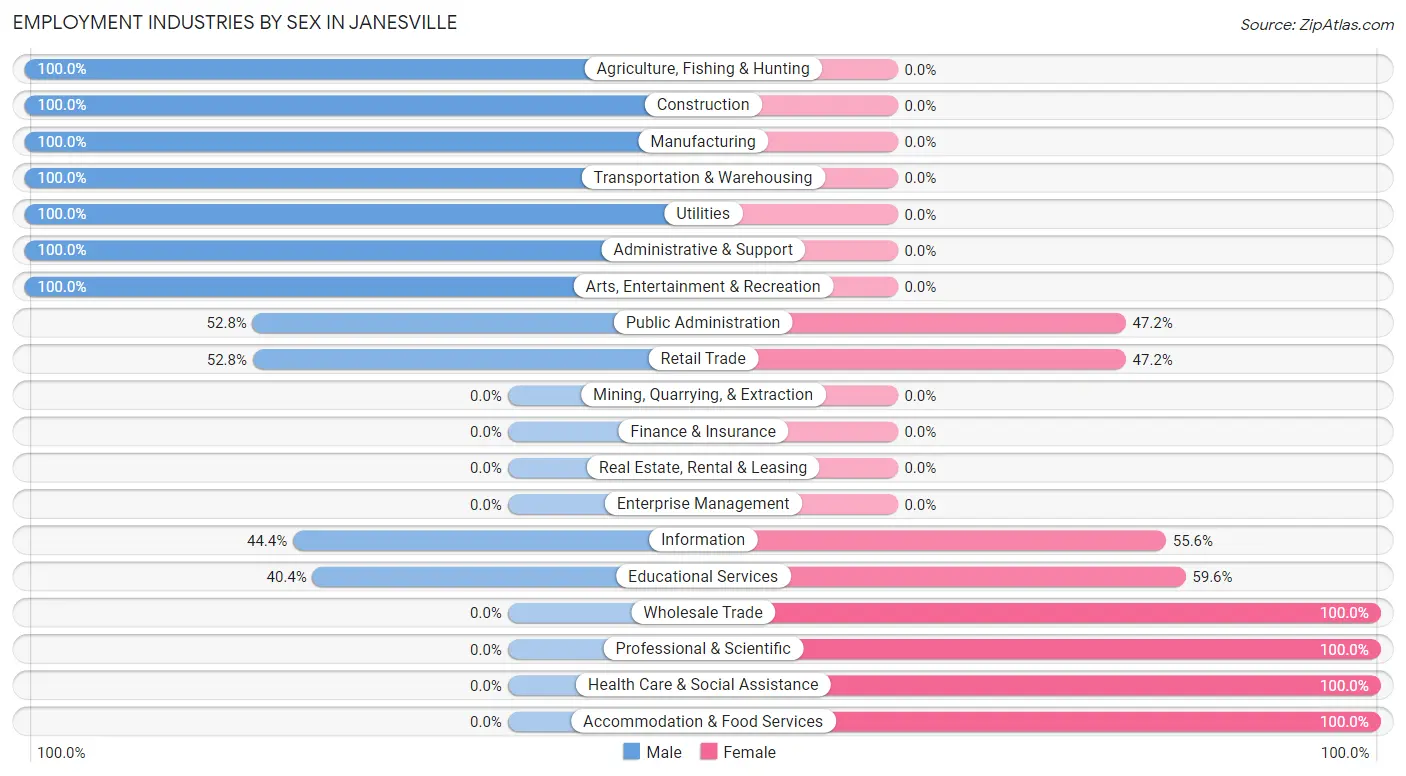
The Janesville industries that see more men than women are Agriculture, Fishing & Hunting (100.0%), Construction (100.0%), and Manufacturing (100.0%), whereas the industries that tend to have a higher number of women are Wholesale Trade (100.0%), Professional & Scientific (100.0%), and Health Care & Social Assistance (100.0%).
| Industry | Male | Female |
| Agriculture, Fishing & Hunting | 20 (100.0%) | 0 (0.0%) |
| Mining, Quarrying, & Extraction | 0 (0.0%) | 0 (0.0%) |
| Construction | 123 (100.0%) | 0 (0.0%) |
| Manufacturing | 12 (100.0%) | 0 (0.0%) |
| Wholesale Trade | 0 (0.0%) | 17 (100.0%) |
| Retail Trade | 67 (52.8%) | 60 (47.2%) |
| Transportation & Warehousing | 43 (100.0%) | 0 (0.0%) |
| Utilities | 8 (100.0%) | 0 (0.0%) |
| Information | 12 (44.4%) | 15 (55.6%) |
| Finance & Insurance | 0 (0.0%) | 0 (0.0%) |
| Real Estate, Rental & Leasing | 0 (0.0%) | 0 (0.0%) |
| Professional & Scientific | 0 (0.0%) | 4 (100.0%) |
| Enterprise Management | 0 (0.0%) | 0 (0.0%) |
| Administrative & Support | 2 (100.0%) | 0 (0.0%) |
| Educational Services | 40 (40.4%) | 59 (59.6%) |
| Health Care & Social Assistance | 0 (0.0%) | 107 (100.0%) |
| Arts, Entertainment & Recreation | 24 (100.0%) | 0 (0.0%) |
| Accommodation & Food Services | 0 (0.0%) | 104 (100.0%) |
| Public Administration | 142 (52.8%) | 127 (47.2%) |
| Total | 501 (50.2%) | 497 (49.8%) |
Education in Janesville
School Enrollment in Janesville
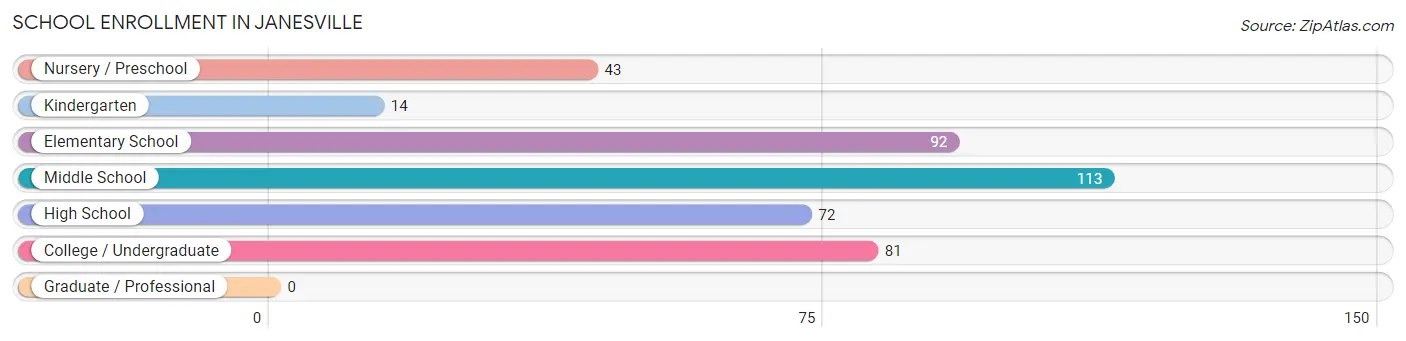
The most common levels of schooling among the 415 students in Janesville are middle school (113 | 27.2%), elementary school (92 | 22.2%), and college / undergraduate (81 | 19.5%).
| School Level | # Students | % Students |
| Nursery / Preschool | 43 | 10.4% |
| Kindergarten | 14 | 3.4% |
| Elementary School | 92 | 22.2% |
| Middle School | 113 | 27.2% |
| High School | 72 | 17.3% |
| College / Undergraduate | 81 | 19.5% |
| Graduate / Professional | 0 | 0.0% |
| Total | 415 | 100.0% |
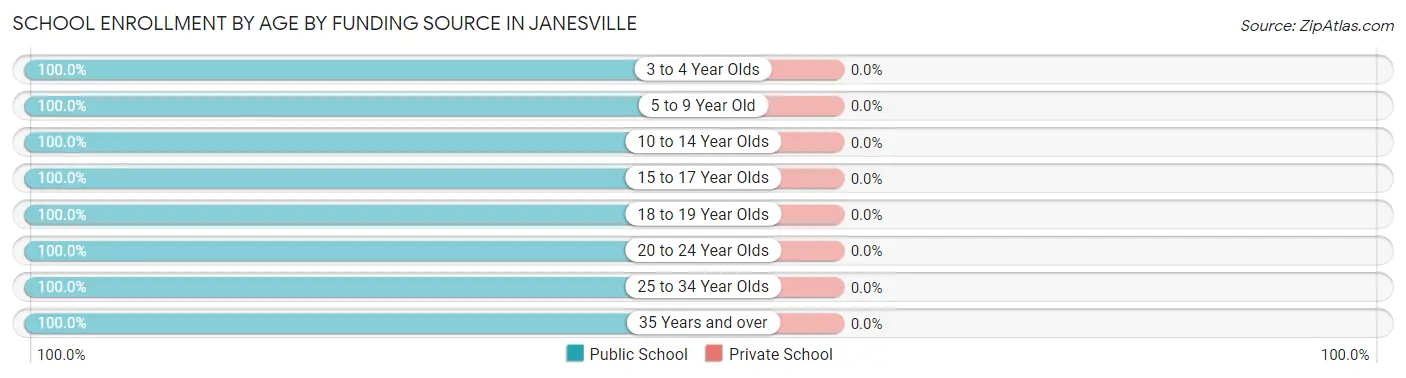
School Enrollment by Age by Funding Source in Janesville
| Age Bracket | Public School | Private School |
| 3 to 4 Year Olds | 35 (100.0%) | 0 (0.0%) |
| 5 to 9 Year Old | 102 (100.0%) | 0 (0.0%) |
| 10 to 14 Year Olds | 151 (100.0%) | 0 (0.0%) |
| 15 to 17 Year Olds | 5 (100.0%) | 0 (0.0%) |
| 18 to 19 Year Olds | 70 (100.0%) | 0 (0.0%) |
| 20 to 24 Year Olds | 9 (100.0%) | 0 (0.0%) |
| 25 to 34 Year Olds | 9 (100.0%) | 0 (0.0%) |
| 35 Years and over | 34 (100.0%) | 0 (0.0%) |
| Total | 415 (100.0%) | 0 (0.0%) |
Educational Attainment by Field of Study in Janesville
Bio, nature & agricultural (64 | 26.2%), arts & humanities (29 | 11.9%), social sciences (27 | 11.1%), education (23 | 9.4%), and computers & mathematics (20 | 8.2%) are the most common fields of study among 244 individuals in Janesville who have obtained a bachelor's degree or higher.
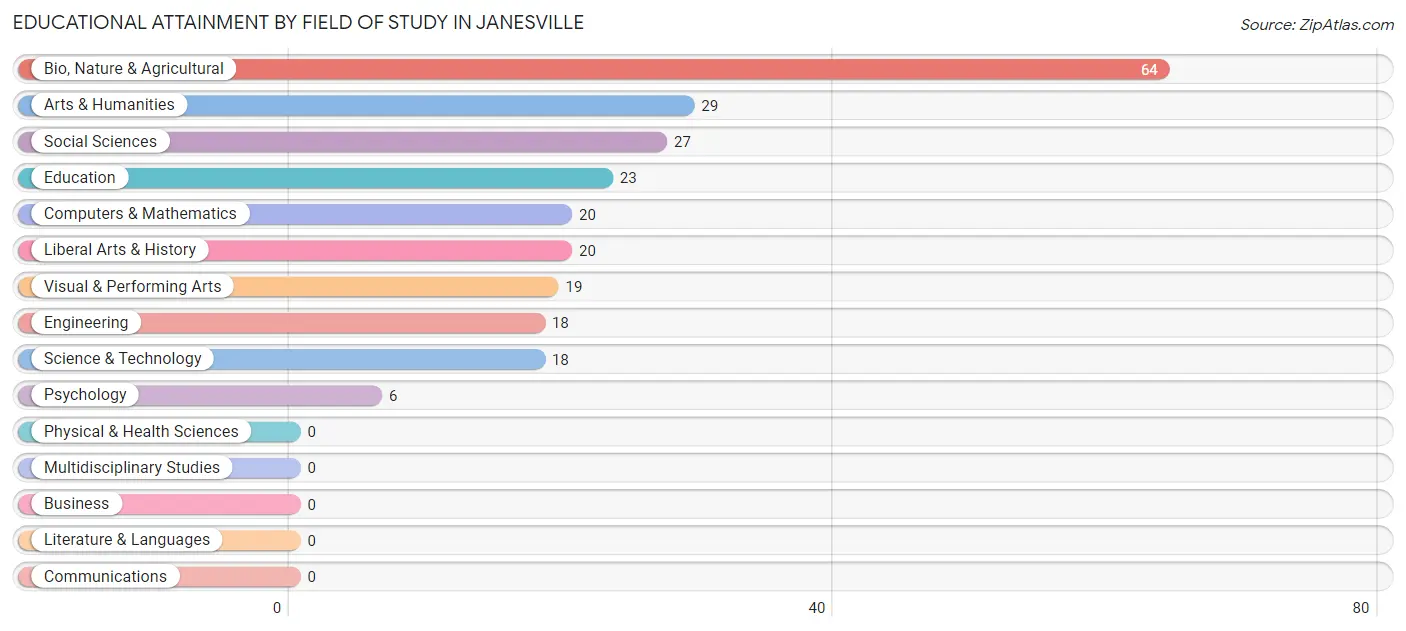
| Field of Study | # Graduates | % Graduates |
| Computers & Mathematics | 20 | 8.2% |
| Bio, Nature & Agricultural | 64 | 26.2% |
| Physical & Health Sciences | 0 | 0.0% |
| Psychology | 6 | 2.5% |
| Social Sciences | 27 | 11.1% |
| Engineering | 18 | 7.4% |
| Multidisciplinary Studies | 0 | 0.0% |
| Science & Technology | 18 | 7.4% |
| Business | 0 | 0.0% |
| Education | 23 | 9.4% |
| Literature & Languages | 0 | 0.0% |
| Liberal Arts & History | 20 | 8.2% |
| Visual & Performing Arts | 19 | 7.8% |
| Communications | 0 | 0.0% |
| Arts & Humanities | 29 | 11.9% |
| Total | 244 | 100.0% |
Transportation & Commute in Janesville
Vehicle Availability by Sex in Janesville
The most prevalent vehicle ownership categories in Janesville are males with 2 vehicles (176, accounting for 37.2%) and females with 2 vehicles (116, making up 35.4%).
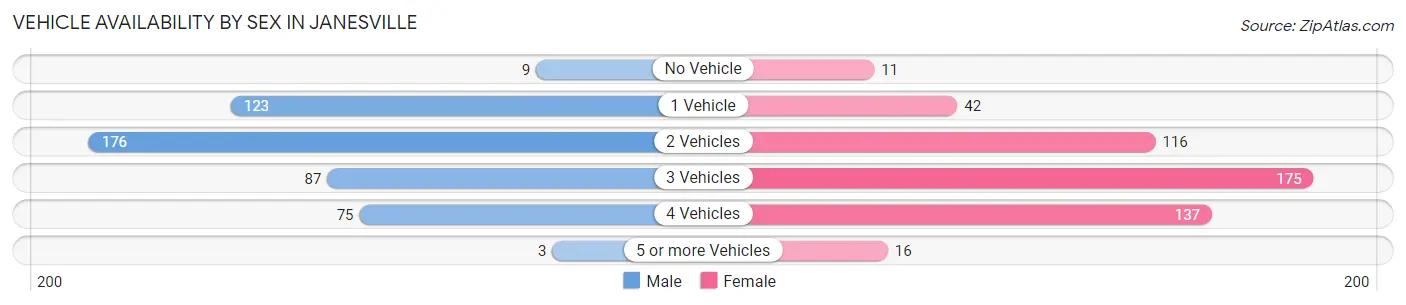
| Vehicles Available | Male | Female |
| No Vehicle | 9 (1.9%) | 11 (2.2%) |
| 1 Vehicle | 123 (26.0%) | 42 (8.5%) |
| 2 Vehicles | 176 (37.2%) | 116 (23.3%) |
| 3 Vehicles | 87 (18.4%) | 175 (35.2%) |
| 4 Vehicles | 75 (15.9%) | 137 (27.6%) |
| 5 or more Vehicles | 3 (0.6%) | 16 (3.2%) |
| Total | 473 (100.0%) | 497 (100.0%) |
Commute Time in Janesville
The most frequently occuring commute durations in Janesville are 20 to 24 minutes (449 commuters, 48.0%), 15 to 19 minutes (223 commuters, 23.8%), and 5 to 9 minutes (72 commuters, 7.7%).
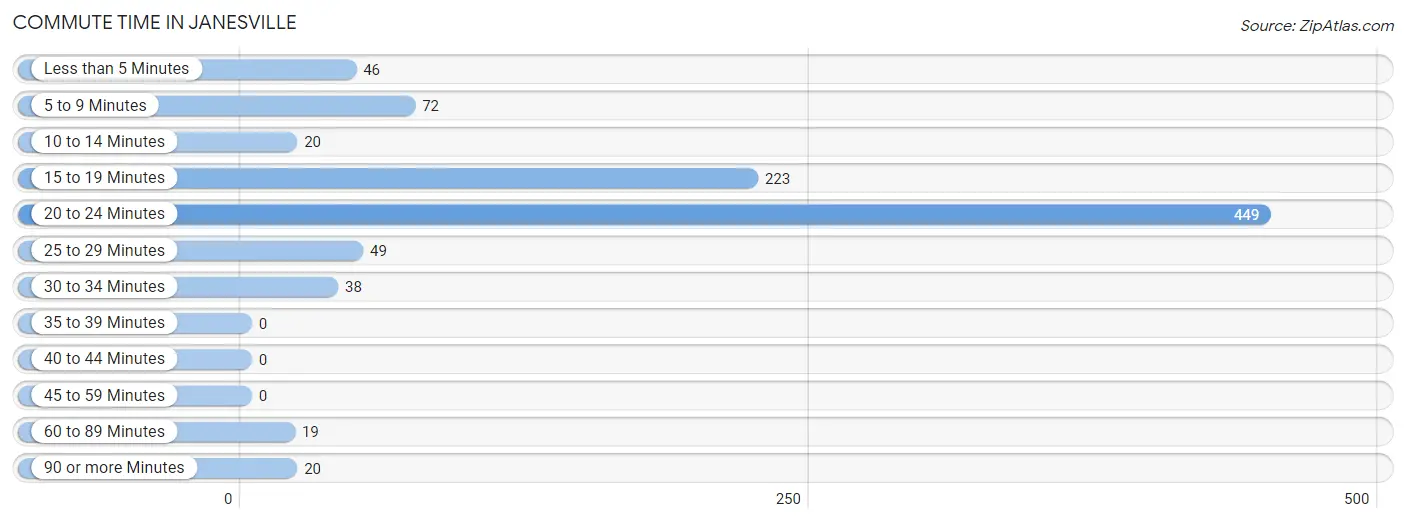
| Commute Time | # Commuters | % Commuters |
| Less than 5 Minutes | 46 | 4.9% |
| 5 to 9 Minutes | 72 | 7.7% |
| 10 to 14 Minutes | 20 | 2.1% |
| 15 to 19 Minutes | 223 | 23.8% |
| 20 to 24 Minutes | 449 | 48.0% |
| 25 to 29 Minutes | 49 | 5.2% |
| 30 to 34 Minutes | 38 | 4.1% |
| 35 to 39 Minutes | 0 | 0.0% |
| 40 to 44 Minutes | 0 | 0.0% |
| 45 to 59 Minutes | 0 | 0.0% |
| 60 to 89 Minutes | 19 | 2.0% |
| 90 or more Minutes | 20 | 2.1% |
Commute Time by Sex in Janesville
The most common commute times in Janesville are 20 to 24 minutes (192 commuters, 41.5%) for males and 20 to 24 minutes (257 commuters, 54.3%) for females.
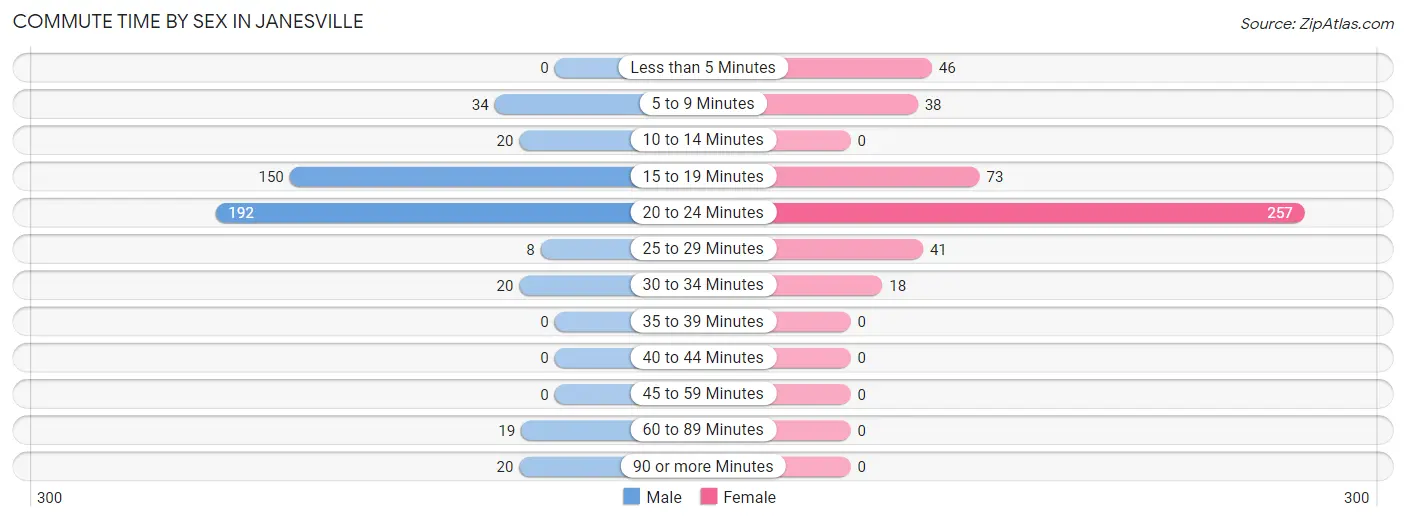
| Commute Time | Male | Female |
| Less than 5 Minutes | 0 (0.0%) | 46 (9.7%) |
| 5 to 9 Minutes | 34 (7.3%) | 38 (8.0%) |
| 10 to 14 Minutes | 20 (4.3%) | 0 (0.0%) |
| 15 to 19 Minutes | 150 (32.4%) | 73 (15.4%) |
| 20 to 24 Minutes | 192 (41.5%) | 257 (54.3%) |
| 25 to 29 Minutes | 8 (1.7%) | 41 (8.7%) |
| 30 to 34 Minutes | 20 (4.3%) | 18 (3.8%) |
| 35 to 39 Minutes | 0 (0.0%) | 0 (0.0%) |
| 40 to 44 Minutes | 0 (0.0%) | 0 (0.0%) |
| 45 to 59 Minutes | 0 (0.0%) | 0 (0.0%) |
| 60 to 89 Minutes | 19 (4.1%) | 0 (0.0%) |
| 90 or more Minutes | 20 (4.3%) | 0 (0.0%) |
Time of Departure to Work by Sex in Janesville
The most frequent times of departure to work in Janesville are 7:00 AM to 7:29 AM (149, 32.2%) for males and 7:30 AM to 7:59 AM (213, 45.0%) for females.
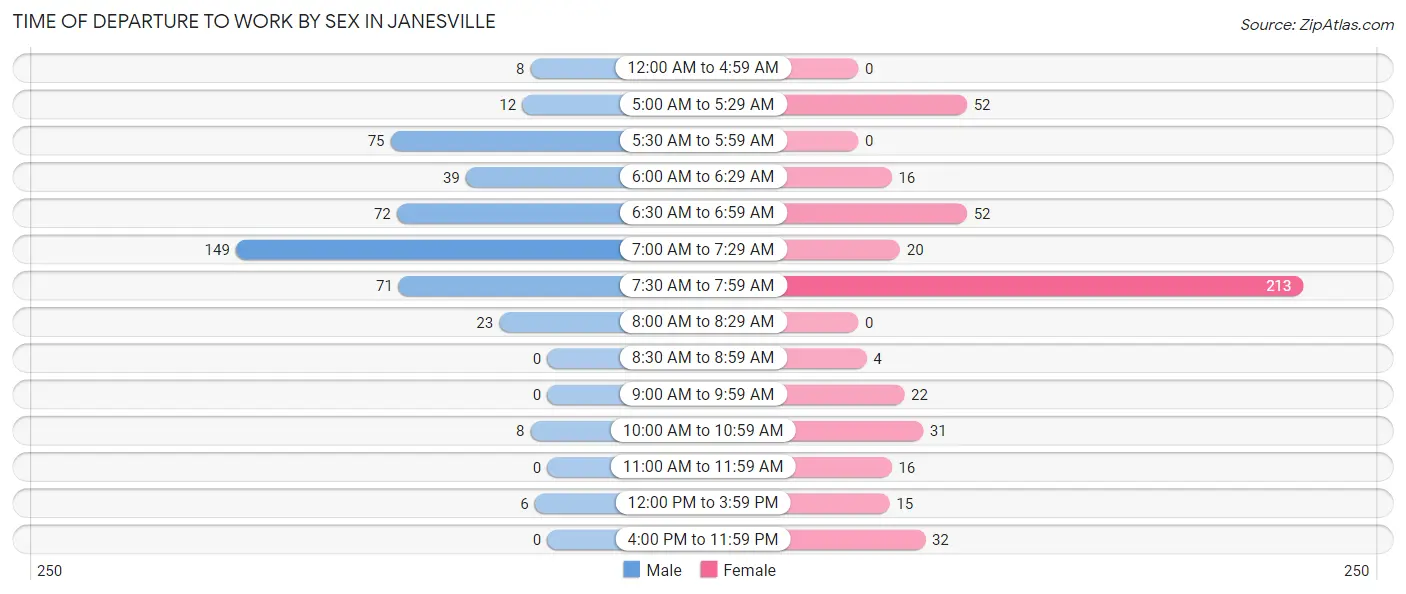
| Time of Departure | Male | Female |
| 12:00 AM to 4:59 AM | 8 (1.7%) | 0 (0.0%) |
| 5:00 AM to 5:29 AM | 12 (2.6%) | 52 (11.0%) |
| 5:30 AM to 5:59 AM | 75 (16.2%) | 0 (0.0%) |
| 6:00 AM to 6:29 AM | 39 (8.4%) | 16 (3.4%) |
| 6:30 AM to 6:59 AM | 72 (15.5%) | 52 (11.0%) |
| 7:00 AM to 7:29 AM | 149 (32.2%) | 20 (4.2%) |
| 7:30 AM to 7:59 AM | 71 (15.3%) | 213 (45.0%) |
| 8:00 AM to 8:29 AM | 23 (5.0%) | 0 (0.0%) |
| 8:30 AM to 8:59 AM | 0 (0.0%) | 4 (0.9%) |
| 9:00 AM to 9:59 AM | 0 (0.0%) | 22 (4.6%) |
| 10:00 AM to 10:59 AM | 8 (1.7%) | 31 (6.6%) |
| 11:00 AM to 11:59 AM | 0 (0.0%) | 16 (3.4%) |
| 12:00 PM to 3:59 PM | 6 (1.3%) | 15 (3.2%) |
| 4:00 PM to 11:59 PM | 0 (0.0%) | 32 (6.8%) |
| Total | 463 (100.0%) | 473 (100.0%) |
Housing Occupancy in Janesville
Occupancy by Ownership in Janesville
Of the total 1,053 dwellings in Janesville, owner-occupied units account for 747 (70.9%), while renter-occupied units make up 306 (29.1%).
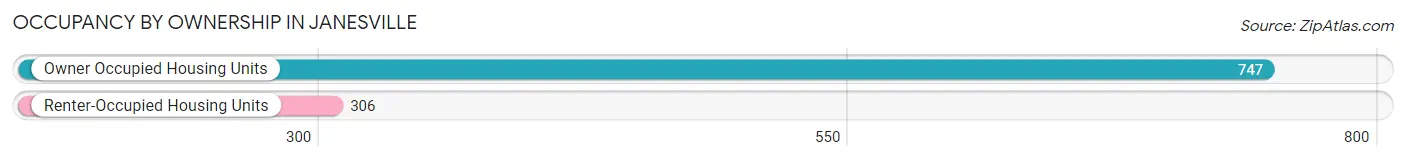
| Occupancy | # Housing Units | % Housing Units |
| Owner Occupied Housing Units | 747 | 70.9% |
| Renter-Occupied Housing Units | 306 | 29.1% |
| Total Occupied Housing Units | 1,053 | 100.0% |
Occupancy by Household Size in Janesville
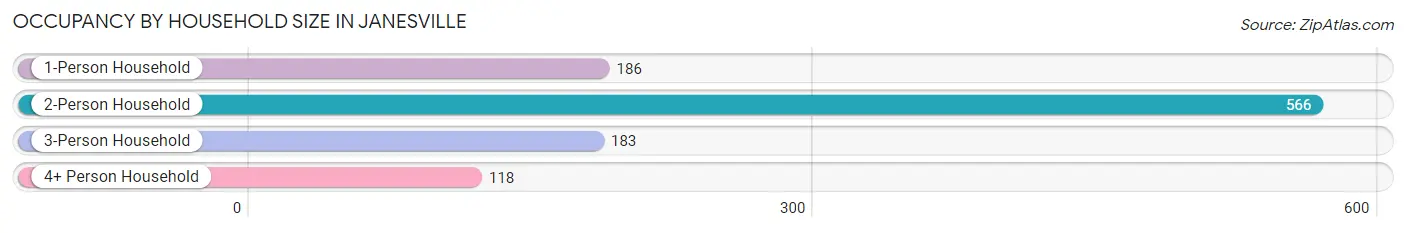
| Household Size | # Housing Units | % Housing Units |
| 1-Person Household | 186 | 17.7% |
| 2-Person Household | 566 | 53.7% |
| 3-Person Household | 183 | 17.4% |
| 4+ Person Household | 118 | 11.2% |
| Total Housing Units | 1,053 | 100.0% |
Occupancy by Ownership by Household Size in Janesville
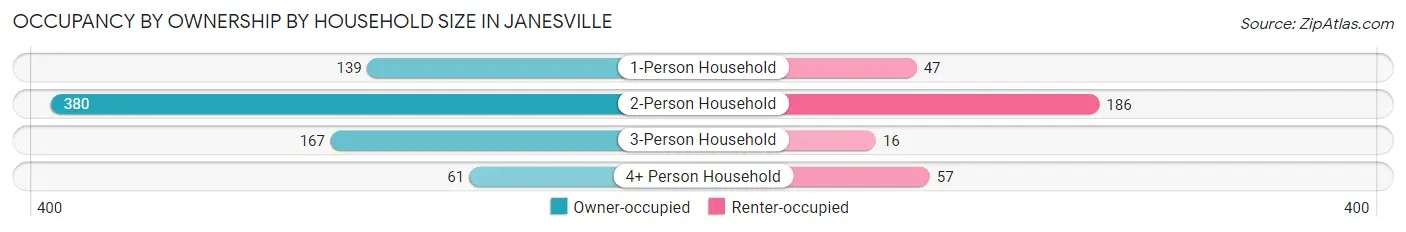
| Household Size | Owner-occupied | Renter-occupied |
| 1-Person Household | 139 (74.7%) | 47 (25.3%) |
| 2-Person Household | 380 (67.1%) | 186 (32.9%) |
| 3-Person Household | 167 (91.3%) | 16 (8.7%) |
| 4+ Person Household | 61 (51.7%) | 57 (48.3%) |
| Total Housing Units | 747 (70.9%) | 306 (29.1%) |
Occupancy by Educational Attainment in Janesville
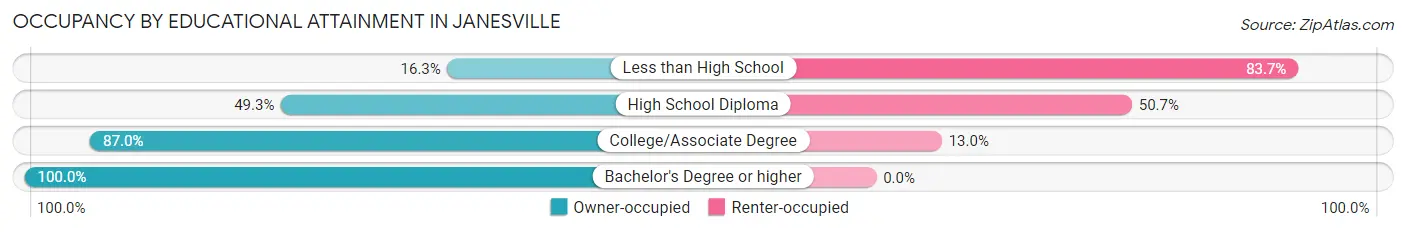
| Household Size | Owner-occupied | Renter-occupied |
| Less than High School | 24 (16.3%) | 123 (83.7%) |
| High School Diploma | 108 (49.3%) | 111 (50.7%) |
| College/Associate Degree | 482 (87.0%) | 72 (13.0%) |
| Bachelor's Degree or higher | 133 (100.0%) | 0 (0.0%) |
Occupancy by Age of Householder in Janesville
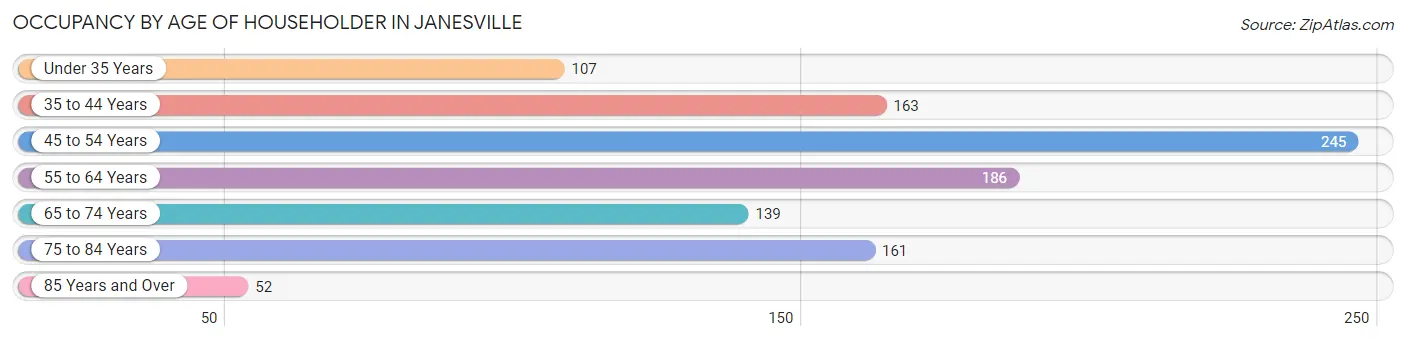
| Age Bracket | # Households | % Households |
| Under 35 Years | 107 | 10.2% |
| 35 to 44 Years | 163 | 15.5% |
| 45 to 54 Years | 245 | 23.3% |
| 55 to 64 Years | 186 | 17.7% |
| 65 to 74 Years | 139 | 13.2% |
| 75 to 84 Years | 161 | 15.3% |
| 85 Years and Over | 52 | 4.9% |
| Total | 1,053 | 100.0% |
Housing Finances in Janesville
Median Income by Occupancy in Janesville
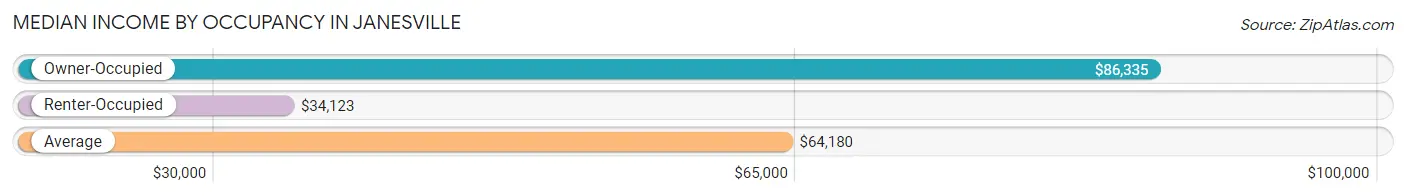
| Occupancy Type | # Households | Median Income |
| Owner-Occupied | 747 (70.9%) | $86,335 |
| Renter-Occupied | 306 (29.1%) | $34,123 |
| Average | 1,053 (100.0%) | $64,180 |
Occupancy by Householder Income Bracket in Janesville
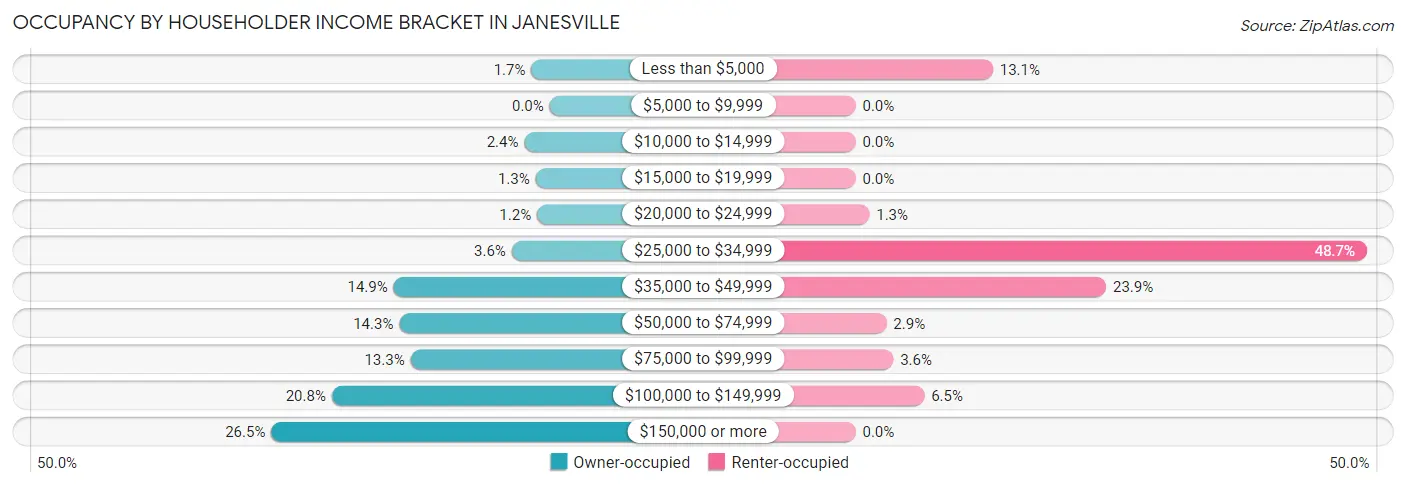
| Income Bracket | Owner-occupied | Renter-occupied |
| Less than $5,000 | 13 (1.7%) | 40 (13.1%) |
| $5,000 to $9,999 | 0 (0.0%) | 0 (0.0%) |
| $10,000 to $14,999 | 18 (2.4%) | 0 (0.0%) |
| $15,000 to $19,999 | 10 (1.3%) | 0 (0.0%) |
| $20,000 to $24,999 | 9 (1.2%) | 4 (1.3%) |
| $25,000 to $34,999 | 27 (3.6%) | 149 (48.7%) |
| $35,000 to $49,999 | 111 (14.9%) | 73 (23.9%) |
| $50,000 to $74,999 | 107 (14.3%) | 9 (2.9%) |
| $75,000 to $99,999 | 99 (13.3%) | 11 (3.6%) |
| $100,000 to $149,999 | 155 (20.7%) | 20 (6.5%) |
| $150,000 or more | 198 (26.5%) | 0 (0.0%) |
| Total | 747 (100.0%) | 306 (100.0%) |
Monthly Housing Cost Tiers in Janesville
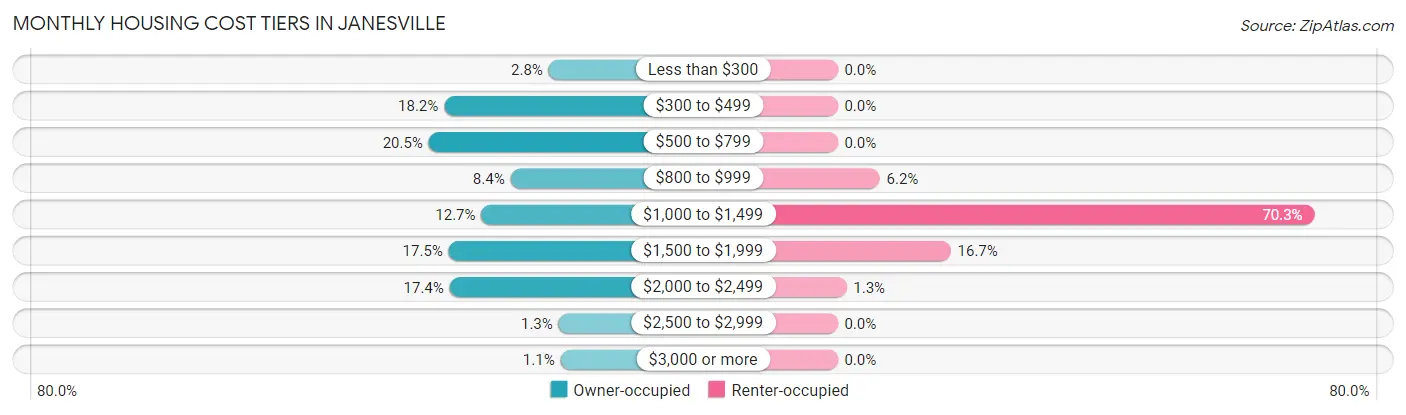
| Monthly Cost | Owner-occupied | Renter-occupied |
| Less than $300 | 21 (2.8%) | 0 (0.0%) |
| $300 to $499 | 136 (18.2%) | 0 (0.0%) |
| $500 to $799 | 153 (20.5%) | 0 (0.0%) |
| $800 to $999 | 63 (8.4%) | 19 (6.2%) |
| $1,000 to $1,499 | 95 (12.7%) | 215 (70.3%) |
| $1,500 to $1,999 | 131 (17.5%) | 51 (16.7%) |
| $2,000 to $2,499 | 130 (17.4%) | 4 (1.3%) |
| $2,500 to $2,999 | 10 (1.3%) | 0 (0.0%) |
| $3,000 or more | 8 (1.1%) | 0 (0.0%) |
| Total | 747 (100.0%) | 306 (100.0%) |
Physical Housing Characteristics in Janesville
Housing Structures in Janesville
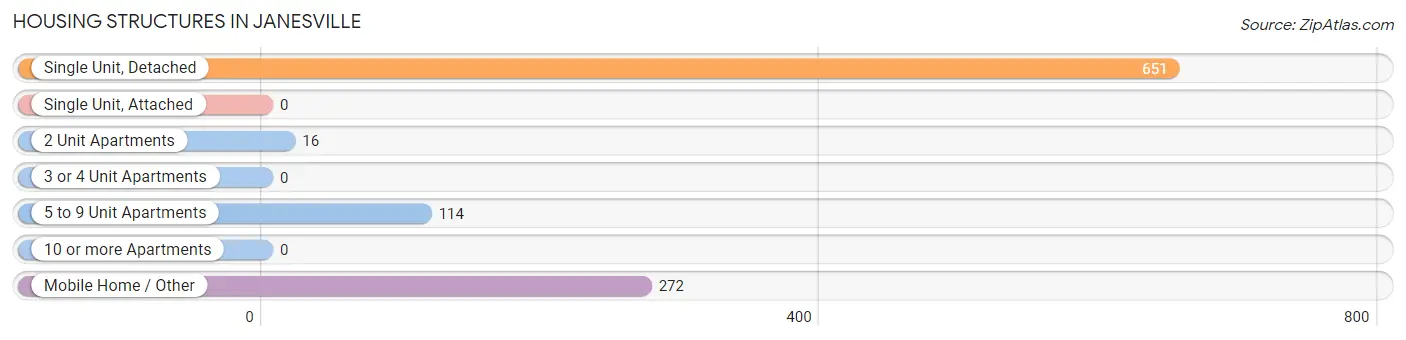
| Structure Type | # Housing Units | % Housing Units |
| Single Unit, Detached | 651 | 61.8% |
| Single Unit, Attached | 0 | 0.0% |
| 2 Unit Apartments | 16 | 1.5% |
| 3 or 4 Unit Apartments | 0 | 0.0% |
| 5 to 9 Unit Apartments | 114 | 10.8% |
| 10 or more Apartments | 0 | 0.0% |
| Mobile Home / Other | 272 | 25.8% |
| Total | 1,053 | 100.0% |
Housing Structures by Occupancy in Janesville
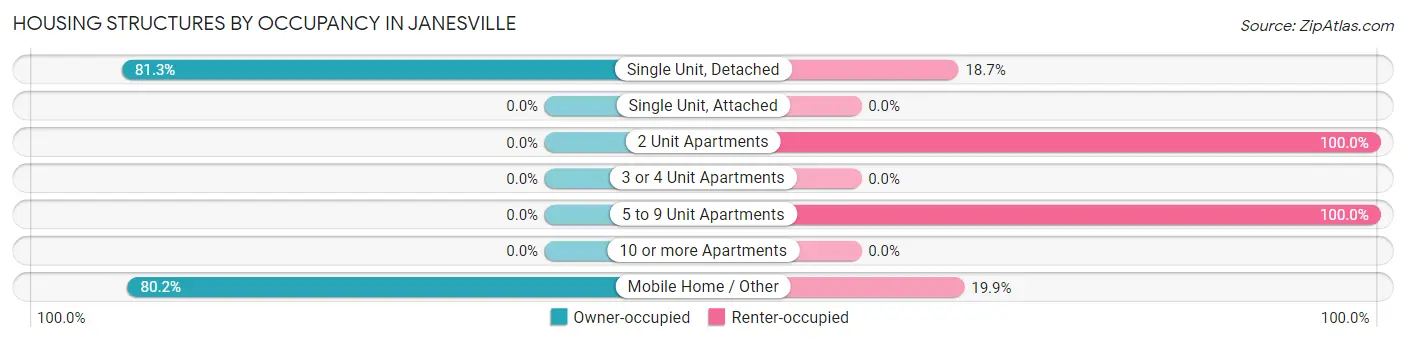
| Structure Type | Owner-occupied | Renter-occupied |
| Single Unit, Detached | 529 (81.3%) | 122 (18.7%) |
| Single Unit, Attached | 0 (0.0%) | 0 (0.0%) |
| 2 Unit Apartments | 0 (0.0%) | 16 (100.0%) |
| 3 or 4 Unit Apartments | 0 (0.0%) | 0 (0.0%) |
| 5 to 9 Unit Apartments | 0 (0.0%) | 114 (100.0%) |
| 10 or more Apartments | 0 (0.0%) | 0 (0.0%) |
| Mobile Home / Other | 218 (80.1%) | 54 (19.9%) |
| Total | 747 (70.9%) | 306 (29.1%) |
Housing Structures by Number of Rooms in Janesville
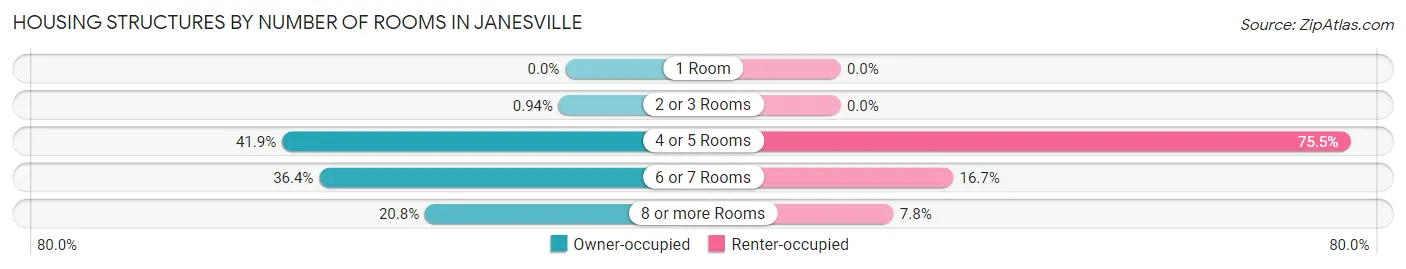
| Number of Rooms | Owner-occupied | Renter-occupied |
| 1 Room | 0 (0.0%) | 0 (0.0%) |
| 2 or 3 Rooms | 7 (0.9%) | 0 (0.0%) |
| 4 or 5 Rooms | 313 (41.9%) | 231 (75.5%) |
| 6 or 7 Rooms | 272 (36.4%) | 51 (16.7%) |
| 8 or more Rooms | 155 (20.7%) | 24 (7.8%) |
| Total | 747 (100.0%) | 306 (100.0%) |
Housing Structure by Heating Type in Janesville
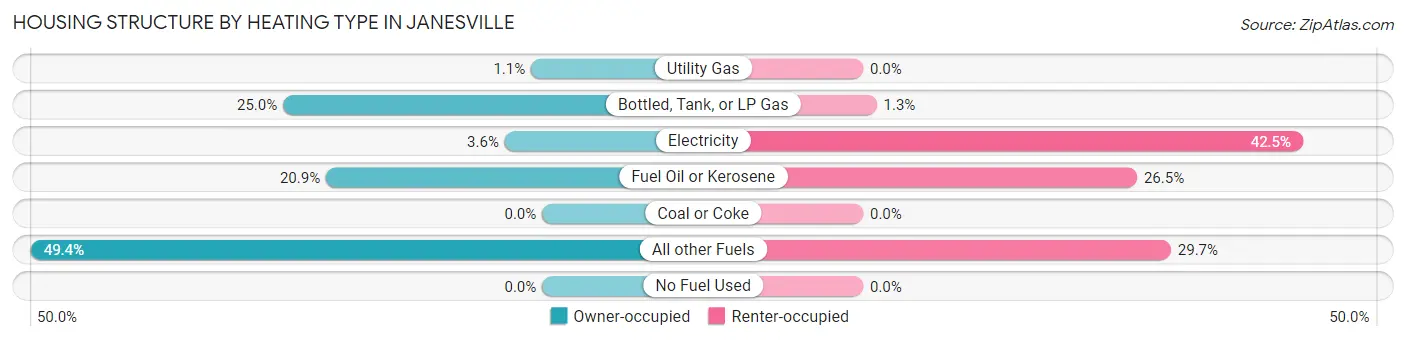
| Heating Type | Owner-occupied | Renter-occupied |
| Utility Gas | 8 (1.1%) | 0 (0.0%) |
| Bottled, Tank, or LP Gas | 187 (25.0%) | 4 (1.3%) |
| Electricity | 27 (3.6%) | 130 (42.5%) |
| Fuel Oil or Kerosene | 156 (20.9%) | 81 (26.5%) |
| Coal or Coke | 0 (0.0%) | 0 (0.0%) |
| All other Fuels | 369 (49.4%) | 91 (29.7%) |
| No Fuel Used | 0 (0.0%) | 0 (0.0%) |
| Total | 747 (100.0%) | 306 (100.0%) |
Household Vehicle Usage in Janesville
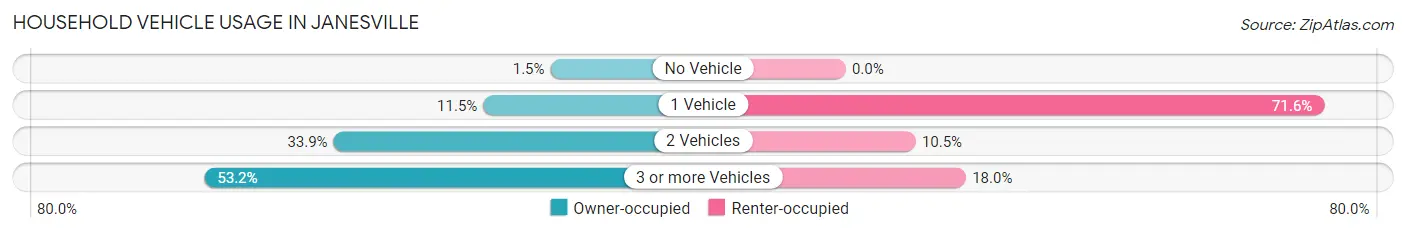
| Vehicles per Household | Owner-occupied | Renter-occupied |
| No Vehicle | 11 (1.5%) | 0 (0.0%) |
| 1 Vehicle | 86 (11.5%) | 219 (71.6%) |
| 2 Vehicles | 253 (33.9%) | 32 (10.5%) |
| 3 or more Vehicles | 397 (53.1%) | 55 (18.0%) |
| Total | 747 (100.0%) | 306 (100.0%) |
Real Estate & Mortgages in Janesville
Real Estate and Mortgage Overview in Janesville
| Characteristic | Without Mortgage | With Mortgage |
| Housing Units | 396 | 351 |
| Median Property Value | $266,000 | $289,600 |
| Median Household Income | $63,333 | $104 |
| Monthly Housing Costs | $557 | $8 |
| Real Estate Taxes | $1,477 | $11 |
Property Value by Mortgage Status in Janesville
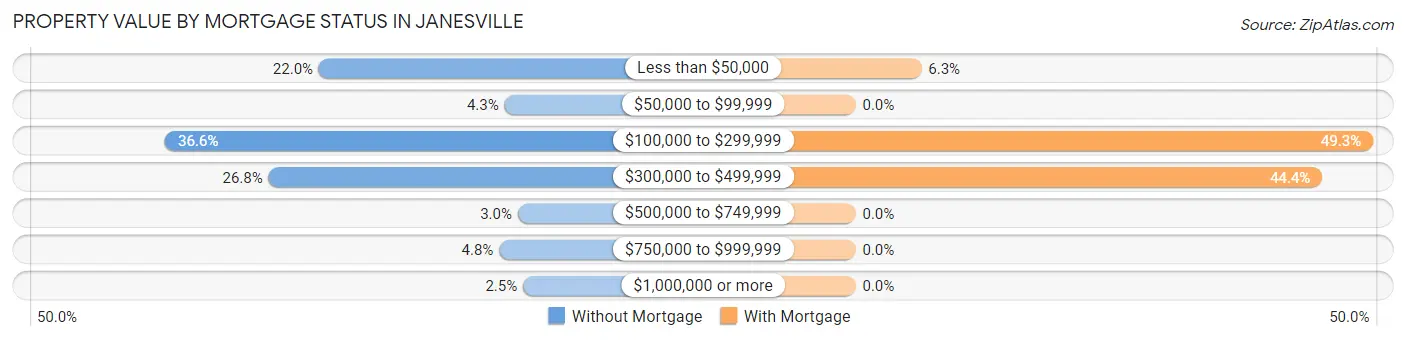
| Property Value | Without Mortgage | With Mortgage |
| Less than $50,000 | 87 (22.0%) | 22 (6.3%) |
| $50,000 to $99,999 | 17 (4.3%) | 0 (0.0%) |
| $100,000 to $299,999 | 145 (36.6%) | 173 (49.3%) |
| $300,000 to $499,999 | 106 (26.8%) | 156 (44.4%) |
| $500,000 to $749,999 | 12 (3.0%) | 0 (0.0%) |
| $750,000 to $999,999 | 19 (4.8%) | 0 (0.0%) |
| $1,000,000 or more | 10 (2.5%) | 0 (0.0%) |
| Total | 396 (100.0%) | 351 (100.0%) |
Household Income by Mortgage Status in Janesville
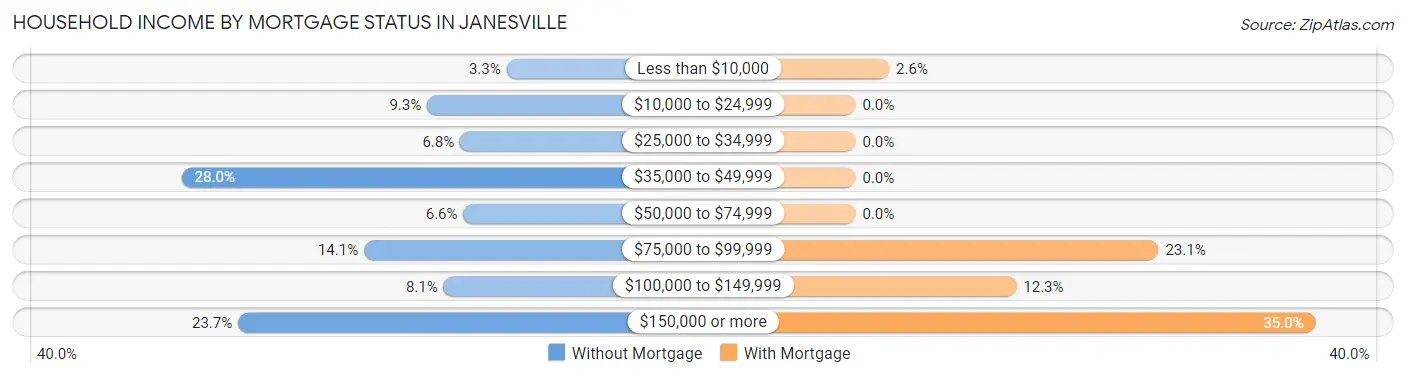
| Household Income | Without Mortgage | With Mortgage |
| Less than $10,000 | 13 (3.3%) | 9 (2.6%) |
| $10,000 to $24,999 | 37 (9.3%) | 0 (0.0%) |
| $25,000 to $34,999 | 27 (6.8%) | 0 (0.0%) |
| $35,000 to $49,999 | 111 (28.0%) | 0 (0.0%) |
| $50,000 to $74,999 | 26 (6.6%) | 0 (0.0%) |
| $75,000 to $99,999 | 56 (14.1%) | 81 (23.1%) |
| $100,000 to $149,999 | 32 (8.1%) | 43 (12.2%) |
| $150,000 or more | 94 (23.7%) | 123 (35.0%) |
| Total | 396 (100.0%) | 351 (100.0%) |
Property Value to Household Income Ratio in Janesville
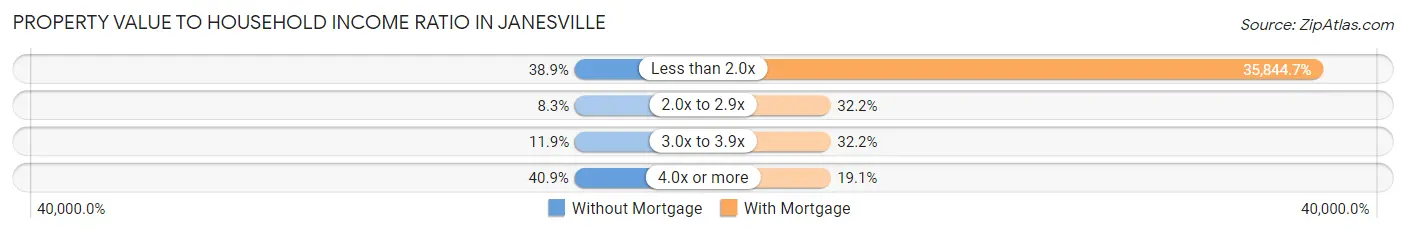
| Value-to-Income Ratio | Without Mortgage | With Mortgage |
| Less than 2.0x | 154 (38.9%) | 125,815 (35,844.7%) |
| 2.0x to 2.9x | 33 (8.3%) | 113 (32.2%) |
| 3.0x to 3.9x | 47 (11.9%) | 113 (32.2%) |
| 4.0x or more | 162 (40.9%) | 67 (19.1%) |
| Total | 396 (100.0%) | 351 (100.0%) |
Real Estate Taxes by Mortgage Status in Janesville
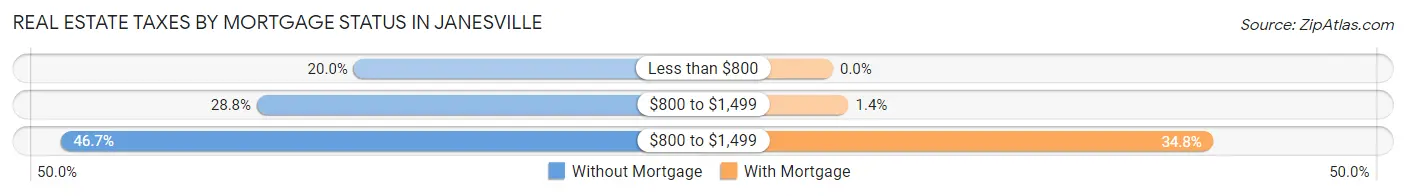
| Property Taxes | Without Mortgage | With Mortgage |
| Less than $800 | 79 (20.0%) | 0 (0.0%) |
| $800 to $1,499 | 114 (28.8%) | 5 (1.4%) |
| $800 to $1,499 | 185 (46.7%) | 122 (34.8%) |
| Total | 396 (100.0%) | 351 (100.0%) |
Health & Disability in Janesville
Health Insurance Coverage by Age in Janesville
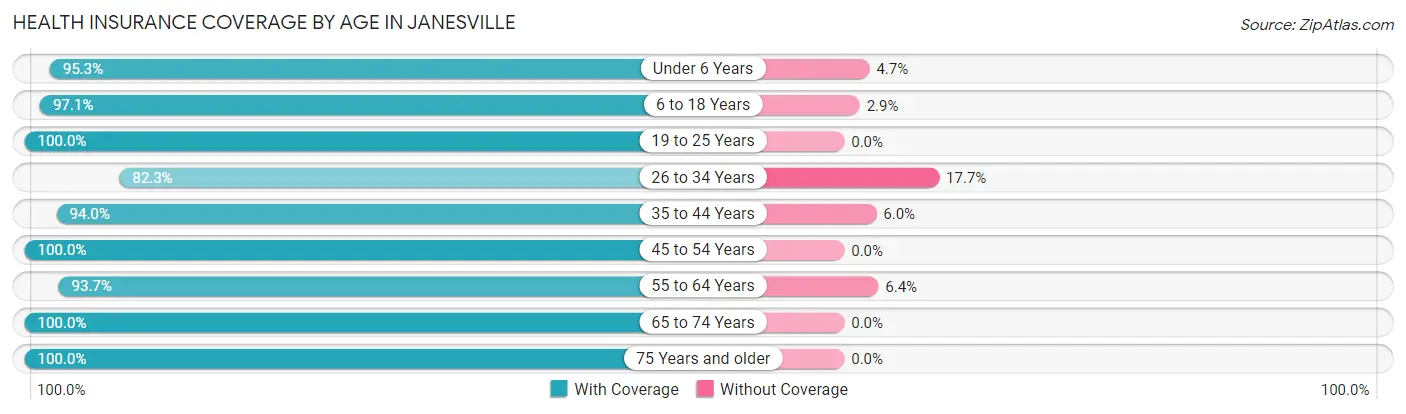
| Age Bracket | With Coverage | Without Coverage |
| Under 6 Years | 142 (95.3%) | 7 (4.7%) |
| 6 to 18 Years | 337 (97.1%) | 10 (2.9%) |
| 19 to 25 Years | 138 (100.0%) | 0 (0.0%) |
| 26 to 34 Years | 228 (82.3%) | 49 (17.7%) |
| 35 to 44 Years | 189 (94.0%) | 12 (6.0%) |
| 45 to 54 Years | 476 (100.0%) | 0 (0.0%) |
| 55 to 64 Years | 457 (93.6%) | 31 (6.4%) |
| 65 to 74 Years | 278 (100.0%) | 0 (0.0%) |
| 75 Years and older | 287 (100.0%) | 0 (0.0%) |
| Total | 2,532 (95.9%) | 109 (4.1%) |
Health Insurance Coverage by Citizenship Status in Janesville

| Citizenship Status | With Coverage | Without Coverage |
| Native Born | 142 (95.3%) | 7 (4.7%) |
| Foreign Born, Citizen | 337 (97.1%) | 10 (2.9%) |
| Foreign Born, not a Citizen | 138 (100.0%) | 0 (0.0%) |
Health Insurance Coverage by Household Income in Janesville
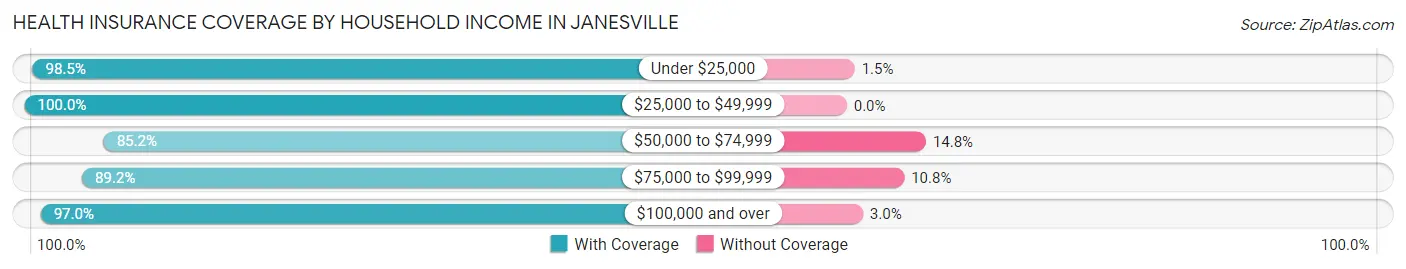
| Household Income | With Coverage | Without Coverage |
| Under $25,000 | 198 (98.5%) | 3 (1.5%) |
| $25,000 to $49,999 | 786 (100.0%) | 0 (0.0%) |
| $50,000 to $74,999 | 224 (85.2%) | 39 (14.8%) |
| $75,000 to $99,999 | 257 (89.2%) | 31 (10.8%) |
| $100,000 and over | 1,061 (97.0%) | 33 (3.0%) |
Public vs Private Health Insurance Coverage by Age in Janesville
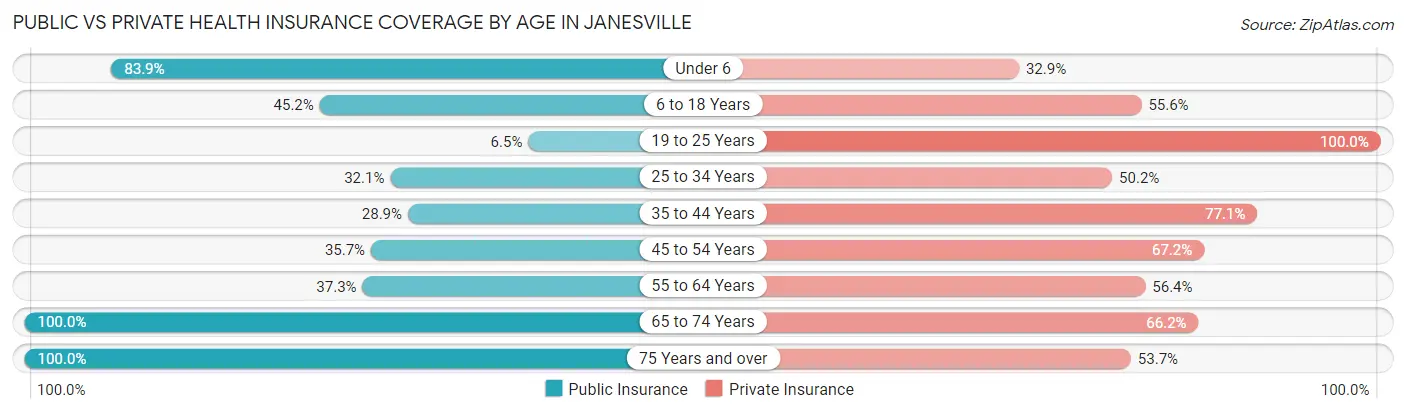
| Age Bracket | Public Insurance | Private Insurance |
| Under 6 | 125 (83.9%) | 49 (32.9%) |
| 6 to 18 Years | 157 (45.2%) | 193 (55.6%) |
| 19 to 25 Years | 9 (6.5%) | 138 (100.0%) |
| 25 to 34 Years | 89 (32.1%) | 139 (50.2%) |
| 35 to 44 Years | 58 (28.9%) | 155 (77.1%) |
| 45 to 54 Years | 170 (35.7%) | 320 (67.2%) |
| 55 to 64 Years | 182 (37.3%) | 275 (56.4%) |
| 65 to 74 Years | 278 (100.0%) | 184 (66.2%) |
| 75 Years and over | 287 (100.0%) | 154 (53.7%) |
| Total | 1,355 (51.3%) | 1,607 (60.9%) |
Disability Status by Sex by Age in Janesville
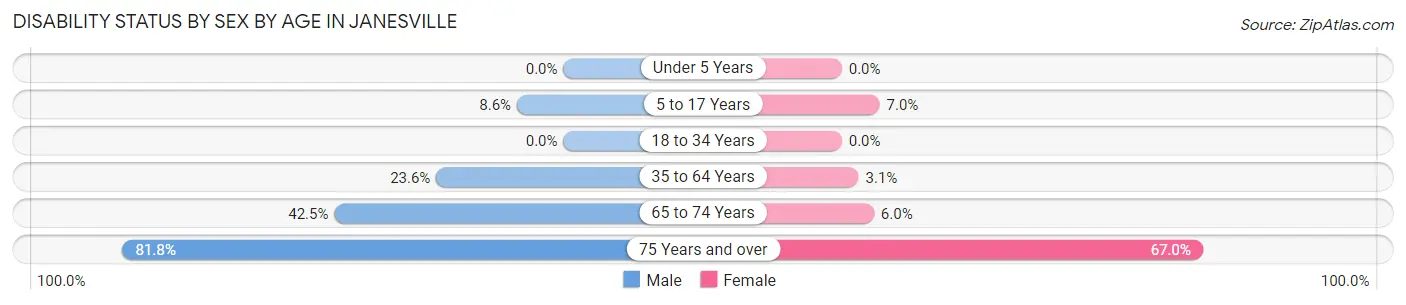
| Age Bracket | Male | Female |
| Under 5 Years | 0 (0.0%) | 0 (0.0%) |
| 5 to 17 Years | 15 (8.6%) | 8 (7.0%) |
| 18 to 34 Years | 0 (0.0%) | 0 (0.0%) |
| 35 to 64 Years | 139 (23.6%) | 18 (3.1%) |
| 65 to 74 Years | 54 (42.5%) | 9 (6.0%) |
| 75 Years and over | 153 (81.8%) | 67 (67.0%) |
Disability Class by Sex by Age in Janesville
Disability Class: Hearing Difficulty
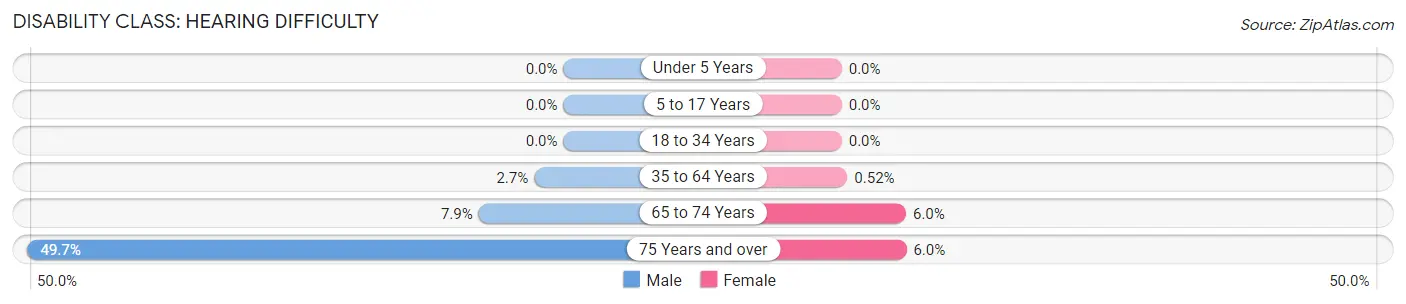
| Age Bracket | Male | Female |
| Under 5 Years | 0 (0.0%) | 0 (0.0%) |
| 5 to 17 Years | 0 (0.0%) | 0 (0.0%) |
| 18 to 34 Years | 0 (0.0%) | 0 (0.0%) |
| 35 to 64 Years | 16 (2.7%) | 3 (0.5%) |
| 65 to 74 Years | 10 (7.9%) | 9 (6.0%) |
| 75 Years and over | 93 (49.7%) | 6 (6.0%) |
Disability Class: Vision Difficulty
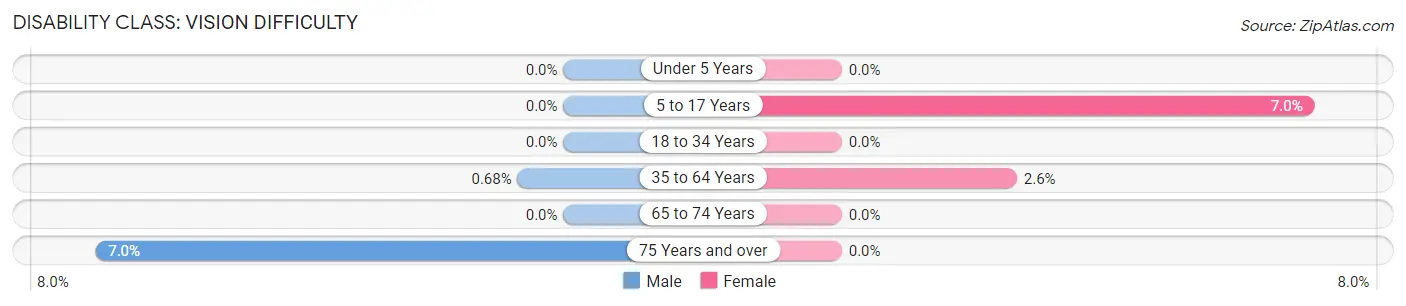
| Age Bracket | Male | Female |
| Under 5 Years | 0 (0.0%) | 0 (0.0%) |
| 5 to 17 Years | 0 (0.0%) | 8 (7.0%) |
| 18 to 34 Years | 0 (0.0%) | 0 (0.0%) |
| 35 to 64 Years | 4 (0.7%) | 15 (2.6%) |
| 65 to 74 Years | 0 (0.0%) | 0 (0.0%) |
| 75 Years and over | 13 (7.0%) | 0 (0.0%) |
Disability Class: Cognitive Difficulty
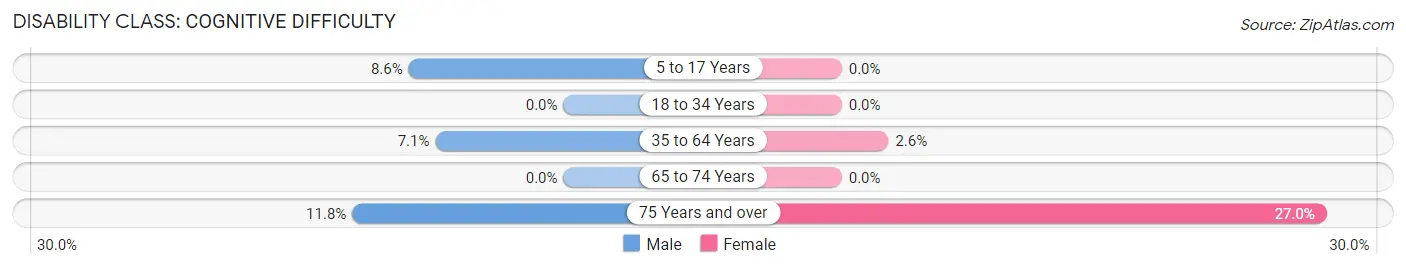
| Age Bracket | Male | Female |
| 5 to 17 Years | 15 (8.6%) | 0 (0.0%) |
| 18 to 34 Years | 0 (0.0%) | 0 (0.0%) |
| 35 to 64 Years | 42 (7.1%) | 15 (2.6%) |
| 65 to 74 Years | 0 (0.0%) | 0 (0.0%) |
| 75 Years and over | 22 (11.8%) | 27 (27.0%) |
Disability Class: Ambulatory Difficulty
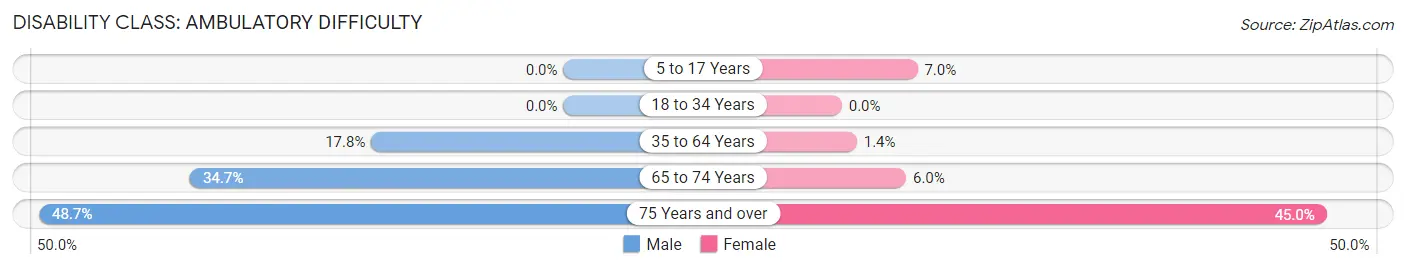
| Age Bracket | Male | Female |
| 5 to 17 Years | 0 (0.0%) | 8 (7.0%) |
| 18 to 34 Years | 0 (0.0%) | 0 (0.0%) |
| 35 to 64 Years | 105 (17.8%) | 8 (1.4%) |
| 65 to 74 Years | 44 (34.6%) | 9 (6.0%) |
| 75 Years and over | 91 (48.7%) | 45 (45.0%) |
Disability Class: Self-Care Difficulty
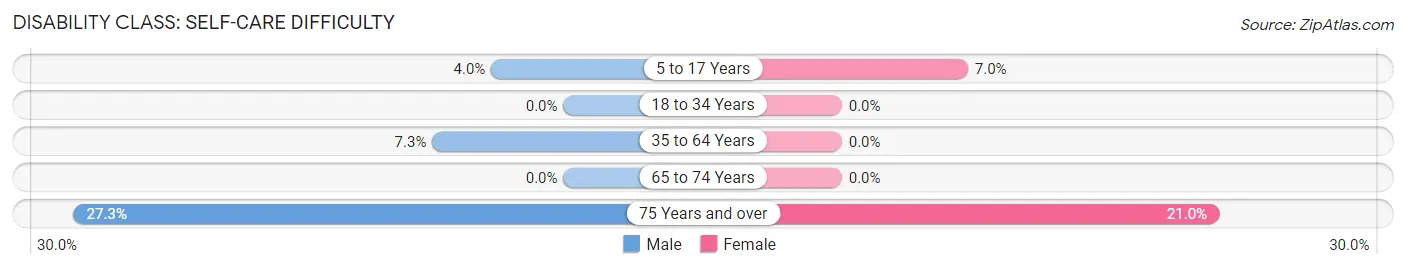
| Age Bracket | Male | Female |
| 5 to 17 Years | 7 (4.0%) | 8 (7.0%) |
| 18 to 34 Years | 0 (0.0%) | 0 (0.0%) |
| 35 to 64 Years | 43 (7.3%) | 0 (0.0%) |
| 65 to 74 Years | 0 (0.0%) | 0 (0.0%) |
| 75 Years and over | 51 (27.3%) | 21 (21.0%) |
Technology Access in Janesville
Computing Device Access in Janesville
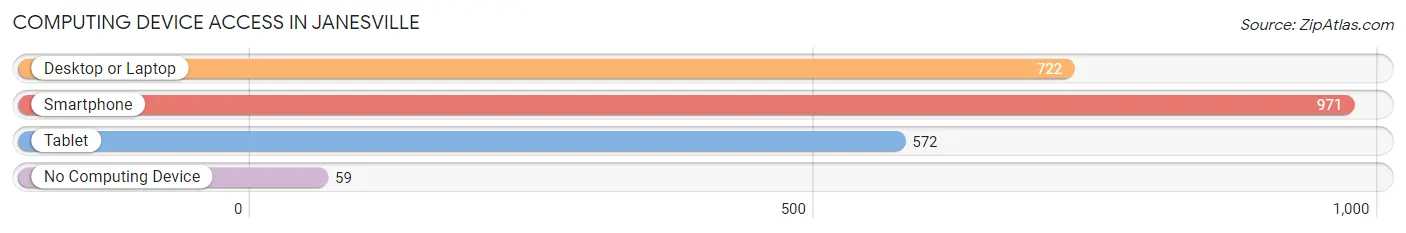
| Device Type | # Households | % Households |
| Desktop or Laptop | 722 | 68.6% |
| Smartphone | 971 | 92.2% |
| Tablet | 572 | 54.3% |
| No Computing Device | 59 | 5.6% |
| Total | 1,053 | 100.0% |
Internet Access in Janesville
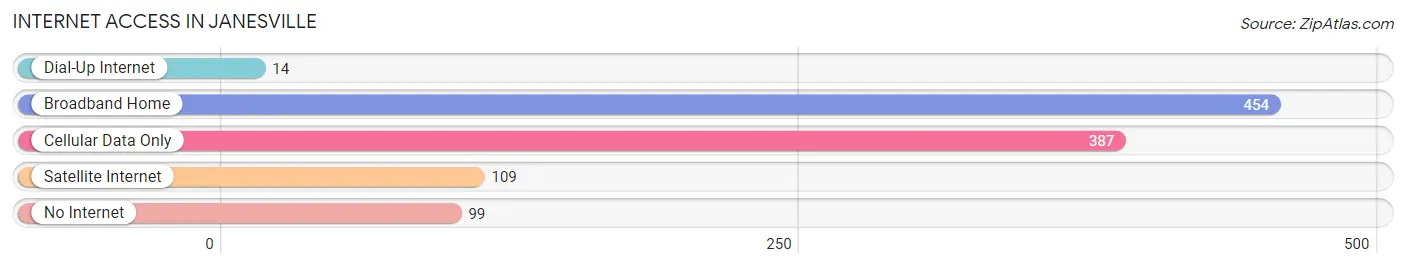
| Internet Type | # Households | % Households |
| Dial-Up Internet | 14 | 1.3% |
| Broadband Home | 454 | 43.1% |
| Cellular Data Only | 387 | 36.7% |
| Satellite Internet | 109 | 10.3% |
| No Internet | 99 | 9.4% |
| Total | 1,053 | 100.0% |
Janesville Summary
Janesville is a small town located in the foothills of the Sierra Nevada Mountains in California. It is situated in the northern part of the state, about 30 miles east of Sacramento. The town has a population of about 1,500 people and is the county seat of Yuba County.
History
Janesville was founded in 1852 by John Janes, a settler from Missouri. He named the town after himself and it quickly became a popular destination for miners and settlers. The town was incorporated in 1856 and soon became a hub for the local mining industry. In the late 1800s, Janesville was a bustling town with a population of over 1,000 people. It had several stores, a hotel, a post office, and a school.
In the early 1900s, Janesville began to decline as the mining industry moved away from the area. The population dropped to just over 500 people by the 1950s. In the 1970s, the town experienced a resurgence as people began to move back to the area. Today, Janesville is a small but vibrant community with a population of about 1,500 people.
Geography
Janesville is located in the northern part of California, about 30 miles east of Sacramento. It is situated in the foothills of the Sierra Nevada Mountains and is surrounded by rolling hills and lush forests. The town is located at an elevation of about 1,500 feet and has a mild climate with warm summers and cool winters.
Economy
Janesville’s economy is largely based on agriculture and tourism. The town is home to several farms and ranches that produce a variety of crops, including apples, pears, and walnuts. The town also has several wineries and breweries that attract tourists from all over the state. In addition, Janesville is home to several small businesses, including restaurants, shops, and galleries.
Demographics
As of the 2010 census, Janesville had a population of 1,500 people. The racial makeup of the town was 87.3% White, 0.7% African American, 0.7% Native American, 0.7% Asian, 0.3% Pacific Islander, and 10.0% from other races. The median household income was $45,000 and the median family income was $50,000. The per capita income was $20,000.
Conclusion
Janesville is a small town located in the foothills of the Sierra Nevada Mountains in California. It has a population of about 1,500 people and is the county seat of Yuba County. The town’s economy is largely based on agriculture and tourism, and it is home to several farms, wineries, and breweries. Janesville has a diverse population and a median household income of $45,000.
Common Questions
What is Per Capita Income in Janesville?
Per Capita income in Janesville is $36,312.
What is the Median Family Income in Janesville?
Median Family Income in Janesville is $74,091.
What is the Median Household income in Janesville?
Median Household Income in Janesville is $64,180.
What is Income or Wage Gap in Janesville?
Income or Wage Gap in Janesville is 23.2%.
Women in Janesville earn 76.8 cents for every dollar earned by a man.
What is Inequality or Gini Index in Janesville?
Inequality or Gini Index in Janesville is 0.41.
What is the Total Population of Janesville?
Total Population of Janesville is 2,641.
What is the Total Male Population of Janesville?
Total Male Population of Janesville is 1,338.
What is the Total Female Population of Janesville?
Total Female Population of Janesville is 1,303.
What is the Ratio of Males per 100 Females in Janesville?
There are 102.69 Males per 100 Females in Janesville.
What is the Ratio of Females per 100 Males in Janesville?
There are 97.38 Females per 100 Males in Janesville.
What is the Median Population Age in Janesville?
Median Population Age in Janesville is 50.7 Years.
What is the Average Family Size in Janesville
Average Family Size in Janesville is 2.9 People.
What is the Average Household Size in Janesville
Average Household Size in Janesville is 2.5 People.
How Large is the Labor Force in Janesville?
There are 1,062 People in the Labor Forcein in Janesville.
What is the Percentage of People in the Labor Force in Janesville?
47.3% of People are in the Labor Force in Janesville.
What is the Unemployment Rate in Janesville?
Unemployment Rate in Janesville is 5.9%.