Zip Codes with the Highest Percentage of Population Employed in Security & Protection in Desert Hot Springs, CA
RELATED REPORTS & OPTIONS
Security & Protection
Desert Hot Springs
Compare Zip Codes
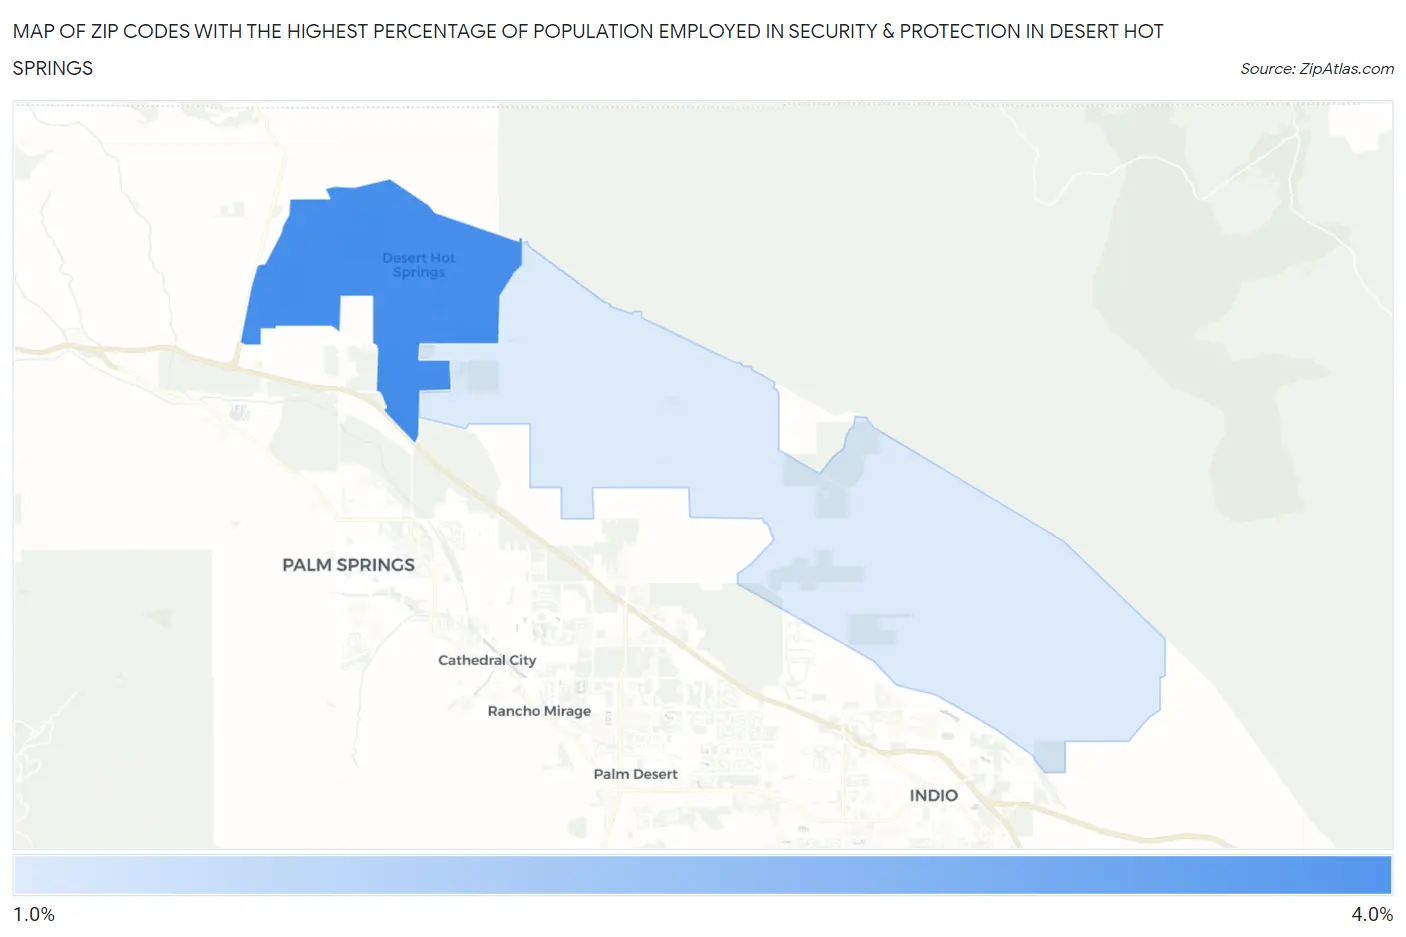
Map of Zip Codes with the Highest Percentage of Population Employed in Security & Protection in Desert Hot Springs
1.4%
3.9%
Zip Codes with the Highest Percentage of Population Employed in Security & Protection in Desert Hot Springs, CA
| Zip Code | % Employed | vs State | vs National | |
| 1. | 92240 | 3.9% | 2.1%(+1.84)#220 | 2.1%(+1.77)#4,653 |
| 2. | 92241 | 1.4% | 2.1%(-0.691)#1,004 | 2.1%(-0.758)#17,026 |
1
Common Questions
What are the Top Zip Codes with the Highest Percentage of Population Employed in Security & Protection in Desert Hot Springs, CA?
Top Zip Codes with the Highest Percentage of Population Employed in Security & Protection in Desert Hot Springs, CA are:
What zip code has the Highest Percentage of Population Employed in Security & Protection in Desert Hot Springs, CA?
92240 has the Highest Percentage of Population Employed in Security & Protection in Desert Hot Springs, CA with 3.9%.
What is the Percentage of Population Employed in Security & Protection in Desert Hot Springs, CA?
Percentage of Population Employed in Security & Protection in Desert Hot Springs is 4.3%.
What is the Percentage of Population Employed in Security & Protection in California?
Percentage of Population Employed in Security & Protection in California is 2.1%.
What is the Percentage of Population Employed in Security & Protection in the United States?
Percentage of Population Employed in Security & Protection in the United States is 2.1%.