Cities with the Highest Percentage of Population Employed in Security & Protection in South Dakota
RELATED REPORTS & OPTIONS
Security & Protection
South Dakota
Compare Cities
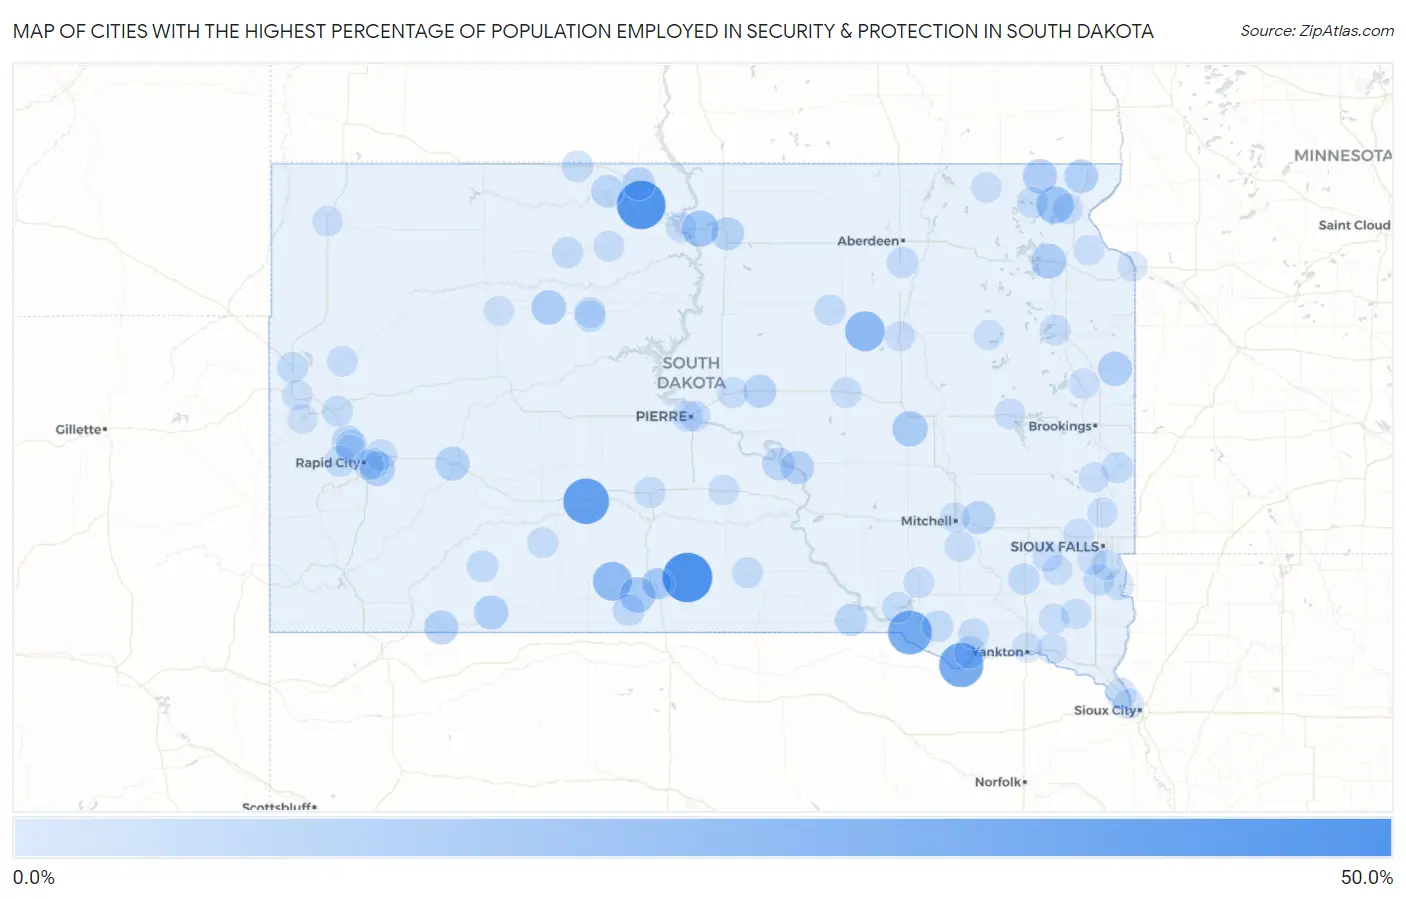
Map of Cities with the Highest Percentage of Population Employed in Security & Protection in South Dakota
0.0%
50.0%
Cities with the Highest Percentage of Population Employed in Security & Protection in South Dakota
| City | % Employed | vs State | vs National | |
| 1. | Okreek | 44.0% | 1.8%(+42.2)#1 | 2.1%(+41.9)#46 |
| 2. | Little Eagle | 41.7% | 1.8%(+39.9)#2 | 2.1%(+39.5)#57 |
| 3. | Belvidere | 35.3% | 1.8%(+33.5)#3 | 2.1%(+33.1)#83 |
| 4. | Running Water | 32.0% | 1.8%(+30.2)#4 | 2.1%(+29.9)#102 |
| 5. | Marty | 31.0% | 1.8%(+29.3)#5 | 2.1%(+28.9)#110 |
| 6. | Lyons | 28.6% | 1.8%(+26.8)#6 | 2.1%(+26.4)#130 |
| 7. | Rockham | 22.2% | 1.8%(+20.5)#7 | 2.1%(+20.1)#233 |
| 8. | Parmelee | 20.6% | 1.8%(+18.8)#8 | 2.1%(+18.4)#264 |
| 9. | Long Hollow | 16.7% | 1.8%(+14.9)#9 | 2.1%(+14.5)#394 |
| 10. | Glenham | 14.9% | 1.8%(+13.2)#10 | 2.1%(+12.8)#492 |
| 11. | Rosebud | 12.8% | 1.8%(+11.0)#11 | 2.1%(+10.6)#683 |
| 12. | Virgil | 12.5% | 1.8%(+10.7)#12 | 2.1%(+10.4)#716 |
| 13. | Ortley | 11.8% | 1.8%(+10.0)#13 | 2.1%(+9.62)#801 |
| 14. | Dupree | 11.0% | 1.8%(+9.24)#14 | 2.1%(+8.85)#924 |
| 15. | Green Valley | 10.7% | 1.8%(+8.90)#15 | 2.1%(+8.51)#979 |
| 16. | Veblen | 10.5% | 1.8%(+8.77)#16 | 2.1%(+8.38)#1,006 |
| 17. | Brandt | 10.0% | 1.8%(+8.24)#17 | 2.1%(+7.85)#1,096 |
| 18. | Batesland | 10.0% | 1.8%(+8.24)#18 | 2.1%(+7.85)#1,097 |
| 19. | Pine Ridge | 9.8% | 1.8%(+8.06)#19 | 2.1%(+7.67)#1,131 |
| 20. | Wasta | 9.7% | 1.8%(+7.92)#20 | 2.1%(+7.53)#1,160 |
| 21. | New Effington | 9.4% | 1.8%(+7.65)#21 | 2.1%(+7.26)#1,221 |
| 22. | Cherry Creek | 8.9% | 1.8%(+7.13)#22 | 2.1%(+6.74)#1,376 |
| 23. | Fort Thompson | 8.3% | 1.8%(+6.55)#23 | 2.1%(+6.16)#1,555 |
| 24. | Selby | 7.9% | 1.8%(+6.13)#24 | 2.1%(+5.74)#1,690 |
| 25. | Harrold | 7.5% | 1.8%(+5.79)#25 | 2.1%(+5.40)#1,830 |
| 26. | Fulton | 7.5% | 1.8%(+5.74)#26 | 2.1%(+5.35)#1,853 |
| 27. | Mclaughlin | 7.3% | 1.8%(+5.56)#27 | 2.1%(+5.17)#1,940 |
| 28. | Bullhead | 7.0% | 1.8%(+5.22)#28 | 2.1%(+4.83)#2,090 |
| 29. | Lower Brule | 6.9% | 1.8%(+5.15)#29 | 2.1%(+4.76)#2,123 |
| 30. | Bonesteel | 6.7% | 1.8%(+4.98)#30 | 2.1%(+4.59)#2,216 |
| 31. | Springfield | 6.6% | 1.8%(+4.87)#31 | 2.1%(+4.48)#2,290 |
| 32. | St Francis | 5.5% | 1.8%(+3.77)#32 | 2.1%(+3.38)#3,130 |
| 33. | Antelope | 5.4% | 1.8%(+3.60)#33 | 2.1%(+3.21)#3,301 |
| 34. | Piedmont | 5.2% | 1.8%(+3.43)#34 | 2.1%(+3.04)#3,491 |
| 35. | Kyle | 4.9% | 1.8%(+3.18)#35 | 2.1%(+2.79)#3,766 |
| 36. | Dante | 4.6% | 1.8%(+2.86)#36 | 2.1%(+2.47)#4,162 |
| 37. | Isabel | 4.3% | 1.8%(+2.59)#37 | 2.1%(+2.20)#4,544 |
| 38. | Mcintosh | 4.3% | 1.8%(+2.59)#38 | 2.1%(+2.20)#4,547 |
| 39. | Freeman | 4.3% | 1.8%(+2.53)#39 | 2.1%(+2.14)#4,629 |
| 40. | Flandreau | 4.3% | 1.8%(+2.49)#40 | 2.1%(+2.10)#4,681 |
| 41. | Box Elder | 4.2% | 1.8%(+2.47)#41 | 2.1%(+2.08)#4,713 |
| 42. | Eagle Butte | 4.2% | 1.8%(+2.43)#42 | 2.1%(+2.04)#4,775 |
| 43. | Clear Lake | 4.2% | 1.8%(+2.41)#43 | 2.1%(+2.02)#4,806 |
| 44. | Murdo | 4.1% | 1.8%(+2.34)#44 | 2.1%(+1.95)#4,933 |
| 45. | Belle Fourche | 4.0% | 1.8%(+2.21)#45 | 2.1%(+1.82)#5,174 |
| 46. | Sturgis | 3.9% | 1.8%(+2.18)#46 | 2.1%(+1.79)#5,222 |
| 47. | Worthing | 3.9% | 1.8%(+2.17)#47 | 2.1%(+1.78)#5,232 |
| 48. | Summerset | 3.9% | 1.8%(+2.09)#48 | 2.1%(+1.70)#5,392 |
| 49. | Rapid Valley | 3.8% | 1.8%(+2.08)#49 | 2.1%(+1.69)#5,429 |
| 50. | Johnson Siding | 3.7% | 1.8%(+1.99)#50 | 2.1%(+1.60)#5,601 |
| 51. | Warner | 3.7% | 1.8%(+1.99)#51 | 2.1%(+1.60)#5,616 |
| 52. | Faulkton | 3.7% | 1.8%(+1.96)#52 | 2.1%(+1.57)#5,673 |
| 53. | Winner | 3.7% | 1.8%(+1.94)#53 | 2.1%(+1.55)#5,711 |
| 54. | Fort Pierre | 3.7% | 1.8%(+1.94)#54 | 2.1%(+1.55)#5,722 |
| 55. | North Eagle Butte | 3.7% | 1.8%(+1.92)#55 | 2.1%(+1.53)#5,768 |
| 56. | Lake Andes | 3.7% | 1.8%(+1.91)#56 | 2.1%(+1.52)#5,782 |
| 57. | Timber Lake | 3.5% | 1.8%(+1.73)#57 | 2.1%(+1.34)#6,158 |
| 58. | Tyndall | 3.4% | 1.8%(+1.69)#58 | 2.1%(+1.30)#6,246 |
| 59. | Blunt | 3.4% | 1.8%(+1.66)#59 | 2.1%(+1.27)#6,330 |
| 60. | Sisseton | 3.4% | 1.8%(+1.61)#60 | 2.1%(+1.22)#6,447 |
| 61. | Armour | 3.3% | 1.8%(+1.58)#61 | 2.1%(+1.18)#6,546 |
| 62. | Miller | 3.1% | 1.8%(+1.33)#62 | 2.1%(+0.943)#7,188 |
| 63. | Ethan | 3.0% | 1.8%(+1.29)#63 | 2.1%(+0.900)#7,320 |
| 64. | Wanblee | 3.0% | 1.8%(+1.24)#64 | 2.1%(+0.852)#7,490 |
| 65. | Jefferson | 2.9% | 1.8%(+1.18)#65 | 2.1%(+0.793)#7,685 |
| 66. | Newell | 2.9% | 1.8%(+1.17)#66 | 2.1%(+0.782)#7,718 |
| 67. | De Smet | 2.9% | 1.8%(+1.17)#67 | 2.1%(+0.776)#7,741 |
| 68. | Watertown | 2.9% | 1.8%(+1.15)#68 | 2.1%(+0.762)#7,795 |
| 69. | Wakpala | 2.9% | 1.8%(+1.10)#69 | 2.1%(+0.709)#7,959 |
| 70. | Redfield | 2.8% | 1.8%(+1.08)#70 | 2.1%(+0.693)#8,013 |
| 71. | Mission | 2.8% | 1.8%(+1.08)#71 | 2.1%(+0.692)#8,014 |
| 72. | Wilmot | 2.8% | 1.8%(+1.00)#72 | 2.1%(+0.614)#8,271 |
| 73. | Mobridge | 2.7% | 1.8%(+0.979)#73 | 2.1%(+0.589)#8,355 |
| 74. | Monroe | 2.7% | 1.8%(+0.969)#74 | 2.1%(+0.579)#8,385 |
| 75. | Colman | 2.7% | 1.8%(+0.945)#75 | 2.1%(+0.554)#8,480 |
| 76. | Hartford | 2.7% | 1.8%(+0.941)#76 | 2.1%(+0.550)#8,504 |
| 77. | West Brule | 2.6% | 1.8%(+0.874)#77 | 2.1%(+0.483)#8,717 |
| 78. | Pierre | 2.6% | 1.8%(+0.856)#78 | 2.1%(+0.465)#8,778 |
| 79. | Presho | 2.6% | 1.8%(+0.795)#79 | 2.1%(+0.405)#9,009 |
| 80. | Estelline | 2.5% | 1.8%(+0.758)#80 | 2.1%(+0.367)#9,152 |
| 81. | Buffalo | 2.5% | 1.8%(+0.693)#81 | 2.1%(+0.303)#9,393 |
| 82. | Britton | 2.4% | 1.8%(+0.673)#82 | 2.1%(+0.282)#9,466 |
| 83. | Rapid City | 2.4% | 1.8%(+0.651)#83 | 2.1%(+0.260)#9,554 |
| 84. | Gayville | 2.3% | 1.8%(+0.577)#84 | 2.1%(+0.186)#9,859 |
| 85. | Centerville | 2.3% | 1.8%(+0.574)#85 | 2.1%(+0.183)#9,872 |
| 86. | Baltic | 2.3% | 1.8%(+0.571)#86 | 2.1%(+0.180)#9,881 |
| 87. | North Sioux City | 2.3% | 1.8%(+0.547)#87 | 2.1%(+0.156)#9,982 |
| 88. | Canton | 2.3% | 1.8%(+0.508)#88 | 2.1%(+0.117)#10,150 |
| 89. | Blackhawk | 2.3% | 1.8%(+0.498)#89 | 2.1%(+0.107)#10,181 |
| 90. | Harrisburg | 2.2% | 1.8%(+0.484)#90 | 2.1%(+0.094)#10,249 |
| 91. | Irene | 2.2% | 1.8%(+0.481)#91 | 2.1%(+0.090)#10,267 |
| 92. | Parker | 2.2% | 1.8%(+0.464)#92 | 2.1%(+0.074)#10,332 |
| 93. | Spearfish | 2.1% | 1.8%(+0.335)#93 | 2.1%(-0.056)#10,918 |
| 94. | Mitchell | 2.1% | 1.8%(+0.320)#94 | 2.1%(-0.071)#10,998 |
| 95. | Yankton | 2.1% | 1.8%(+0.302)#95 | 2.1%(-0.089)#11,098 |
| 96. | Tea | 2.1% | 1.8%(+0.297)#96 | 2.1%(-0.093)#11,119 |
| 97. | Big Stone City | 2.0% | 1.8%(+0.248)#97 | 2.1%(-0.143)#11,346 |
| 98. | Clark | 2.0% | 1.8%(+0.239)#98 | 2.1%(-0.152)#11,398 |
| 99. | Faith | 1.9% | 1.8%(+0.178)#99 | 2.1%(-0.213)#11,714 |
| 100. | Lead | 1.8% | 1.8%(+0.043)#100 | 2.1%(-0.348)#12,383 |
Common Questions
What are the Top 10 Cities with the Highest Percentage of Population Employed in Security & Protection in South Dakota?
Top 10 Cities with the Highest Percentage of Population Employed in Security & Protection in South Dakota are:
#1
44.0%
#2
41.7%
#3
35.3%
#4
32.0%
#5
31.0%
#6
22.2%
#7
20.6%
#8
16.7%
#9
14.9%
#10
12.8%
What city has the Highest Percentage of Population Employed in Security & Protection in South Dakota?
Okreek has the Highest Percentage of Population Employed in Security & Protection in South Dakota with 44.0%.
What is the Percentage of Population Employed in Security & Protection in the State of South Dakota?
Percentage of Population Employed in Security & Protection in South Dakota is 1.8%.
What is the Percentage of Population Employed in Security & Protection in the United States?
Percentage of Population Employed in Security & Protection in the United States is 2.1%.