Bonita, CA Map & Demographics
Bonita Map
Bonita Overview
$55,534
PER CAPITA INCOME
$146,750
AVG FAMILY INCOME
$115,118
AVG HOUSEHOLD INCOME
45.9%
WAGE / INCOME GAP [ % ]
54.1¢/ $1
WAGE / INCOME GAP [ $ ]
0.43
INEQUALITY / GINI INDEX
13,473
TOTAL POPULATION
6,759
MALE POPULATION
6,714
FEMALE POPULATION
100.67
MALES / 100 FEMALES
99.33
FEMALES / 100 MALES
45.2
MEDIAN AGE
3.4
AVG FAMILY SIZE
2.8
AVG HOUSEHOLD SIZE
7,059
LABOR FORCE [ PEOPLE ]
63.4%
PERCENT IN LABOR FORCE
7.6%
UNEMPLOYMENT RATE
Bonita Zip Codes
Income in Bonita
Income Overview in Bonita
Per Capita Income in Bonita is $55,534, while median incomes of families and households are $146,750 and $115,118 respectively.
| Characteristic | Number | Measure |
| Per Capita Income | 13,473 | $55,534 |
| Median Family Income | 3,283 | $146,750 |
| Mean Family Income | 3,283 | $159,254 |
| Median Household Income | 4,769 | $115,118 |
| Mean Household Income | 4,769 | $150,880 |
| Income Deficit | 3,283 | $0 |
| Wage / Income Gap (%) | 13,473 | 45.88% |
| Wage / Income Gap ($) | 13,473 | 54.12¢ per $1 |
| Gini / Inequality Index | 13,473 | 0.43 |
Earnings by Sex in Bonita
Average Earnings in Bonita are $51,418, $71,250 for men and $38,563 for women, a difference of 45.9%.
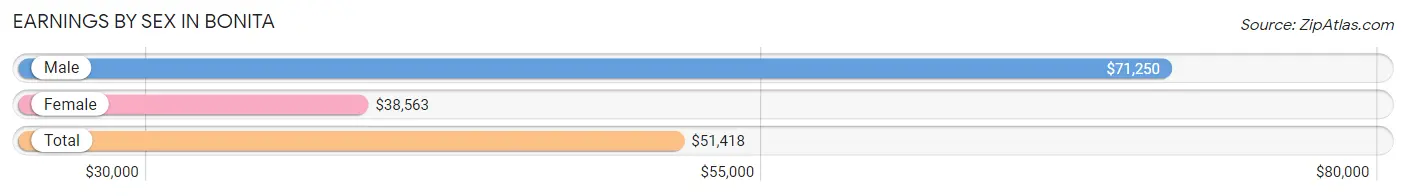
| Sex | Number | Average Earnings |
| Male | 3,840 (53.9%) | $71,250 |
| Female | 3,288 (46.1%) | $38,563 |
| Total | 7,128 (100.0%) | $51,418 |
Earnings by Sex by Income Bracket in Bonita
The most common earnings brackets in Bonita are $100,000+ for men (1,255 | 32.7%) and $100,000+ for women (552 | 16.8%).
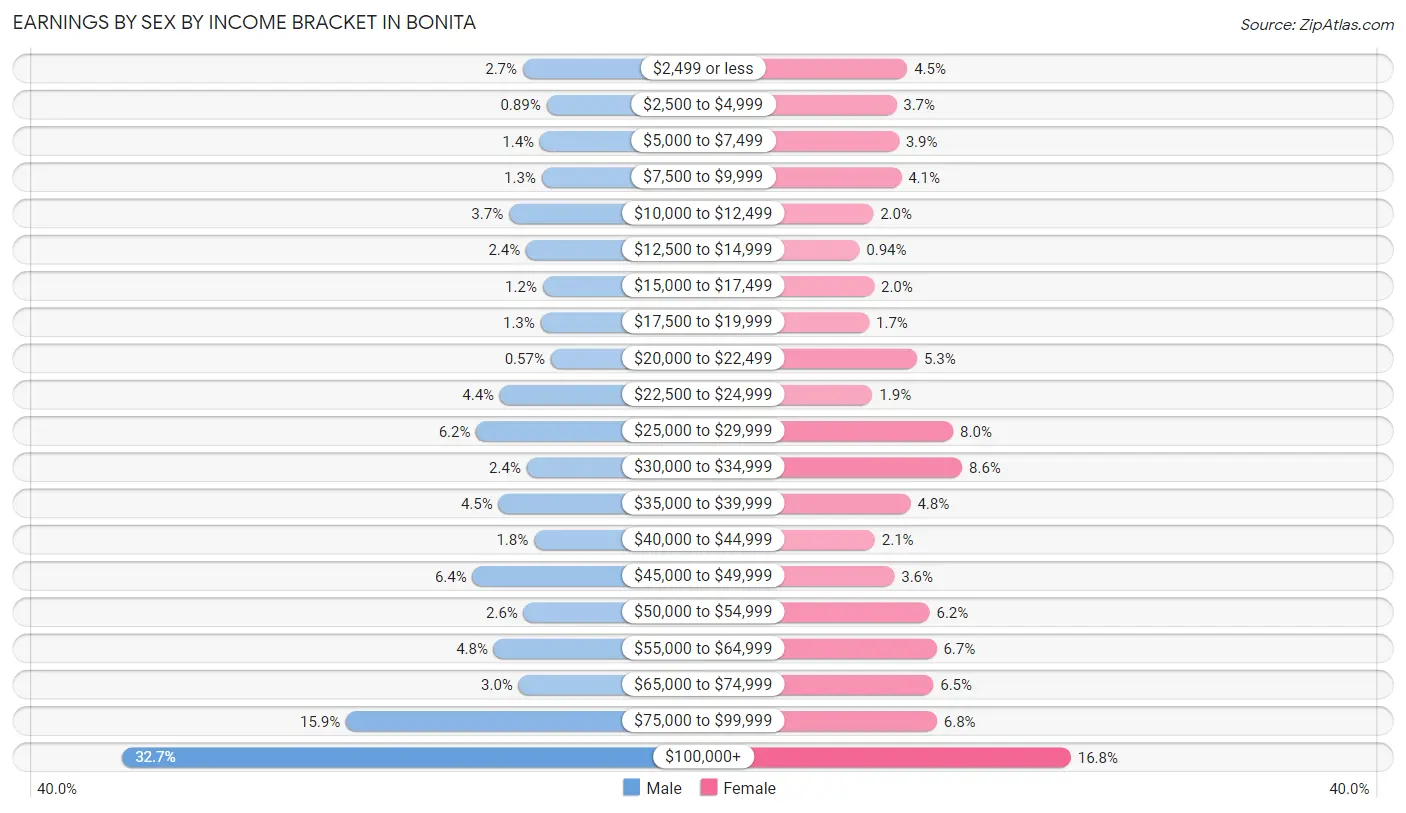
| Income | Male | Female |
| $2,499 or less | 102 (2.7%) | 149 (4.5%) |
| $2,500 to $4,999 | 34 (0.9%) | 122 (3.7%) |
| $5,000 to $7,499 | 53 (1.4%) | 128 (3.9%) |
| $7,500 to $9,999 | 48 (1.3%) | 134 (4.1%) |
| $10,000 to $12,499 | 142 (3.7%) | 65 (2.0%) |
| $12,500 to $14,999 | 93 (2.4%) | 31 (0.9%) |
| $15,000 to $17,499 | 45 (1.2%) | 67 (2.0%) |
| $17,500 to $19,999 | 51 (1.3%) | 55 (1.7%) |
| $20,000 to $22,499 | 22 (0.6%) | 173 (5.3%) |
| $22,500 to $24,999 | 168 (4.4%) | 63 (1.9%) |
| $25,000 to $29,999 | 236 (6.1%) | 262 (8.0%) |
| $30,000 to $34,999 | 91 (2.4%) | 284 (8.6%) |
| $35,000 to $39,999 | 172 (4.5%) | 157 (4.8%) |
| $40,000 to $44,999 | 70 (1.8%) | 69 (2.1%) |
| $45,000 to $49,999 | 247 (6.4%) | 117 (3.6%) |
| $50,000 to $54,999 | 100 (2.6%) | 204 (6.2%) |
| $55,000 to $64,999 | 186 (4.8%) | 221 (6.7%) |
| $65,000 to $74,999 | 114 (3.0%) | 213 (6.5%) |
| $75,000 to $99,999 | 611 (15.9%) | 222 (6.8%) |
| $100,000+ | 1,255 (32.7%) | 552 (16.8%) |
| Total | 3,840 (100.0%) | 3,288 (100.0%) |
Earnings by Sex by Educational Attainment in Bonita
Average earnings in Bonita are $77,875 for men and $47,169 for women, a difference of 39.4%. Men with an educational attainment of graduate degree enjoy the highest average annual earnings of $106,573, while those with college or associate's degree education earn the least with $62,857. Women with an educational attainment of graduate degree earn the most with the average annual earnings of $72,454, while those with high school diploma education have the smallest earnings of $34,665.
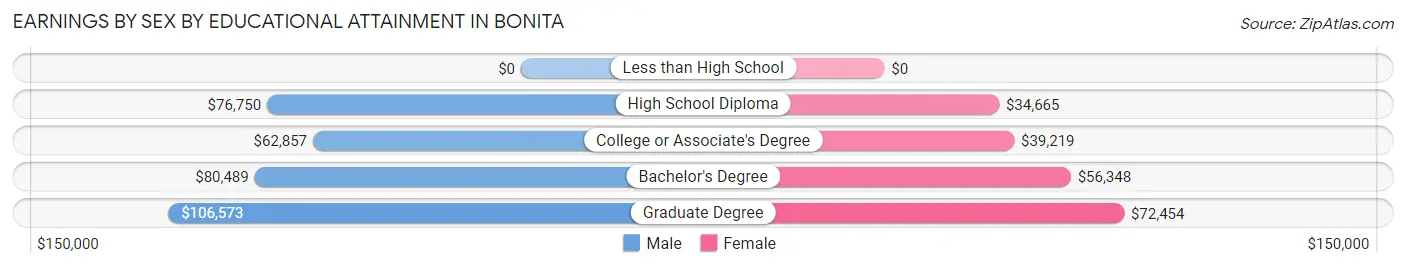
| Educational Attainment | Male Income | Female Income |
| Less than High School | - | - |
| High School Diploma | $76,750 | $34,665 |
| College or Associate's Degree | $62,857 | $39,219 |
| Bachelor's Degree | $80,489 | $56,348 |
| Graduate Degree | $106,573 | $72,454 |
| Total | $77,875 | $47,169 |
Family Income in Bonita
Family Income Brackets in Bonita
According to the Bonita family income data, there are 890 families falling into the $200,000+ income range, which is the most common income bracket and makes up 27.1% of all families. Conversely, the $25,000 to $34,999 income bracket is the least frequent group with only 30 families (0.9%) belonging to this category.
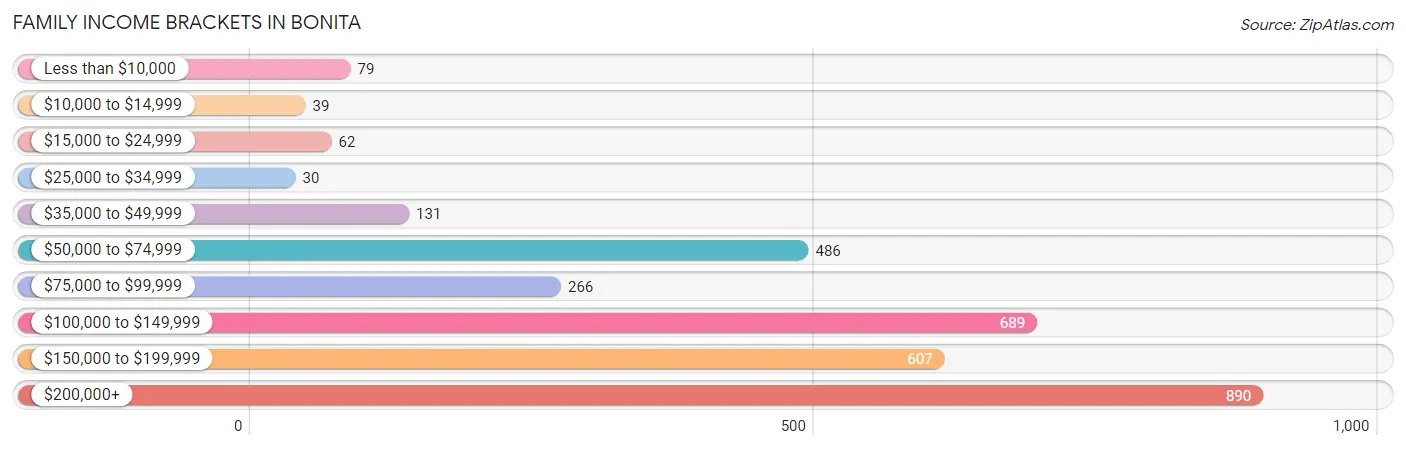
| Income Bracket | # Families | % Families |
| Less than $10,000 | 79 | 2.4% |
| $10,000 to $14,999 | 39 | 1.2% |
| $15,000 to $24,999 | 62 | 1.9% |
| $25,000 to $34,999 | 30 | 0.9% |
| $35,000 to $49,999 | 131 | 4.0% |
| $50,000 to $74,999 | 486 | 14.8% |
| $75,000 to $99,999 | 266 | 8.1% |
| $100,000 to $149,999 | 689 | 21.0% |
| $150,000 to $199,999 | 607 | 18.5% |
| $200,000+ | 890 | 27.1% |
Family Income by Famaliy Size in Bonita
7+ person families (149 | 4.5%) account for the highest median family income in Bonita with $227,721 per family, while 2-person families (1,422 | 43.3%) have the highest median income of $61,400 per family member.
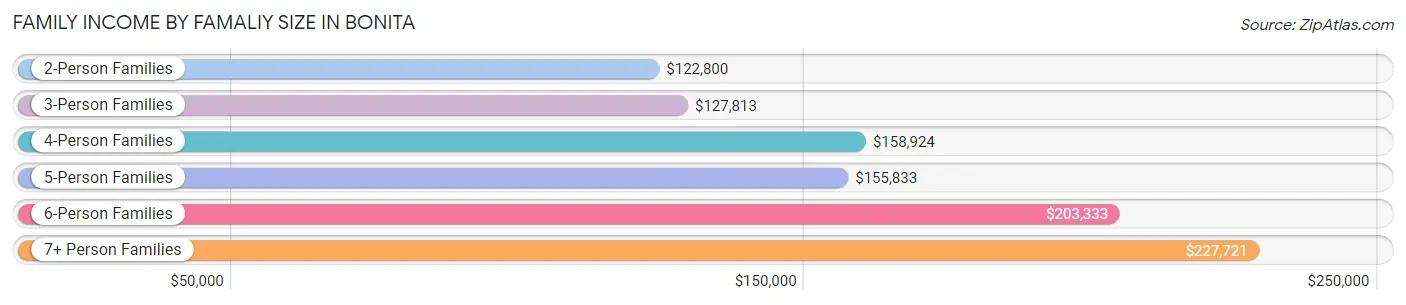
| Income Bracket | # Families | Median Income |
| 2-Person Families | 1,422 (43.3%) | $122,800 |
| 3-Person Families | 835 (25.4%) | $127,813 |
| 4-Person Families | 575 (17.5%) | $158,924 |
| 5-Person Families | 198 (6.0%) | $155,833 |
| 6-Person Families | 104 (3.2%) | $203,333 |
| 7+ Person Families | 149 (4.5%) | $227,721 |
| Total | 3,283 (100.0%) | $146,750 |
Family Income by Number of Earners in Bonita
The median family income in Bonita is $146,750, with families comprising 2 earners (1,495) having the highest median family income of $188,083, while families with no earners (459) have the lowest median family income of $63,438, accounting for 45.5% and 14.0% of families, respectively.
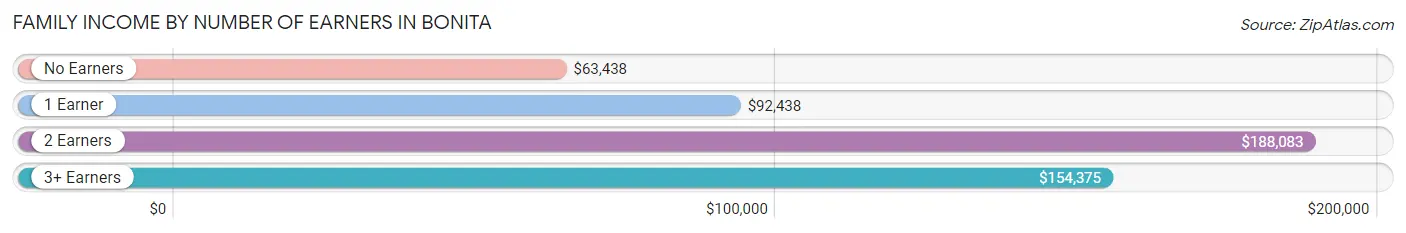
| Number of Earners | # Families | Median Income |
| No Earners | 459 (14.0%) | $63,438 |
| 1 Earner | 831 (25.3%) | $92,438 |
| 2 Earners | 1,495 (45.5%) | $188,083 |
| 3+ Earners | 498 (15.2%) | $154,375 |
| Total | 3,283 (100.0%) | $146,750 |
Household Income in Bonita
Household Income Brackets in Bonita
With 1,154 households falling in the category, the $100,000 to $149,999 income range is the most frequent in Bonita, accounting for 24.2% of all households. In contrast, only 24 households (0.5%) fall into the $10,000 to $14,999 income bracket, making it the least populous group.
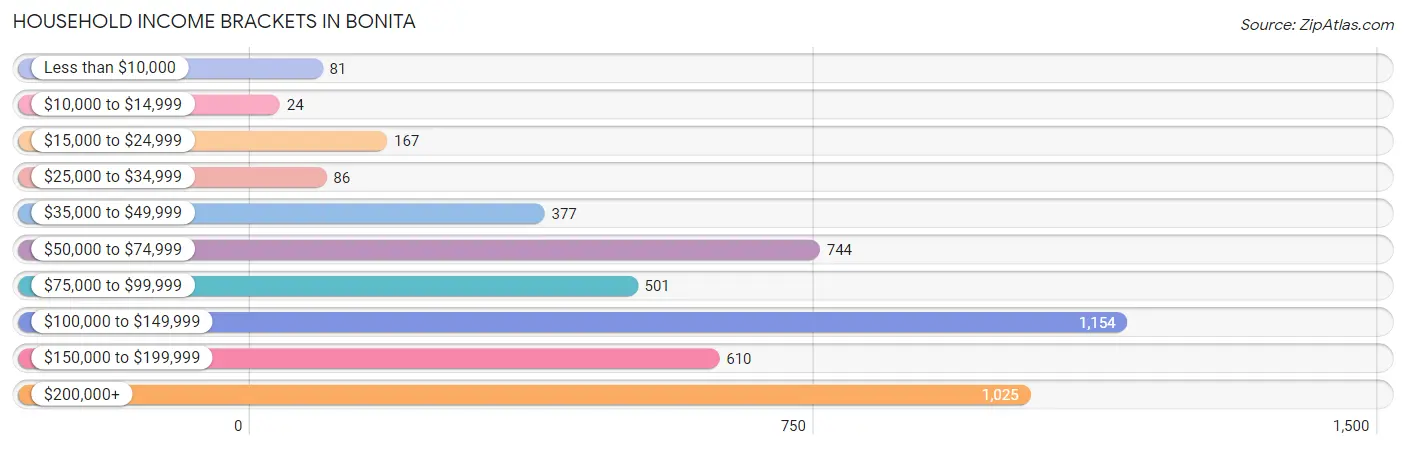
| Income Bracket | # Households | % Households |
| Less than $10,000 | 81 | 1.7% |
| $10,000 to $14,999 | 24 | 0.5% |
| $15,000 to $24,999 | 167 | 3.5% |
| $25,000 to $34,999 | 86 | 1.8% |
| $35,000 to $49,999 | 377 | 7.9% |
| $50,000 to $74,999 | 744 | 15.6% |
| $75,000 to $99,999 | 501 | 10.5% |
| $100,000 to $149,999 | 1,154 | 24.2% |
| $150,000 to $199,999 | 610 | 12.8% |
| $200,000+ | 1,025 | 21.5% |
Household Income by Householder Age in Bonita
The median household income in Bonita is $115,118, with the highest median household income of $124,727 found in the 45 to 64 years age bracket for the primary householder. A total of 1,974 households (41.4%) fall into this category. Meanwhile, the 15 to 24 years age bracket for the primary householder has the lowest median household income of $0, with 41 households (0.9%) in this group.
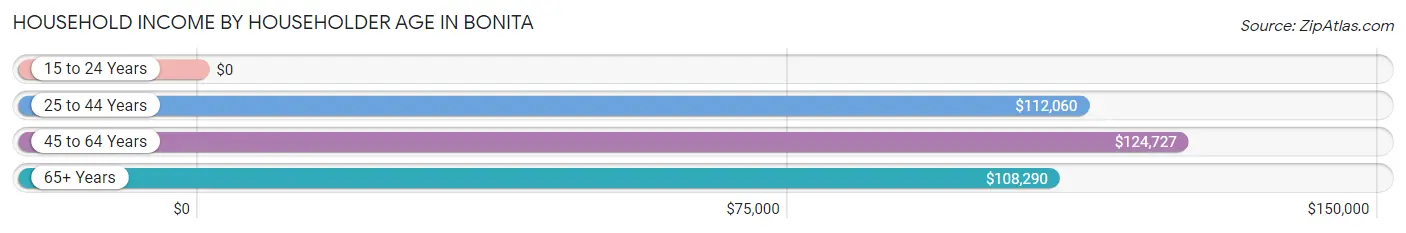
| Income Bracket | # Households | Median Income |
| 15 to 24 Years | 41 (0.9%) | $0 |
| 25 to 44 Years | 901 (18.9%) | $112,060 |
| 45 to 64 Years | 1,974 (41.4%) | $124,727 |
| 65+ Years | 1,853 (38.9%) | $108,290 |
| Total | 4,769 (100.0%) | $115,118 |
Poverty in Bonita
Income Below Poverty by Sex and Age in Bonita
With 5.1% poverty level for males and 6.6% for females among the residents of Bonita, 75 year old and over males and 16 and 17 year old females are the most vulnerable to poverty, with 50 males (16.4%) and 33 females (39.3%) in their respective age groups living below the poverty level.
| Age Bracket | Male | Female |
| Under 5 Years | 0 (0.0%) | 0 (0.0%) |
| 5 Years | 0 (0.0%) | 13 (6.5%) |
| 6 to 11 Years | 42 (8.6%) | 18 (6.3%) |
| 12 to 14 Years | 34 (13.8%) | 0 (0.0%) |
| 15 Years | 0 (0.0%) | 0 (0.0%) |
| 16 and 17 Years | 6 (7.1%) | 33 (39.3%) |
| 18 to 24 Years | 24 (9.0%) | 84 (16.4%) |
| 25 to 34 Years | 54 (4.4%) | 85 (9.3%) |
| 35 to 44 Years | 46 (5.6%) | 0 (0.0%) |
| 45 to 54 Years | 30 (3.1%) | 55 (6.4%) |
| 55 to 64 Years | 37 (4.7%) | 42 (3.7%) |
| 65 to 74 Years | 18 (1.9%) | 76 (10.6%) |
| 75 Years and over | 50 (16.4%) | 28 (2.8%) |
| Total | 341 (5.1%) | 434 (6.6%) |
Income Above Poverty by Sex and Age in Bonita
According to the poverty statistics in Bonita, males aged under 5 years and females aged under 5 years are the age groups that are most secure financially, with 100.0% of males and 100.0% of females in these age groups living above the poverty line.
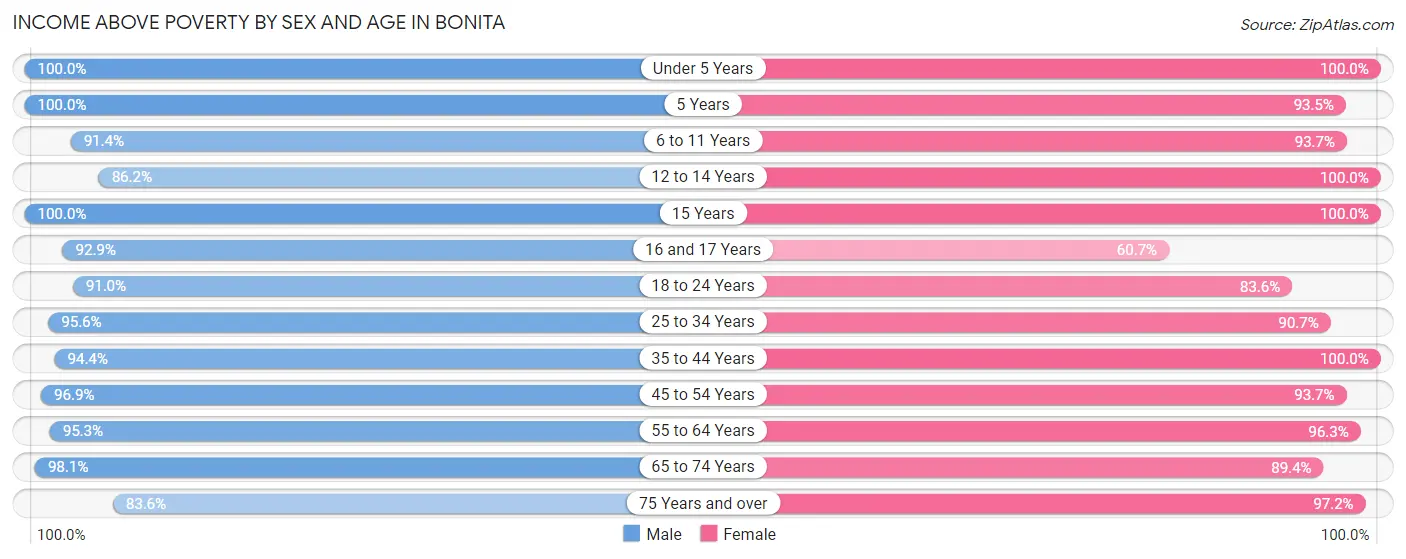
| Age Bracket | Male | Female |
| Under 5 Years | 446 (100.0%) | 254 (100.0%) |
| 5 Years | 28 (100.0%) | 188 (93.5%) |
| 6 to 11 Years | 448 (91.4%) | 269 (93.7%) |
| 12 to 14 Years | 213 (86.2%) | 129 (100.0%) |
| 15 Years | 108 (100.0%) | 81 (100.0%) |
| 16 and 17 Years | 79 (92.9%) | 51 (60.7%) |
| 18 to 24 Years | 244 (91.0%) | 427 (83.6%) |
| 25 to 34 Years | 1,168 (95.6%) | 830 (90.7%) |
| 35 to 44 Years | 778 (94.4%) | 434 (100.0%) |
| 45 to 54 Years | 944 (96.9%) | 811 (93.6%) |
| 55 to 64 Years | 753 (95.3%) | 1,088 (96.3%) |
| 65 to 74 Years | 916 (98.1%) | 640 (89.4%) |
| 75 Years and over | 255 (83.6%) | 969 (97.2%) |
| Total | 6,380 (94.9%) | 6,171 (93.4%) |
Income Below Poverty Among Married-Couple Families in Bonita
The poverty statistics for married-couple families in Bonita show that 2.5% or 64 of the total 2,531 families live below the poverty line. Families with no children have the highest poverty rate of 3.4%, comprising of 57 families. On the other hand, families with 3 or 4 children have the lowest poverty rate of 0.0%, which includes 0 families.
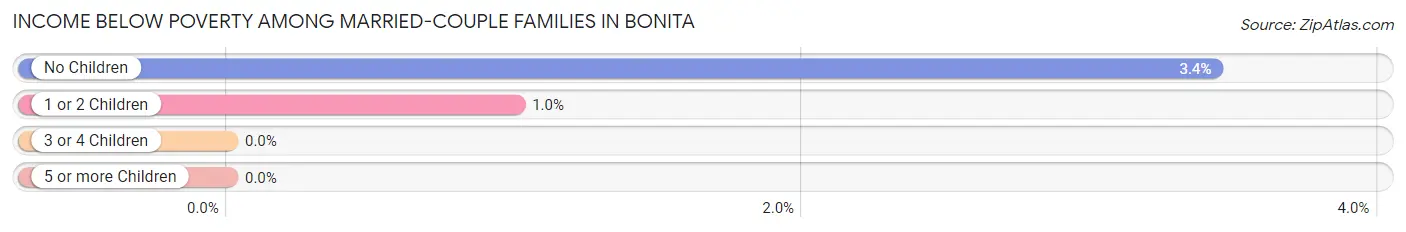
| Children | Above Poverty | Below Poverty |
| No Children | 1,604 (96.6%) | 57 (3.4%) |
| 1 or 2 Children | 694 (99.0%) | 7 (1.0%) |
| 3 or 4 Children | 150 (100.0%) | 0 (0.0%) |
| 5 or more Children | 19 (100.0%) | 0 (0.0%) |
| Total | 2,467 (97.5%) | 64 (2.5%) |
Income Below Poverty Among Single-Parent Households in Bonita
According to the poverty data in Bonita, 8.8% or 24 single-father households and 18.6% or 89 single-mother households are living below the poverty line. Among single-father households, those with 1 or 2 children have the highest poverty rate, with 24 households (23.1%) experiencing poverty. Likewise, among single-mother households, those with 1 or 2 children have the highest poverty rate, with 56 households (23.5%) falling below the poverty line.
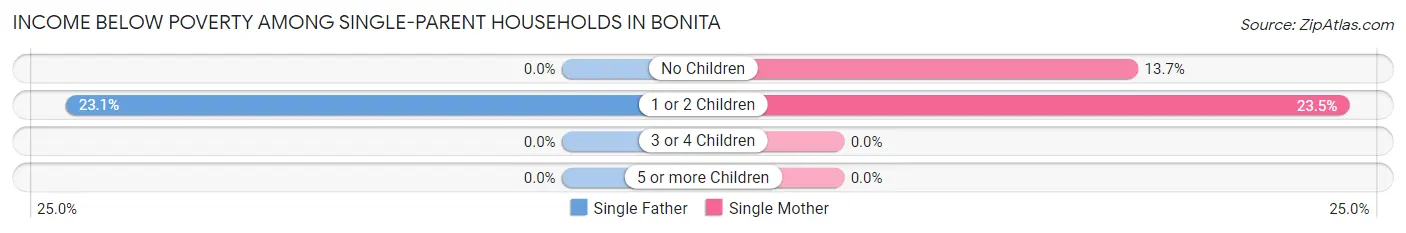
| Children | Single Father | Single Mother |
| No Children | 0 (0.0%) | 33 (13.7%) |
| 1 or 2 Children | 24 (23.1%) | 56 (23.5%) |
| 3 or 4 Children | 0 (0.0%) | 0 (0.0%) |
| 5 or more Children | 0 (0.0%) | 0 (0.0%) |
| Total | 24 (8.8%) | 89 (18.6%) |
Income Below Poverty Among Married-Couple vs Single-Parent Households in Bonita
The poverty data for Bonita shows that 64 of the married-couple family households (2.5%) and 113 of the single-parent households (15.0%) are living below the poverty level. Within the married-couple family households, those with no children have the highest poverty rate, with 57 households (3.4%) falling below the poverty line. Among the single-parent households, those with 1 or 2 children have the highest poverty rate, with 80 household (23.4%) living below poverty.
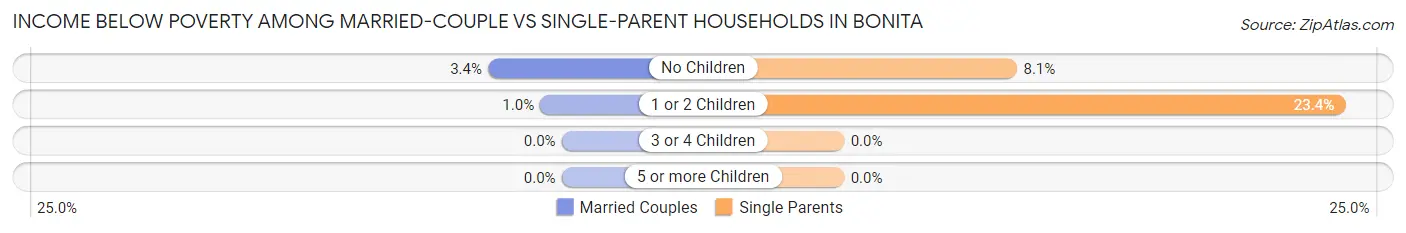
| Children | Married-Couple Families | Single-Parent Households |
| No Children | 57 (3.4%) | 33 (8.1%) |
| 1 or 2 Children | 7 (1.0%) | 80 (23.4%) |
| 3 or 4 Children | 0 (0.0%) | 0 (0.0%) |
| 5 or more Children | 0 (0.0%) | 0 (0.0%) |
| Total | 64 (2.5%) | 113 (15.0%) |
Race in Bonita
The most populous races in Bonita are White / Caucasian (7,629 | 56.6%), Hispanic or Latino (6,638 | 49.3%), and Two or more Races (2,792 | 20.7%).
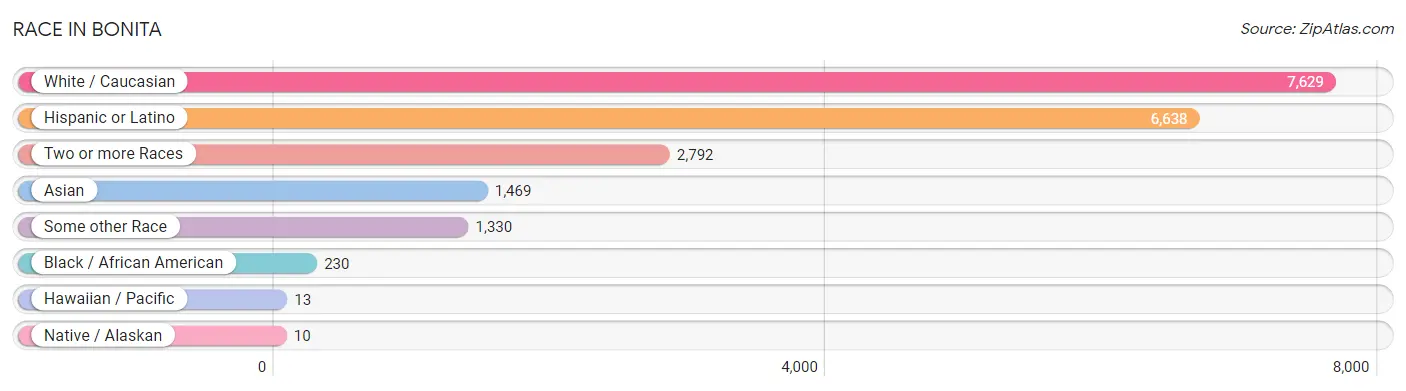
| Race | # Population | % Population |
| Asian | 1,469 | 10.9% |
| Black / African American | 230 | 1.7% |
| Hawaiian / Pacific | 13 | 0.1% |
| Hispanic or Latino | 6,638 | 49.3% |
| Native / Alaskan | 10 | 0.1% |
| White / Caucasian | 7,629 | 56.6% |
| Two or more Races | 2,792 | 20.7% |
| Some other Race | 1,330 | 9.9% |
| Total | 13,473 | 100.0% |
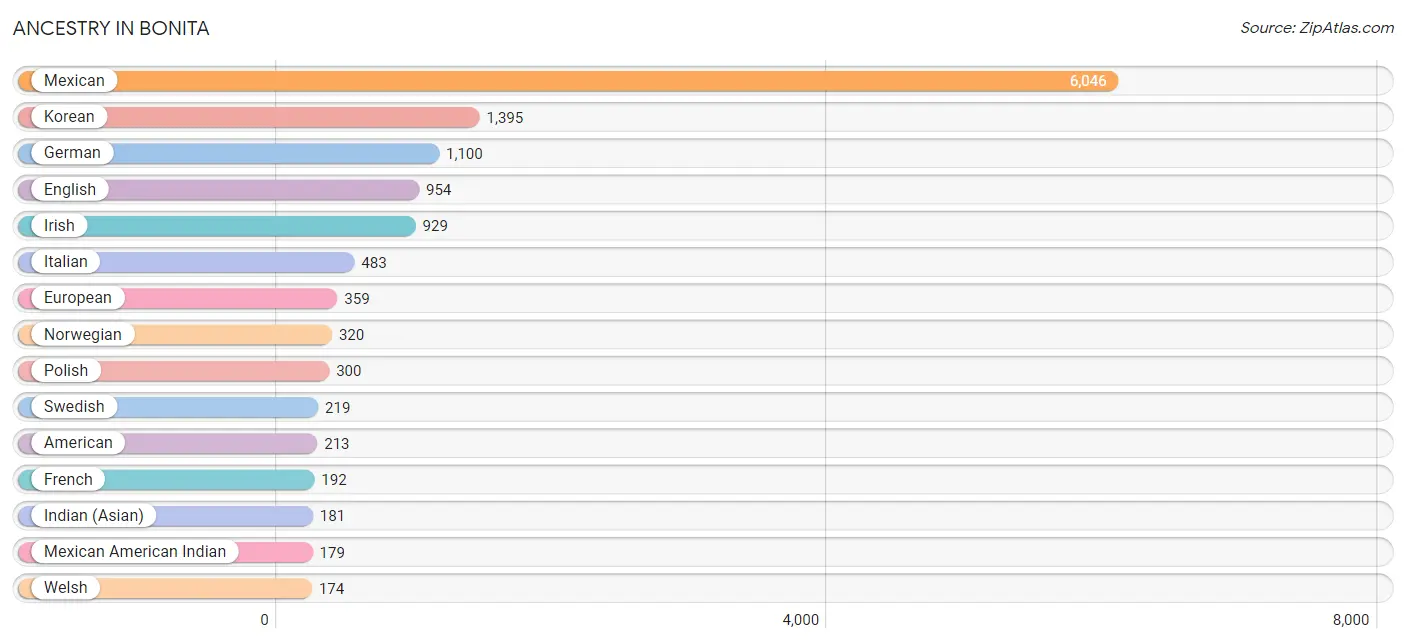
Ancestry in Bonita
The most populous ancestries reported in Bonita are Mexican (6,046 | 44.9%), Korean (1,395 | 10.3%), German (1,100 | 8.2%), English (954 | 7.1%), and Irish (929 | 6.9%), together accounting for 77.4% of all Bonita residents.
| Ancestry | # Population | % Population |
| African | 7 | 0.1% |
| American | 213 | 1.6% |
| Arab | 119 | 0.9% |
| Australian | 37 | 0.3% |
| Belgian | 34 | 0.3% |
| Bhutanese | 56 | 0.4% |
| British | 168 | 1.3% |
| Burmese | 66 | 0.5% |
| Central American | 112 | 0.8% |
| Central American Indian | 10 | 0.1% |
| Croatian | 5 | 0.0% |
| Cuban | 65 | 0.5% |
| Czech | 10 | 0.1% |
| Czechoslovakian | 5 | 0.0% |
| Danish | 52 | 0.4% |
| Dutch | 51 | 0.4% |
| Eastern European | 29 | 0.2% |
| English | 954 | 7.1% |
| European | 359 | 2.7% |
| French | 192 | 1.4% |
| French Canadian | 64 | 0.5% |
| German | 1,100 | 8.2% |
| Greek | 5 | 0.0% |
| Honduran | 70 | 0.5% |
| Hungarian | 22 | 0.2% |
| Indian (Asian) | 181 | 1.3% |
| Iranian | 88 | 0.6% |
| Irish | 929 | 6.9% |
| Italian | 483 | 3.6% |
| Japanese | 99 | 0.7% |
| Korean | 1,395 | 10.3% |
| Laotian | 79 | 0.6% |
| Malaysian | 8 | 0.1% |
| Mexican | 6,046 | 44.9% |
| Mexican American Indian | 179 | 1.3% |
| Moroccan | 14 | 0.1% |
| Native Hawaiian | 11 | 0.1% |
| Nigerian | 15 | 0.1% |
| Northern European | 82 | 0.6% |
| Norwegian | 320 | 2.4% |
| Polish | 300 | 2.2% |
| Portuguese | 31 | 0.2% |
| Puerto Rican | 140 | 1.0% |
| Romanian | 36 | 0.3% |
| Russian | 38 | 0.3% |
| Salvadoran | 42 | 0.3% |
| Scandinavian | 20 | 0.2% |
| Scotch-Irish | 85 | 0.6% |
| Scottish | 102 | 0.8% |
| Slovak | 37 | 0.3% |
| Slovene | 12 | 0.1% |
| South American | 32 | 0.2% |
| Spaniard | 99 | 0.7% |
| Spanish | 26 | 0.2% |
| Spanish American | 104 | 0.8% |
| Sri Lankan | 135 | 1.0% |
| Subsaharan African | 22 | 0.2% |
| Swedish | 219 | 1.6% |
| Swiss | 50 | 0.4% |
| Thai | 11 | 0.1% |
| Ukrainian | 64 | 0.5% |
| Venezuelan | 32 | 0.2% |
| Welsh | 174 | 1.3% | View All 63 Rows |
Immigrants in Bonita
The most numerous immigrant groups reported in Bonita came from Central America (1,401 | 10.4%), Latin America (1,401 | 10.4%), Mexico (1,346 | 10.0%), Asia (989 | 7.3%), and South Eastern Asia (824 | 6.1%), together accounting for 44.3% of all Bonita residents.
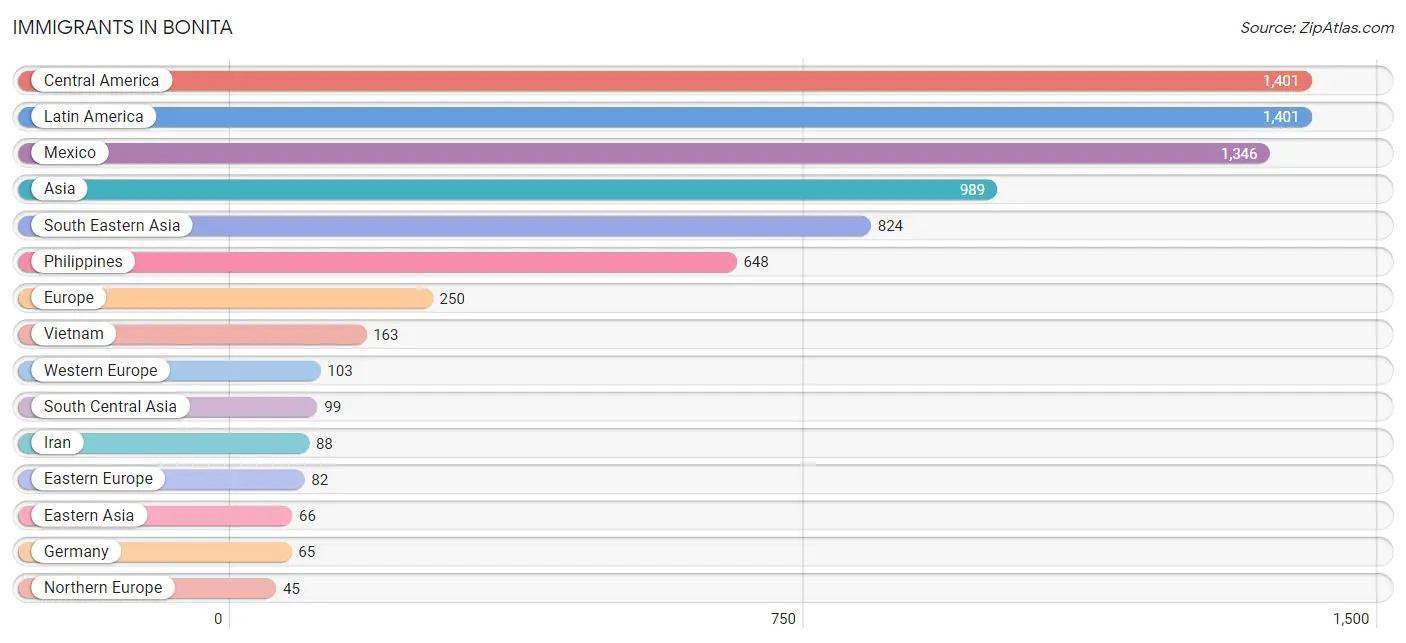
| Immigration Origin | # Population | % Population |
| Africa | 14 | 0.1% |
| Asia | 989 | 7.3% |
| Australia | 14 | 0.1% |
| Belgium | 12 | 0.1% |
| Cambodia | 13 | 0.1% |
| Central America | 1,401 | 10.4% |
| China | 3 | 0.0% |
| Eastern Asia | 66 | 0.5% |
| Eastern Europe | 82 | 0.6% |
| El Salvador | 14 | 0.1% |
| Europe | 250 | 1.9% |
| Germany | 65 | 0.5% |
| India | 11 | 0.1% |
| Iran | 88 | 0.6% |
| Ireland | 20 | 0.2% |
| Japan | 22 | 0.2% |
| Korea | 41 | 0.3% |
| Latin America | 1,401 | 10.4% |
| Mexico | 1,346 | 10.0% |
| Morocco | 14 | 0.1% |
| Northern Africa | 14 | 0.1% |
| Northern Europe | 45 | 0.3% |
| Oceania | 14 | 0.1% |
| Panama | 41 | 0.3% |
| Philippines | 648 | 4.8% |
| Poland | 44 | 0.3% |
| Romania | 38 | 0.3% |
| Scotland | 12 | 0.1% |
| South Central Asia | 99 | 0.7% |
| South Eastern Asia | 824 | 6.1% |
| Southern Europe | 20 | 0.2% |
| Spain | 20 | 0.2% |
| Switzerland | 26 | 0.2% |
| Vietnam | 163 | 1.2% |
| Western Europe | 103 | 0.8% | View All 35 Rows |
Sex and Age in Bonita
Sex and Age in Bonita
The most populous age groups in Bonita are 30 to 34 Years (639 | 9.5%) for men and 60 to 64 Years (566 | 8.4%) for women.
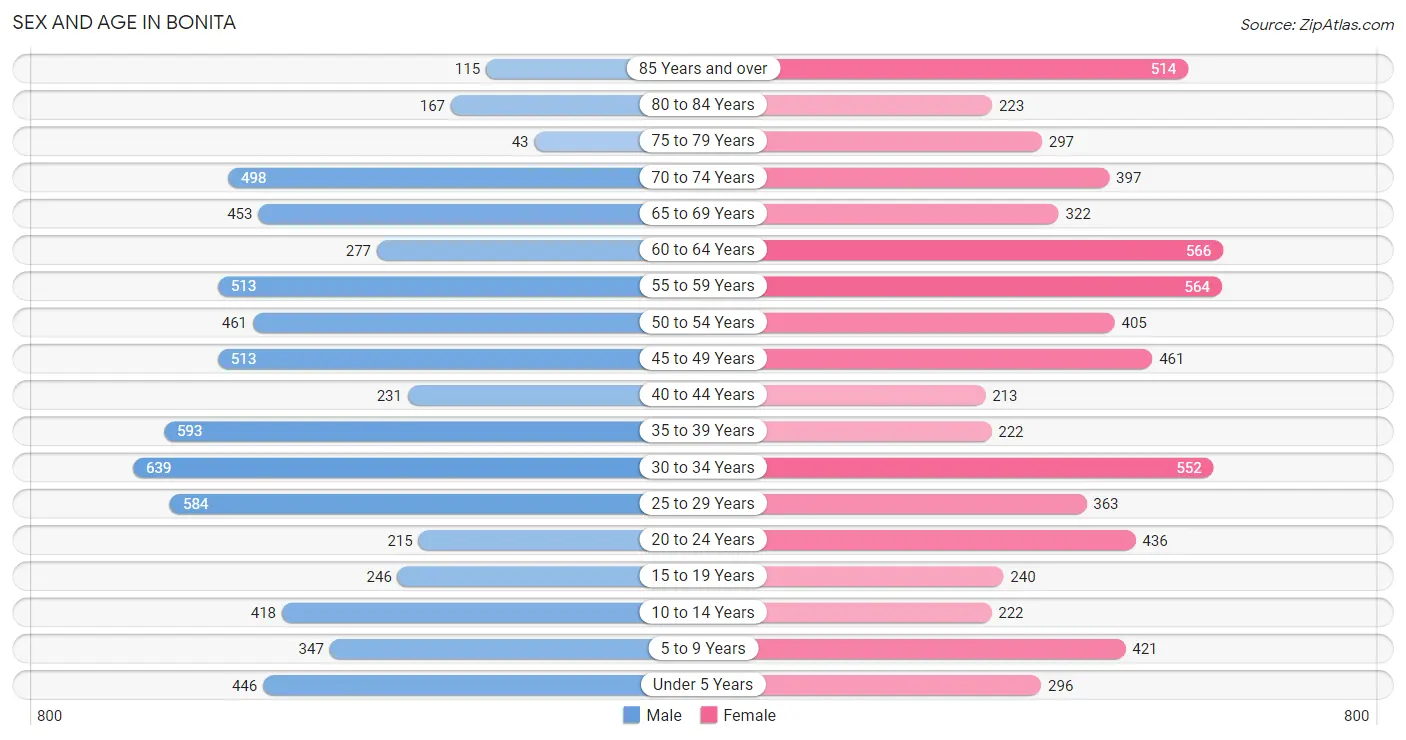
| Age Bracket | Male | Female |
| Under 5 Years | 446 (6.6%) | 296 (4.4%) |
| 5 to 9 Years | 347 (5.1%) | 421 (6.3%) |
| 10 to 14 Years | 418 (6.2%) | 222 (3.3%) |
| 15 to 19 Years | 246 (3.6%) | 240 (3.6%) |
| 20 to 24 Years | 215 (3.2%) | 436 (6.5%) |
| 25 to 29 Years | 584 (8.6%) | 363 (5.4%) |
| 30 to 34 Years | 639 (9.5%) | 552 (8.2%) |
| 35 to 39 Years | 593 (8.8%) | 222 (3.3%) |
| 40 to 44 Years | 231 (3.4%) | 213 (3.2%) |
| 45 to 49 Years | 513 (7.6%) | 461 (6.9%) |
| 50 to 54 Years | 461 (6.8%) | 405 (6.0%) |
| 55 to 59 Years | 513 (7.6%) | 564 (8.4%) |
| 60 to 64 Years | 277 (4.1%) | 566 (8.4%) |
| 65 to 69 Years | 453 (6.7%) | 322 (4.8%) |
| 70 to 74 Years | 498 (7.4%) | 397 (5.9%) |
| 75 to 79 Years | 43 (0.6%) | 297 (4.4%) |
| 80 to 84 Years | 167 (2.5%) | 223 (3.3%) |
| 85 Years and over | 115 (1.7%) | 514 (7.7%) |
| Total | 6,759 (100.0%) | 6,714 (100.0%) |
Families and Households in Bonita
Median Family Size in Bonita
The median family size in Bonita is 3.41 persons per family, with married-couple families (2,531 | 77.1%) accounting for the largest median family size of 3.51 persons per family. On the other hand, single male/father families (273 | 8.3%) represent the smallest median family size with 2.60 persons per family.
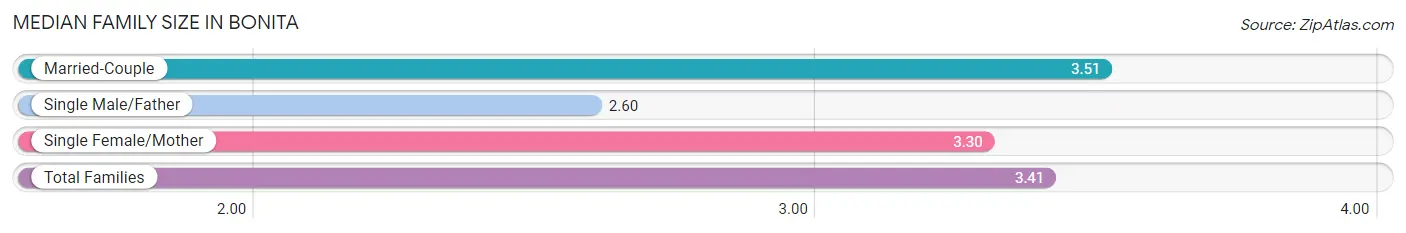
| Family Type | # Families | Family Size |
| Married-Couple | 2,531 (77.1%) | 3.51 |
| Single Male/Father | 273 (8.3%) | 2.60 |
| Single Female/Mother | 479 (14.6%) | 3.30 |
| Total Families | 3,283 (100.0%) | 3.41 |
Median Household Size in Bonita
The median household size in Bonita is 2.80 persons per household, with single female/mother households (479 | 10.0%) accounting for the largest median household size of 3.89 persons per household. non-family households (1,486 | 31.2%) represent the smallest median household size with 1.12 persons per household.
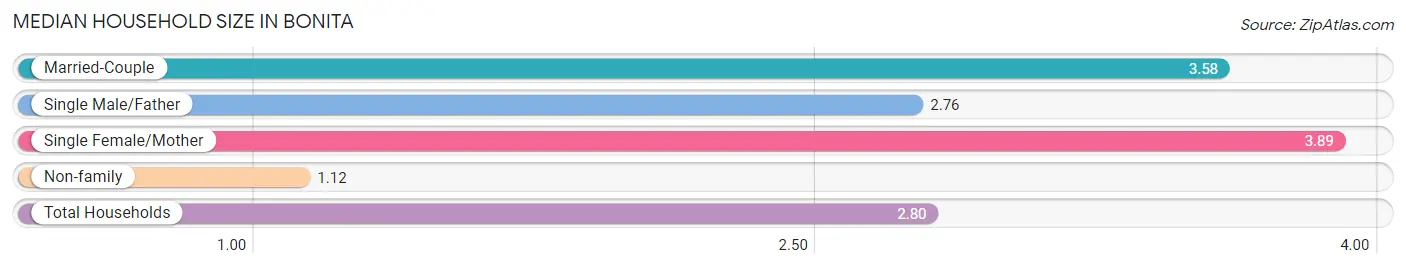
| Household Type | # Households | Household Size |
| Married-Couple | 2,531 (53.1%) | 3.58 |
| Single Male/Father | 273 (5.7%) | 2.76 |
| Single Female/Mother | 479 (10.0%) | 3.89 |
| Non-family | 1,486 (31.2%) | 1.12 |
| Total Households | 4,769 (100.0%) | 2.80 |
Household Size by Marriage Status in Bonita
Out of a total of 4,769 households in Bonita, 3,283 (68.8%) are family households, while 1,486 (31.2%) are nonfamily households. The most numerous type of family households are 2-person households, comprising 1,329, and the most common type of nonfamily households are 1-person households, comprising 1,354.
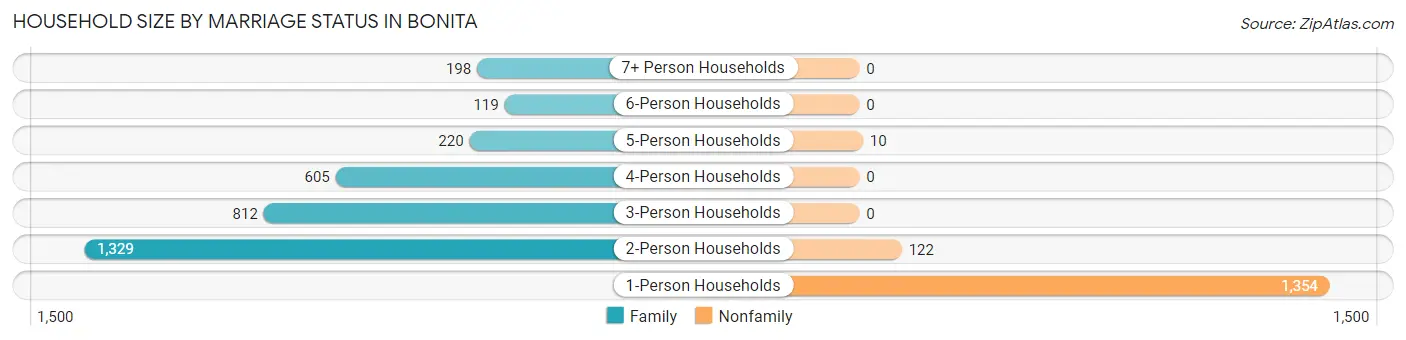
| Household Size | Family Households | Nonfamily Households |
| 1-Person Households | - | 1,354 (28.4%) |
| 2-Person Households | 1,329 (27.9%) | 122 (2.6%) |
| 3-Person Households | 812 (17.0%) | 0 (0.0%) |
| 4-Person Households | 605 (12.7%) | 0 (0.0%) |
| 5-Person Households | 220 (4.6%) | 10 (0.2%) |
| 6-Person Households | 119 (2.5%) | 0 (0.0%) |
| 7+ Person Households | 198 (4.2%) | 0 (0.0%) |
| Total | 3,283 (68.8%) | 1,486 (31.2%) |
Female Fertility in Bonita
Fertility by Age in Bonita
Average fertility rate in Bonita is 31.0 births per 1,000 women. Women in the age bracket of 20 to 34 years have the highest fertility rate with 41.0 births per 1,000 women. Women in the age bracket of 20 to 34 years acount for 70.5% of all women with births.
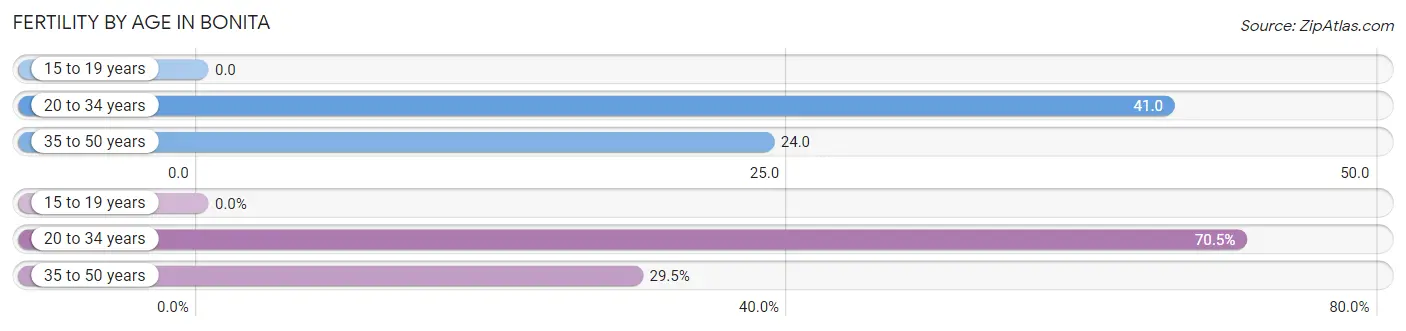
| Age Bracket | Women with Births | Births / 1,000 Women |
| 15 to 19 years | 0 (0.0%) | 0.0 |
| 20 to 34 years | 55 (70.5%) | 41.0 |
| 35 to 50 years | 23 (29.5%) | 24.0 |
| Total | 78 (100.0%) | 31.0 |
Fertility by Age by Marriage Status in Bonita
84.6% of women with births (78) in Bonita are married. The highest percentage of unmarried women with births falls into 20 to 34 years age bracket with 18.2% of them unmarried at the time of birth, while the lowest percentage of unmarried women with births belong to 35 to 50 years age bracket with 8.7% of them unmarried.
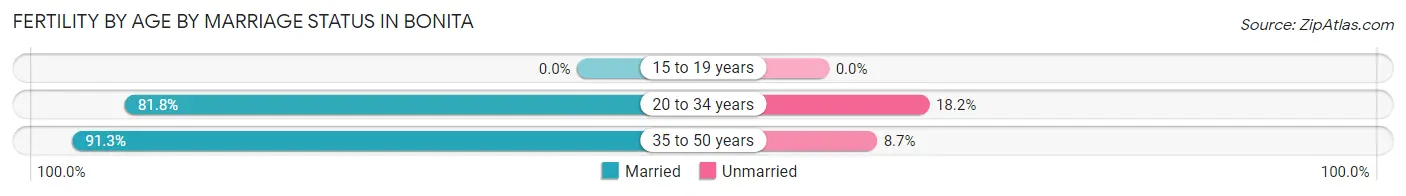
| Age Bracket | Married | Unmarried |
| 15 to 19 years | 0 (0.0%) | 0 (0.0%) |
| 20 to 34 years | 45 (81.8%) | 10 (18.2%) |
| 35 to 50 years | 21 (91.3%) | 2 (8.7%) |
| Total | 66 (84.6%) | 12 (15.4%) |
Fertility by Education in Bonita
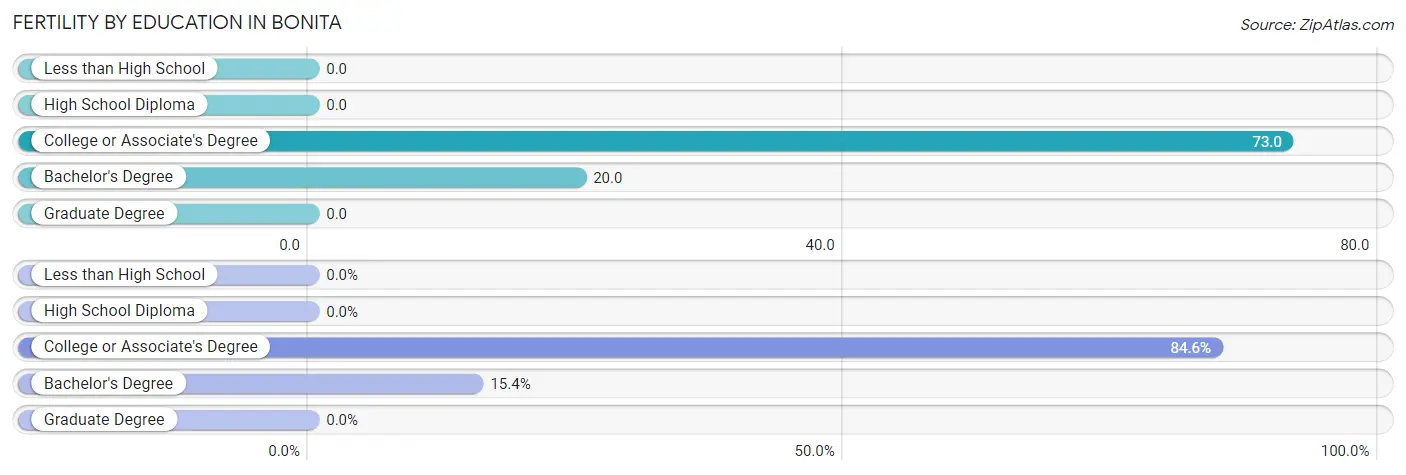
| Educational Attainment | Women with Births | Births / 1,000 Women |
| Less than High School | 0 (0.0%) | 0.0 |
| High School Diploma | 0 (0.0%) | 0.0 |
| College or Associate's Degree | 66 (84.6%) | 73.0 |
| Bachelor's Degree | 12 (15.4%) | 20.0 |
| Graduate Degree | 0 (0.0%) | 0.0 |
| Total | 78 (100.0%) | 31.0 |
Fertility by Education by Marriage Status in Bonita
15.4% of women with births in Bonita are unmarried. Women with the educational attainment of bachelor's degree are most likely to be married with 100.0% of them married at childbirth, while women with the educational attainment of college or associate's degree are least likely to be married with 18.2% of them unmarried at childbirth.
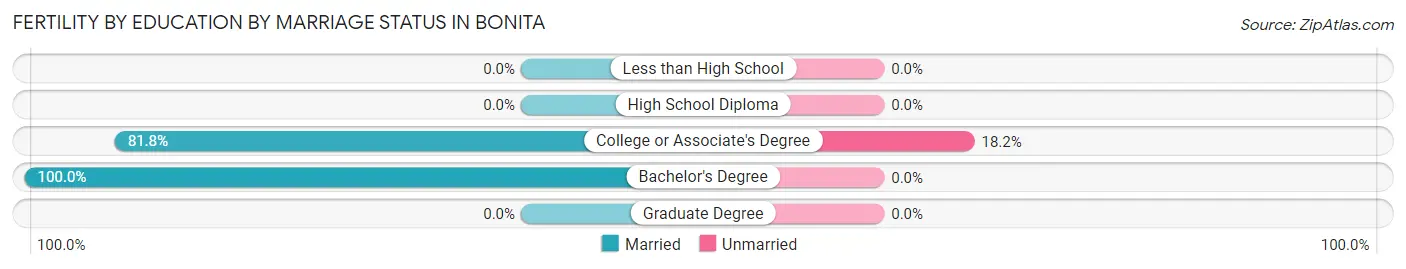
| Educational Attainment | Married | Unmarried |
| Less than High School | 0 (0.0%) | 0 (0.0%) |
| High School Diploma | 0 (0.0%) | 0 (0.0%) |
| College or Associate's Degree | 54 (81.8%) | 12 (18.2%) |
| Bachelor's Degree | 12 (100.0%) | 0 (0.0%) |
| Graduate Degree | 0 (0.0%) | 0 (0.0%) |
| Total | 66 (84.6%) | 12 (15.4%) |
Employment Characteristics in Bonita
Employment by Class of Employer in Bonita
Among the 6,302 employed individuals in Bonita, private company employees (3,691 | 58.6%), local government employees (617 | 9.8%), and not-for-profit organizations (572 | 9.1%) make up the most common classes of employment.
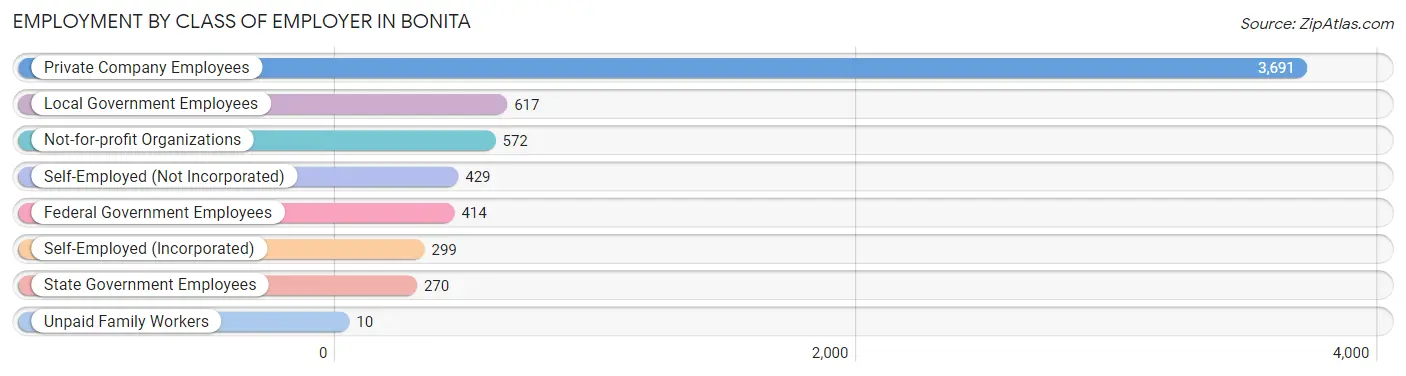
| Employer Class | # Employees | % Employees |
| Private Company Employees | 3,691 | 58.6% |
| Self-Employed (Incorporated) | 299 | 4.7% |
| Self-Employed (Not Incorporated) | 429 | 6.8% |
| Not-for-profit Organizations | 572 | 9.1% |
| Local Government Employees | 617 | 9.8% |
| State Government Employees | 270 | 4.3% |
| Federal Government Employees | 414 | 6.6% |
| Unpaid Family Workers | 10 | 0.2% |
| Total | 6,302 | 100.0% |
Employment Status by Age in Bonita
According to the labor force statistics for Bonita, out of the total population over 16 years of age (11,134), 63.4% or 7,059 individuals are in the labor force, with 7.6% or 536 of them unemployed. The age group with the highest labor force participation rate is 30 to 34 years, with 94.3% or 1,123 individuals in the labor force. Within the labor force, the 35 to 44 years age range has the highest percentage of unemployed individuals, with 19.4% or 220 of them being unemployed.
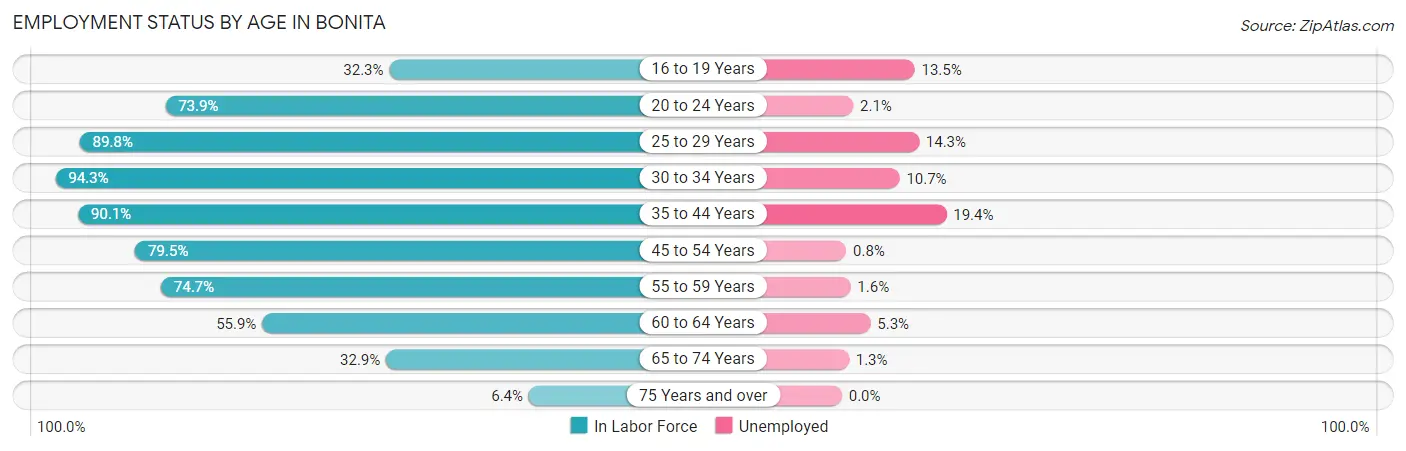
| Age Bracket | In Labor Force | Unemployed |
| 16 to 19 Years | 96 (32.3%) | 13 (13.5%) |
| 20 to 24 Years | 481 (73.9%) | 10 (2.1%) |
| 25 to 29 Years | 850 (89.8%) | 122 (14.3%) |
| 30 to 34 Years | 1,123 (94.3%) | 120 (10.7%) |
| 35 to 44 Years | 1,134 (90.1%) | 220 (19.4%) |
| 45 to 54 Years | 1,463 (79.5%) | 12 (0.8%) |
| 55 to 59 Years | 805 (74.7%) | 13 (1.6%) |
| 60 to 64 Years | 471 (55.9%) | 25 (5.3%) |
| 65 to 74 Years | 549 (32.9%) | 7 (1.3%) |
| 75 Years and over | 87 (6.4%) | 0 (0.0%) |
| Total | 7,059 (63.4%) | 536 (7.6%) |
Employment Status by Educational Attainment in Bonita
According to labor force statistics for Bonita, 81.7% of individuals (5,847) out of the total population between 25 and 64 years of age (7,157) are in the labor force, with 8.7% or 509 of them being unemployed. The group with the highest labor force participation rate are those with the educational attainment of bachelor's degree or higher, with 88.2% or 2,366 individuals in the labor force. Within the labor force, individuals with less than high school education have the highest percentage of unemployment, with 29.4% or 128 of them being unemployed.
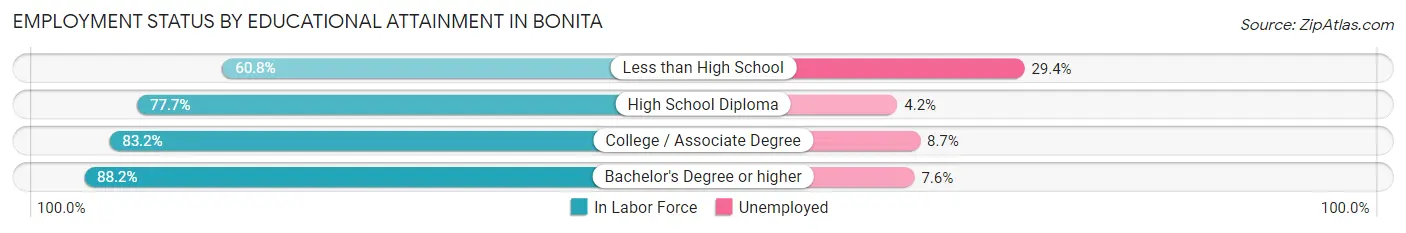
| Educational Attainment | In Labor Force | Unemployed |
| Less than High School | 435 (60.8%) | 211 (29.4%) |
| High School Diploma | 1,145 (77.7%) | 62 (4.2%) |
| College / Associate Degree | 1,901 (83.2%) | 199 (8.7%) |
| Bachelor's Degree or higher | 2,366 (88.2%) | 204 (7.6%) |
| Total | 5,847 (81.7%) | 623 (8.7%) |
Employment Occupations by Sex in Bonita
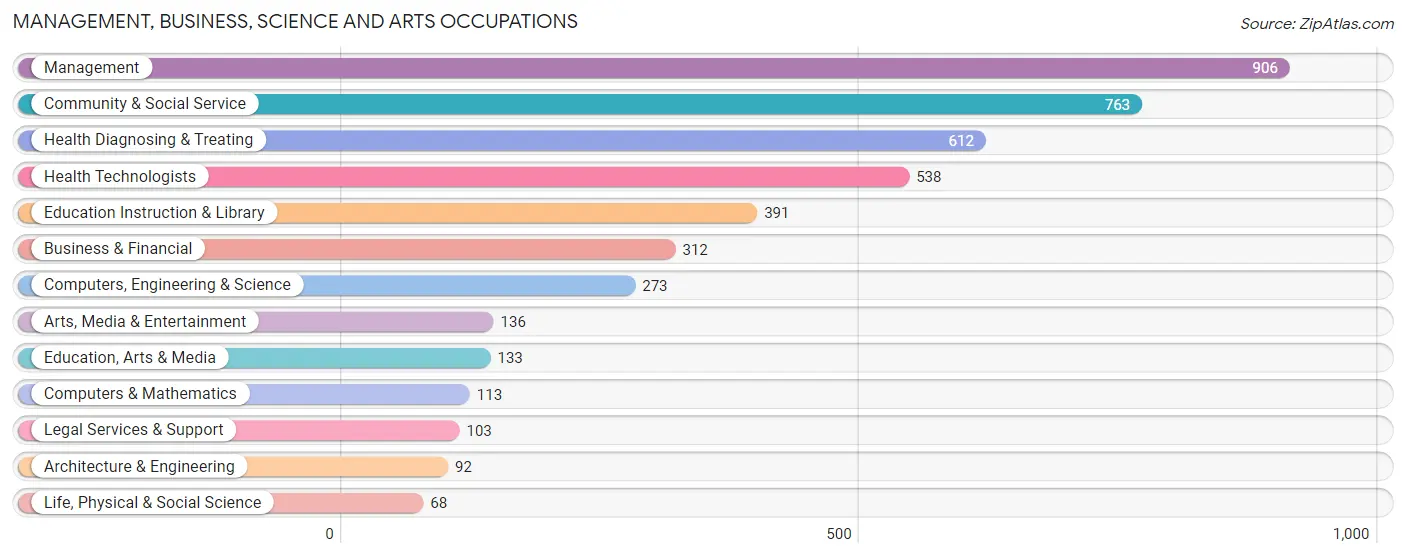
Management, Business, Science and Arts Occupations
The most common Management, Business, Science and Arts occupations in Bonita are Management (906 | 14.1%), Community & Social Service (763 | 11.9%), Health Diagnosing & Treating (612 | 9.5%), Health Technologists (538 | 8.4%), and Education Instruction & Library (391 | 6.1%).
Management, Business, Science and Arts Occupations by Sex
Within the Management, Business, Science and Arts occupations in Bonita, the most male-oriented occupations are Computers & Mathematics (74.3%), Business & Financial (72.8%), and Management (71.0%), while the most female-oriented occupations are Education, Arts & Media (93.2%), Legal Services & Support (72.8%), and Community & Social Service (66.7%).
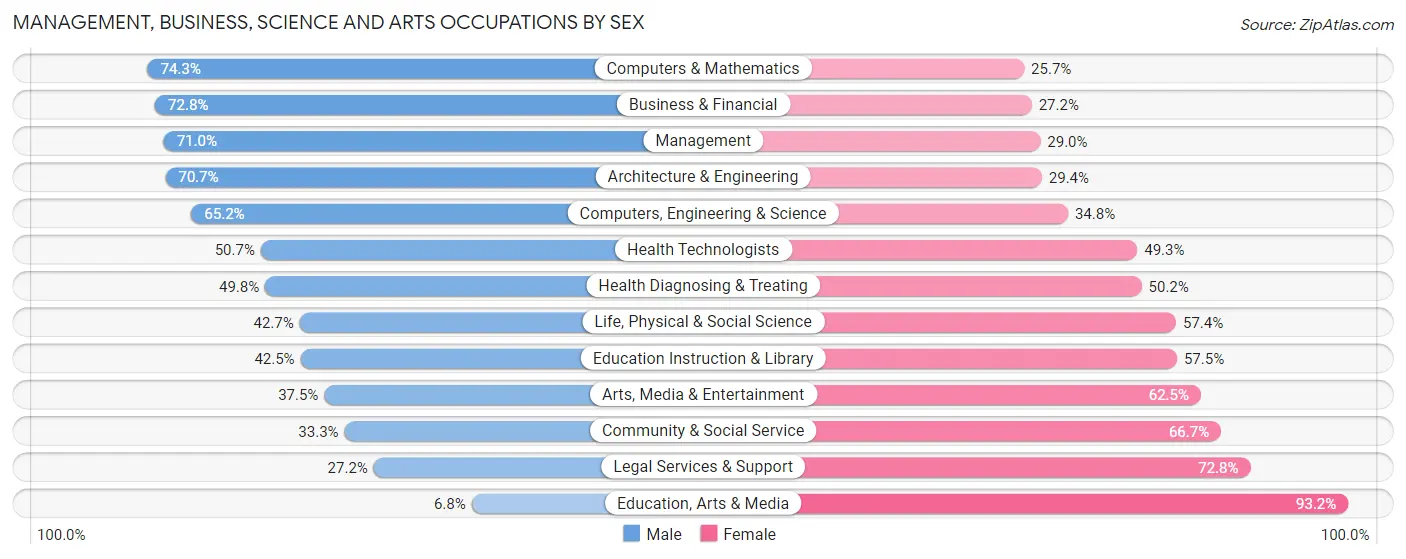
| Occupation | Male | Female |
| Management | 643 (71.0%) | 263 (29.0%) |
| Business & Financial | 227 (72.8%) | 85 (27.2%) |
| Computers, Engineering & Science | 178 (65.2%) | 95 (34.8%) |
| Computers & Mathematics | 84 (74.3%) | 29 (25.7%) |
| Architecture & Engineering | 65 (70.7%) | 27 (29.3%) |
| Life, Physical & Social Science | 29 (42.6%) | 39 (57.4%) |
| Community & Social Service | 254 (33.3%) | 509 (66.7%) |
| Education, Arts & Media | 9 (6.8%) | 124 (93.2%) |
| Legal Services & Support | 28 (27.2%) | 75 (72.8%) |
| Education Instruction & Library | 166 (42.5%) | 225 (57.5%) |
| Arts, Media & Entertainment | 51 (37.5%) | 85 (62.5%) |
| Health Diagnosing & Treating | 305 (49.8%) | 307 (50.2%) |
| Health Technologists | 273 (50.7%) | 265 (49.3%) |
| Total (Category) | 1,607 (56.1%) | 1,259 (43.9%) |
| Total (Overall) | 3,484 (54.2%) | 2,946 (45.8%) |
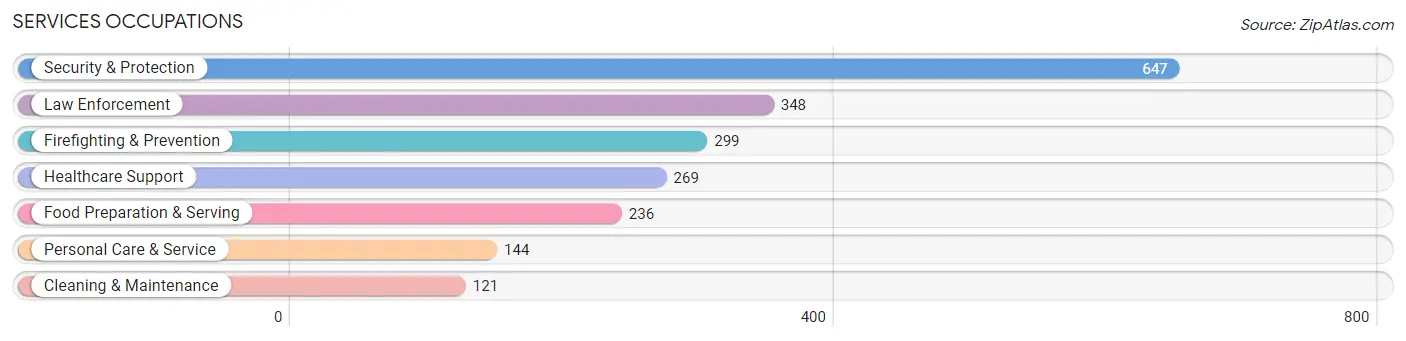
Services Occupations
The most common Services occupations in Bonita are Security & Protection (647 | 10.1%), Law Enforcement (348 | 5.4%), Firefighting & Prevention (299 | 4.6%), Healthcare Support (269 | 4.2%), and Food Preparation & Serving (236 | 3.7%).
Services Occupations by Sex
Within the Services occupations in Bonita, the most male-oriented occupations are Law Enforcement (85.6%), Security & Protection (80.7%), and Firefighting & Prevention (74.9%), while the most female-oriented occupations are Personal Care & Service (100.0%), Healthcare Support (97.4%), and Cleaning & Maintenance (71.1%).
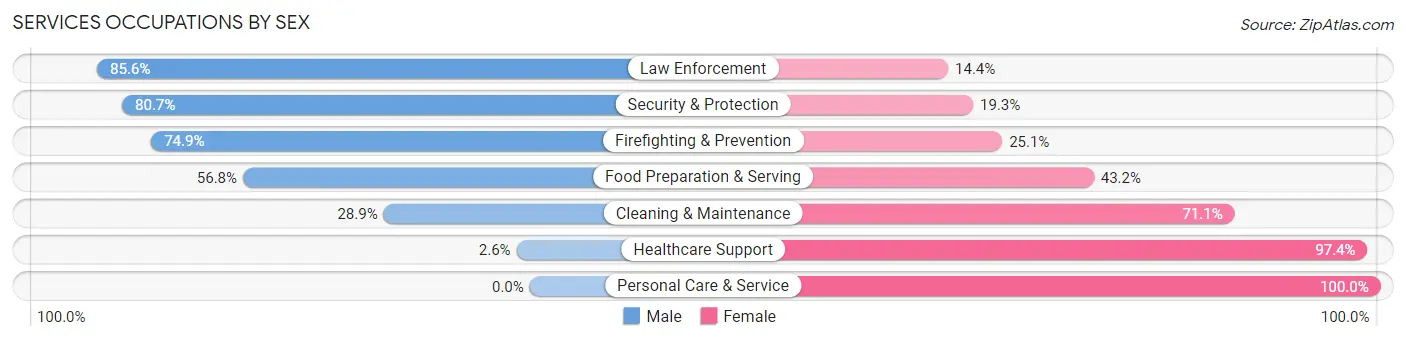
| Occupation | Male | Female |
| Healthcare Support | 7 (2.6%) | 262 (97.4%) |
| Security & Protection | 522 (80.7%) | 125 (19.3%) |
| Firefighting & Prevention | 224 (74.9%) | 75 (25.1%) |
| Law Enforcement | 298 (85.6%) | 50 (14.4%) |
| Food Preparation & Serving | 134 (56.8%) | 102 (43.2%) |
| Cleaning & Maintenance | 35 (28.9%) | 86 (71.1%) |
| Personal Care & Service | 0 (0.0%) | 144 (100.0%) |
| Total (Category) | 698 (49.3%) | 719 (50.7%) |
| Total (Overall) | 3,484 (54.2%) | 2,946 (45.8%) |
Sales and Office Occupations
The most common Sales and Office occupations in Bonita are Office & Administration (899 | 14.0%), and Sales & Related (541 | 8.4%).
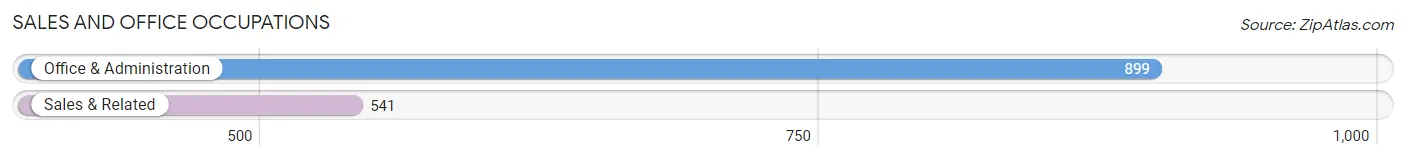
Sales and Office Occupations by Sex
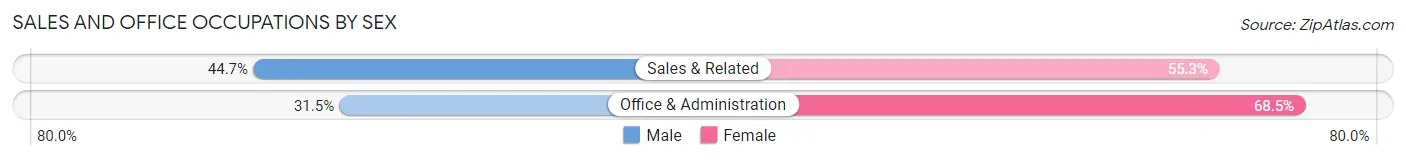
| Occupation | Male | Female |
| Sales & Related | 242 (44.7%) | 299 (55.3%) |
| Office & Administration | 283 (31.5%) | 616 (68.5%) |
| Total (Category) | 525 (36.5%) | 915 (63.5%) |
| Total (Overall) | 3,484 (54.2%) | 2,946 (45.8%) |
Natural Resources, Construction and Maintenance Occupations
The most common Natural Resources, Construction and Maintenance occupations in Bonita are Installation, Maintenance & Repair (198 | 3.1%), and Construction & Extraction (166 | 2.6%).
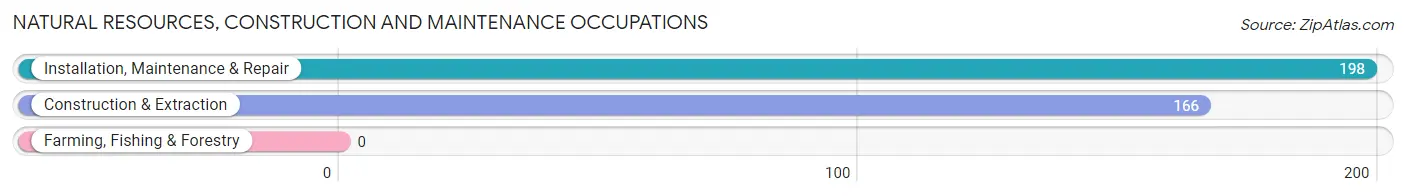
Natural Resources, Construction and Maintenance Occupations by Sex
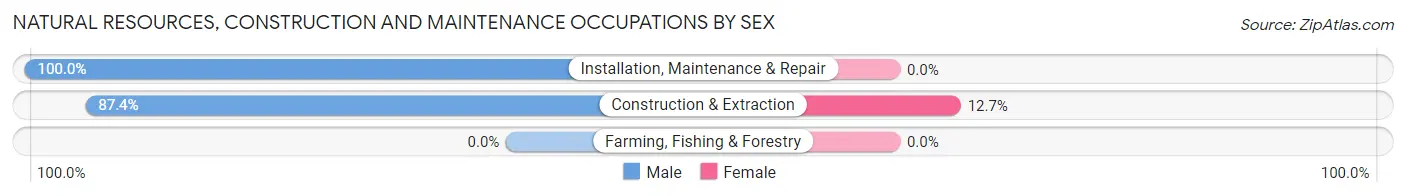
| Occupation | Male | Female |
| Farming, Fishing & Forestry | 0 (0.0%) | 0 (0.0%) |
| Construction & Extraction | 145 (87.4%) | 21 (12.7%) |
| Installation, Maintenance & Repair | 198 (100.0%) | 0 (0.0%) |
| Total (Category) | 343 (94.2%) | 21 (5.8%) |
| Total (Overall) | 3,484 (54.2%) | 2,946 (45.8%) |
Production, Transportation and Moving Occupations
The most common Production, Transportation and Moving occupations in Bonita are Transportation (179 | 2.8%), Material Moving (107 | 1.7%), and Production (57 | 0.9%).
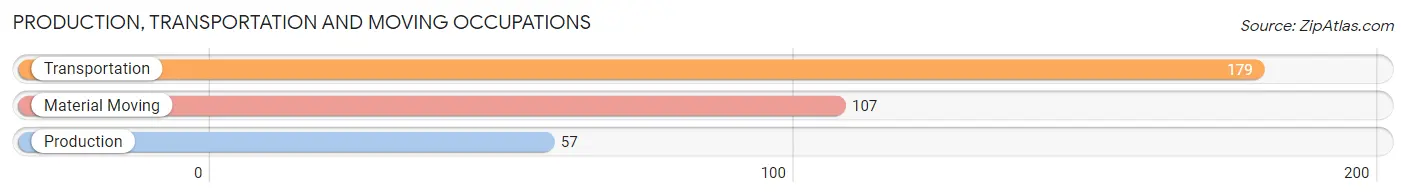
Production, Transportation and Moving Occupations by Sex
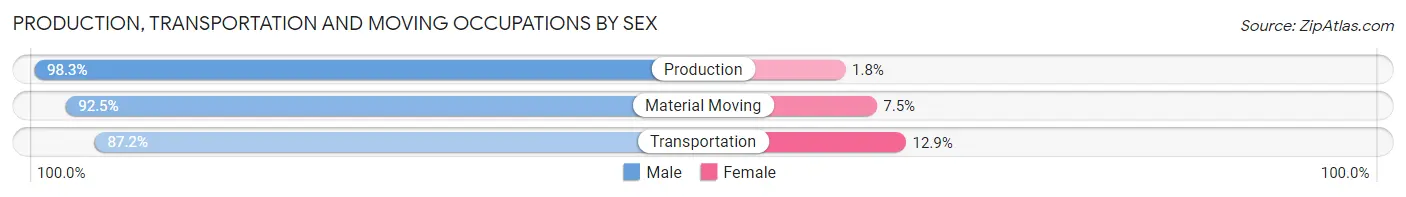
| Occupation | Male | Female |
| Production | 56 (98.3%) | 1 (1.8%) |
| Transportation | 156 (87.2%) | 23 (12.9%) |
| Material Moving | 99 (92.5%) | 8 (7.5%) |
| Total (Category) | 311 (90.7%) | 32 (9.3%) |
| Total (Overall) | 3,484 (54.2%) | 2,946 (45.8%) |
Employment Industries by Sex in Bonita
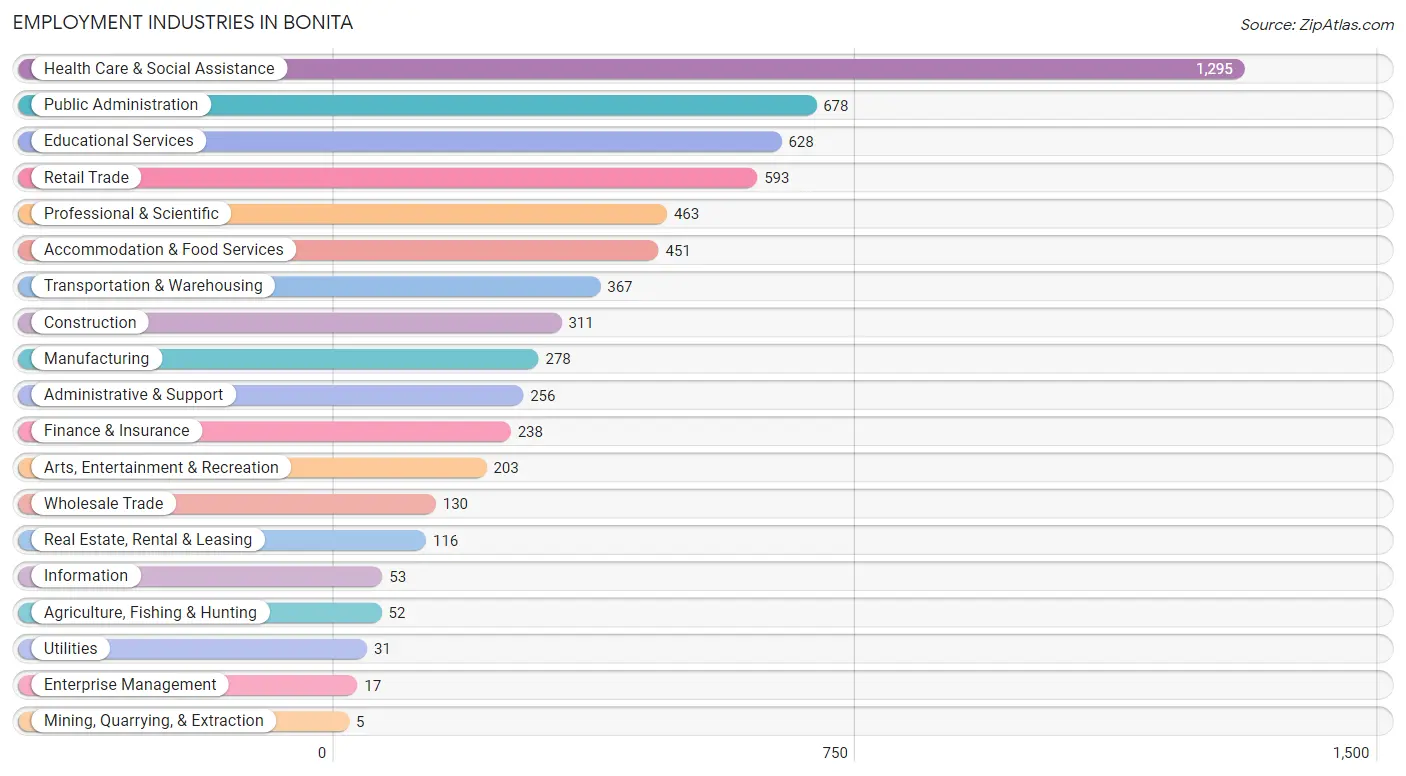
Employment Industries in Bonita
The major employment industries in Bonita include Health Care & Social Assistance (1,295 | 20.1%), Public Administration (678 | 10.5%), Educational Services (628 | 9.8%), Retail Trade (593 | 9.2%), and Professional & Scientific (463 | 7.2%).
Employment Industries by Sex in Bonita
The Bonita industries that see more men than women are Agriculture, Fishing & Hunting (100.0%), Mining, Quarrying, & Extraction (100.0%), and Finance & Insurance (97.9%), whereas the industries that tend to have a higher number of women are Utilities (100.0%), Administrative & Support (69.5%), and Health Care & Social Assistance (65.6%).
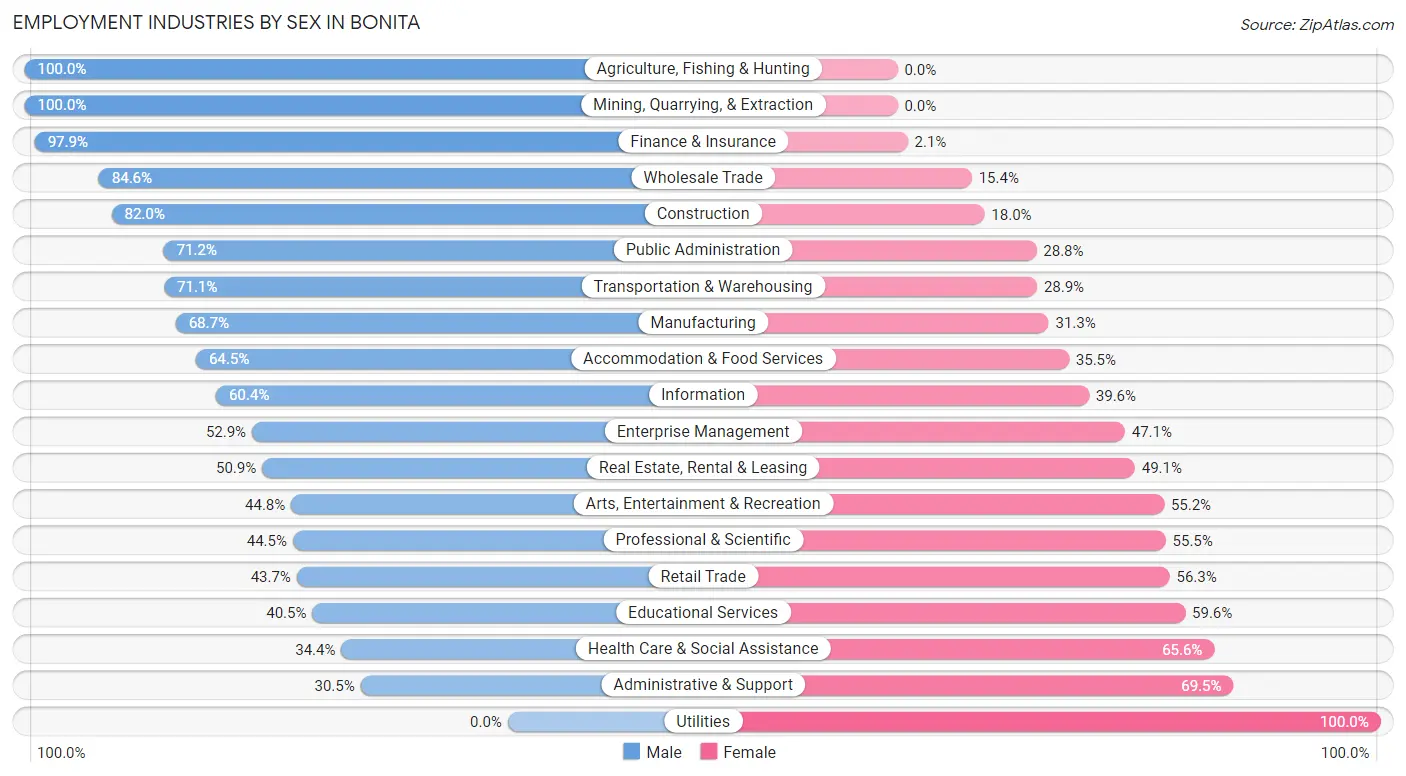
| Industry | Male | Female |
| Agriculture, Fishing & Hunting | 52 (100.0%) | 0 (0.0%) |
| Mining, Quarrying, & Extraction | 5 (100.0%) | 0 (0.0%) |
| Construction | 255 (82.0%) | 56 (18.0%) |
| Manufacturing | 191 (68.7%) | 87 (31.3%) |
| Wholesale Trade | 110 (84.6%) | 20 (15.4%) |
| Retail Trade | 259 (43.7%) | 334 (56.3%) |
| Transportation & Warehousing | 261 (71.1%) | 106 (28.9%) |
| Utilities | 0 (0.0%) | 31 (100.0%) |
| Information | 32 (60.4%) | 21 (39.6%) |
| Finance & Insurance | 233 (97.9%) | 5 (2.1%) |
| Real Estate, Rental & Leasing | 59 (50.9%) | 57 (49.1%) |
| Professional & Scientific | 206 (44.5%) | 257 (55.5%) |
| Enterprise Management | 9 (52.9%) | 8 (47.1%) |
| Administrative & Support | 78 (30.5%) | 178 (69.5%) |
| Educational Services | 254 (40.5%) | 374 (59.6%) |
| Health Care & Social Assistance | 446 (34.4%) | 849 (65.6%) |
| Arts, Entertainment & Recreation | 91 (44.8%) | 112 (55.2%) |
| Accommodation & Food Services | 291 (64.5%) | 160 (35.5%) |
| Public Administration | 483 (71.2%) | 195 (28.8%) |
| Total | 3,484 (54.2%) | 2,946 (45.8%) |
Education in Bonita
School Enrollment in Bonita
The most common levels of schooling among the 2,827 students in Bonita are college / undergraduate (815 | 28.8%), elementary school (564 | 20.0%), and middle school (506 | 17.9%).
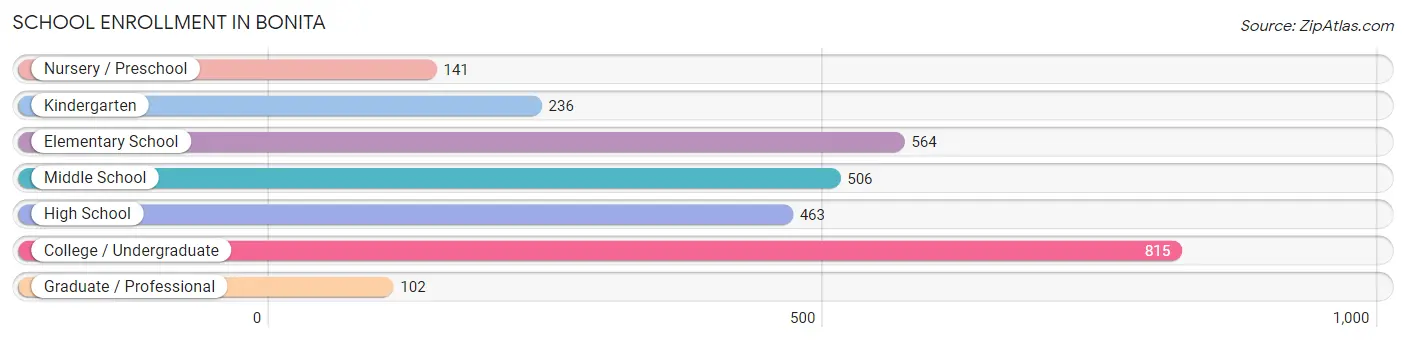
| School Level | # Students | % Students |
| Nursery / Preschool | 141 | 5.0% |
| Kindergarten | 236 | 8.4% |
| Elementary School | 564 | 20.0% |
| Middle School | 506 | 17.9% |
| High School | 463 | 16.4% |
| College / Undergraduate | 815 | 28.8% |
| Graduate / Professional | 102 | 3.6% |
| Total | 2,827 | 100.0% |
School Enrollment by Age by Funding Source in Bonita
Out of a total of 2,827 students who are enrolled in schools in Bonita, 498 (17.6%) attend a private institution, while the remaining 2,329 (82.4%) are enrolled in public schools. The age group of 20 to 24 year olds has the highest likelihood of being enrolled in private schools, with 129 (31.6% in the age bracket) enrolled. Conversely, the age group of 15 to 17 year olds has the lowest likelihood of being enrolled in a private school, with 348 (97.2% in the age bracket) attending a public institution.
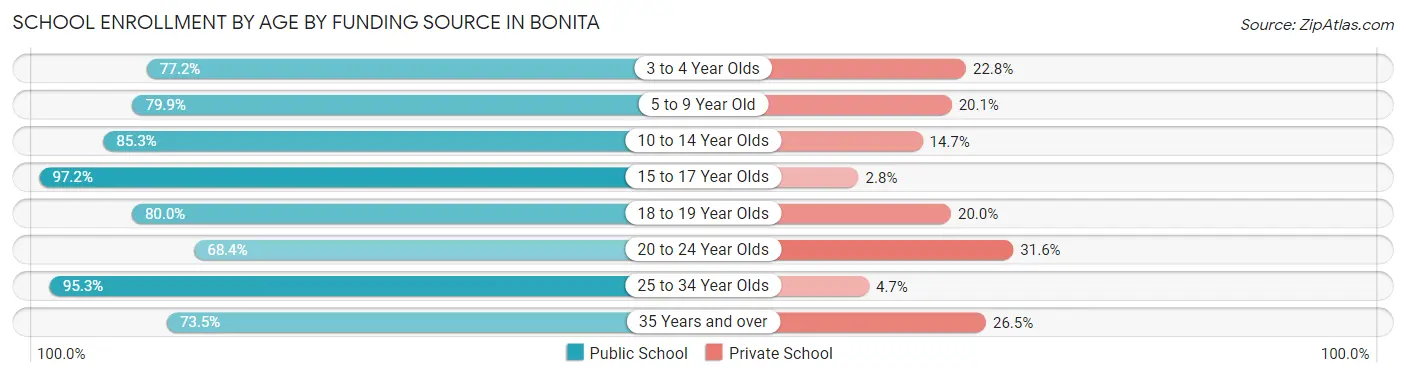
| Age Bracket | Public School | Private School |
| 3 to 4 Year Olds | 105 (77.2%) | 31 (22.8%) |
| 5 to 9 Year Old | 552 (79.9%) | 139 (20.1%) |
| 10 to 14 Year Olds | 546 (85.3%) | 94 (14.7%) |
| 15 to 17 Year Olds | 348 (97.2%) | 10 (2.8%) |
| 18 to 19 Year Olds | 88 (80.0%) | 22 (20.0%) |
| 20 to 24 Year Olds | 279 (68.4%) | 129 (31.6%) |
| 25 to 34 Year Olds | 242 (95.3%) | 12 (4.7%) |
| 35 Years and over | 169 (73.5%) | 61 (26.5%) |
| Total | 2,329 (82.4%) | 498 (17.6%) |
Educational Attainment by Field of Study in Bonita
Business (637 | 15.2%), science & technology (570 | 13.6%), psychology (378 | 9.0%), social sciences (362 | 8.6%), and education (295 | 7.0%) are the most common fields of study among 4,203 individuals in Bonita who have obtained a bachelor's degree or higher.
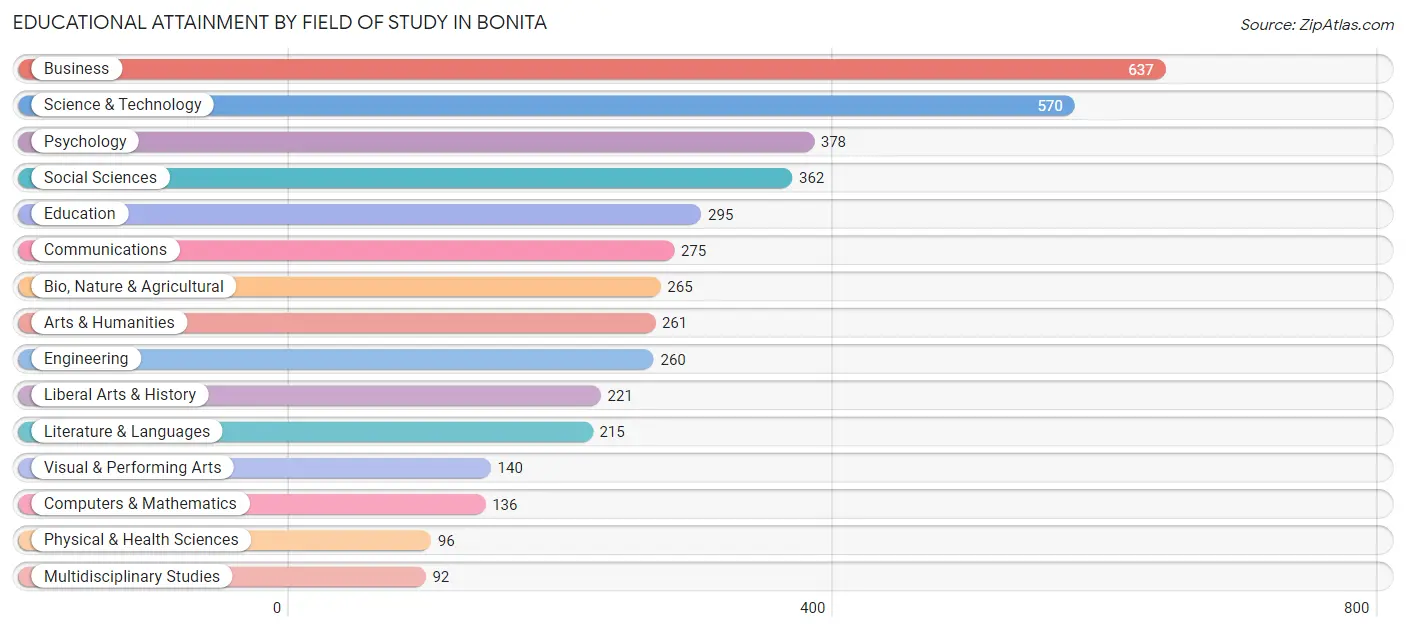
| Field of Study | # Graduates | % Graduates |
| Computers & Mathematics | 136 | 3.2% |
| Bio, Nature & Agricultural | 265 | 6.3% |
| Physical & Health Sciences | 96 | 2.3% |
| Psychology | 378 | 9.0% |
| Social Sciences | 362 | 8.6% |
| Engineering | 260 | 6.2% |
| Multidisciplinary Studies | 92 | 2.2% |
| Science & Technology | 570 | 13.6% |
| Business | 637 | 15.2% |
| Education | 295 | 7.0% |
| Literature & Languages | 215 | 5.1% |
| Liberal Arts & History | 221 | 5.3% |
| Visual & Performing Arts | 140 | 3.3% |
| Communications | 275 | 6.5% |
| Arts & Humanities | 261 | 6.2% |
| Total | 4,203 | 100.0% |
Transportation & Commute in Bonita
Vehicle Availability by Sex in Bonita
The most prevalent vehicle ownership categories in Bonita are males with 2 vehicles (1,037, accounting for 30.1%) and females with 2 vehicles (992, making up 36.6%).

| Vehicles Available | Male | Female |
| No Vehicle | 47 (1.4%) | 34 (1.2%) |
| 1 Vehicle | 327 (9.5%) | 541 (19.1%) |
| 2 Vehicles | 1,037 (30.1%) | 992 (35.0%) |
| 3 Vehicles | 807 (23.4%) | 649 (22.9%) |
| 4 Vehicles | 762 (22.1%) | 318 (11.2%) |
| 5 or more Vehicles | 461 (13.4%) | 301 (10.6%) |
| Total | 3,441 (100.0%) | 2,835 (100.0%) |
Commute Time in Bonita
The most frequently occuring commute durations in Bonita are 20 to 24 minutes (1,310 commuters, 24.0%), 15 to 19 minutes (1,177 commuters, 21.6%), and 30 to 34 minutes (789 commuters, 14.5%).
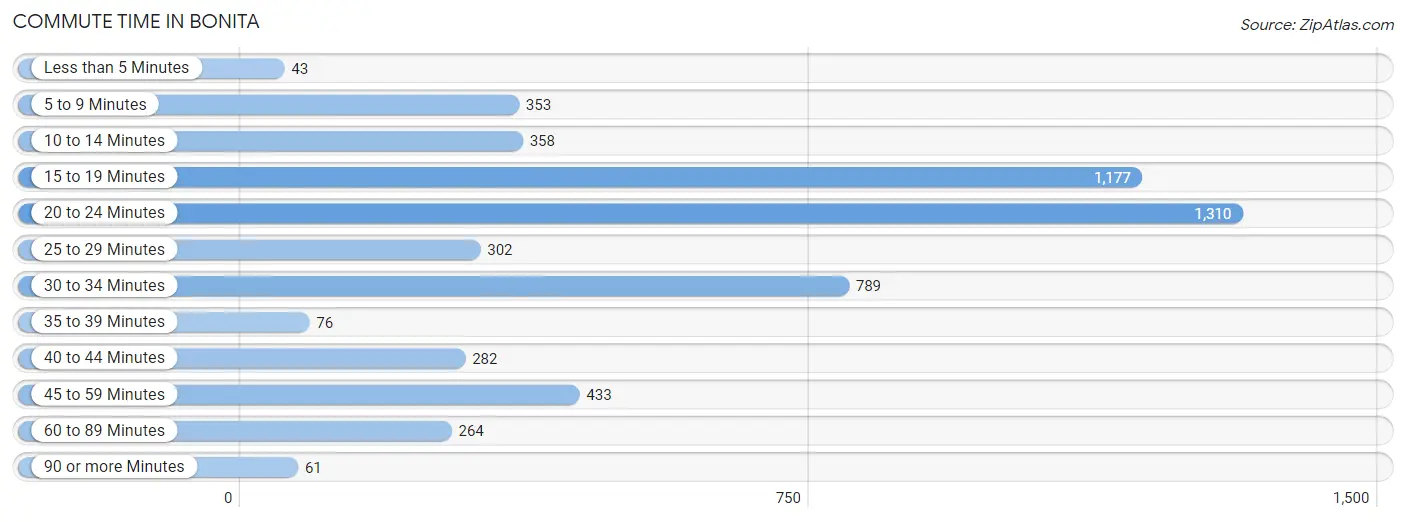
| Commute Time | # Commuters | % Commuters |
| Less than 5 Minutes | 43 | 0.8% |
| 5 to 9 Minutes | 353 | 6.5% |
| 10 to 14 Minutes | 358 | 6.6% |
| 15 to 19 Minutes | 1,177 | 21.6% |
| 20 to 24 Minutes | 1,310 | 24.0% |
| 25 to 29 Minutes | 302 | 5.5% |
| 30 to 34 Minutes | 789 | 14.5% |
| 35 to 39 Minutes | 76 | 1.4% |
| 40 to 44 Minutes | 282 | 5.2% |
| 45 to 59 Minutes | 433 | 8.0% |
| 60 to 89 Minutes | 264 | 4.9% |
| 90 or more Minutes | 61 | 1.1% |
Commute Time by Sex in Bonita
The most common commute times in Bonita are 20 to 24 minutes (709 commuters, 23.0%) for males and 20 to 24 minutes (601 commuters, 25.4%) for females.
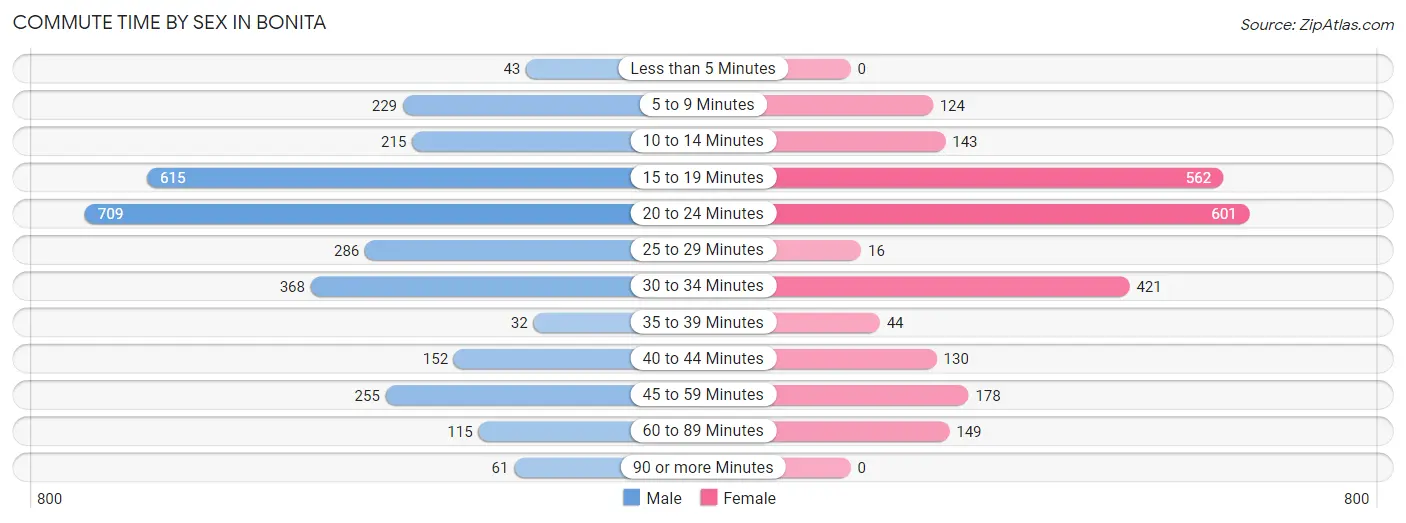
| Commute Time | Male | Female |
| Less than 5 Minutes | 43 (1.4%) | 0 (0.0%) |
| 5 to 9 Minutes | 229 (7.4%) | 124 (5.2%) |
| 10 to 14 Minutes | 215 (7.0%) | 143 (6.0%) |
| 15 to 19 Minutes | 615 (20.0%) | 562 (23.7%) |
| 20 to 24 Minutes | 709 (23.0%) | 601 (25.4%) |
| 25 to 29 Minutes | 286 (9.3%) | 16 (0.7%) |
| 30 to 34 Minutes | 368 (11.9%) | 421 (17.8%) |
| 35 to 39 Minutes | 32 (1.0%) | 44 (1.9%) |
| 40 to 44 Minutes | 152 (4.9%) | 130 (5.5%) |
| 45 to 59 Minutes | 255 (8.3%) | 178 (7.5%) |
| 60 to 89 Minutes | 115 (3.7%) | 149 (6.3%) |
| 90 or more Minutes | 61 (2.0%) | 0 (0.0%) |
Time of Departure to Work by Sex in Bonita
The most frequent times of departure to work in Bonita are 7:00 AM to 7:29 AM (406, 13.2%) for males and 7:00 AM to 7:29 AM (375, 15.8%) for females.
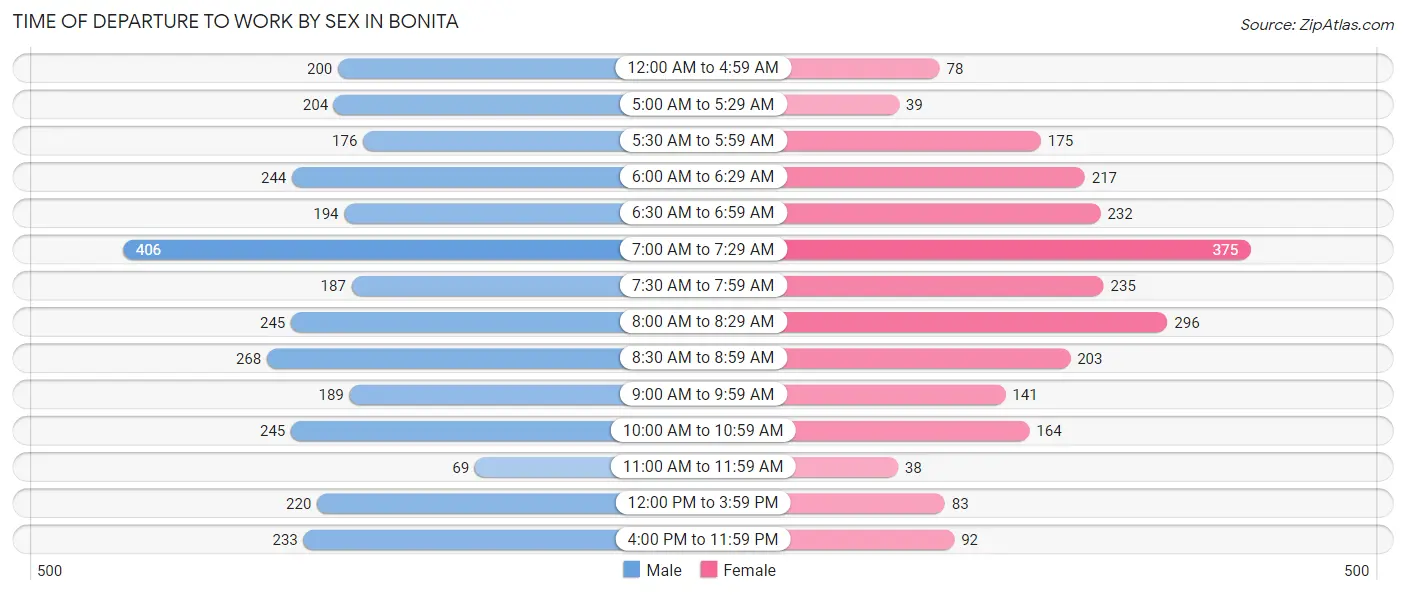
| Time of Departure | Male | Female |
| 12:00 AM to 4:59 AM | 200 (6.5%) | 78 (3.3%) |
| 5:00 AM to 5:29 AM | 204 (6.6%) | 39 (1.7%) |
| 5:30 AM to 5:59 AM | 176 (5.7%) | 175 (7.4%) |
| 6:00 AM to 6:29 AM | 244 (7.9%) | 217 (9.2%) |
| 6:30 AM to 6:59 AM | 194 (6.3%) | 232 (9.8%) |
| 7:00 AM to 7:29 AM | 406 (13.2%) | 375 (15.8%) |
| 7:30 AM to 7:59 AM | 187 (6.1%) | 235 (9.9%) |
| 8:00 AM to 8:29 AM | 245 (8.0%) | 296 (12.5%) |
| 8:30 AM to 8:59 AM | 268 (8.7%) | 203 (8.6%) |
| 9:00 AM to 9:59 AM | 189 (6.1%) | 141 (5.9%) |
| 10:00 AM to 10:59 AM | 245 (8.0%) | 164 (6.9%) |
| 11:00 AM to 11:59 AM | 69 (2.2%) | 38 (1.6%) |
| 12:00 PM to 3:59 PM | 220 (7.1%) | 83 (3.5%) |
| 4:00 PM to 11:59 PM | 233 (7.6%) | 92 (3.9%) |
| Total | 3,080 (100.0%) | 2,368 (100.0%) |
Housing Occupancy in Bonita
Occupancy by Ownership in Bonita
Of the total 4,769 dwellings in Bonita, owner-occupied units account for 3,754 (78.7%), while renter-occupied units make up 1,015 (21.3%).
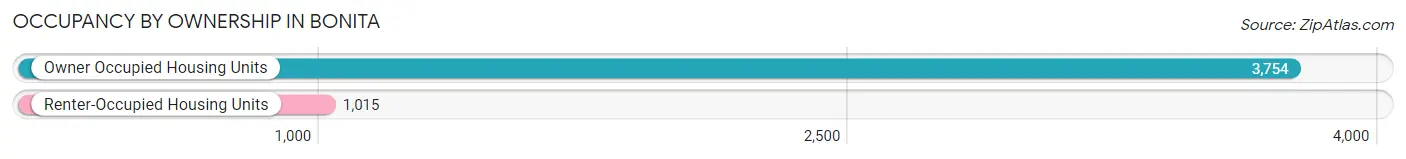
| Occupancy | # Housing Units | % Housing Units |
| Owner Occupied Housing Units | 3,754 | 78.7% |
| Renter-Occupied Housing Units | 1,015 | 21.3% |
| Total Occupied Housing Units | 4,769 | 100.0% |
Occupancy by Household Size in Bonita
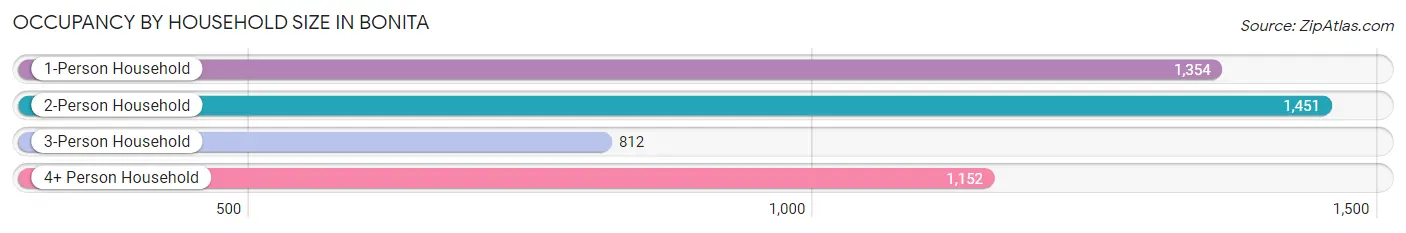
| Household Size | # Housing Units | % Housing Units |
| 1-Person Household | 1,354 | 28.4% |
| 2-Person Household | 1,451 | 30.4% |
| 3-Person Household | 812 | 17.0% |
| 4+ Person Household | 1,152 | 24.2% |
| Total Housing Units | 4,769 | 100.0% |
Occupancy by Ownership by Household Size in Bonita
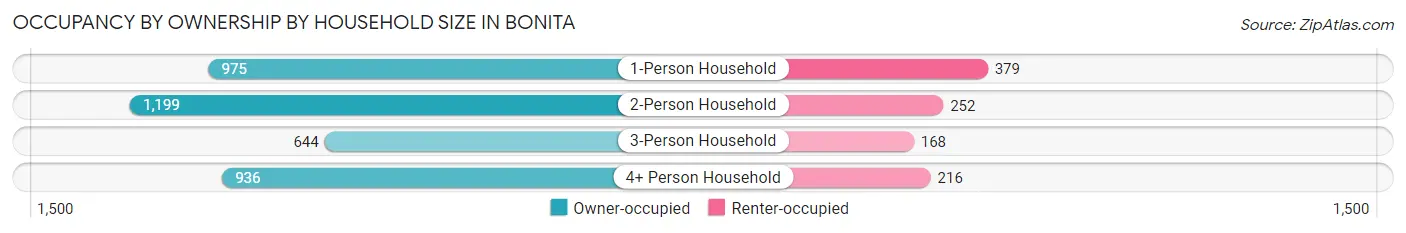
| Household Size | Owner-occupied | Renter-occupied |
| 1-Person Household | 975 (72.0%) | 379 (28.0%) |
| 2-Person Household | 1,199 (82.6%) | 252 (17.4%) |
| 3-Person Household | 644 (79.3%) | 168 (20.7%) |
| 4+ Person Household | 936 (81.2%) | 216 (18.8%) |
| Total Housing Units | 3,754 (78.7%) | 1,015 (21.3%) |
Occupancy by Educational Attainment in Bonita
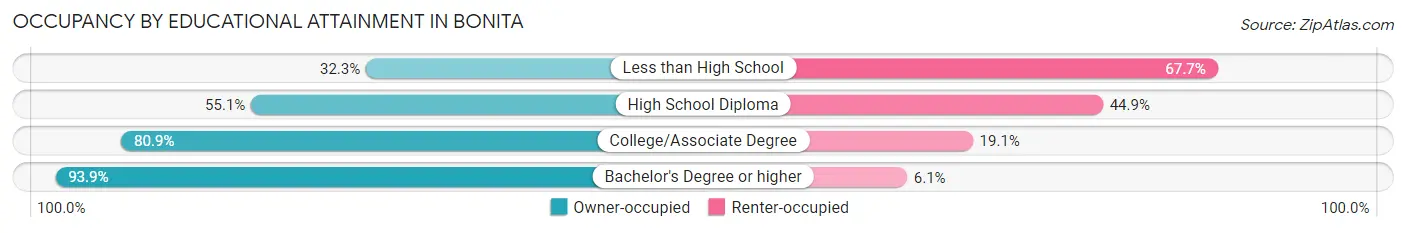
| Household Size | Owner-occupied | Renter-occupied |
| Less than High School | 105 (32.3%) | 220 (67.7%) |
| High School Diploma | 455 (55.1%) | 371 (44.9%) |
| College/Associate Degree | 1,264 (80.9%) | 299 (19.1%) |
| Bachelor's Degree or higher | 1,930 (93.9%) | 125 (6.1%) |
Occupancy by Age of Householder in Bonita
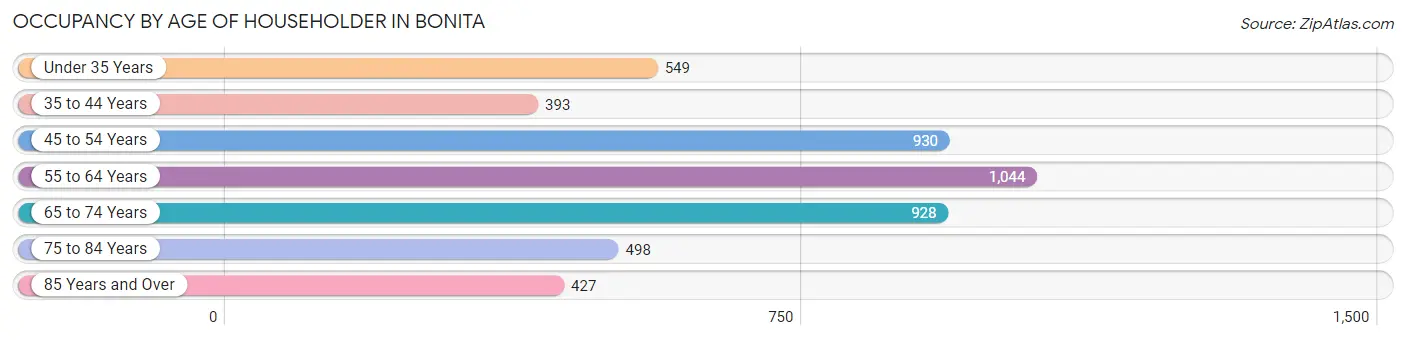
| Age Bracket | # Households | % Households |
| Under 35 Years | 549 | 11.5% |
| 35 to 44 Years | 393 | 8.2% |
| 45 to 54 Years | 930 | 19.5% |
| 55 to 64 Years | 1,044 | 21.9% |
| 65 to 74 Years | 928 | 19.5% |
| 75 to 84 Years | 498 | 10.4% |
| 85 Years and Over | 427 | 8.9% |
| Total | 4,769 | 100.0% |
Housing Finances in Bonita
Median Income by Occupancy in Bonita
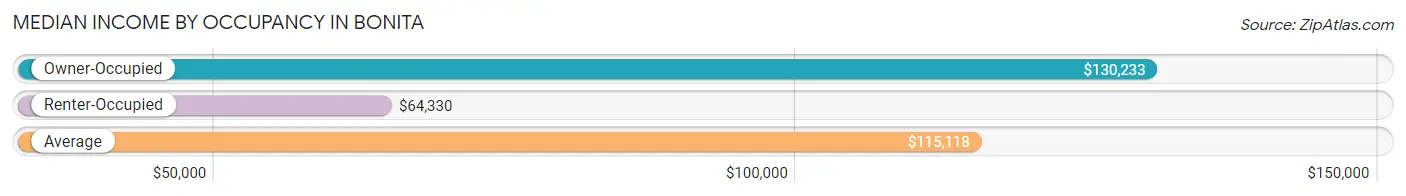
| Occupancy Type | # Households | Median Income |
| Owner-Occupied | 3,754 (78.7%) | $130,233 |
| Renter-Occupied | 1,015 (21.3%) | $64,330 |
| Average | 4,769 (100.0%) | $115,118 |
Occupancy by Householder Income Bracket in Bonita
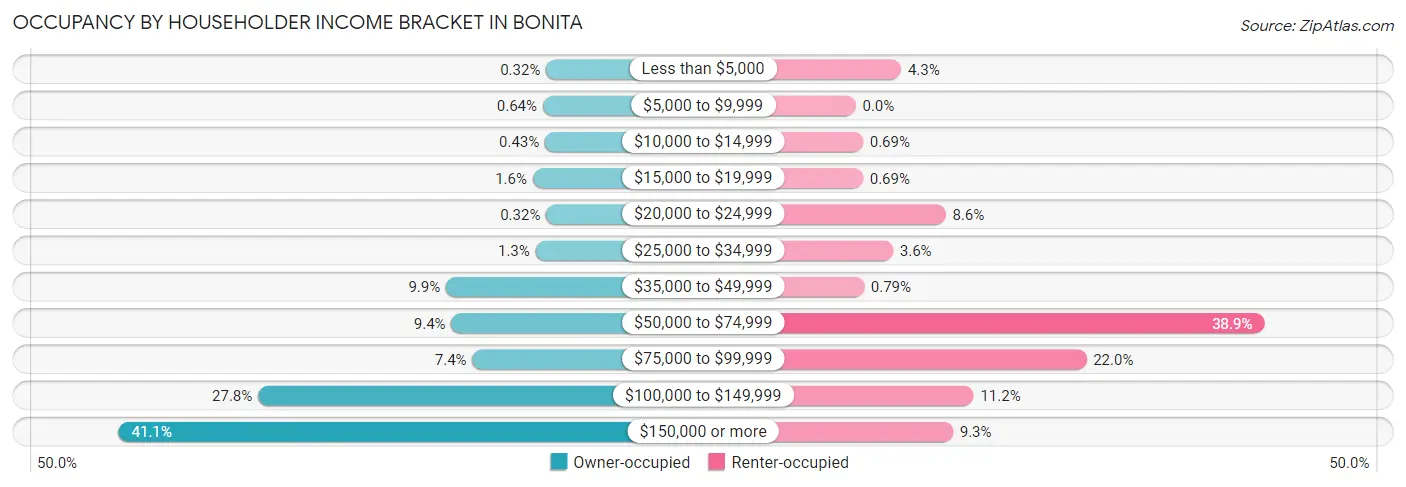
| Income Bracket | Owner-occupied | Renter-occupied |
| Less than $5,000 | 12 (0.3%) | 44 (4.3%) |
| $5,000 to $9,999 | 24 (0.6%) | 0 (0.0%) |
| $10,000 to $14,999 | 16 (0.4%) | 7 (0.7%) |
| $15,000 to $19,999 | 60 (1.6%) | 7 (0.7%) |
| $20,000 to $24,999 | 12 (0.3%) | 87 (8.6%) |
| $25,000 to $34,999 | 50 (1.3%) | 36 (3.5%) |
| $35,000 to $49,999 | 370 (9.9%) | 8 (0.8%) |
| $50,000 to $74,999 | 351 (9.3%) | 395 (38.9%) |
| $75,000 to $99,999 | 276 (7.3%) | 223 (22.0%) |
| $100,000 to $149,999 | 1,042 (27.8%) | 114 (11.2%) |
| $150,000 or more | 1,541 (41.0%) | 94 (9.3%) |
| Total | 3,754 (100.0%) | 1,015 (100.0%) |
Monthly Housing Cost Tiers in Bonita
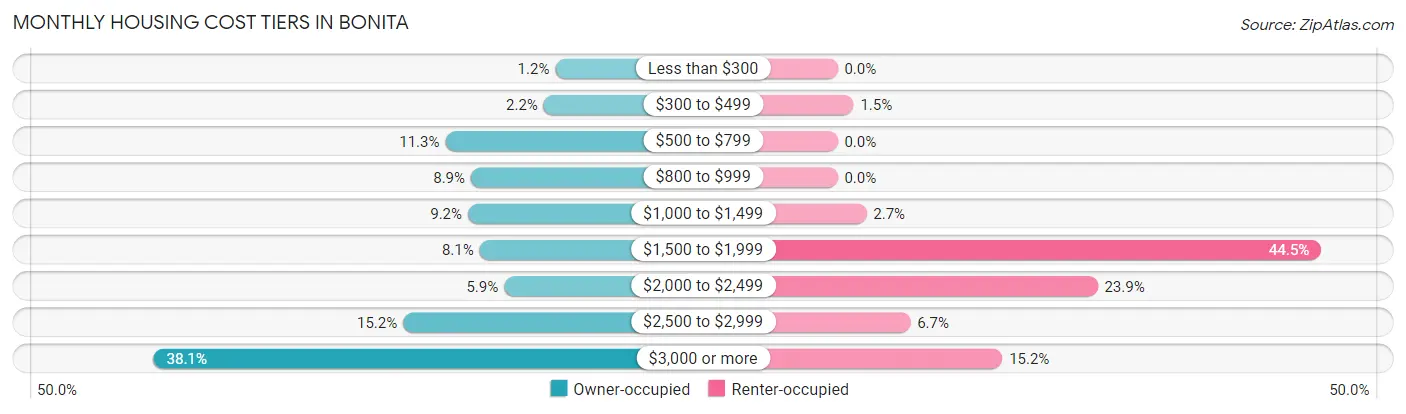
| Monthly Cost | Owner-occupied | Renter-occupied |
| Less than $300 | 43 (1.1%) | 0 (0.0%) |
| $300 to $499 | 83 (2.2%) | 15 (1.5%) |
| $500 to $799 | 423 (11.3%) | 0 (0.0%) |
| $800 to $999 | 335 (8.9%) | 0 (0.0%) |
| $1,000 to $1,499 | 345 (9.2%) | 27 (2.7%) |
| $1,500 to $1,999 | 305 (8.1%) | 452 (44.5%) |
| $2,000 to $2,499 | 220 (5.9%) | 243 (23.9%) |
| $2,500 to $2,999 | 569 (15.2%) | 68 (6.7%) |
| $3,000 or more | 1,431 (38.1%) | 154 (15.2%) |
| Total | 3,754 (100.0%) | 1,015 (100.0%) |
Physical Housing Characteristics in Bonita
Housing Structures in Bonita
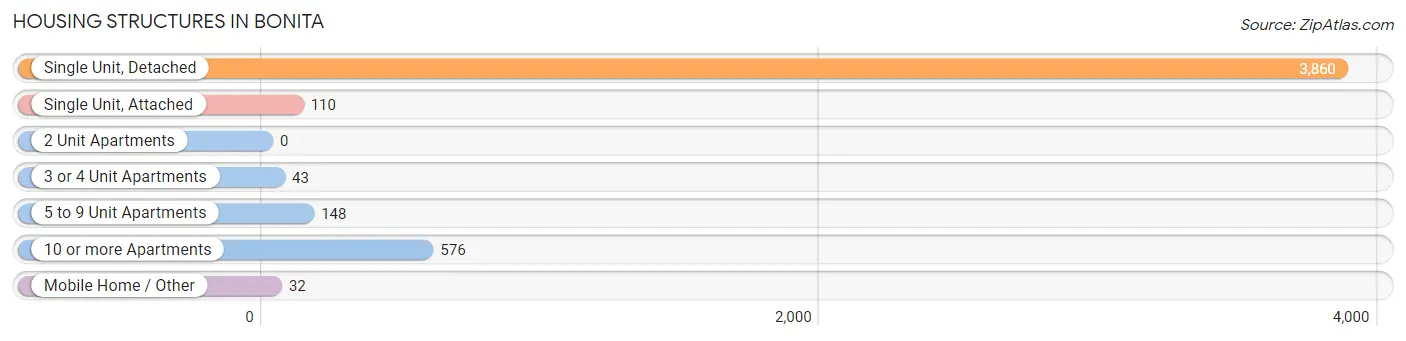
| Structure Type | # Housing Units | % Housing Units |
| Single Unit, Detached | 3,860 | 80.9% |
| Single Unit, Attached | 110 | 2.3% |
| 2 Unit Apartments | 0 | 0.0% |
| 3 or 4 Unit Apartments | 43 | 0.9% |
| 5 to 9 Unit Apartments | 148 | 3.1% |
| 10 or more Apartments | 576 | 12.1% |
| Mobile Home / Other | 32 | 0.7% |
| Total | 4,769 | 100.0% |
Housing Structures by Occupancy in Bonita
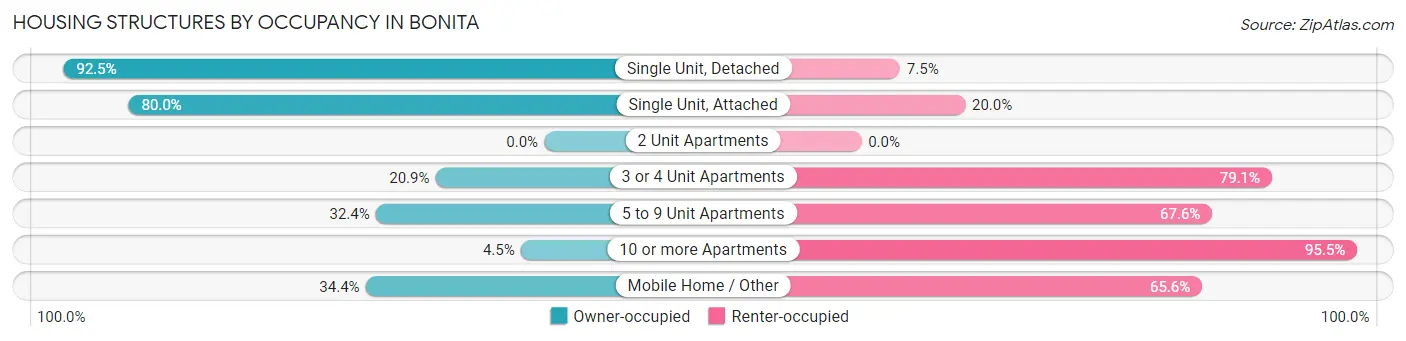
| Structure Type | Owner-occupied | Renter-occupied |
| Single Unit, Detached | 3,572 (92.5%) | 288 (7.5%) |
| Single Unit, Attached | 88 (80.0%) | 22 (20.0%) |
| 2 Unit Apartments | 0 (0.0%) | 0 (0.0%) |
| 3 or 4 Unit Apartments | 9 (20.9%) | 34 (79.1%) |
| 5 to 9 Unit Apartments | 48 (32.4%) | 100 (67.6%) |
| 10 or more Apartments | 26 (4.5%) | 550 (95.5%) |
| Mobile Home / Other | 11 (34.4%) | 21 (65.6%) |
| Total | 3,754 (78.7%) | 1,015 (21.3%) |
Housing Structures by Number of Rooms in Bonita
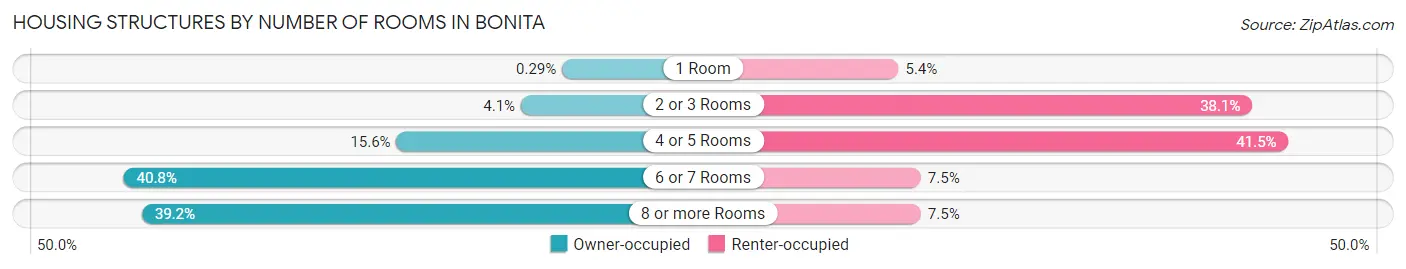
| Number of Rooms | Owner-occupied | Renter-occupied |
| 1 Room | 11 (0.3%) | 55 (5.4%) |
| 2 or 3 Rooms | 154 (4.1%) | 387 (38.1%) |
| 4 or 5 Rooms | 586 (15.6%) | 421 (41.5%) |
| 6 or 7 Rooms | 1,533 (40.8%) | 76 (7.5%) |
| 8 or more Rooms | 1,470 (39.2%) | 76 (7.5%) |
| Total | 3,754 (100.0%) | 1,015 (100.0%) |
Housing Structure by Heating Type in Bonita
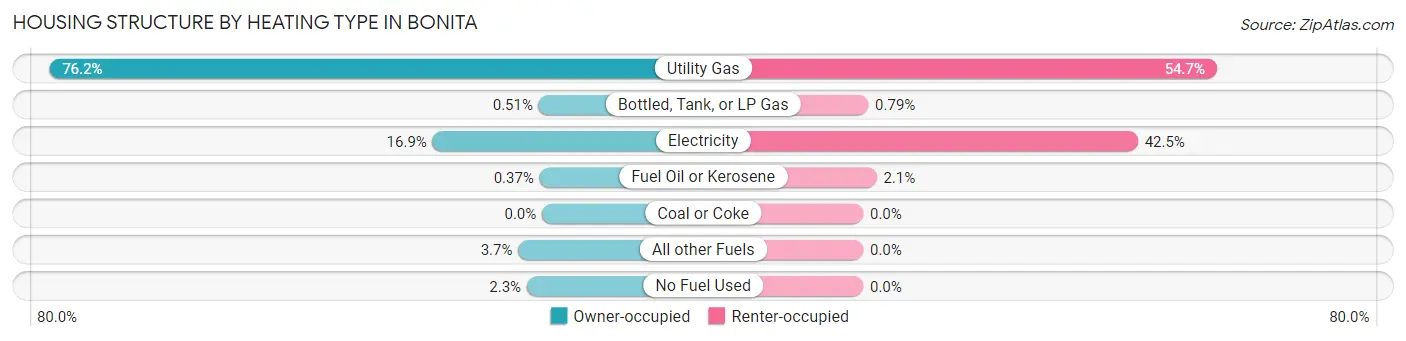
| Heating Type | Owner-occupied | Renter-occupied |
| Utility Gas | 2,860 (76.2%) | 555 (54.7%) |
| Bottled, Tank, or LP Gas | 19 (0.5%) | 8 (0.8%) |
| Electricity | 635 (16.9%) | 431 (42.5%) |
| Fuel Oil or Kerosene | 14 (0.4%) | 21 (2.1%) |
| Coal or Coke | 0 (0.0%) | 0 (0.0%) |
| All other Fuels | 138 (3.7%) | 0 (0.0%) |
| No Fuel Used | 88 (2.3%) | 0 (0.0%) |
| Total | 3,754 (100.0%) | 1,015 (100.0%) |
Household Vehicle Usage in Bonita
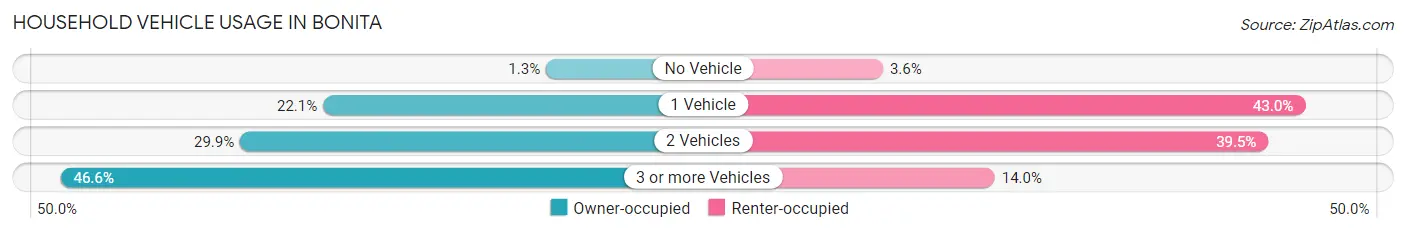
| Vehicles per Household | Owner-occupied | Renter-occupied |
| No Vehicle | 50 (1.3%) | 36 (3.5%) |
| 1 Vehicle | 831 (22.1%) | 436 (43.0%) |
| 2 Vehicles | 1,122 (29.9%) | 401 (39.5%) |
| 3 or more Vehicles | 1,751 (46.6%) | 142 (14.0%) |
| Total | 3,754 (100.0%) | 1,015 (100.0%) |
Real Estate & Mortgages in Bonita
Real Estate and Mortgage Overview in Bonita
| Characteristic | Without Mortgage | With Mortgage |
| Housing Units | 1,181 | 2,573 |
| Median Property Value | $782,500 | $860,100 |
| Median Household Income | $97,386 | $1,231 |
| Monthly Housing Costs | $816 | $1,431 |
| Real Estate Taxes | $3,747 | $16 |
Property Value by Mortgage Status in Bonita
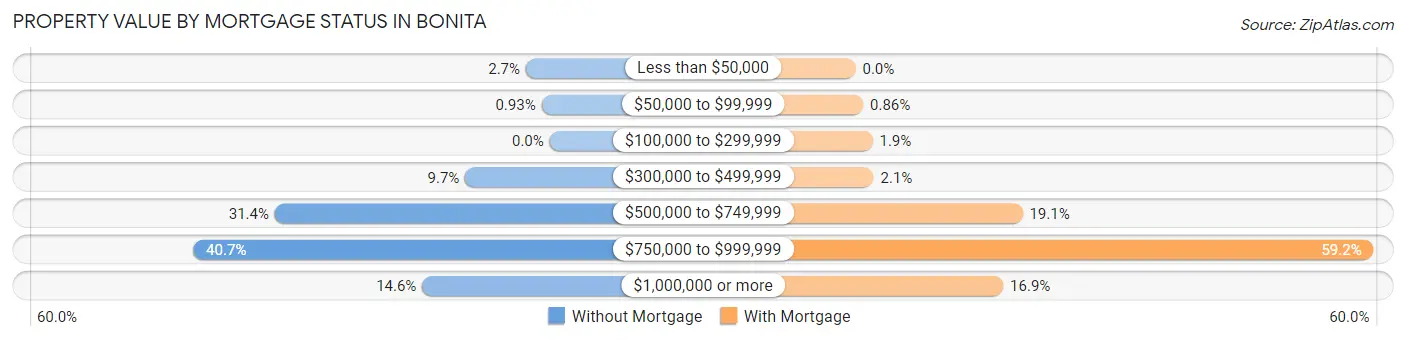
| Property Value | Without Mortgage | With Mortgage |
| Less than $50,000 | 32 (2.7%) | 0 (0.0%) |
| $50,000 to $99,999 | 11 (0.9%) | 22 (0.9%) |
| $100,000 to $299,999 | 0 (0.0%) | 50 (1.9%) |
| $300,000 to $499,999 | 114 (9.7%) | 53 (2.1%) |
| $500,000 to $749,999 | 371 (31.4%) | 491 (19.1%) |
| $750,000 to $999,999 | 481 (40.7%) | 1,523 (59.2%) |
| $1,000,000 or more | 172 (14.6%) | 434 (16.9%) |
| Total | 1,181 (100.0%) | 2,573 (100.0%) |
Household Income by Mortgage Status in Bonita
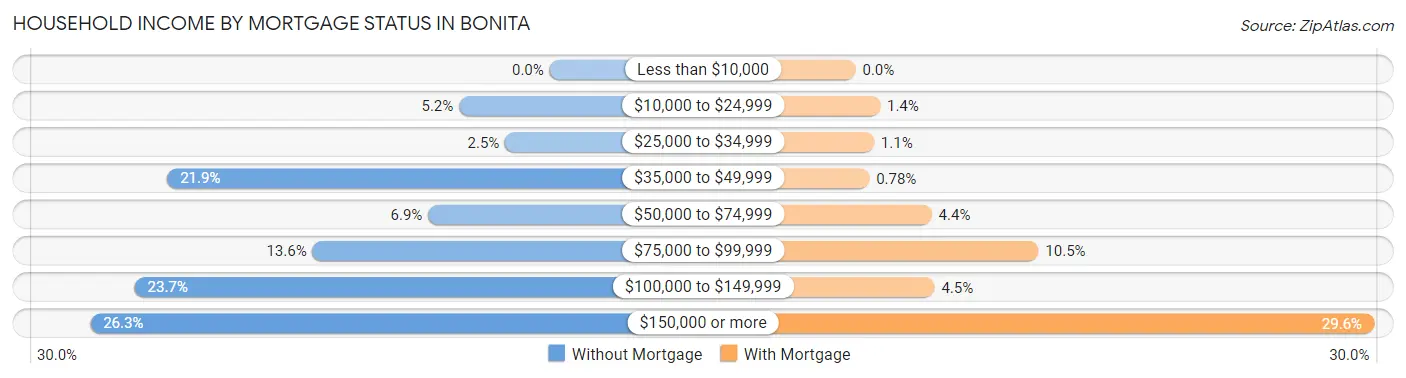
| Household Income | Without Mortgage | With Mortgage |
| Less than $10,000 | 0 (0.0%) | 0 (0.0%) |
| $10,000 to $24,999 | 61 (5.2%) | 36 (1.4%) |
| $25,000 to $34,999 | 30 (2.5%) | 27 (1.1%) |
| $35,000 to $49,999 | 258 (21.8%) | 20 (0.8%) |
| $50,000 to $74,999 | 82 (6.9%) | 112 (4.3%) |
| $75,000 to $99,999 | 160 (13.6%) | 269 (10.4%) |
| $100,000 to $149,999 | 280 (23.7%) | 116 (4.5%) |
| $150,000 or more | 310 (26.3%) | 762 (29.6%) |
| Total | 1,181 (100.0%) | 2,573 (100.0%) |
Property Value to Household Income Ratio in Bonita
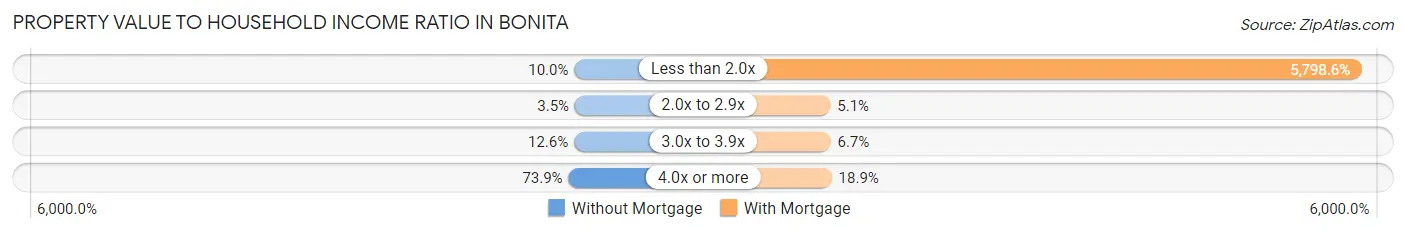
| Value-to-Income Ratio | Without Mortgage | With Mortgage |
| Less than 2.0x | 118 (10.0%) | 149,198 (5,798.6%) |
| 2.0x to 2.9x | 41 (3.5%) | 131 (5.1%) |
| 3.0x to 3.9x | 149 (12.6%) | 173 (6.7%) |
| 4.0x or more | 873 (73.9%) | 485 (18.9%) |
| Total | 1,181 (100.0%) | 2,573 (100.0%) |
Real Estate Taxes by Mortgage Status in Bonita
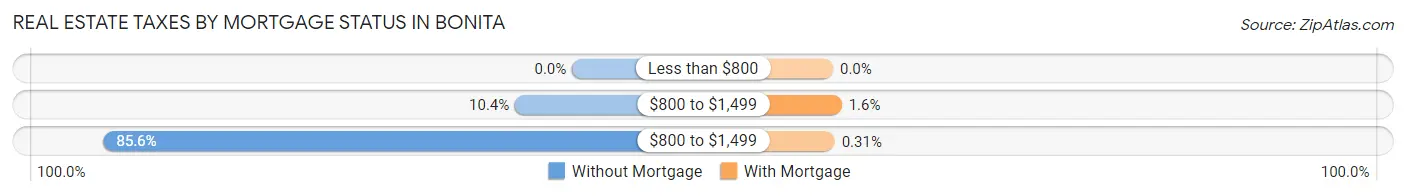
| Property Taxes | Without Mortgage | With Mortgage |
| Less than $800 | 0 (0.0%) | 0 (0.0%) |
| $800 to $1,499 | 123 (10.4%) | 41 (1.6%) |
| $800 to $1,499 | 1,011 (85.6%) | 8 (0.3%) |
| Total | 1,181 (100.0%) | 2,573 (100.0%) |
Health & Disability in Bonita
Health Insurance Coverage by Age in Bonita

| Age Bracket | With Coverage | Without Coverage |
| Under 6 Years | 971 (100.0%) | 0 (0.0%) |
| 6 to 18 Years | 1,586 (96.8%) | 53 (3.2%) |
| 19 to 25 Years | 954 (86.7%) | 147 (13.4%) |
| 26 to 34 Years | 1,445 (89.2%) | 175 (10.8%) |
| 35 to 44 Years | 1,197 (95.7%) | 54 (4.3%) |
| 45 to 54 Years | 1,727 (93.9%) | 113 (6.1%) |
| 55 to 64 Years | 1,809 (94.2%) | 111 (5.8%) |
| 65 to 74 Years | 1,626 (98.6%) | 24 (1.5%) |
| 75 Years and older | 1,299 (99.8%) | 3 (0.2%) |
| Total | 12,614 (94.9%) | 680 (5.1%) |
Health Insurance Coverage by Citizenship Status in Bonita
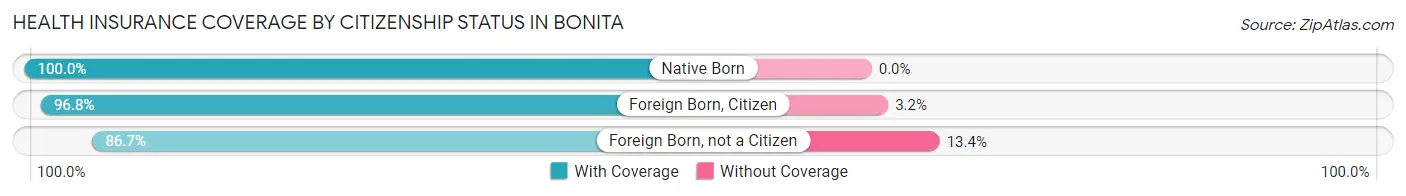
| Citizenship Status | With Coverage | Without Coverage |
| Native Born | 971 (100.0%) | 0 (0.0%) |
| Foreign Born, Citizen | 1,586 (96.8%) | 53 (3.2%) |
| Foreign Born, not a Citizen | 954 (86.7%) | 147 (13.4%) |
Health Insurance Coverage by Household Income in Bonita
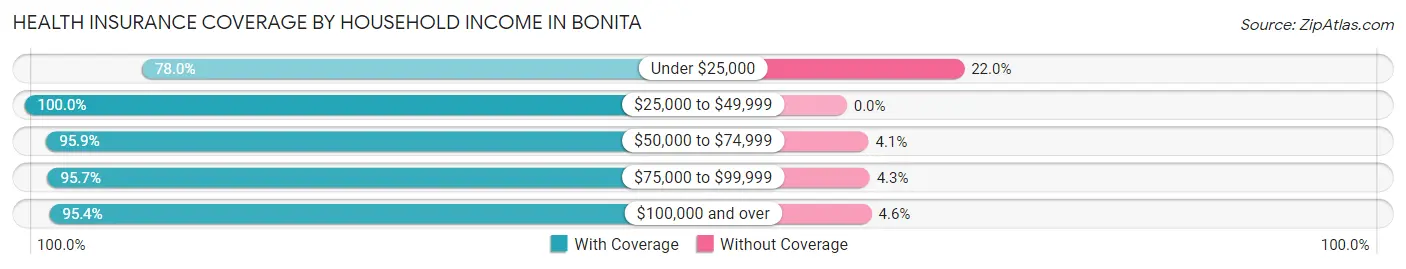
| Household Income | With Coverage | Without Coverage |
| Under $25,000 | 390 (78.0%) | 110 (22.0%) |
| $25,000 to $49,999 | 602 (100.0%) | 0 (0.0%) |
| $50,000 to $74,999 | 1,627 (95.9%) | 69 (4.1%) |
| $75,000 to $99,999 | 1,045 (95.7%) | 47 (4.3%) |
| $100,000 and over | 8,928 (95.4%) | 434 (4.6%) |
Public vs Private Health Insurance Coverage by Age in Bonita
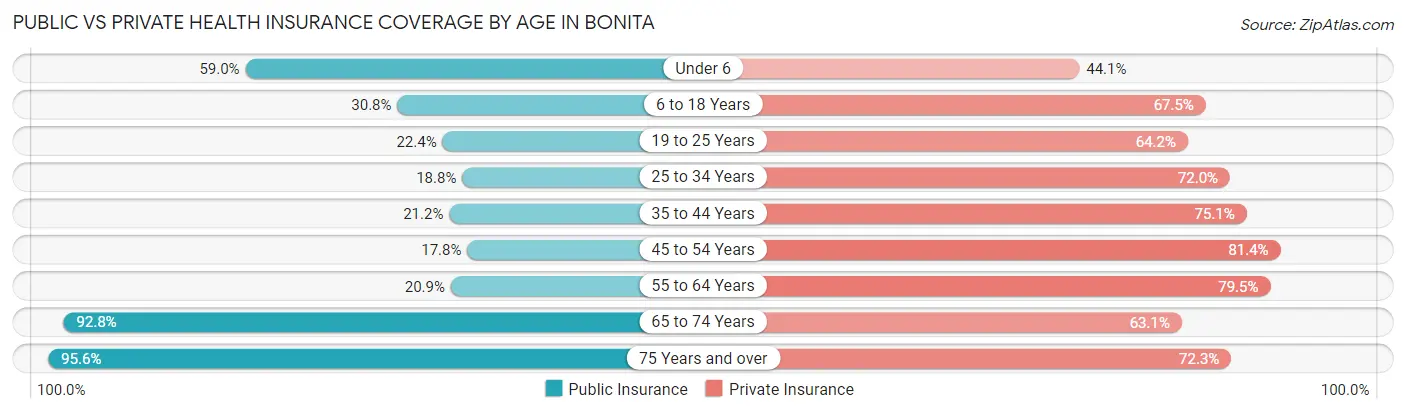
| Age Bracket | Public Insurance | Private Insurance |
| Under 6 | 573 (59.0%) | 428 (44.1%) |
| 6 to 18 Years | 505 (30.8%) | 1,107 (67.5%) |
| 19 to 25 Years | 247 (22.4%) | 707 (64.2%) |
| 25 to 34 Years | 304 (18.8%) | 1,167 (72.0%) |
| 35 to 44 Years | 265 (21.2%) | 940 (75.1%) |
| 45 to 54 Years | 328 (17.8%) | 1,498 (81.4%) |
| 55 to 64 Years | 401 (20.9%) | 1,527 (79.5%) |
| 65 to 74 Years | 1,531 (92.8%) | 1,041 (63.1%) |
| 75 Years and over | 1,245 (95.6%) | 941 (72.3%) |
| Total | 5,399 (40.6%) | 9,356 (70.4%) |
Disability Status by Sex by Age in Bonita
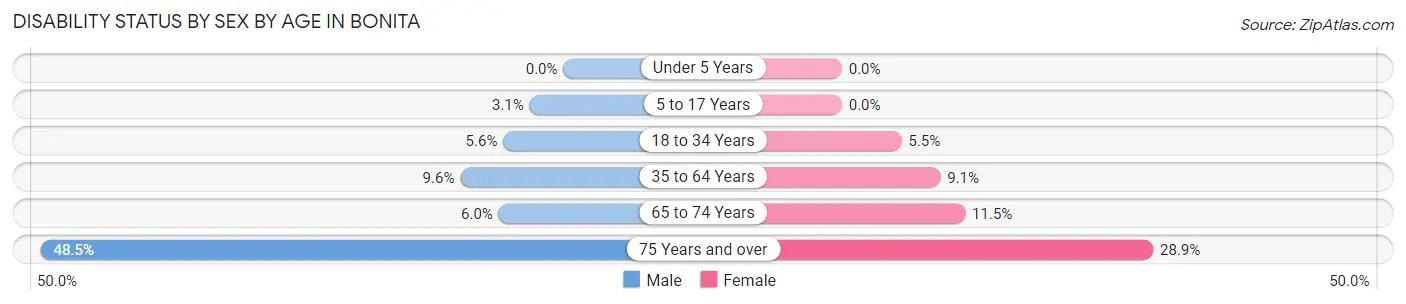
| Age Bracket | Male | Female |
| Under 5 Years | 0 (0.0%) | 0 (0.0%) |
| 5 to 17 Years | 30 (3.1%) | 0 (0.0%) |
| 18 to 34 Years | 78 (5.6%) | 79 (5.5%) |
| 35 to 64 Years | 247 (9.6%) | 222 (9.1%) |
| 65 to 74 Years | 56 (6.0%) | 82 (11.5%) |
| 75 Years and over | 148 (48.5%) | 288 (28.9%) |
Disability Class by Sex by Age in Bonita
Disability Class: Hearing Difficulty
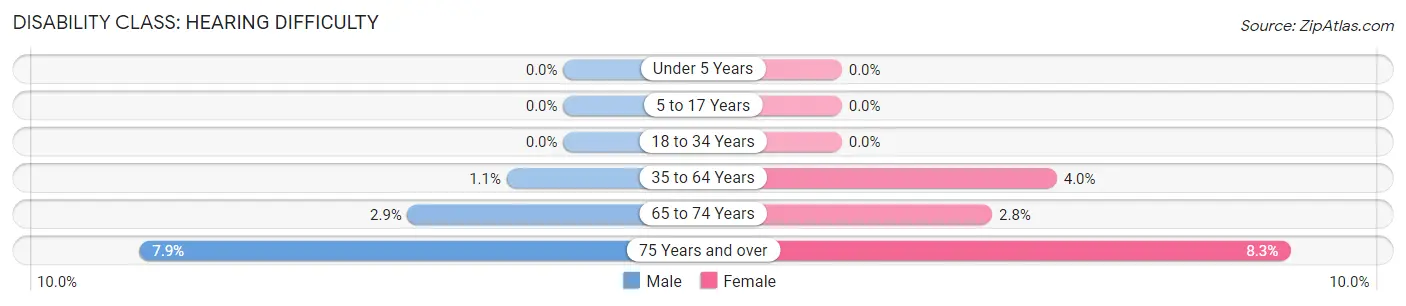
| Age Bracket | Male | Female |
| Under 5 Years | 0 (0.0%) | 0 (0.0%) |
| 5 to 17 Years | 0 (0.0%) | 0 (0.0%) |
| 18 to 34 Years | 0 (0.0%) | 0 (0.0%) |
| 35 to 64 Years | 27 (1.1%) | 97 (4.0%) |
| 65 to 74 Years | 27 (2.9%) | 20 (2.8%) |
| 75 Years and over | 24 (7.9%) | 83 (8.3%) |
Disability Class: Vision Difficulty
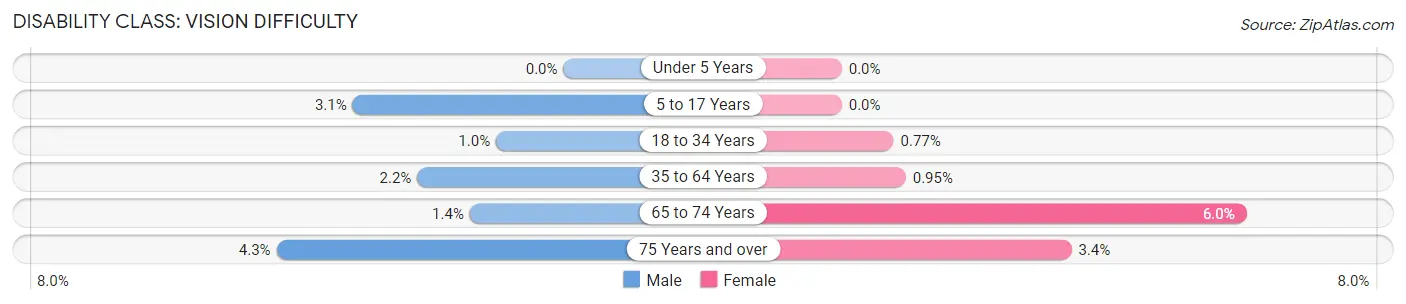
| Age Bracket | Male | Female |
| Under 5 Years | 0 (0.0%) | 0 (0.0%) |
| 5 to 17 Years | 30 (3.1%) | 0 (0.0%) |
| 18 to 34 Years | 14 (1.0%) | 11 (0.8%) |
| 35 to 64 Years | 56 (2.2%) | 23 (0.9%) |
| 65 to 74 Years | 13 (1.4%) | 43 (6.0%) |
| 75 Years and over | 13 (4.3%) | 34 (3.4%) |
Disability Class: Cognitive Difficulty
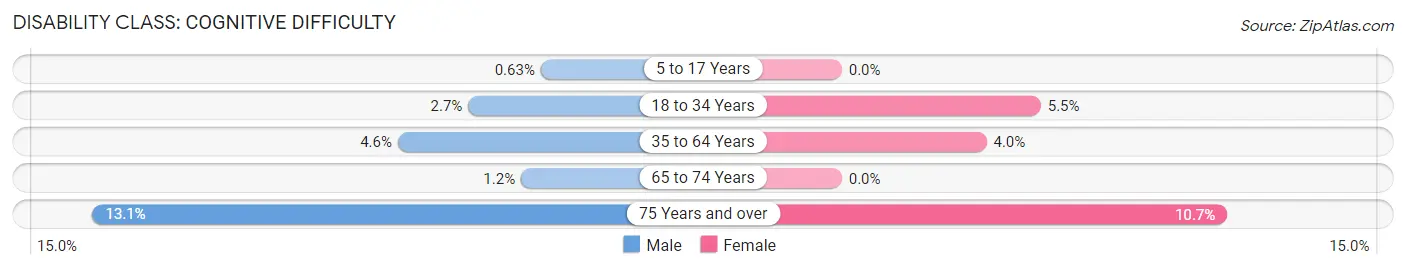
| Age Bracket | Male | Female |
| 5 to 17 Years | 6 (0.6%) | 0 (0.0%) |
| 18 to 34 Years | 37 (2.6%) | 79 (5.5%) |
| 35 to 64 Years | 119 (4.6%) | 98 (4.0%) |
| 65 to 74 Years | 11 (1.2%) | 0 (0.0%) |
| 75 Years and over | 40 (13.1%) | 107 (10.7%) |
Disability Class: Ambulatory Difficulty
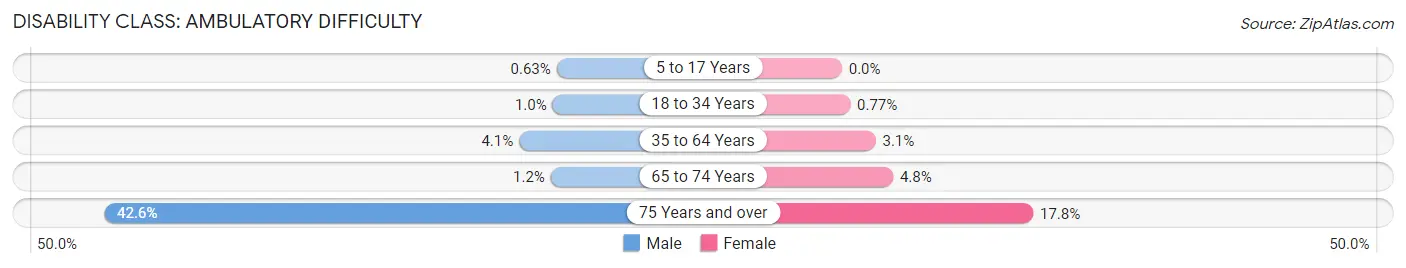
| Age Bracket | Male | Female |
| 5 to 17 Years | 6 (0.6%) | 0 (0.0%) |
| 18 to 34 Years | 14 (1.0%) | 11 (0.8%) |
| 35 to 64 Years | 106 (4.1%) | 76 (3.1%) |
| 65 to 74 Years | 11 (1.2%) | 34 (4.8%) |
| 75 Years and over | 130 (42.6%) | 177 (17.7%) |
Disability Class: Self-Care Difficulty
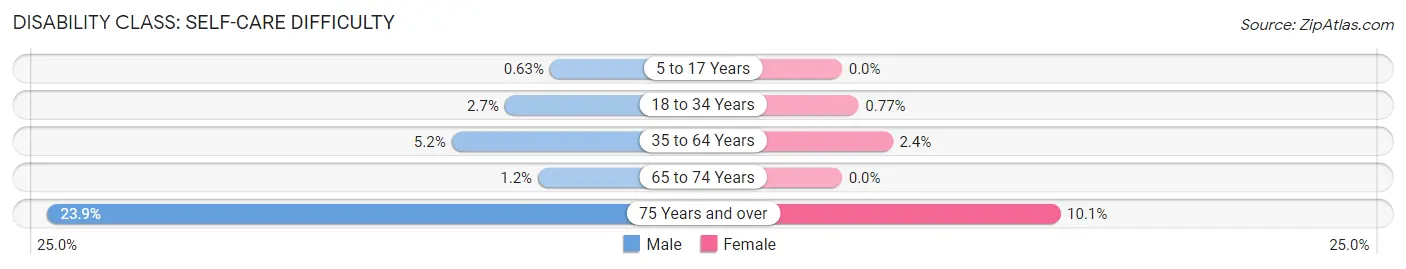
| Age Bracket | Male | Female |
| 5 to 17 Years | 6 (0.6%) | 0 (0.0%) |
| 18 to 34 Years | 38 (2.7%) | 11 (0.8%) |
| 35 to 64 Years | 134 (5.2%) | 57 (2.4%) |
| 65 to 74 Years | 11 (1.2%) | 0 (0.0%) |
| 75 Years and over | 73 (23.9%) | 101 (10.1%) |
Technology Access in Bonita
Computing Device Access in Bonita
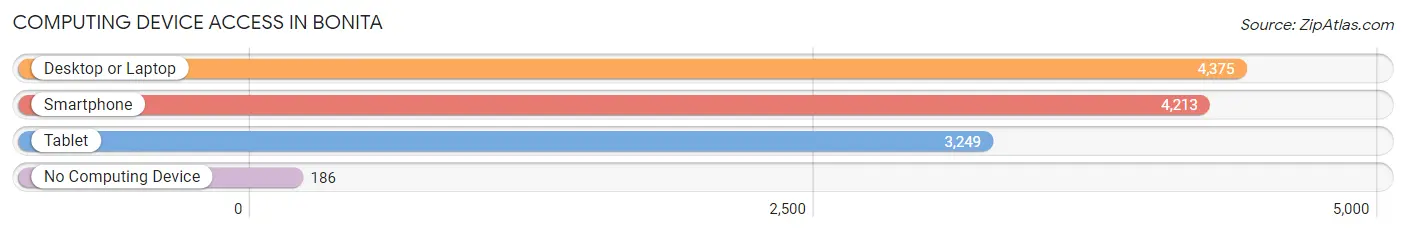
| Device Type | # Households | % Households |
| Desktop or Laptop | 4,375 | 91.7% |
| Smartphone | 4,213 | 88.3% |
| Tablet | 3,249 | 68.1% |
| No Computing Device | 186 | 3.9% |
| Total | 4,769 | 100.0% |
Internet Access in Bonita
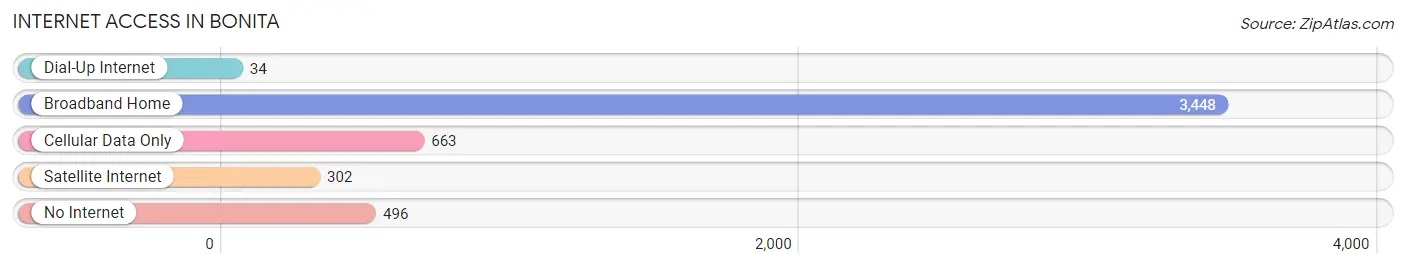
| Internet Type | # Households | % Households |
| Dial-Up Internet | 34 | 0.7% |
| Broadband Home | 3,448 | 72.3% |
| Cellular Data Only | 663 | 13.9% |
| Satellite Internet | 302 | 6.3% |
| No Internet | 496 | 10.4% |
| Total | 4,769 | 100.0% |
Bonita Summary
Bonita is a census-designated place located in San Diego County, California. It is located in the southeastern corner of the county, just south of Chula Vista and east of San Diego. The population was 12,538 at the 2010 census, up from 11,626 at the 2000 census.
History
The area now known as Bonita was originally inhabited by the Kumeyaay people. The first European to visit the area was Juan Rodriguez Cabrillo in 1542. The area was part of the Rancho de la Nacion, a Mexican land grant given to Juan Maria Osuna in 1845. The area was then part of the Rancho de los Coches, a Mexican land grant given to Ysidro María Alvarado in 1846.
In 1871, the area was purchased by Frank Kimball and his brother Warren, who established the Sweetwater Dam and Reservoir. The area was then known as the Sweetwater Valley. In 1887, the Kimballs sold the land to the Bonita Land and Water Company, which subdivided the land and sold it for agricultural use. The area was then known as the town of Bonita.
Geography
Bonita is located at 32°35'25" North, 117°02'39" West (32.5903, -117.0440). It is located in the southeastern corner of San Diego County, just south of Chula Vista and east of San Diego. It is bordered by the cities of Chula Vista and San Diego to the north, National City to the west, and the unincorporated community of Lincoln Acres to the south.
According to the United States Census Bureau, the CDP has a total area of 4.2 square miles (10.8 km2), all of it land.
Economy
The economy of Bonita is largely based on agriculture and tourism. The area is home to several farms, including the Bonita Valley Farm, which grows a variety of fruits and vegetables. The area is also home to several tourist attractions, including the Sweetwater Reservoir, the Bonita Museum, and the Bonita Valley Golf Course.
Demographics
As of the census of 2000, there were 11,626 people, 4,039 households, and 3,072 families residing in the CDP. The population density was 2,764.3 people per square mile (1,068.2/km2). There were 4,179 housing units at an average density of 990.2 per square mile (382.2/km2). The racial makeup of the CDP was 74.2% White, 1.2% African American, 0.7% Native American, 8.2% Asian, 0.2% Pacific Islander, 11.7% from other races, and 3.8% from two or more races. Hispanic or Latino of any race were 24.2% of the population.
There were 4,039 households, out of which 37.2% had children under the age of 18 living with them, 57.2% were married couples living together, 12.2% had a female householder with no husband present, and 25.2% were non-families. 19.2% of all households were made up of individuals, and 6.2% had someone living alone who was 65 years of age or older. The average household size was 2.87 and the average family size was 3.30.
In the CDP, the population was spread out, with 27.2% under the age of 18, 8.2% from 18 to 24, 30.2% from 25 to 44, 24.2% from 45 to 64, and 10.2% who were 65 years of age or older. The median age was 36 years. For every 100 females, there were 97.2 males. For every 100 females age 18 and over, there were 94.2 males.
The median income for a household in the CDP was $50,945, and the median income for a family was $55,945. Males had a median income of $41,945 versus $30,945 for females. The per capita income for the CDP was $20,945. About 6.2% of families and 8.2% of the population were below the poverty line, including 10.2% of those under age 18 and 6.2% of those age 65 or over.
Common Questions
What is Per Capita Income in Bonita?
Per Capita income in Bonita is $55,534.
What is the Median Family Income in Bonita?
Median Family Income in Bonita is $146,750.
What is the Median Household income in Bonita?
Median Household Income in Bonita is $115,118.
What is Income or Wage Gap in Bonita?
Income or Wage Gap in Bonita is 45.9%.
Women in Bonita earn 54.1 cents for every dollar earned by a man.
What is Inequality or Gini Index in Bonita?
Inequality or Gini Index in Bonita is 0.43.
What is the Total Population of Bonita?
Total Population of Bonita is 13,473.
What is the Total Male Population of Bonita?
Total Male Population of Bonita is 6,759.
What is the Total Female Population of Bonita?
Total Female Population of Bonita is 6,714.
What is the Ratio of Males per 100 Females in Bonita?
There are 100.67 Males per 100 Females in Bonita.
What is the Ratio of Females per 100 Males in Bonita?
There are 99.33 Females per 100 Males in Bonita.
What is the Median Population Age in Bonita?
Median Population Age in Bonita is 45.2 Years.
What is the Average Family Size in Bonita
Average Family Size in Bonita is 3.4 People.
What is the Average Household Size in Bonita
Average Household Size in Bonita is 2.8 People.
How Large is the Labor Force in Bonita?
There are 7,059 People in the Labor Forcein in Bonita.
What is the Percentage of People in the Labor Force in Bonita?
63.4% of People are in the Labor Force in Bonita.
What is the Unemployment Rate in Bonita?
Unemployment Rate in Bonita is 7.6%.