Cities with the Highest Percentage of Population Employed in Security & Protection in Idaho
RELATED REPORTS & OPTIONS
Security & Protection
Idaho
Compare Cities
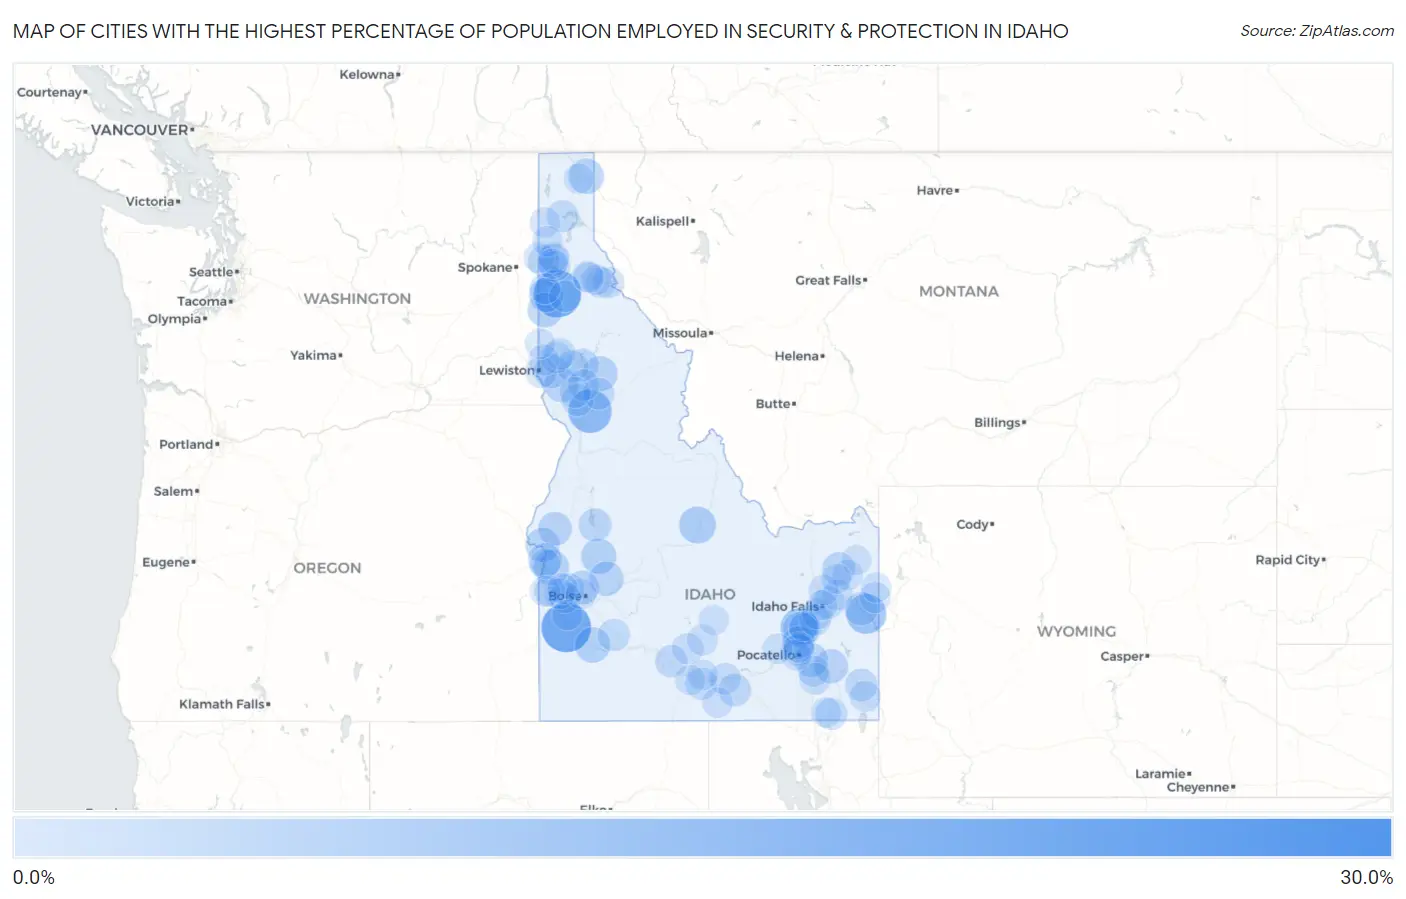
Map of Cities with the Highest Percentage of Population Employed in Security & Protection in Idaho
0.0%
30.0%
Cities with the Highest Percentage of Population Employed in Security & Protection in Idaho
| City | % Employed | vs State | vs National | |
| 1. | Laclede | 28.8% | 1.7%(+27.1)#1 | 2.1%(+26.7)#128 |
| 2. | Murphy | 20.7% | 1.7%(+19.0)#2 | 2.1%(+18.5)#259 |
| 3. | Parkline | 18.5% | 1.7%(+16.8)#3 | 2.1%(+16.4)#316 |
| 4. | Grangeville | 14.3% | 1.7%(+12.6)#4 | 2.1%(+12.2)#532 |
| 5. | Irwin | 11.1% | 1.7%(+9.40)#5 | 2.1%(+8.96)#900 |
| 6. | Moreland | 9.9% | 1.7%(+8.21)#6 | 2.1%(+7.77)#1,107 |
| 7. | Challis | 7.9% | 1.7%(+6.16)#7 | 2.1%(+5.73)#1,694 |
| 8. | Grand View | 6.6% | 1.7%(+4.88)#8 | 2.1%(+4.45)#2,305 |
| 9. | New Plymouth | 6.4% | 1.7%(+4.72)#9 | 2.1%(+4.29)#2,404 |
| 10. | Moyie Springs | 6.4% | 1.7%(+4.72)#10 | 2.1%(+4.29)#2,406 |
| 11. | Crouch | 6.3% | 1.7%(+4.59)#11 | 2.1%(+4.16)#2,489 |
| 12. | Weippe | 6.1% | 1.7%(+4.42)#12 | 2.1%(+3.99)#2,597 |
| 13. | De Smet | 5.7% | 1.7%(+4.00)#13 | 2.1%(+3.57)#2,959 |
| 14. | Idaho City | 5.4% | 1.7%(+3.69)#14 | 2.1%(+3.26)#3,252 |
| 15. | Plummer | 5.4% | 1.7%(+3.65)#15 | 2.1%(+3.22)#3,283 |
| 16. | Weiser | 5.3% | 1.7%(+3.59)#16 | 2.1%(+3.15)#3,369 |
| 17. | Bancroft | 5.1% | 1.7%(+3.43)#17 | 2.1%(+2.99)#3,537 |
| 18. | Winchester | 5.1% | 1.7%(+3.39)#18 | 2.1%(+2.95)#3,584 |
| 19. | Lapwai | 5.0% | 1.7%(+3.28)#19 | 2.1%(+2.85)#3,685 |
| 20. | Midvale | 4.9% | 1.7%(+3.22)#20 | 2.1%(+2.79)#3,762 |
| 21. | Payette | 4.9% | 1.7%(+3.14)#21 | 2.1%(+2.71)#3,859 |
| 22. | Hidden Springs | 4.8% | 1.7%(+3.12)#22 | 2.1%(+2.69)#3,890 |
| 23. | Inkom | 4.8% | 1.7%(+3.12)#23 | 2.1%(+2.69)#3,891 |
| 24. | Riverside | 4.8% | 1.7%(+3.10)#24 | 2.1%(+2.66)#3,915 |
| 25. | Swan Valley | 4.5% | 1.7%(+2.79)#25 | 2.1%(+2.36)#4,316 |
| 26. | Parker | 4.1% | 1.7%(+2.41)#26 | 2.1%(+1.98)#4,877 |
| 27. | Cascade | 4.0% | 1.7%(+2.32)#27 | 2.1%(+1.89)#5,028 |
| 28. | Fort Hall | 4.0% | 1.7%(+2.26)#28 | 2.1%(+1.83)#5,140 |
| 29. | Orofino | 3.8% | 1.7%(+2.09)#29 | 2.1%(+1.66)#5,481 |
| 30. | Georgetown | 3.8% | 1.7%(+2.07)#30 | 2.1%(+1.64)#5,513 |
| 31. | Avimor | 3.5% | 1.7%(+1.80)#31 | 2.1%(+1.37)#6,072 |
| 32. | Albion | 3.4% | 1.7%(+1.69)#32 | 2.1%(+1.25)#6,368 |
| 33. | Wendell | 3.4% | 1.7%(+1.68)#33 | 2.1%(+1.25)#6,378 |
| 34. | Mountain Home | 3.3% | 1.7%(+1.54)#34 | 2.1%(+1.11)#6,719 |
| 35. | Cottonwood | 3.2% | 1.7%(+1.50)#35 | 2.1%(+1.07)#6,827 |
| 36. | Murtaugh | 3.2% | 1.7%(+1.48)#36 | 2.1%(+1.04)#6,891 |
| 37. | Iona | 3.1% | 1.7%(+1.37)#37 | 2.1%(+0.940)#7,200 |
| 38. | Preston | 3.0% | 1.7%(+1.28)#38 | 2.1%(+0.846)#7,516 |
| 39. | Dover | 2.9% | 1.7%(+1.23)#39 | 2.1%(+0.793)#7,684 |
| 40. | Heyburn | 2.9% | 1.7%(+1.20)#40 | 2.1%(+0.765)#7,781 |
| 41. | Peck | 2.9% | 1.7%(+1.18)#41 | 2.1%(+0.750)#7,831 |
| 42. | Juliaetta | 2.9% | 1.7%(+1.17)#42 | 2.1%(+0.740)#7,864 |
| 43. | Blackfoot | 2.9% | 1.7%(+1.16)#43 | 2.1%(+0.730)#7,897 |
| 44. | Dalton Gardens | 2.8% | 1.7%(+1.08)#44 | 2.1%(+0.645)#8,167 |
| 45. | St Maries | 2.8% | 1.7%(+1.04)#45 | 2.1%(+0.609)#8,288 |
| 46. | Chubbuck | 2.8% | 1.7%(+1.04)#46 | 2.1%(+0.602)#8,315 |
| 47. | Arimo | 2.7% | 1.7%(+0.987)#47 | 2.1%(+0.554)#8,485 |
| 48. | Kooskia | 2.7% | 1.7%(+0.951)#48 | 2.1%(+0.518)#8,597 |
| 49. | Post Falls | 2.6% | 1.7%(+0.889)#49 | 2.1%(+0.456)#8,815 |
| 50. | Nezperce | 2.5% | 1.7%(+0.816)#50 | 2.1%(+0.383)#9,085 |
| 51. | Star | 2.5% | 1.7%(+0.806)#51 | 2.1%(+0.373)#9,120 |
| 52. | Firth | 2.5% | 1.7%(+0.772)#52 | 2.1%(+0.339)#9,254 |
| 53. | Kendrick | 2.5% | 1.7%(+0.744)#53 | 2.1%(+0.311)#9,358 |
| 54. | Shoshone | 2.4% | 1.7%(+0.727)#54 | 2.1%(+0.294)#9,423 |
| 55. | Mullan | 2.4% | 1.7%(+0.694)#55 | 2.1%(+0.261)#9,546 |
| 56. | Nampa | 2.4% | 1.7%(+0.676)#56 | 2.1%(+0.243)#9,634 |
| 57. | Lewiston | 2.4% | 1.7%(+0.665)#57 | 2.1%(+0.232)#9,680 |
| 58. | Montpelier | 2.3% | 1.7%(+0.602)#58 | 2.1%(+0.169)#9,939 |
| 59. | Wallace | 2.3% | 1.7%(+0.542)#59 | 2.1%(+0.109)#10,177 |
| 60. | Richfield | 2.2% | 1.7%(+0.487)#60 | 2.1%(+0.054)#10,426 |
| 61. | Mccammon | 2.2% | 1.7%(+0.449)#61 | 2.1%(+0.016)#10,604 |
| 62. | Shelley | 2.1% | 1.7%(+0.431)#62 | 2.1%(-0.002)#10,691 |
| 63. | Ferdinand | 2.1% | 1.7%(+0.368)#63 | 2.1%(-0.065)#10,973 |
| 64. | Smelterville | 2.1% | 1.7%(+0.357)#64 | 2.1%(-0.076)#11,026 |
| 65. | Ririe | 2.1% | 1.7%(+0.353)#65 | 2.1%(-0.079)#11,038 |
| 66. | Victor | 2.1% | 1.7%(+0.346)#66 | 2.1%(-0.087)#11,078 |
| 67. | Genesee | 2.0% | 1.7%(+0.299)#67 | 2.1%(-0.134)#11,311 |
| 68. | Newdale | 2.0% | 1.7%(+0.253)#68 | 2.1%(-0.180)#11,541 |
| 69. | Pocatello | 1.9% | 1.7%(+0.171)#69 | 2.1%(-0.262)#11,949 |
| 70. | Caldwell | 1.9% | 1.7%(+0.140)#70 | 2.1%(-0.293)#12,097 |
| 71. | Fernan Lake Village | 1.9% | 1.7%(+0.136)#71 | 2.1%(-0.297)#12,122 |
| 72. | Greenleaf | 1.8% | 1.7%(+0.129)#72 | 2.1%(-0.304)#12,151 |
| 73. | Wilder | 1.8% | 1.7%(+0.117)#73 | 2.1%(-0.316)#12,218 |
| 74. | Garden City | 1.8% | 1.7%(+0.089)#74 | 2.1%(-0.344)#12,359 |
| 75. | Priest River | 1.7% | 1.7%(+0.025)#75 | 2.1%(-0.408)#12,666 |
| 76. | Worley | 1.7% | 1.7%(+0.024)#76 | 2.1%(-0.409)#12,675 |
| 77. | Middleton | 1.7% | 1.7%(+0.017)#77 | 2.1%(-0.416)#12,708 |
| 78. | Osburn | 1.7% | 1.7%(+0.009)#78 | 2.1%(-0.424)#12,751 |
| 79. | Hauser | 1.7% | 1.7%(+0.009)#79 | 2.1%(-0.424)#12,753 |
| 80. | Kellogg | 1.7% | 1.7%(+0.005)#80 | 2.1%(-0.428)#12,771 |
| 81. | Hayden Lake | 1.7% | 1.7%(+0.003)#81 | 2.1%(-0.430)#12,777 |
| 82. | Oakley | 1.7% | 1.7%(-0.015)#82 | 2.1%(-0.448)#12,865 |
| 83. | Hazelton | 1.7% | 1.7%(-0.024)#83 | 2.1%(-0.457)#12,912 |
| 84. | Spirit Lake | 1.7% | 1.7%(-0.033)#84 | 2.1%(-0.466)#12,964 |
| 85. | Melba | 1.7% | 1.7%(-0.042)#85 | 2.1%(-0.475)#13,020 |
| 86. | Lewisville | 1.6% | 1.7%(-0.103)#86 | 2.1%(-0.536)#13,334 |
| 87. | Tyhee | 1.6% | 1.7%(-0.142)#87 | 2.1%(-0.575)#13,552 |
| 88. | Aberdeen | 1.6% | 1.7%(-0.143)#88 | 2.1%(-0.576)#13,555 |
| 89. | Carey | 1.6% | 1.7%(-0.165)#89 | 2.1%(-0.598)#13,678 |
| 90. | Kimberly | 1.5% | 1.7%(-0.178)#90 | 2.1%(-0.611)#13,749 |
| 91. | Moscow | 1.5% | 1.7%(-0.181)#91 | 2.1%(-0.614)#13,758 |
| 92. | Fruitland | 1.5% | 1.7%(-0.183)#92 | 2.1%(-0.616)#13,770 |
| 93. | Ashton | 1.4% | 1.7%(-0.318)#93 | 2.1%(-0.751)#14,503 |
| 94. | Groveland | 1.4% | 1.7%(-0.333)#94 | 2.1%(-0.766)#14,578 |
| 95. | Dayton | 1.4% | 1.7%(-0.339)#95 | 2.1%(-0.772)#14,614 |
| 96. | Driggs | 1.4% | 1.7%(-0.341)#96 | 2.1%(-0.774)#14,620 |
| 97. | Idaho Falls | 1.4% | 1.7%(-0.347)#97 | 2.1%(-0.780)#14,665 |
| 98. | Bonners Ferry | 1.4% | 1.7%(-0.348)#98 | 2.1%(-0.781)#14,672 |
| 99. | Coeur D Alene | 1.3% | 1.7%(-0.366)#99 | 2.1%(-0.799)#14,774 |
| 100. | Rexburg | 1.3% | 1.7%(-0.382)#100 | 2.1%(-0.815)#14,848 |
Common Questions
What are the Top 10 Cities with the Highest Percentage of Population Employed in Security & Protection in Idaho?
Top 10 Cities with the Highest Percentage of Population Employed in Security & Protection in Idaho are:
#1
20.7%
#2
18.5%
#3
14.3%
#4
11.1%
#5
9.9%
#6
7.9%
#7
6.6%
#8
6.4%
#9
6.4%
#10
6.3%
What city has the Highest Percentage of Population Employed in Security & Protection in Idaho?
Murphy has the Highest Percentage of Population Employed in Security & Protection in Idaho with 20.7%.
What is the Percentage of Population Employed in Security & Protection in the State of Idaho?
Percentage of Population Employed in Security & Protection in Idaho is 1.7%.
What is the Percentage of Population Employed in Security & Protection in the United States?
Percentage of Population Employed in Security & Protection in the United States is 2.1%.