Zip Codes with the Highest Percentage of Population Employed in Security & Protection in San Jacinto, CA
RELATED REPORTS & OPTIONS
Security & Protection
San Jacinto
Compare Zip Codes
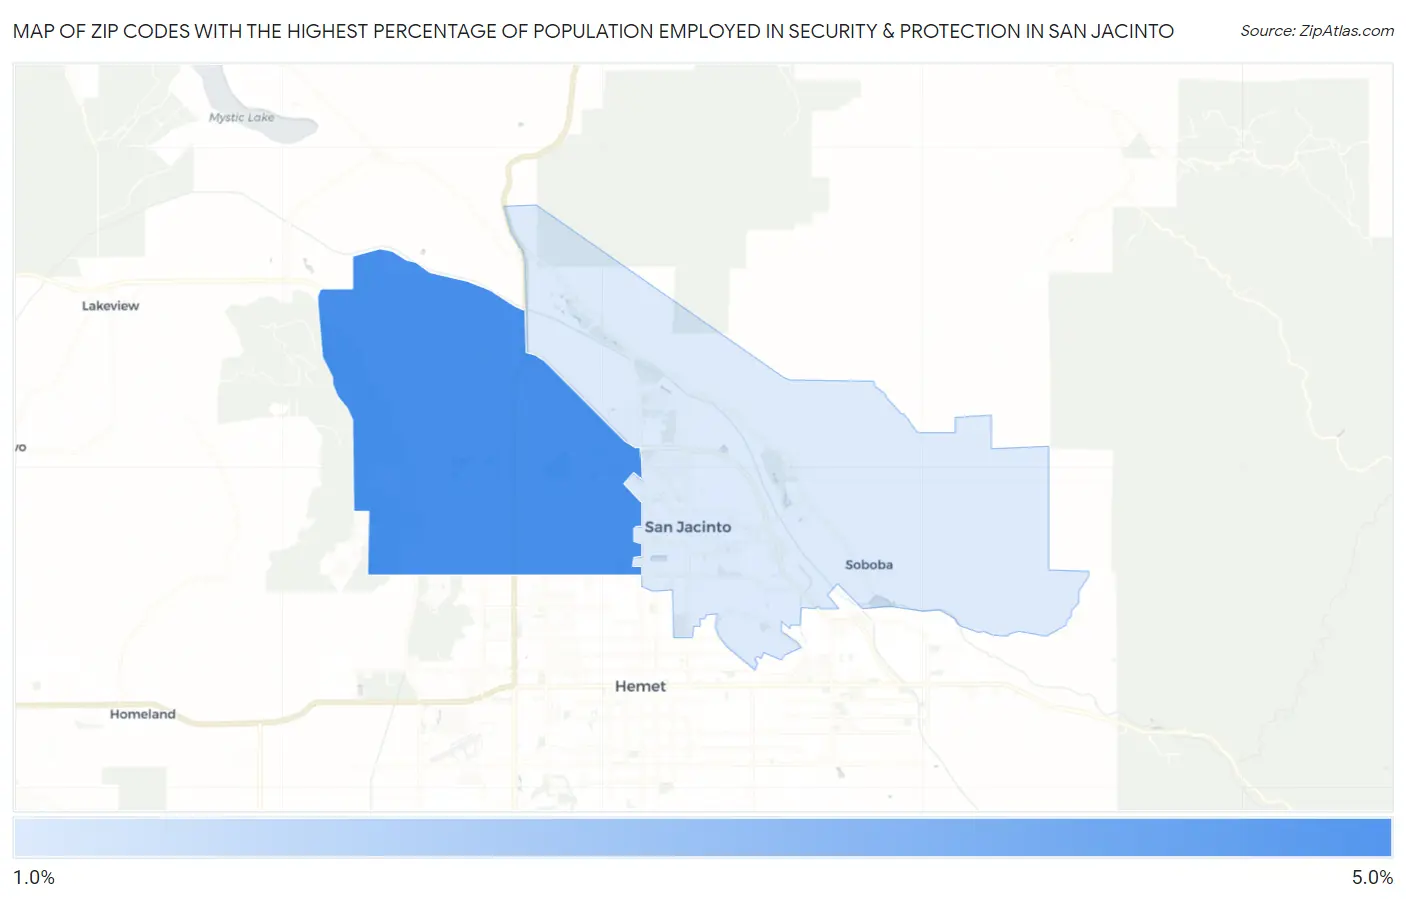
Map of Zip Codes with the Highest Percentage of Population Employed in Security & Protection in San Jacinto
1.2%
4.4%
Zip Codes with the Highest Percentage of Population Employed in Security & Protection in San Jacinto, CA
| Zip Code | % Employed | vs State | vs National | |
| 1. | 92582 | 4.4% | 2.1%(+2.34)#174 | 2.1%(+2.27)#3,745 |
| 2. | 92583 | 1.2% | 2.1%(-0.881)#1,098 | 2.1%(-0.949)#18,501 |
1
Common Questions
What are the Top Zip Codes with the Highest Percentage of Population Employed in Security & Protection in San Jacinto, CA?
Top Zip Codes with the Highest Percentage of Population Employed in Security & Protection in San Jacinto, CA are:
What zip code has the Highest Percentage of Population Employed in Security & Protection in San Jacinto, CA?
92582 has the Highest Percentage of Population Employed in Security & Protection in San Jacinto, CA with 4.4%.
What is the Percentage of Population Employed in Security & Protection in San Jacinto, CA?
Percentage of Population Employed in Security & Protection in San Jacinto is 2.7%.
What is the Percentage of Population Employed in Security & Protection in California?
Percentage of Population Employed in Security & Protection in California is 2.1%.
What is the Percentage of Population Employed in Security & Protection in the United States?
Percentage of Population Employed in Security & Protection in the United States is 2.1%.