Cities with the Highest Percentage of Population Employed in Security & Protection in Kentucky
RELATED REPORTS & OPTIONS
Security & Protection
Kentucky
Compare Cities
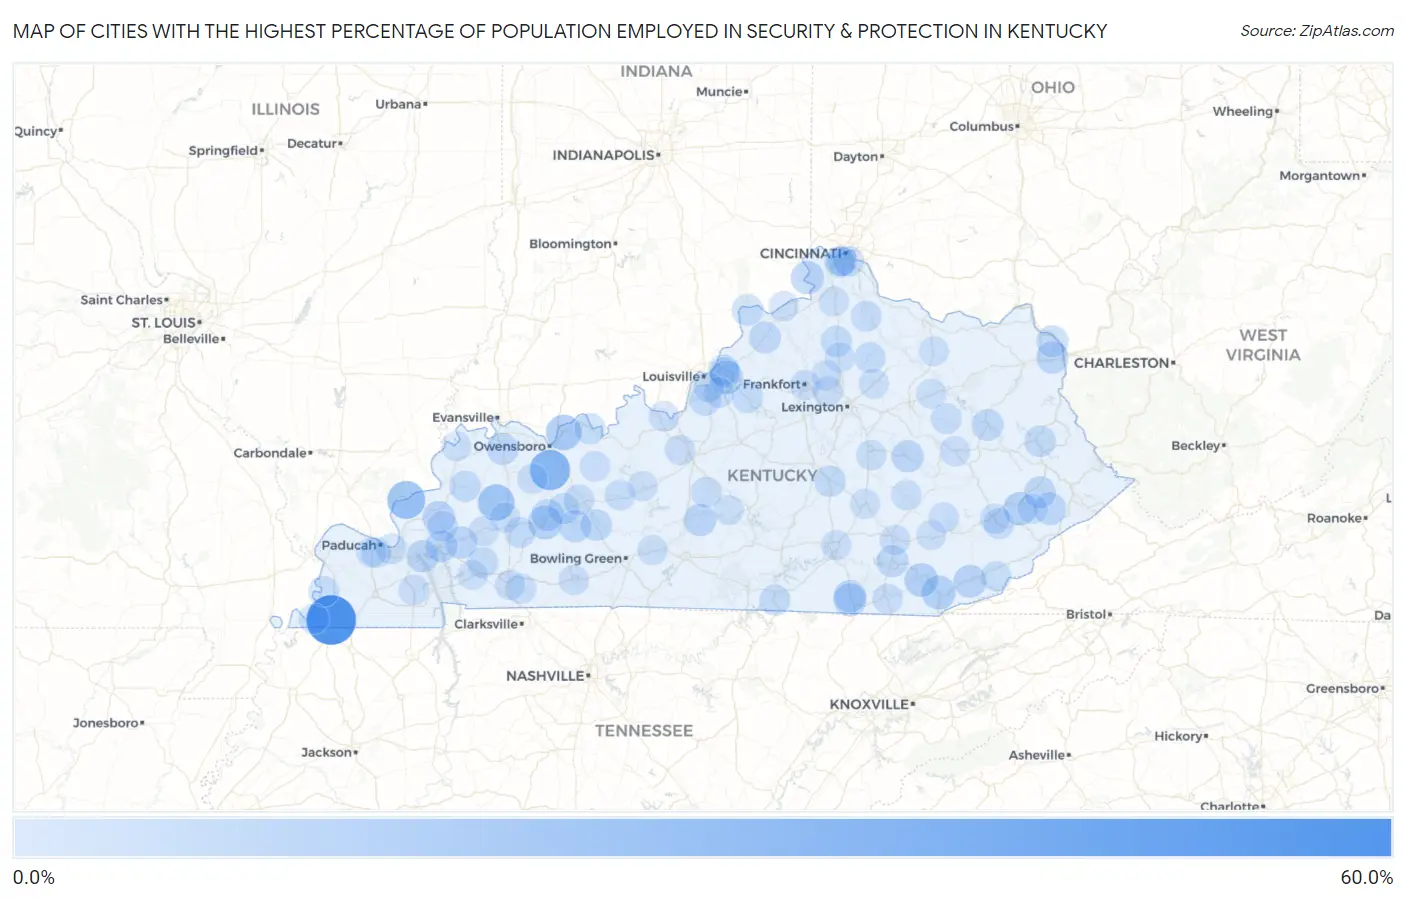
Map of Cities with the Highest Percentage of Population Employed in Security & Protection in Kentucky
0.0%
60.0%
Cities with the Highest Percentage of Population Employed in Security & Protection in Kentucky
| City | % Employed | vs State | vs National | |
| 1. | Cayce | 60.0% | 2.0%(+58.0)#1 | 2.1%(+57.9)#17 |
| 2. | Utica | 32.1% | 2.0%(+30.1)#2 | 2.1%(+29.9)#101 |
| 3. | Carrsville | 25.0% | 2.0%(+23.0)#3 | 2.1%(+22.9)#184 |
| 4. | Manitou | 20.7% | 2.0%(+18.7)#4 | 2.1%(+18.6)#258 |
| 5. | Maceo | 18.4% | 2.0%(+16.3)#5 | 2.1%(+16.2)#321 |
| 6. | Pineville | 13.7% | 2.0%(+11.7)#6 | 2.1%(+11.5)#597 |
| 7. | Powderly | 13.7% | 2.0%(+11.6)#7 | 2.1%(+11.5)#598 |
| 8. | Artemus | 13.0% | 2.0%(+11.0)#8 | 2.1%(+10.9)#662 |
| 9. | Sycamore | 12.5% | 2.0%(+10.5)#9 | 2.1%(+10.4)#709 |
| 10. | Hindman | 12.4% | 2.0%(+10.4)#10 | 2.1%(+10.3)#719 |
| 11. | Rabbit Hash | 11.8% | 2.0%(+9.75)#11 | 2.1%(+9.62)#799 |
| 12. | Stearns | 11.1% | 2.0%(+9.10)#12 | 2.1%(+8.96)#893 |
| 13. | Wallins Creek | 10.9% | 2.0%(+8.94)#13 | 2.1%(+8.80)#934 |
| 14. | Crayne | 10.3% | 2.0%(+8.24)#14 | 2.1%(+8.11)#1,049 |
| 15. | Wheelwright | 9.9% | 2.0%(+7.93)#15 | 2.1%(+7.80)#1,104 |
| 16. | Hardyville | 9.5% | 2.0%(+7.45)#16 | 2.1%(+7.31)#1,205 |
| 17. | Grand Rivers | 9.2% | 2.0%(+7.18)#17 | 2.1%(+7.05)#1,267 |
| 18. | Whitley City | 9.2% | 2.0%(+7.14)#18 | 2.1%(+7.01)#1,272 |
| 19. | Princeton | 9.1% | 2.0%(+7.10)#19 | 2.1%(+6.97)#1,285 |
| 20. | Irvine | 8.9% | 2.0%(+6.92)#20 | 2.1%(+6.79)#1,354 |
| 21. | Eddyville | 8.9% | 2.0%(+6.89)#21 | 2.1%(+6.76)#1,365 |
| 22. | Cannonsburg | 8.8% | 2.0%(+6.76)#22 | 2.1%(+6.62)#1,401 |
| 23. | Rochester | 8.7% | 2.0%(+6.68)#23 | 2.1%(+6.55)#1,432 |
| 24. | Wayland | 8.3% | 2.0%(+6.32)#24 | 2.1%(+6.18)#1,540 |
| 25. | Bellefonte | 8.3% | 2.0%(+6.26)#25 | 2.1%(+6.12)#1,568 |
| 26. | North Corbin | 8.3% | 2.0%(+6.24)#26 | 2.1%(+6.10)#1,572 |
| 27. | West Liberty | 8.2% | 2.0%(+6.19)#27 | 2.1%(+6.06)#1,588 |
| 28. | Anthoston | 8.1% | 2.0%(+6.14)#28 | 2.1%(+6.00)#1,605 |
| 29. | Campbellsburg | 8.1% | 2.0%(+6.11)#29 | 2.1%(+5.97)#1,613 |
| 30. | Central City | 7.8% | 2.0%(+5.75)#30 | 2.1%(+5.62)#1,738 |
| 31. | Morgantown | 7.4% | 2.0%(+5.40)#31 | 2.1%(+5.27)#1,893 |
| 32. | Paintsville | 7.2% | 2.0%(+5.19)#32 | 2.1%(+5.05)#1,984 |
| 33. | Hollyvilla | 6.9% | 2.0%(+4.94)#33 | 2.1%(+4.80)#2,103 |
| 34. | Milton | 6.9% | 2.0%(+4.93)#34 | 2.1%(+4.79)#2,108 |
| 35. | Stanford | 6.9% | 2.0%(+4.89)#35 | 2.1%(+4.76)#2,126 |
| 36. | Wheatcroft | 6.9% | 2.0%(+4.88)#36 | 2.1%(+4.75)#2,142 |
| 37. | Rockport | 6.3% | 2.0%(+4.34)#37 | 2.1%(+4.20)#2,472 |
| 38. | Corinth | 6.1% | 2.0%(+4.07)#38 | 2.1%(+3.94)#2,637 |
| 39. | Albany | 6.1% | 2.0%(+4.04)#39 | 2.1%(+3.90)#2,671 |
| 40. | Elk Creek | 6.0% | 2.0%(+3.95)#40 | 2.1%(+3.82)#2,737 |
| 41. | Hawesville | 5.9% | 2.0%(+3.89)#41 | 2.1%(+3.76)#2,788 |
| 42. | Cerulean | 5.5% | 2.0%(+3.52)#42 | 2.1%(+3.38)#3,131 |
| 43. | White Plains | 5.5% | 2.0%(+3.50)#43 | 2.1%(+3.36)#3,148 |
| 44. | Cynthiana | 5.5% | 2.0%(+3.50)#44 | 2.1%(+3.36)#3,150 |
| 45. | Ledbetter | 5.4% | 2.0%(+3.41)#45 | 2.1%(+3.27)#3,245 |
| 46. | Broeck Pointe | 5.3% | 2.0%(+3.33)#46 | 2.1%(+3.20)#3,314 |
| 47. | Columbus | 5.3% | 2.0%(+3.32)#47 | 2.1%(+3.18)#3,327 |
| 48. | Meadow Vale | 5.3% | 2.0%(+3.31)#48 | 2.1%(+3.17)#3,339 |
| 49. | Magnolia | 5.3% | 2.0%(+3.27)#49 | 2.1%(+3.13)#3,393 |
| 50. | Fredonia | 5.2% | 2.0%(+3.16)#50 | 2.1%(+3.02)#3,505 |
| 51. | Beaver Dam | 5.1% | 2.0%(+3.06)#51 | 2.1%(+2.92)#3,625 |
| 52. | Falmouth | 5.0% | 2.0%(+2.96)#52 | 2.1%(+2.82)#3,721 |
| 53. | Spring Mill | 4.9% | 2.0%(+2.93)#53 | 2.1%(+2.80)#3,752 |
| 54. | Diablock | 4.9% | 2.0%(+2.91)#54 | 2.1%(+2.77)#3,787 |
| 55. | Frenchburg | 4.8% | 2.0%(+2.80)#55 | 2.1%(+2.66)#3,916 |
| 56. | Lakeside Park | 4.8% | 2.0%(+2.76)#56 | 2.1%(+2.62)#3,948 |
| 57. | Hendron | 4.7% | 2.0%(+2.70)#57 | 2.1%(+2.57)#4,018 |
| 58. | Wilder | 4.6% | 2.0%(+2.62)#58 | 2.1%(+2.48)#4,143 |
| 59. | Caneyville | 4.6% | 2.0%(+2.57)#59 | 2.1%(+2.43)#4,211 |
| 60. | Hardin | 4.5% | 2.0%(+2.48)#60 | 2.1%(+2.35)#4,326 |
| 61. | Fordsville | 4.4% | 2.0%(+2.42)#61 | 2.1%(+2.29)#4,415 |
| 62. | Rineyville | 4.3% | 2.0%(+2.31)#62 | 2.1%(+2.17)#4,588 |
| 63. | London | 4.3% | 2.0%(+2.27)#63 | 2.1%(+2.13)#4,646 |
| 64. | Emlyn | 4.3% | 2.0%(+2.24)#64 | 2.1%(+2.11)#4,670 |
| 65. | Campton | 4.2% | 2.0%(+2.15)#65 | 2.1%(+2.02)#4,798 |
| 66. | Hickman | 4.2% | 2.0%(+2.15)#66 | 2.1%(+2.01)#4,823 |
| 67. | Calhoun | 4.1% | 2.0%(+2.04)#67 | 2.1%(+1.91)#5,002 |
| 68. | Frankfort | 4.0% | 2.0%(+2.00)#68 | 2.1%(+1.86)#5,065 |
| 69. | Lynnview | 4.0% | 2.0%(+1.95)#69 | 2.1%(+1.82)#5,170 |
| 70. | Russellville | 4.0% | 2.0%(+1.94)#70 | 2.1%(+1.80)#5,197 |
| 71. | Midway | 3.9% | 2.0%(+1.87)#71 | 2.1%(+1.74)#5,313 |
| 72. | Smiths Grove | 3.9% | 2.0%(+1.86)#72 | 2.1%(+1.72)#5,362 |
| 73. | Richmond | 3.9% | 2.0%(+1.85)#73 | 2.1%(+1.71)#5,371 |
| 74. | Doe Valley | 3.8% | 2.0%(+1.83)#74 | 2.1%(+1.70)#5,403 |
| 75. | Oneida | 3.8% | 2.0%(+1.83)#75 | 2.1%(+1.70)#5,411 |
| 76. | Evarts | 3.8% | 2.0%(+1.81)#76 | 2.1%(+1.68)#5,456 |
| 77. | Pembroke | 3.7% | 2.0%(+1.72)#77 | 2.1%(+1.58)#5,642 |
| 78. | Ghent | 3.7% | 2.0%(+1.71)#78 | 2.1%(+1.58)#5,649 |
| 79. | Hazard | 3.7% | 2.0%(+1.69)#79 | 2.1%(+1.55)#5,709 |
| 80. | Mckee | 3.7% | 2.0%(+1.65)#80 | 2.1%(+1.51)#5,800 |
| 81. | Hopkinsville | 3.6% | 2.0%(+1.59)#81 | 2.1%(+1.46)#5,906 |
| 82. | Somerset | 3.6% | 2.0%(+1.58)#82 | 2.1%(+1.44)#5,925 |
| 83. | Cadiz | 3.5% | 2.0%(+1.48)#83 | 2.1%(+1.34)#6,139 |
| 84. | Pippa Passes | 3.5% | 2.0%(+1.46)#84 | 2.1%(+1.32)#6,210 |
| 85. | Massac | 3.4% | 2.0%(+1.44)#85 | 2.1%(+1.30)#6,242 |
| 86. | Sadieville | 3.4% | 2.0%(+1.44)#86 | 2.1%(+1.30)#6,255 |
| 87. | Mount Vernon | 3.4% | 2.0%(+1.42)#87 | 2.1%(+1.29)#6,280 |
| 88. | Crittenden | 3.4% | 2.0%(+1.42)#88 | 2.1%(+1.28)#6,296 |
| 89. | Summersville | 3.4% | 2.0%(+1.41)#89 | 2.1%(+1.28)#6,311 |
| 90. | Fort Mitchell | 3.4% | 2.0%(+1.38)#90 | 2.1%(+1.24)#6,415 |
| 91. | Owingsville | 3.3% | 2.0%(+1.33)#91 | 2.1%(+1.19)#6,518 |
| 92. | Leitchfield | 3.3% | 2.0%(+1.33)#92 | 2.1%(+1.19)#6,524 |
| 93. | Paris | 3.2% | 2.0%(+1.22)#93 | 2.1%(+1.09)#6,782 |
| 94. | Stamping Ground | 3.2% | 2.0%(+1.22)#94 | 2.1%(+1.08)#6,786 |
| 95. | Earlington | 3.2% | 2.0%(+1.22)#95 | 2.1%(+1.08)#6,787 |
| 96. | Dawson Springs | 3.2% | 2.0%(+1.21)#96 | 2.1%(+1.07)#6,826 |
| 97. | Flemingsburg | 3.2% | 2.0%(+1.20)#97 | 2.1%(+1.07)#6,836 |
| 98. | Uniontown | 3.2% | 2.0%(+1.18)#98 | 2.1%(+1.05)#6,877 |
| 99. | Manchester | 3.2% | 2.0%(+1.16)#99 | 2.1%(+1.02)#6,951 |
| 100. | Fort Wright | 3.1% | 2.0%(+1.11)#100 | 2.1%(+0.976)#7,095 |
Common Questions
What are the Top 10 Cities with the Highest Percentage of Population Employed in Security & Protection in Kentucky?
Top 10 Cities with the Highest Percentage of Population Employed in Security & Protection in Kentucky are:
What city has the Highest Percentage of Population Employed in Security & Protection in Kentucky?
Cayce has the Highest Percentage of Population Employed in Security & Protection in Kentucky with 60.0%.
What is the Percentage of Population Employed in Security & Protection in the State of Kentucky?
Percentage of Population Employed in Security & Protection in Kentucky is 2.0%.
What is the Percentage of Population Employed in Security & Protection in the United States?
Percentage of Population Employed in Security & Protection in the United States is 2.1%.