Cities with the Highest Percentage of Population Employed in Security & Protection in Indiana
RELATED REPORTS & OPTIONS
Security & Protection
Indiana
Compare Cities
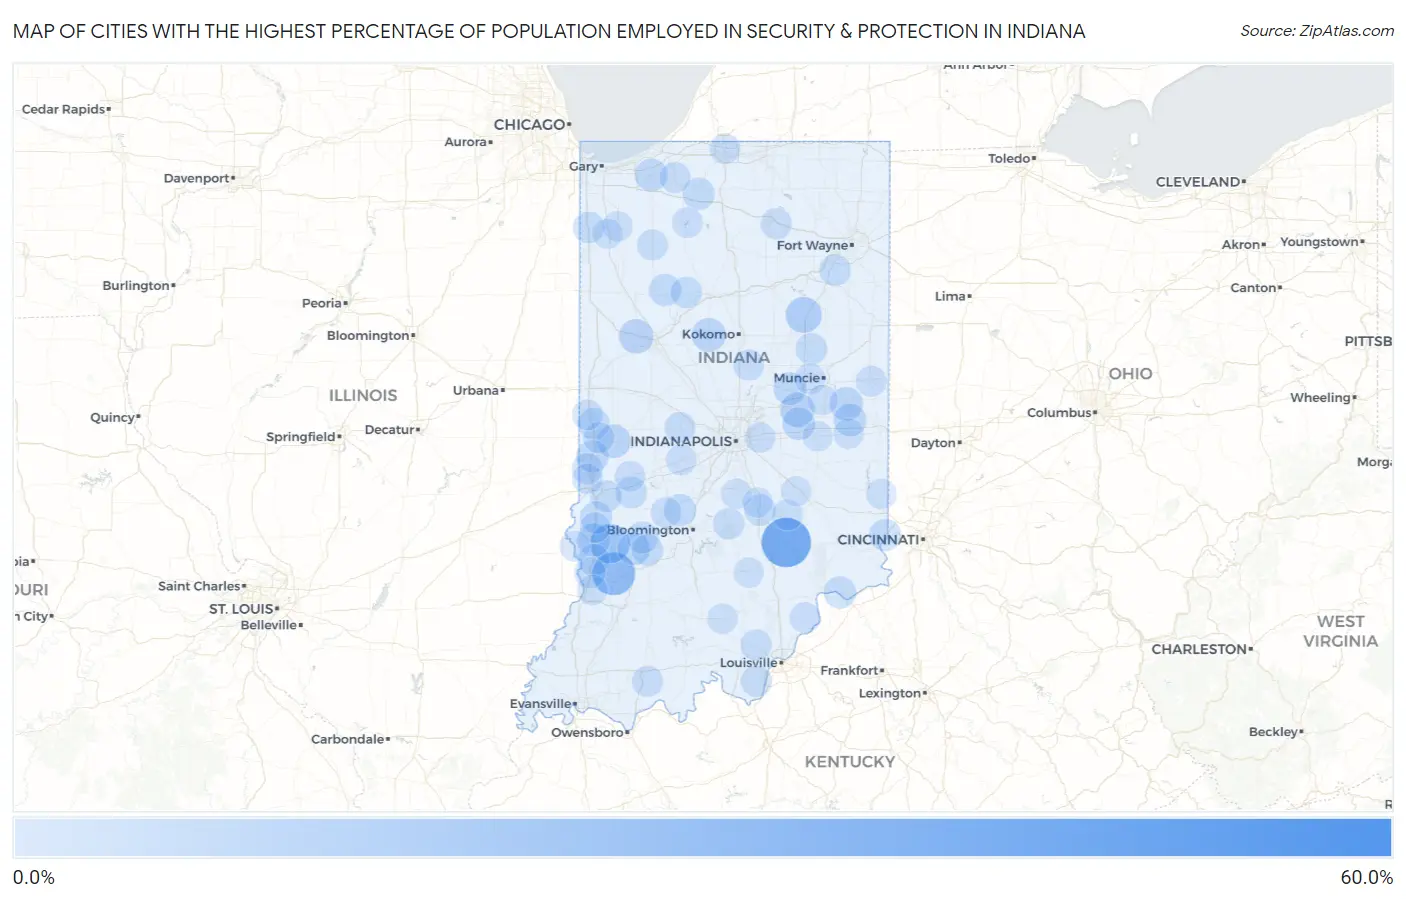
Map of Cities with the Highest Percentage of Population Employed in Security & Protection in Indiana
0.0%
60.0%
Cities with the Highest Percentage of Population Employed in Security & Protection in Indiana
| City | % Employed | vs State | vs National | |
| 1. | Talma | 60.0% | 1.8%(+58.2)#1 | 2.1%(+57.9)#16 |
| 2. | Scipio | 41.5% | 1.8%(+39.8)#2 | 2.1%(+39.4)#60 |
| 3. | Mays | 33.3% | 1.8%(+31.6)#3 | 2.1%(+31.2)#92 |
| 4. | Scircleville | 32.5% | 1.8%(+30.7)#4 | 2.1%(+30.3)#99 |
| 5. | Midland | 32.4% | 1.8%(+30.7)#5 | 2.1%(+30.3)#100 |
| 6. | Paxton | 30.7% | 1.8%(+28.9)#6 | 2.1%(+28.5)#115 |
| 7. | Westphalia | 28.6% | 1.8%(+26.8)#7 | 2.1%(+26.4)#131 |
| 8. | Needmore | 27.1% | 1.8%(+25.4)#8 | 2.1%(+25.0)#149 |
| 9. | Blue Ridge | 26.2% | 1.8%(+24.5)#9 | 2.1%(+24.1)#159 |
| 10. | Flat Rock | 24.8% | 1.8%(+23.0)#10 | 2.1%(+22.6)#190 |
| 11. | Bennetts Switch | 22.6% | 1.8%(+20.8)#11 | 2.1%(+20.4)#229 |
| 12. | Dugger | 21.6% | 1.8%(+19.8)#12 | 2.1%(+19.4)#240 |
| 13. | Wyatt | 20.2% | 1.8%(+18.5)#13 | 2.1%(+18.1)#268 |
| 14. | Grayford | 20.0% | 1.8%(+18.2)#14 | 2.1%(+17.9)#279 |
| 15. | Gwynneville | 17.5% | 1.8%(+15.7)#15 | 2.1%(+15.4)#355 |
| 16. | Homer | 17.5% | 1.8%(+15.7)#16 | 2.1%(+15.3)#360 |
| 17. | Glezen | 16.7% | 1.8%(+14.9)#17 | 2.1%(+14.5)#395 |
| 18. | Landess | 15.2% | 1.8%(+13.4)#18 | 2.1%(+13.0)#477 |
| 19. | Petersville | 12.9% | 1.8%(+11.1)#19 | 2.1%(+10.8)#671 |
| 20. | Mariah Hill | 12.7% | 1.8%(+10.9)#20 | 2.1%(+10.5)#693 |
| 21. | Markleville | 12.1% | 1.8%(+10.4)#21 | 2.1%(+9.99)#744 |
| 22. | Montmorenci | 12.1% | 1.8%(+10.3)#22 | 2.1%(+9.95)#747 |
| 23. | Libertyville | 12.0% | 1.8%(+10.2)#23 | 2.1%(+9.85)#757 |
| 24. | Burlington | 11.1% | 1.8%(+9.37)#24 | 2.1%(+9.00)#889 |
| 25. | Rockville | 10.7% | 1.8%(+8.95)#25 | 2.1%(+8.58)#965 |
| 26. | Losantville | 10.4% | 1.8%(+8.60)#26 | 2.1%(+8.22)#1,033 |
| 27. | Merriam | 10.2% | 1.8%(+8.44)#27 | 2.1%(+8.07)#1,054 |
| 28. | Sullivan | 9.6% | 1.8%(+7.84)#28 | 2.1%(+7.47)#1,176 |
| 29. | Wilkinson | 9.1% | 1.8%(+7.32)#29 | 2.1%(+6.94)#1,294 |
| 30. | Country Club Heights | 9.1% | 1.8%(+7.32)#30 | 2.1%(+6.94)#1,300 |
| 31. | Hagerstown | 9.1% | 1.8%(+7.29)#31 | 2.1%(+6.91)#1,320 |
| 32. | Westville | 9.0% | 1.8%(+7.18)#32 | 2.1%(+6.80)#1,346 |
| 33. | Switz City | 8.8% | 1.8%(+7.03)#33 | 2.1%(+6.66)#1,394 |
| 34. | Everton | 8.7% | 1.8%(+6.95)#34 | 2.1%(+6.58)#1,421 |
| 35. | Clinton | 8.4% | 1.8%(+6.66)#35 | 2.1%(+6.29)#1,507 |
| 36. | Farmersburg | 8.2% | 1.8%(+6.42)#36 | 2.1%(+6.04)#1,597 |
| 37. | Stinesville | 8.0% | 1.8%(+6.23)#37 | 2.1%(+5.85)#1,656 |
| 38. | Norway | 8.0% | 1.8%(+6.23)#38 | 2.1%(+5.85)#1,657 |
| 39. | Cassville | 7.9% | 1.8%(+6.15)#39 | 2.1%(+5.77)#1,679 |
| 40. | Koontz Lake | 7.9% | 1.8%(+6.14)#40 | 2.1%(+5.77)#1,682 |
| 41. | Brooksburg | 7.7% | 1.8%(+5.92)#41 | 2.1%(+5.54)#1,767 |
| 42. | Greendale | 7.6% | 1.8%(+5.78)#42 | 2.1%(+5.41)#1,821 |
| 43. | Morris | 7.4% | 1.8%(+5.62)#43 | 2.1%(+5.25)#1,907 |
| 44. | Carlisle | 7.3% | 1.8%(+5.57)#44 | 2.1%(+5.20)#1,925 |
| 45. | Newport | 7.1% | 1.8%(+5.31)#45 | 2.1%(+4.94)#2,030 |
| 46. | Worthington | 7.1% | 1.8%(+5.30)#46 | 2.1%(+4.93)#2,036 |
| 47. | Anoka | 7.1% | 1.8%(+5.30)#47 | 2.1%(+4.92)#2,039 |
| 48. | Reddington | 7.1% | 1.8%(+5.28)#48 | 2.1%(+4.91)#2,042 |
| 49. | Center Point | 6.9% | 1.8%(+5.16)#49 | 2.1%(+4.79)#2,113 |
| 50. | Taylorsville | 6.9% | 1.8%(+5.14)#50 | 2.1%(+4.77)#2,120 |
| 51. | Bloomfield | 6.9% | 1.8%(+5.10)#51 | 2.1%(+4.72)#2,148 |
| 52. | Zanesville | 6.9% | 1.8%(+5.09)#52 | 2.1%(+4.72)#2,149 |
| 53. | Matthews | 6.8% | 1.8%(+5.02)#53 | 2.1%(+4.65)#2,187 |
| 54. | Riley | 6.7% | 1.8%(+4.93)#54 | 2.1%(+4.55)#2,239 |
| 55. | Schneider | 6.6% | 1.8%(+4.82)#55 | 2.1%(+4.44)#2,308 |
| 56. | Burnettsville | 6.5% | 1.8%(+4.76)#56 | 2.1%(+4.39)#2,337 |
| 57. | Belleville | 6.5% | 1.8%(+4.76)#57 | 2.1%(+4.38)#2,340 |
| 58. | Nashville | 6.4% | 1.8%(+4.62)#58 | 2.1%(+4.24)#2,429 |
| 59. | Elizabeth | 6.2% | 1.8%(+4.38)#59 | 2.1%(+4.01)#2,590 |
| 60. | Oaktown | 6.1% | 1.8%(+4.34)#60 | 2.1%(+3.97)#2,615 |
| 61. | Montezuma | 6.0% | 1.8%(+4.20)#61 | 2.1%(+3.82)#2,729 |
| 62. | New Goshen | 5.9% | 1.8%(+4.16)#62 | 2.1%(+3.79)#2,766 |
| 63. | Greenville | 5.9% | 1.8%(+4.09)#63 | 2.1%(+3.72)#2,837 |
| 64. | Ramsey | 5.8% | 1.8%(+4.04)#64 | 2.1%(+3.67)#2,866 |
| 65. | Santa Claus | 5.8% | 1.8%(+4.02)#65 | 2.1%(+3.65)#2,887 |
| 66. | Putnamville | 5.8% | 1.8%(+3.98)#66 | 2.1%(+3.61)#2,923 |
| 67. | Kingsbury | 5.7% | 1.8%(+3.94)#67 | 2.1%(+3.57)#2,955 |
| 68. | Tipton | 5.7% | 1.8%(+3.93)#68 | 2.1%(+3.55)#2,965 |
| 69. | Medaryville | 5.7% | 1.8%(+3.89)#69 | 2.1%(+3.52)#2,989 |
| 70. | North Salem | 5.6% | 1.8%(+3.86)#70 | 2.1%(+3.49)#3,028 |
| 71. | Winona Lake | 5.6% | 1.8%(+3.85)#71 | 2.1%(+3.48)#3,038 |
| 72. | Winchester | 5.6% | 1.8%(+3.78)#72 | 2.1%(+3.40)#3,114 |
| 73. | Roseland | 5.5% | 1.8%(+3.72)#73 | 2.1%(+3.35)#3,162 |
| 74. | Hartsville | 5.4% | 1.8%(+3.63)#74 | 2.1%(+3.26)#3,255 |
| 75. | Yorktown | 5.4% | 1.8%(+3.60)#75 | 2.1%(+3.23)#3,279 |
| 76. | Cayuga | 5.3% | 1.8%(+3.55)#76 | 2.1%(+3.17)#3,336 |
| 77. | Pleasant View | 5.2% | 1.8%(+3.47)#77 | 2.1%(+3.09)#3,438 |
| 78. | Spencer | 5.2% | 1.8%(+3.46)#78 | 2.1%(+3.08)#3,451 |
| 79. | New Washington | 5.2% | 1.8%(+3.43)#79 | 2.1%(+3.05)#3,477 |
| 80. | Stilesville | 5.1% | 1.8%(+3.37)#80 | 2.1%(+3.00)#3,534 |
| 81. | Shelburn | 5.1% | 1.8%(+3.33)#81 | 2.1%(+2.96)#3,580 |
| 82. | Merom | 5.1% | 1.8%(+3.31)#82 | 2.1%(+2.94)#3,610 |
| 83. | Bruceville | 4.9% | 1.8%(+3.15)#83 | 2.1%(+2.78)#3,778 |
| 84. | Knightsville | 4.9% | 1.8%(+3.14)#84 | 2.1%(+2.76)#3,795 |
| 85. | Bass Lake | 4.9% | 1.8%(+3.11)#85 | 2.1%(+2.74)#3,825 |
| 86. | Cumberland | 4.9% | 1.8%(+3.11)#86 | 2.1%(+2.73)#3,828 |
| 87. | St Mary Of The Woods | 4.8% | 1.8%(+3.06)#87 | 2.1%(+2.68)#3,894 |
| 88. | Wellsboro | 4.8% | 1.8%(+3.00)#88 | 2.1%(+2.63)#3,947 |
| 89. | Trafalgar | 4.7% | 1.8%(+2.89)#89 | 2.1%(+2.52)#4,091 |
| 90. | Cambridge City | 4.6% | 1.8%(+2.87)#90 | 2.1%(+2.49)#4,114 |
| 91. | Edinburgh | 4.6% | 1.8%(+2.78)#91 | 2.1%(+2.41)#4,233 |
| 92. | Dunreith | 4.5% | 1.8%(+2.77)#92 | 2.1%(+2.40)#4,251 |
| 93. | Mount Carmel | 4.5% | 1.8%(+2.77)#93 | 2.1%(+2.40)#4,261 |
| 94. | Livonia | 4.4% | 1.8%(+2.67)#94 | 2.1%(+2.30)#4,399 |
| 95. | Brownstown | 4.4% | 1.8%(+2.63)#95 | 2.1%(+2.26)#4,454 |
| 96. | Lakewood | 4.4% | 1.8%(+2.62)#96 | 2.1%(+2.25)#4,469 |
| 97. | De Motte | 4.3% | 1.8%(+2.56)#97 | 2.1%(+2.18)#4,571 |
| 98. | Roselawn | 4.3% | 1.8%(+2.50)#98 | 2.1%(+2.13)#4,643 |
| 99. | Springport | 4.2% | 1.8%(+2.45)#99 | 2.1%(+2.08)#4,720 |
| 100. | St Paul | 4.2% | 1.8%(+2.42)#100 | 2.1%(+2.05)#4,761 |
Common Questions
What are the Top 10 Cities with the Highest Percentage of Population Employed in Security & Protection in Indiana?
Top 10 Cities with the Highest Percentage of Population Employed in Security & Protection in Indiana are:
#1
41.5%
#2
28.6%
#3
21.6%
#4
15.2%
#5
12.1%
#6
12.1%
#7
11.1%
#8
10.7%
#9
10.4%
#10
9.6%
What city has the Highest Percentage of Population Employed in Security & Protection in Indiana?
Scipio has the Highest Percentage of Population Employed in Security & Protection in Indiana with 41.5%.
What is the Percentage of Population Employed in Security & Protection in the State of Indiana?
Percentage of Population Employed in Security & Protection in Indiana is 1.8%.
What is the Percentage of Population Employed in Security & Protection in the United States?
Percentage of Population Employed in Security & Protection in the United States is 2.1%.