Johnstonville, CA Map & Demographics
Johnstonville Map
Johnstonville Overview
$37,749
PER CAPITA INCOME
$95,278
AVG FAMILY INCOME
$93,375
AVG HOUSEHOLD INCOME
7.8%
WAGE / INCOME GAP [ % ]
92.2¢/ $1
WAGE / INCOME GAP [ $ ]
0.36
INEQUALITY / GINI INDEX
1,090
TOTAL POPULATION
567
MALE POPULATION
523
FEMALE POPULATION
108.41
MALES / 100 FEMALES
92.24
FEMALES / 100 MALES
41.3
MEDIAN AGE
3.4
AVG FAMILY SIZE
3.1
AVG HOUSEHOLD SIZE
436
LABOR FORCE [ PEOPLE ]
50.3%
PERCENT IN LABOR FORCE
12.4%
UNEMPLOYMENT RATE
Income in Johnstonville
Income Overview in Johnstonville
Per Capita Income in Johnstonville is $37,749, while median incomes of families and households are $95,278 and $93,375 respectively.
| Characteristic | Number | Measure |
| Per Capita Income | 1,090 | $37,749 |
| Median Family Income | 282 | $95,278 |
| Mean Family Income | 282 | $108,526 |
| Median Household Income | 347 | $93,375 |
| Mean Household Income | 347 | $102,120 |
| Income Deficit | 282 | $0 |
| Wage / Income Gap (%) | 1,090 | 7.80% |
| Wage / Income Gap ($) | 1,090 | 92.20¢ per $1 |
| Gini / Inequality Index | 1,090 | 0.36 |
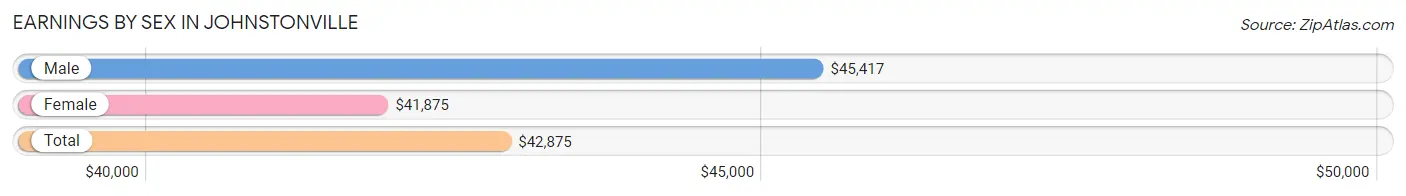
Earnings by Sex in Johnstonville
Average Earnings in Johnstonville are $42,875, $45,417 for men and $41,875 for women, a difference of 7.8%.
| Sex | Number | Average Earnings |
| Male | 239 (50.5%) | $45,417 |
| Female | 234 (49.5%) | $41,875 |
| Total | 473 (100.0%) | $42,875 |
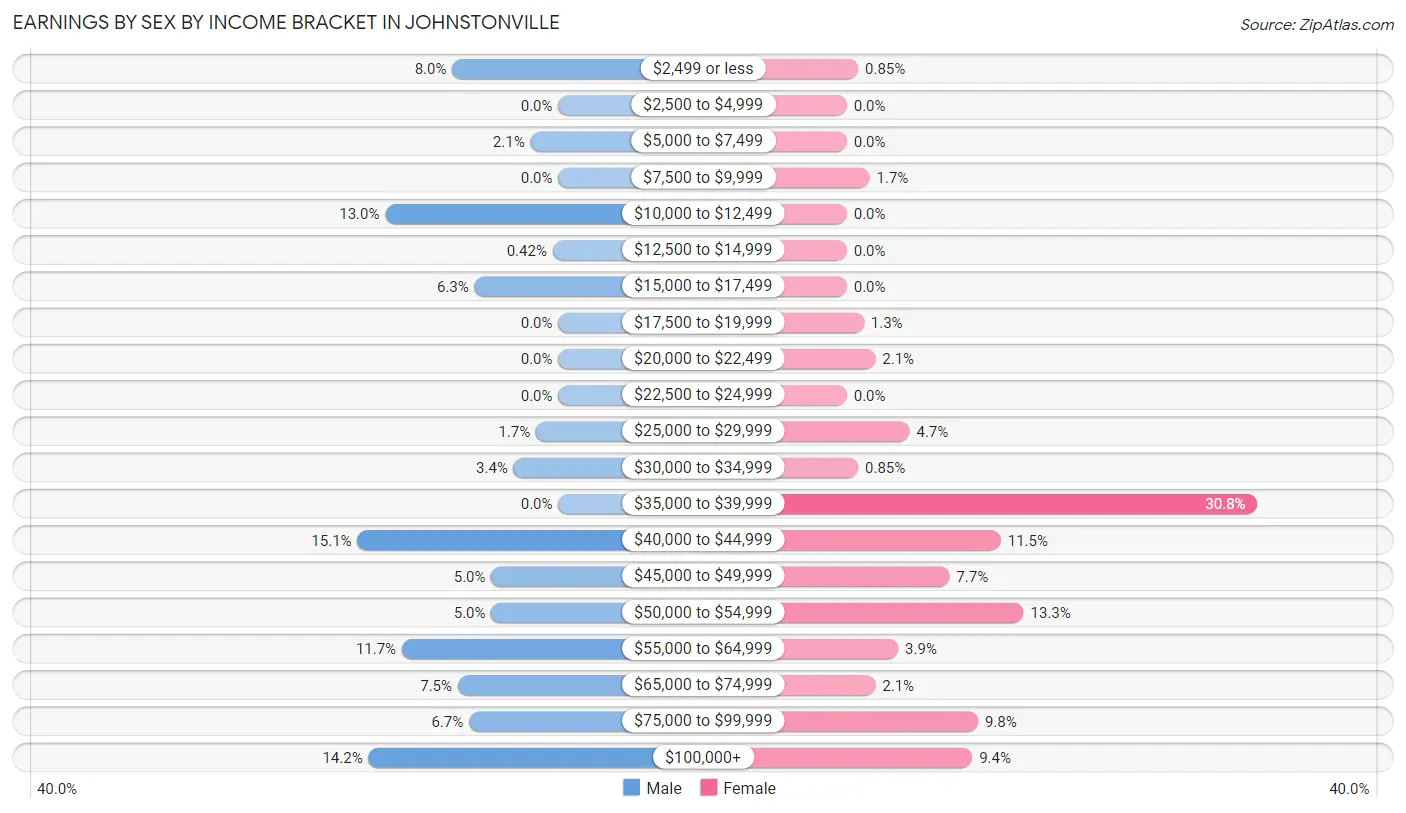
Earnings by Sex by Income Bracket in Johnstonville
The most common earnings brackets in Johnstonville are $40,000 to $44,999 for men (36 | 15.1%) and $35,000 to $39,999 for women (72 | 30.8%).
| Income | Male | Female |
| $2,499 or less | 19 (8.0%) | 2 (0.9%) |
| $2,500 to $4,999 | 0 (0.0%) | 0 (0.0%) |
| $5,000 to $7,499 | 5 (2.1%) | 0 (0.0%) |
| $7,500 to $9,999 | 0 (0.0%) | 4 (1.7%) |
| $10,000 to $12,499 | 31 (13.0%) | 0 (0.0%) |
| $12,500 to $14,999 | 1 (0.4%) | 0 (0.0%) |
| $15,000 to $17,499 | 15 (6.3%) | 0 (0.0%) |
| $17,500 to $19,999 | 0 (0.0%) | 3 (1.3%) |
| $20,000 to $22,499 | 0 (0.0%) | 5 (2.1%) |
| $22,500 to $24,999 | 0 (0.0%) | 0 (0.0%) |
| $25,000 to $29,999 | 4 (1.7%) | 11 (4.7%) |
| $30,000 to $34,999 | 8 (3.4%) | 2 (0.9%) |
| $35,000 to $39,999 | 0 (0.0%) | 72 (30.8%) |
| $40,000 to $44,999 | 36 (15.1%) | 27 (11.5%) |
| $45,000 to $49,999 | 12 (5.0%) | 18 (7.7%) |
| $50,000 to $54,999 | 12 (5.0%) | 31 (13.3%) |
| $55,000 to $64,999 | 28 (11.7%) | 9 (3.8%) |
| $65,000 to $74,999 | 18 (7.5%) | 5 (2.1%) |
| $75,000 to $99,999 | 16 (6.7%) | 23 (9.8%) |
| $100,000+ | 34 (14.2%) | 22 (9.4%) |
| Total | 239 (100.0%) | 234 (100.0%) |
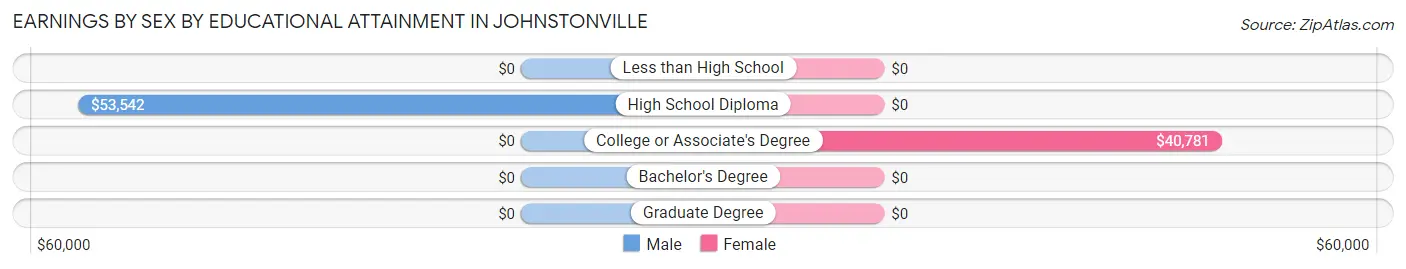
Earnings by Sex by Educational Attainment in Johnstonville
Average earnings in Johnstonville are $49,028 for men and $40,677 for women, a difference of 17.0%. Men with an educational attainment of high school diploma enjoy the highest average annual earnings of $53,542, while those with high school diploma education earn the least with $53,542. Women with an educational attainment of college or associate's degree earn the most with the average annual earnings of $40,781, while those with college or associate's degree education have the smallest earnings of $40,781.
| Educational Attainment | Male Income | Female Income |
| Less than High School | - | - |
| High School Diploma | $53,542 | $0 |
| College or Associate's Degree | - | - |
| Bachelor's Degree | - | - |
| Graduate Degree | - | - |
| Total | $49,028 | $40,677 |
Family Income in Johnstonville
Family Income Brackets in Johnstonville
According to the Johnstonville family income data, there are 91 families falling into the $75,000 to $99,999 income range, which is the most common income bracket and makes up 32.3% of all families.
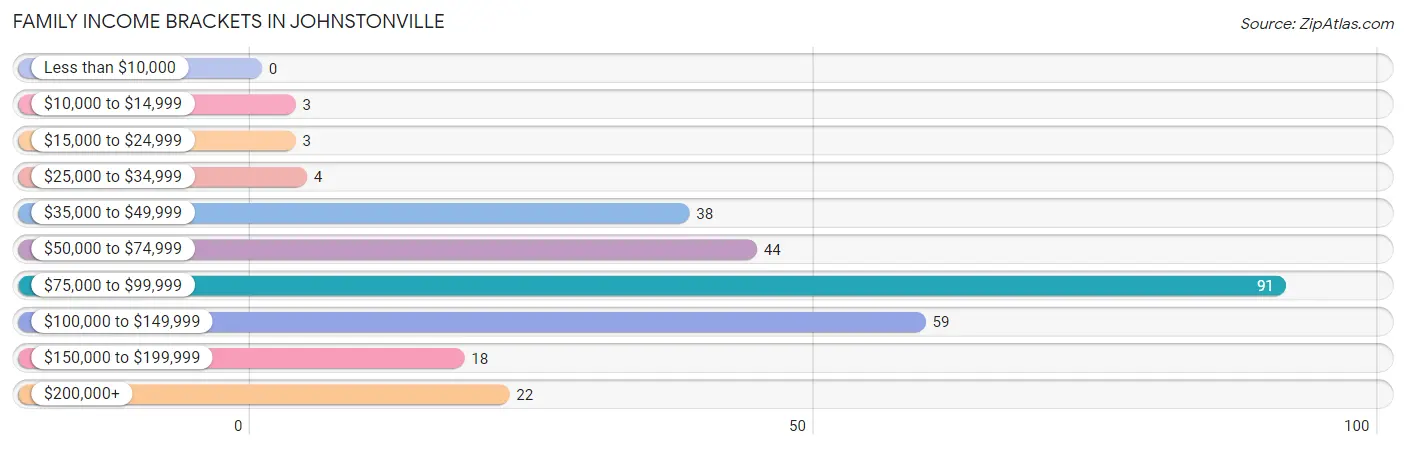
| Income Bracket | # Families | % Families |
| Less than $10,000 | 0 | 0.0% |
| $10,000 to $14,999 | 3 | 1.1% |
| $15,000 to $24,999 | 3 | 1.1% |
| $25,000 to $34,999 | 4 | 1.4% |
| $35,000 to $49,999 | 38 | 13.5% |
| $50,000 to $74,999 | 44 | 15.6% |
| $75,000 to $99,999 | 91 | 32.3% |
| $100,000 to $149,999 | 59 | 20.9% |
| $150,000 to $199,999 | 18 | 6.4% |
| $200,000+ | 22 | 7.8% |
Family Income by Famaliy Size in Johnstonville
4-person families (10 | 3.5%) account for the highest median family income in Johnstonville with $171,000 per family, while 2-person families (168 | 59.6%) have the highest median income of $43,750 per family member.
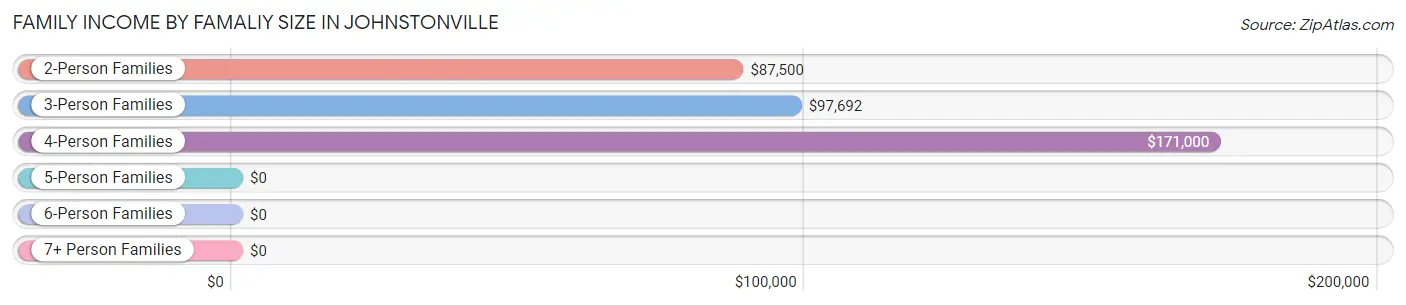
| Income Bracket | # Families | Median Income |
| 2-Person Families | 168 (59.6%) | $87,500 |
| 3-Person Families | 74 (26.2%) | $97,692 |
| 4-Person Families | 10 (3.5%) | $171,000 |
| 5-Person Families | 25 (8.9%) | $0 |
| 6-Person Families | 5 (1.8%) | $0 |
| 7+ Person Families | 0 (0.0%) | $0 |
| Total | 282 (100.0%) | $95,278 |
Family Income by Number of Earners in Johnstonville
The median family income in Johnstonville is $95,278, with families comprising 3+ earners (15) having the highest median family income of $187,813, while families with 1 earner (86) have the lowest median family income of $57,955, accounting for 5.3% and 30.5% of families, respectively.
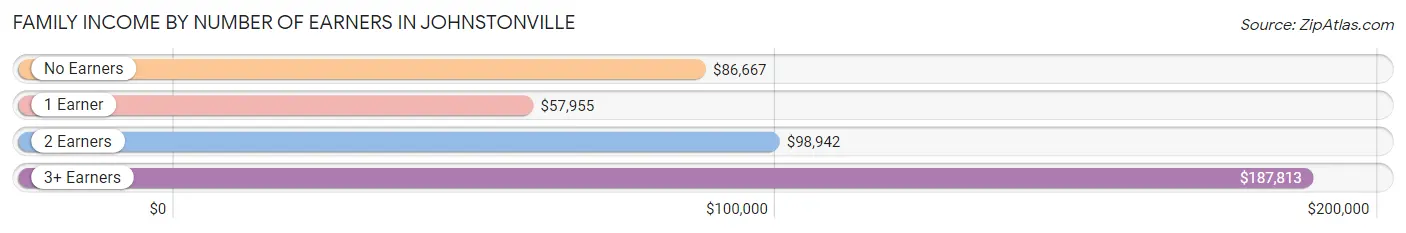
| Number of Earners | # Families | Median Income |
| No Earners | 96 (34.0%) | $86,667 |
| 1 Earner | 86 (30.5%) | $57,955 |
| 2 Earners | 85 (30.1%) | $98,942 |
| 3+ Earners | 15 (5.3%) | $187,813 |
| Total | 282 (100.0%) | $95,278 |
Household Income in Johnstonville
Household Income Brackets in Johnstonville
With 87 households falling in the category, the $75,000 to $99,999 income range is the most frequent in Johnstonville, accounting for 25.1% of all households. In contrast, only 5 households (1.4%) fall into the less than $10,000 income bracket, making it the least populous group.
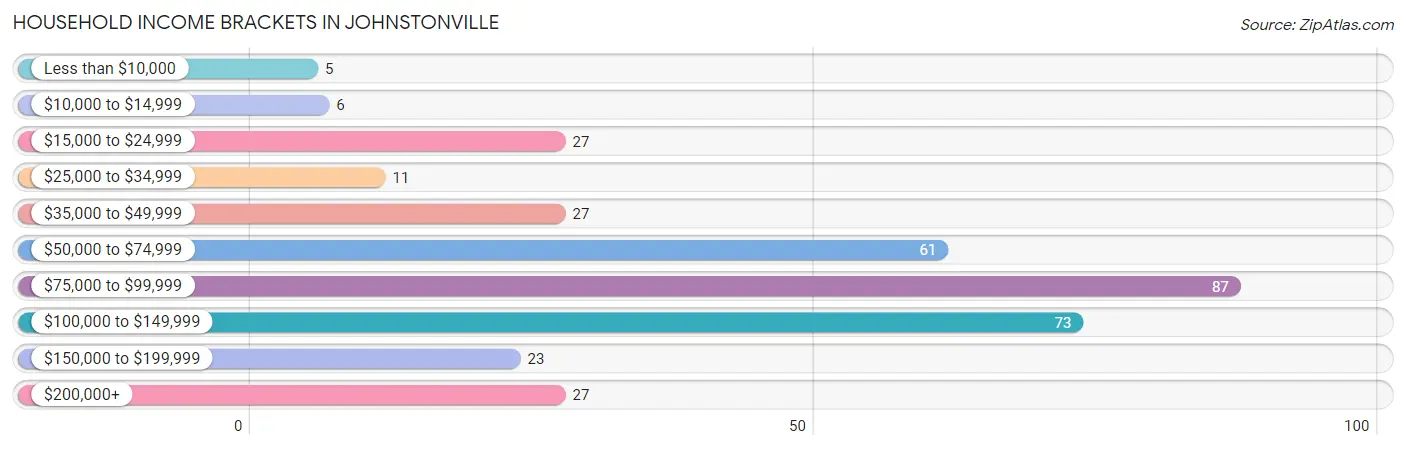
| Income Bracket | # Households | % Households |
| Less than $10,000 | 5 | 1.4% |
| $10,000 to $14,999 | 6 | 1.7% |
| $15,000 to $24,999 | 27 | 7.8% |
| $25,000 to $34,999 | 11 | 3.2% |
| $35,000 to $49,999 | 27 | 7.8% |
| $50,000 to $74,999 | 61 | 17.6% |
| $75,000 to $99,999 | 87 | 25.1% |
| $100,000 to $149,999 | 73 | 21.0% |
| $150,000 to $199,999 | 23 | 6.6% |
| $200,000+ | 27 | 7.8% |
Household Income by Householder Age in Johnstonville
The median household income in Johnstonville is $93,375, with the highest median household income of $102,500 found in the 45 to 64 years age bracket for the primary householder. A total of 132 households (38.0%) fall into this category.
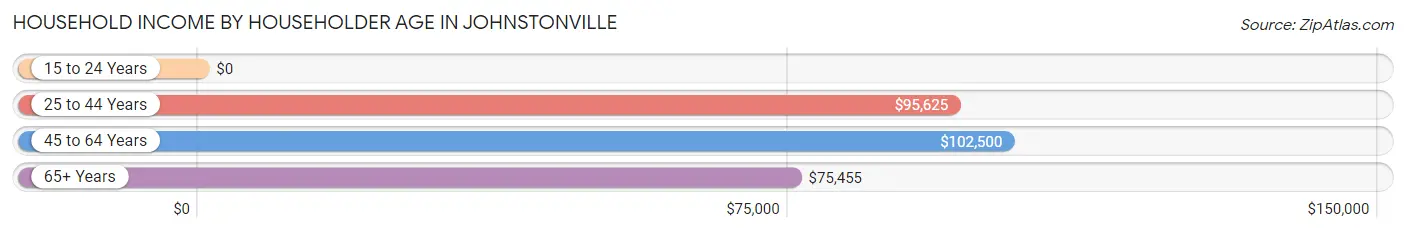
| Income Bracket | # Households | Median Income |
| 15 to 24 Years | 0 (0.0%) | $0 |
| 25 to 44 Years | 77 (22.2%) | $95,625 |
| 45 to 64 Years | 132 (38.0%) | $102,500 |
| 65+ Years | 138 (39.8%) | $75,455 |
| Total | 347 (100.0%) | $93,375 |
Poverty in Johnstonville
Income Below Poverty by Sex and Age in Johnstonville
With 2.7% poverty level for males and 2.9% for females among the residents of Johnstonville, 55 to 64 year old males and 35 to 44 year old females are the most vulnerable to poverty, with 10 males (11.9%) and 8 females (12.1%) in their respective age groups living below the poverty level.
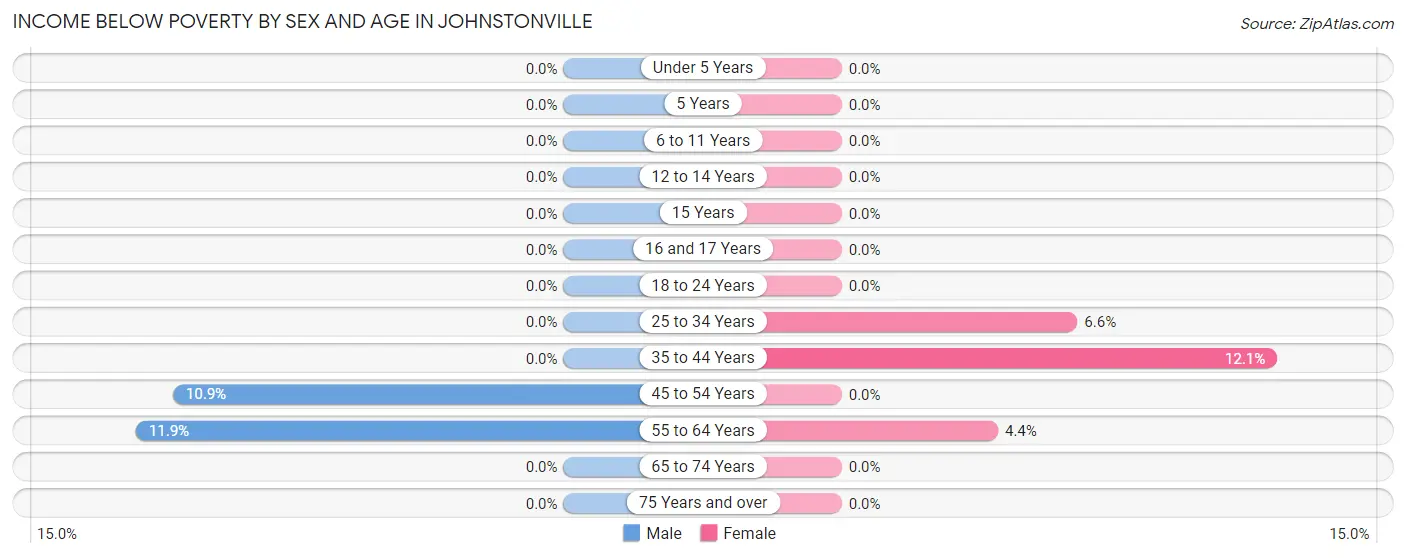
| Age Bracket | Male | Female |
| Under 5 Years | 0 (0.0%) | 0 (0.0%) |
| 5 Years | 0 (0.0%) | 0 (0.0%) |
| 6 to 11 Years | 0 (0.0%) | 0 (0.0%) |
| 12 to 14 Years | 0 (0.0%) | 0 (0.0%) |
| 15 Years | 0 (0.0%) | 0 (0.0%) |
| 16 and 17 Years | 0 (0.0%) | 0 (0.0%) |
| 18 to 24 Years | 0 (0.0%) | 0 (0.0%) |
| 25 to 34 Years | 0 (0.0%) | 4 (6.6%) |
| 35 to 44 Years | 0 (0.0%) | 8 (12.1%) |
| 45 to 54 Years | 5 (10.9%) | 0 (0.0%) |
| 55 to 64 Years | 10 (11.9%) | 3 (4.3%) |
| 65 to 74 Years | 0 (0.0%) | 0 (0.0%) |
| 75 Years and over | 0 (0.0%) | 0 (0.0%) |
| Total | 15 (2.7%) | 15 (2.9%) |
Income Above Poverty by Sex and Age in Johnstonville
According to the poverty statistics in Johnstonville, males aged under 5 years and females aged under 5 years are the age groups that are most secure financially, with 100.0% of males and 100.0% of females in these age groups living above the poverty line.
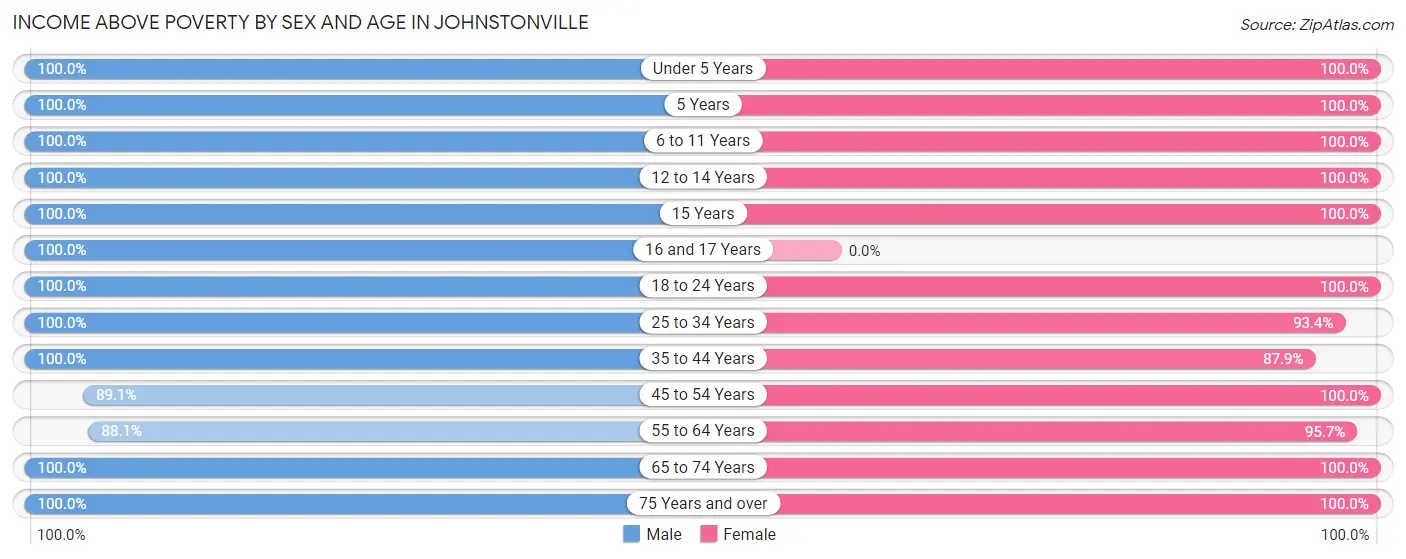
| Age Bracket | Male | Female |
| Under 5 Years | 7 (100.0%) | 9 (100.0%) |
| 5 Years | 8 (100.0%) | 16 (100.0%) |
| 6 to 11 Years | 43 (100.0%) | 65 (100.0%) |
| 12 to 14 Years | 40 (100.0%) | 3 (100.0%) |
| 15 Years | 22 (100.0%) | 3 (100.0%) |
| 16 and 17 Years | 14 (100.0%) | 0 (0.0%) |
| 18 to 24 Years | 31 (100.0%) | 32 (100.0%) |
| 25 to 34 Years | 104 (100.0%) | 57 (93.4%) |
| 35 to 44 Years | 59 (100.0%) | 58 (87.9%) |
| 45 to 54 Years | 41 (89.1%) | 56 (100.0%) |
| 55 to 64 Years | 74 (88.1%) | 66 (95.7%) |
| 65 to 74 Years | 46 (100.0%) | 61 (100.0%) |
| 75 Years and over | 55 (100.0%) | 82 (100.0%) |
| Total | 544 (97.3%) | 508 (97.1%) |
Income Below Poverty Among Married-Couple Families in Johnstonville
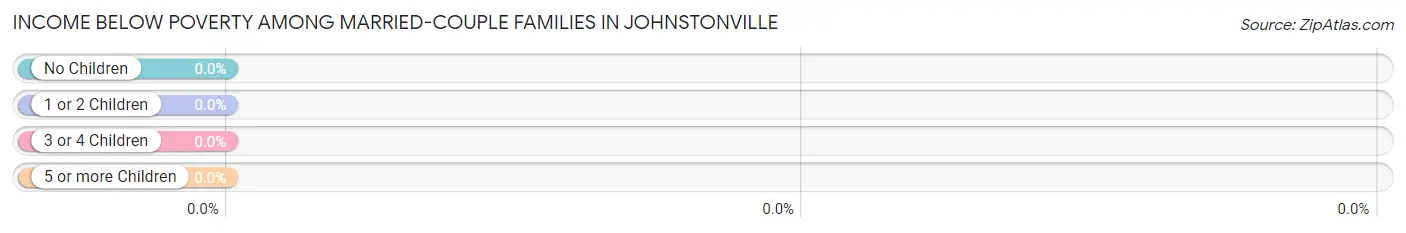
| Children | Above Poverty | Below Poverty |
| No Children | 175 (100.0%) | 0 (0.0%) |
| 1 or 2 Children | 26 (100.0%) | 0 (0.0%) |
| 3 or 4 Children | 19 (100.0%) | 0 (0.0%) |
| 5 or more Children | 0 (0.0%) | 0 (0.0%) |
| Total | 220 (100.0%) | 0 (0.0%) |
Income Below Poverty Among Single-Parent Households in Johnstonville
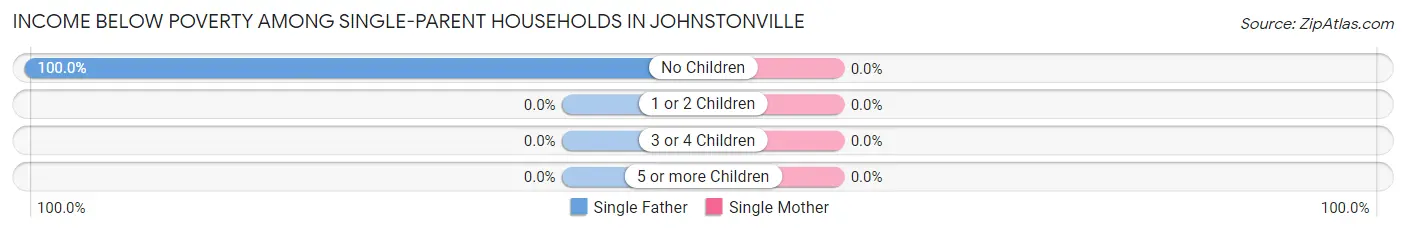
| Children | Single Father | Single Mother |
| No Children | 3 (100.0%) | 0 (0.0%) |
| 1 or 2 Children | 0 (0.0%) | 0 (0.0%) |
| 3 or 4 Children | 0 (0.0%) | 0 (0.0%) |
| 5 or more Children | 0 (0.0%) | 0 (0.0%) |
| Total | 3 (42.9%) | 0 (0.0%) |
Income Below Poverty Among Married-Couple vs Single-Parent Households in Johnstonville
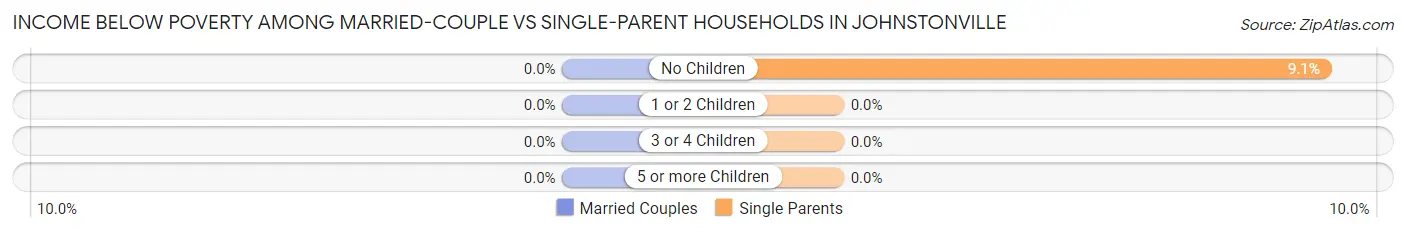
| Children | Married-Couple Families | Single-Parent Households |
| No Children | 0 (0.0%) | 3 (9.1%) |
| 1 or 2 Children | 0 (0.0%) | 0 (0.0%) |
| 3 or 4 Children | 0 (0.0%) | 0 (0.0%) |
| 5 or more Children | 0 (0.0%) | 0 (0.0%) |
| Total | 0 (0.0%) | 3 (4.8%) |
Race in Johnstonville
The most populous races in Johnstonville are White / Caucasian (902 | 82.8%), Hispanic or Latino (136 | 12.5%), and Two or more Races (68 | 6.2%).
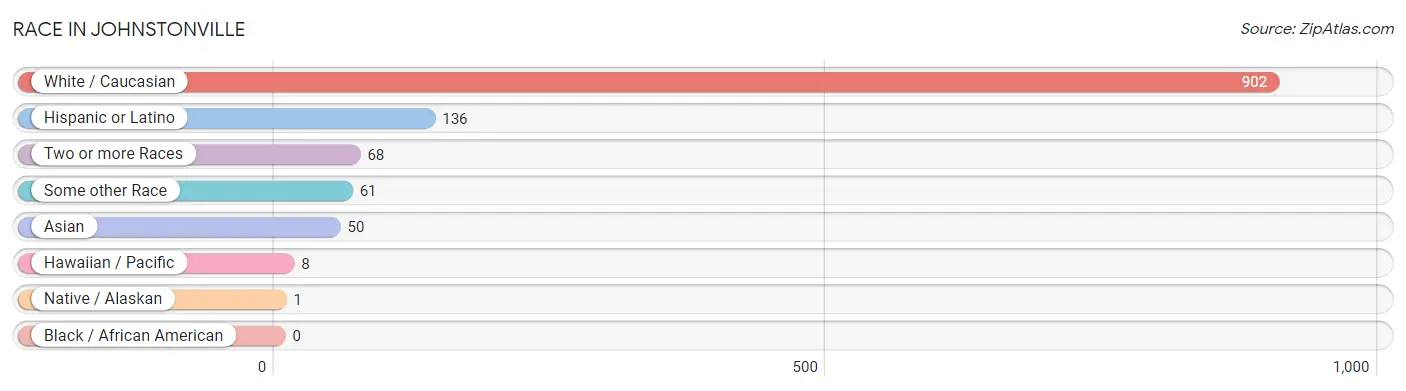
| Race | # Population | % Population |
| Asian | 50 | 4.6% |
| Black / African American | 0 | 0.0% |
| Hawaiian / Pacific | 8 | 0.7% |
| Hispanic or Latino | 136 | 12.5% |
| Native / Alaskan | 1 | 0.1% |
| White / Caucasian | 902 | 82.8% |
| Two or more Races | 68 | 6.2% |
| Some other Race | 61 | 5.6% |
| Total | 1,090 | 100.0% |
Ancestry in Johnstonville
The most populous ancestries reported in Johnstonville are German (177 | 16.2%), Mexican (117 | 10.7%), European (113 | 10.4%), English (97 | 8.9%), and Irish (96 | 8.8%), together accounting for 55.0% of all Johnstonville residents.
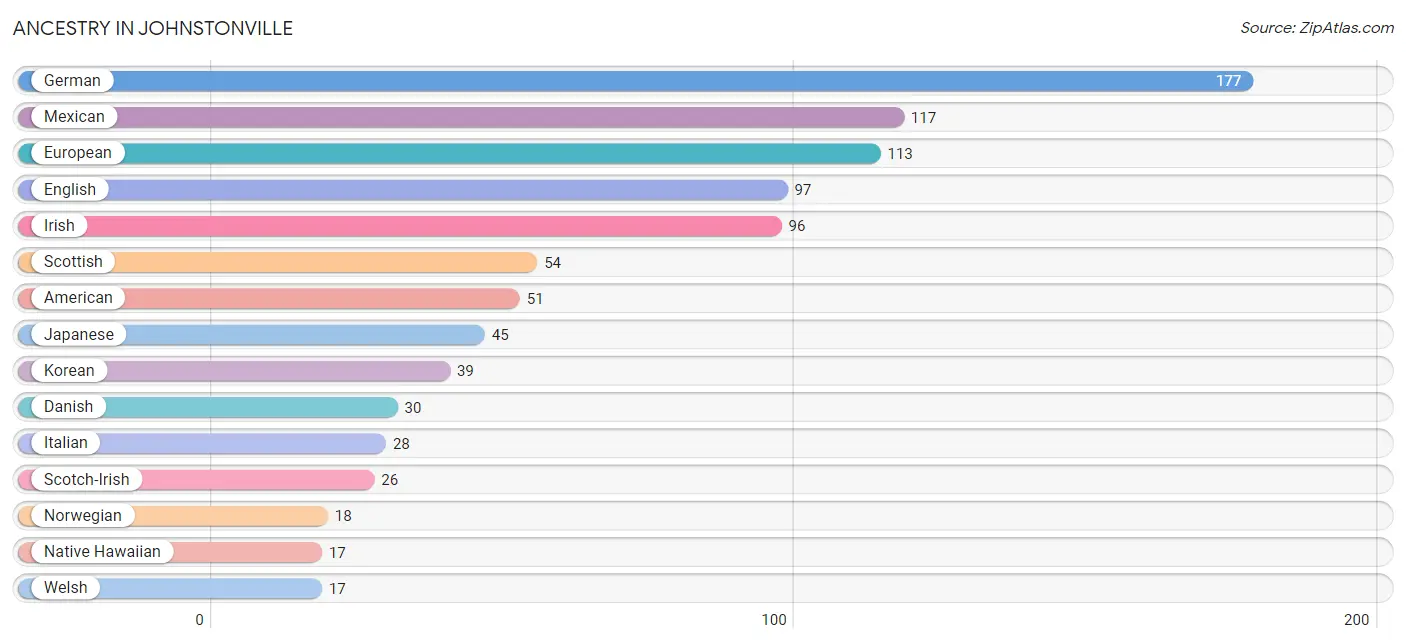
| Ancestry | # Population | % Population |
| American | 51 | 4.7% |
| Bhutanese | 13 | 1.2% |
| Cherokee | 5 | 0.5% |
| Danish | 30 | 2.8% |
| Dutch | 14 | 1.3% |
| English | 97 | 8.9% |
| European | 113 | 10.4% |
| Finnish | 3 | 0.3% |
| French | 14 | 1.3% |
| French Canadian | 13 | 1.2% |
| German | 177 | 16.2% |
| Hungarian | 3 | 0.3% |
| Indian (Asian) | 3 | 0.3% |
| Irish | 96 | 8.8% |
| Italian | 28 | 2.6% |
| Japanese | 45 | 4.1% |
| Korean | 39 | 3.6% |
| Mexican | 117 | 10.7% |
| Native Hawaiian | 17 | 1.6% |
| Norwegian | 18 | 1.7% |
| Polish | 9 | 0.8% |
| Portuguese | 4 | 0.4% |
| Russian | 15 | 1.4% |
| Scotch-Irish | 26 | 2.4% |
| Scottish | 54 | 5.0% |
| Spaniard | 2 | 0.2% |
| Spanish | 4 | 0.4% |
| Swedish | 6 | 0.5% |
| Swiss | 3 | 0.3% |
| Welsh | 17 | 1.6% | View All 30 Rows |
Immigrants in Johnstonville
The most numerous immigrant groups reported in Johnstonville came from Europe (8 | 0.7%), Western Europe (6 | 0.5%), Australia (4 | 0.4%), Oceania (4 | 0.4%), and France (3 | 0.3%), together accounting for 2.3% of all Johnstonville residents.
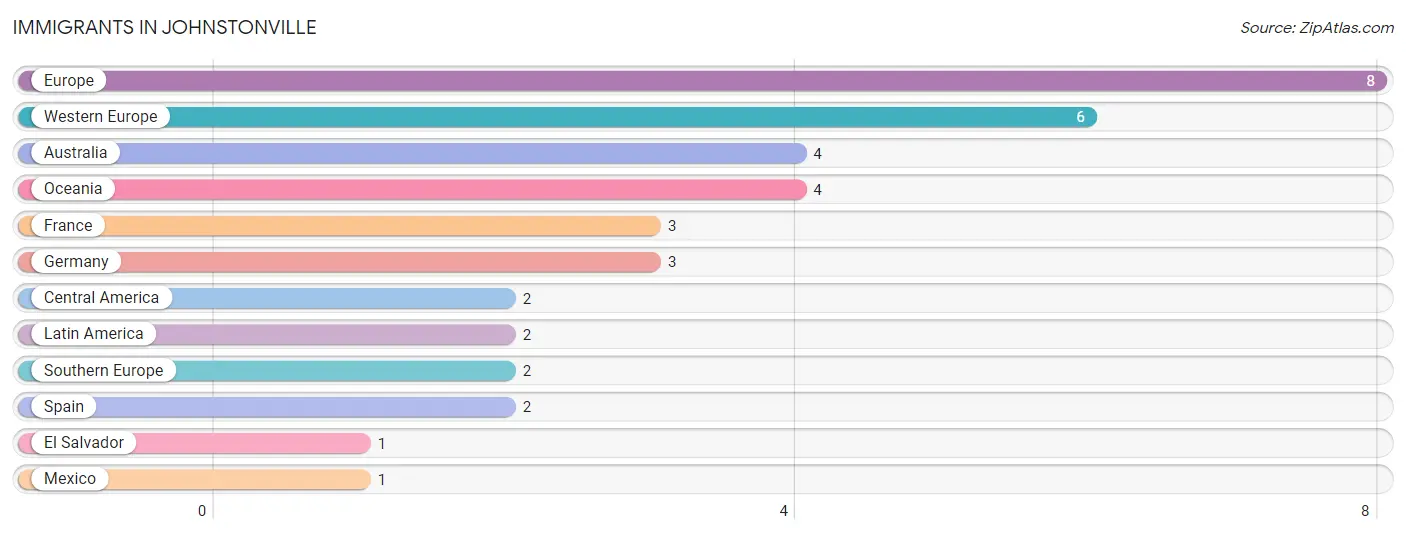
| Immigration Origin | # Population | % Population |
| Australia | 4 | 0.4% |
| Central America | 2 | 0.2% |
| El Salvador | 1 | 0.1% |
| Europe | 8 | 0.7% |
| France | 3 | 0.3% |
| Germany | 3 | 0.3% |
| Latin America | 2 | 0.2% |
| Mexico | 1 | 0.1% |
| Oceania | 4 | 0.4% |
| Southern Europe | 2 | 0.2% |
| Spain | 2 | 0.2% |
| Western Europe | 6 | 0.5% | View All 12 Rows |
Sex and Age in Johnstonville
Sex and Age in Johnstonville
The most populous age groups in Johnstonville are 25 to 29 Years (91 | 16.1%) for men and 55 to 59 Years (54 | 10.3%) for women.
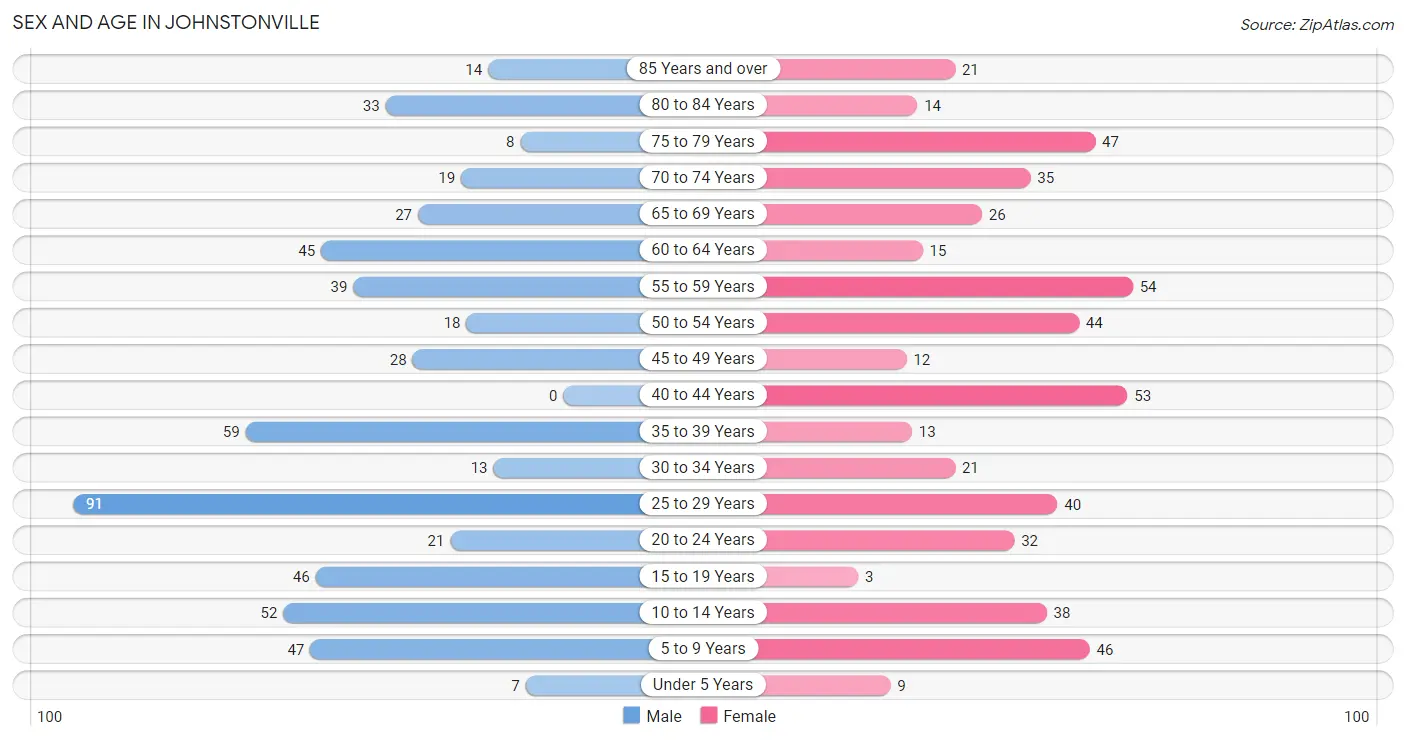
| Age Bracket | Male | Female |
| Under 5 Years | 7 (1.2%) | 9 (1.7%) |
| 5 to 9 Years | 47 (8.3%) | 46 (8.8%) |
| 10 to 14 Years | 52 (9.2%) | 38 (7.3%) |
| 15 to 19 Years | 46 (8.1%) | 3 (0.6%) |
| 20 to 24 Years | 21 (3.7%) | 32 (6.1%) |
| 25 to 29 Years | 91 (16.1%) | 40 (7.6%) |
| 30 to 34 Years | 13 (2.3%) | 21 (4.0%) |
| 35 to 39 Years | 59 (10.4%) | 13 (2.5%) |
| 40 to 44 Years | 0 (0.0%) | 53 (10.1%) |
| 45 to 49 Years | 28 (4.9%) | 12 (2.3%) |
| 50 to 54 Years | 18 (3.2%) | 44 (8.4%) |
| 55 to 59 Years | 39 (6.9%) | 54 (10.3%) |
| 60 to 64 Years | 45 (7.9%) | 15 (2.9%) |
| 65 to 69 Years | 27 (4.8%) | 26 (5.0%) |
| 70 to 74 Years | 19 (3.4%) | 35 (6.7%) |
| 75 to 79 Years | 8 (1.4%) | 47 (9.0%) |
| 80 to 84 Years | 33 (5.8%) | 14 (2.7%) |
| 85 Years and over | 14 (2.5%) | 21 (4.0%) |
| Total | 567 (100.0%) | 523 (100.0%) |
Families and Households in Johnstonville
Median Family Size in Johnstonville
The median family size in Johnstonville is 3.37 persons per family, with single female/mother families (55 | 19.5%) accounting for the largest median family size of 3.78 persons per family. On the other hand, single male/father families (7 | 2.5%) represent the smallest median family size with 2.71 persons per family.
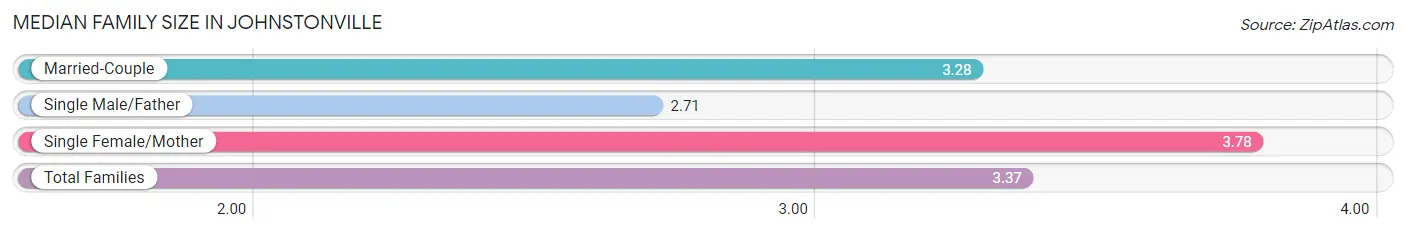
| Family Type | # Families | Family Size |
| Married-Couple | 220 (78.0%) | 3.28 |
| Single Male/Father | 7 (2.5%) | 2.71 |
| Single Female/Mother | 55 (19.5%) | 3.78 |
| Total Families | 282 (100.0%) | 3.37 |
Median Household Size in Johnstonville
The median household size in Johnstonville is 3.14 persons per household, with single male/father households (7 | 2.0%) accounting for the largest median household size of 4.29 persons per household. non-family households (65 | 18.7%) represent the smallest median household size with 1.20 persons per household.
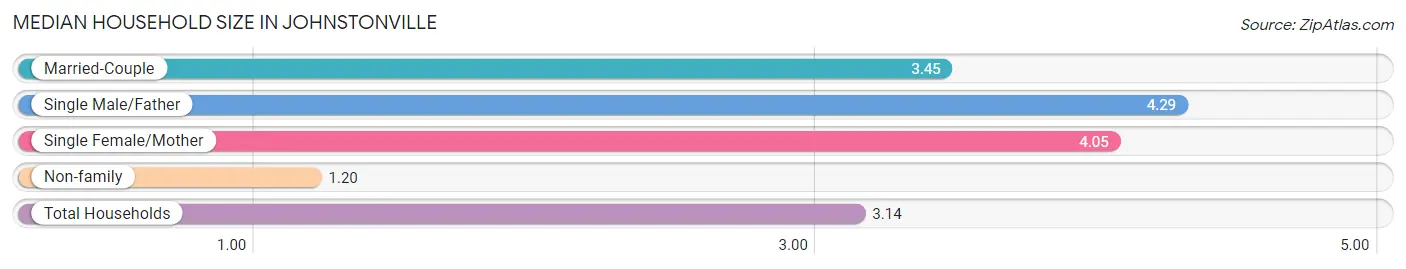
| Household Type | # Households | Household Size |
| Married-Couple | 220 (63.4%) | 3.45 |
| Single Male/Father | 7 (2.0%) | 4.29 |
| Single Female/Mother | 55 (15.9%) | 4.05 |
| Non-family | 65 (18.7%) | 1.20 |
| Total Households | 347 (100.0%) | 3.14 |
Household Size by Marriage Status in Johnstonville
Out of a total of 347 households in Johnstonville, 282 (81.3%) are family households, while 65 (18.7%) are nonfamily households. The most numerous type of family households are 2-person households, comprising 153, and the most common type of nonfamily households are 1-person households, comprising 52.
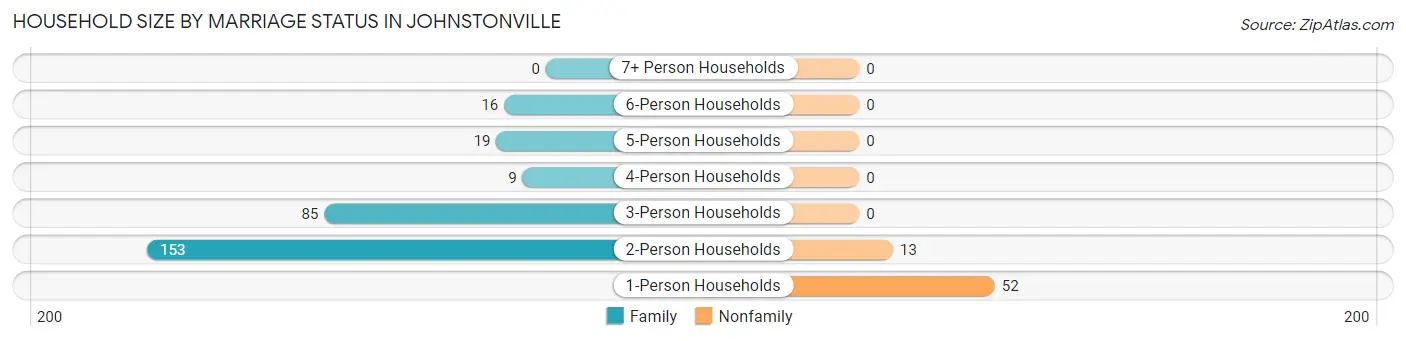
| Household Size | Family Households | Nonfamily Households |
| 1-Person Households | - | 52 (15.0%) |
| 2-Person Households | 153 (44.1%) | 13 (3.7%) |
| 3-Person Households | 85 (24.5%) | 0 (0.0%) |
| 4-Person Households | 9 (2.6%) | 0 (0.0%) |
| 5-Person Households | 19 (5.5%) | 0 (0.0%) |
| 6-Person Households | 16 (4.6%) | 0 (0.0%) |
| 7+ Person Households | 0 (0.0%) | 0 (0.0%) |
| Total | 282 (81.3%) | 65 (18.7%) |
Female Fertility in Johnstonville
Fertility by Age in Johnstonville
| Age Bracket | Women with Births | Births / 1,000 Women |
| 15 to 19 years | 0 (0.0%) | 0.0 |
| 20 to 34 years | 0 (0.0%) | 0.0 |
| 35 to 50 years | 0 (0.0%) | 0.0 |
| Total | 0 (0.0%) | 0.0 |
Fertility by Age by Marriage Status in Johnstonville
| Age Bracket | Married | Unmarried |
| 15 to 19 years | 0 (0.0%) | 0 (0.0%) |
| 20 to 34 years | 0 (0.0%) | 0 (0.0%) |
| 35 to 50 years | 0 (0.0%) | 0 (0.0%) |
| Total | 0 (0.0%) | 0 (0.0%) |
Fertility by Education in Johnstonville
| Educational Attainment | Women with Births | Births / 1,000 Women |
| Less than High School | 0 (0.0%) | 0.0 |
| High School Diploma | 0 (0.0%) | 0.0 |
| College or Associate's Degree | 0 (0.0%) | 0.0 |
| Bachelor's Degree | 0 (0.0%) | 0.0 |
| Graduate Degree | 0 (0.0%) | 0.0 |
| Total | 0 (0.0%) | 0.0 |
Fertility by Education by Marriage Status in Johnstonville
| Educational Attainment | Married | Unmarried |
| Less than High School | 0 (0.0%) | 0 (0.0%) |
| High School Diploma | 0 (0.0%) | 0 (0.0%) |
| College or Associate's Degree | 0 (0.0%) | 0 (0.0%) |
| Bachelor's Degree | 0 (0.0%) | 0 (0.0%) |
| Graduate Degree | 0 (0.0%) | 0 (0.0%) |
| Total | 0 (0.0%) | 0 (0.0%) |
Employment Characteristics in Johnstonville
Employment by Class of Employer in Johnstonville
Among the 366 employed individuals in Johnstonville, state government employees (100 | 27.3%), private company employees (74 | 20.2%), and federal government employees (55 | 15.0%) make up the most common classes of employment.
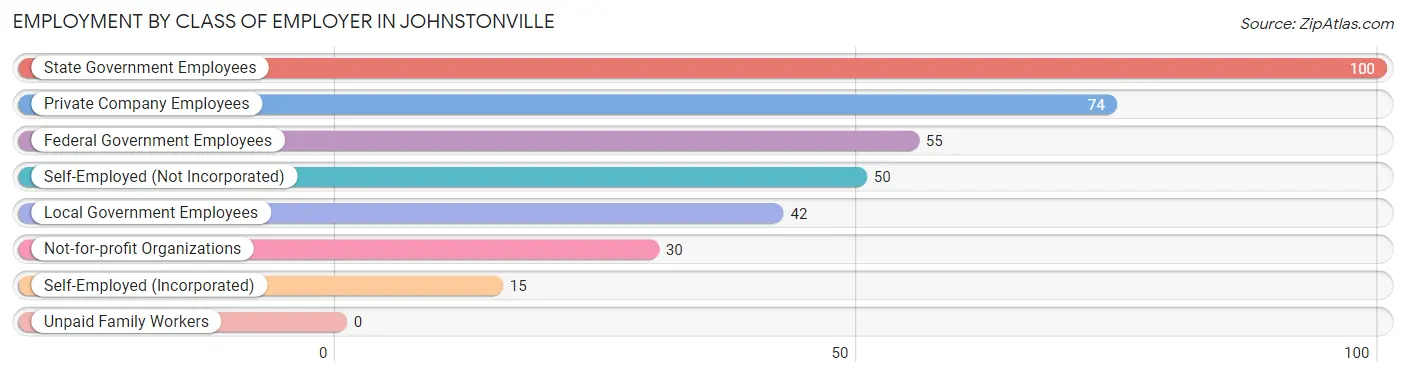
| Employer Class | # Employees | % Employees |
| Private Company Employees | 74 | 20.2% |
| Self-Employed (Incorporated) | 15 | 4.1% |
| Self-Employed (Not Incorporated) | 50 | 13.7% |
| Not-for-profit Organizations | 30 | 8.2% |
| Local Government Employees | 42 | 11.5% |
| State Government Employees | 100 | 27.3% |
| Federal Government Employees | 55 | 15.0% |
| Unpaid Family Workers | 0 | 0.0% |
| Total | 366 | 100.0% |
Employment Status by Age in Johnstonville
According to the labor force statistics for Johnstonville, out of the total population over 16 years of age (866), 50.3% or 436 individuals are in the labor force, with 12.4% or 54 of them unemployed. The age group with the highest labor force participation rate is 30 to 34 years, with 91.2% or 31 individuals in the labor force. Within the labor force, the 35 to 44 years age range has the highest percentage of unemployed individuals, with 30.7% or 31 of them being unemployed.
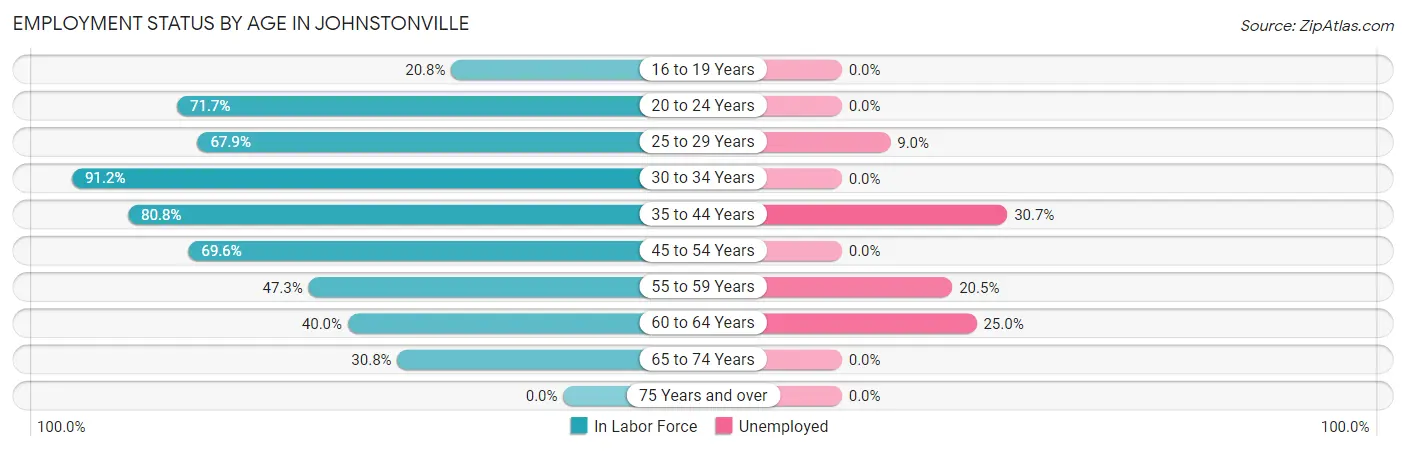
| Age Bracket | In Labor Force | Unemployed |
| 16 to 19 Years | 5 (20.8%) | 0 (0.0%) |
| 20 to 24 Years | 38 (71.7%) | 0 (0.0%) |
| 25 to 29 Years | 89 (67.9%) | 8 (9.0%) |
| 30 to 34 Years | 31 (91.2%) | 0 (0.0%) |
| 35 to 44 Years | 101 (80.8%) | 31 (30.7%) |
| 45 to 54 Years | 71 (69.6%) | 0 (0.0%) |
| 55 to 59 Years | 44 (47.3%) | 9 (20.5%) |
| 60 to 64 Years | 24 (40.0%) | 6 (25.0%) |
| 65 to 74 Years | 33 (30.8%) | 0 (0.0%) |
| 75 Years and over | 0 (0.0%) | 0 (0.0%) |
| Total | 436 (50.3%) | 54 (12.4%) |
Employment Status by Educational Attainment in Johnstonville
According to labor force statistics for Johnstonville, 66.1% of individuals (360) out of the total population between 25 and 64 years of age (545) are in the labor force, with 15.0% or 54 of them being unemployed. The group with the highest labor force participation rate are those with the educational attainment of less than high school, with 100.0% or 7 individuals in the labor force. Within the labor force, individuals with less than high school education have the highest percentage of unemployment, with 42.9% or 3 of them being unemployed.
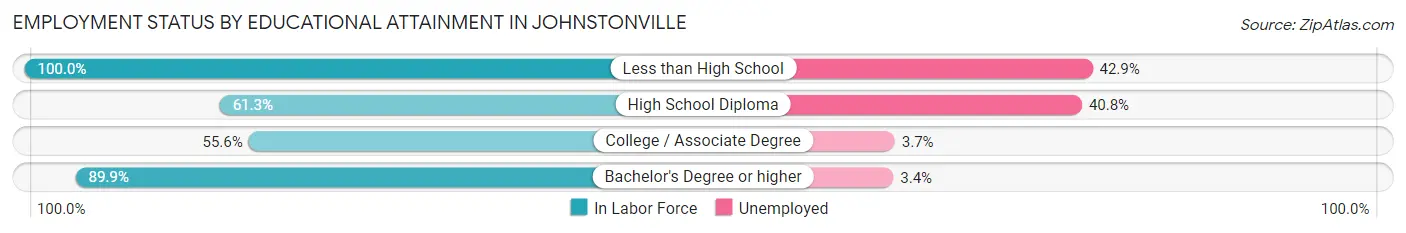
| Educational Attainment | In Labor Force | Unemployed |
| Less than High School | 7 (100.0%) | 3 (42.9%) |
| High School Diploma | 103 (61.3%) | 69 (40.8%) |
| College / Associate Degree | 134 (55.6%) | 9 (3.7%) |
| Bachelor's Degree or higher | 116 (89.9%) | 4 (3.4%) |
| Total | 360 (66.1%) | 82 (15.0%) |
Employment Occupations by Sex in Johnstonville
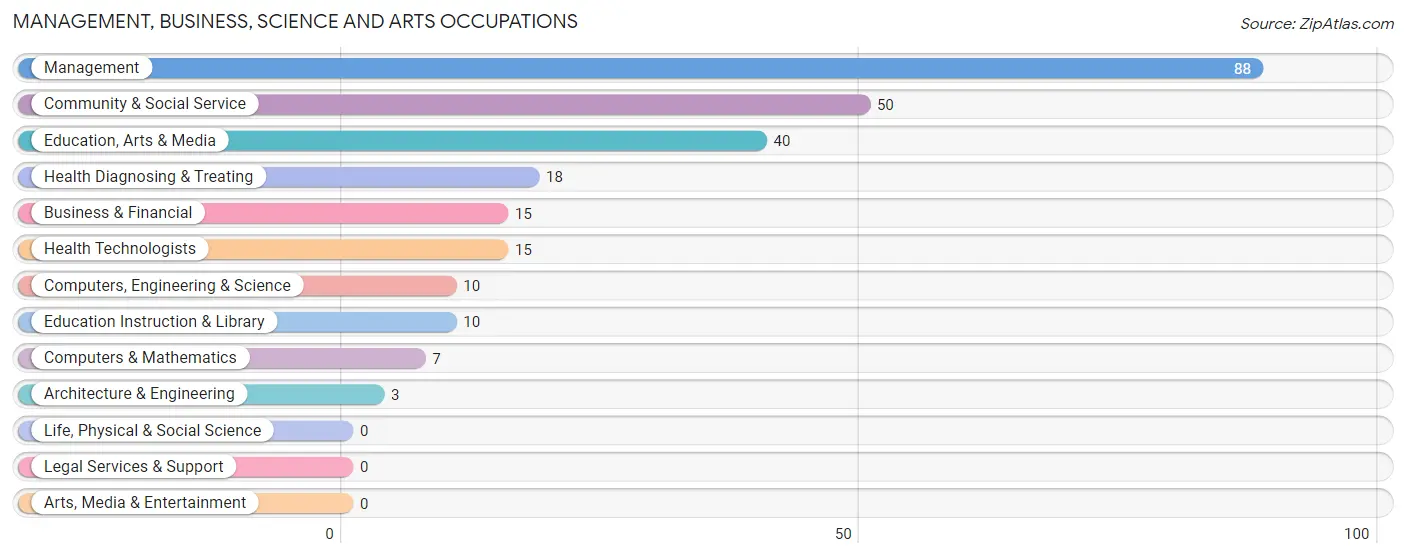
Management, Business, Science and Arts Occupations
The most common Management, Business, Science and Arts occupations in Johnstonville are Management (88 | 23.0%), Community & Social Service (50 | 13.1%), Education, Arts & Media (40 | 10.5%), Health Diagnosing & Treating (18 | 4.7%), and Business & Financial (15 | 3.9%).
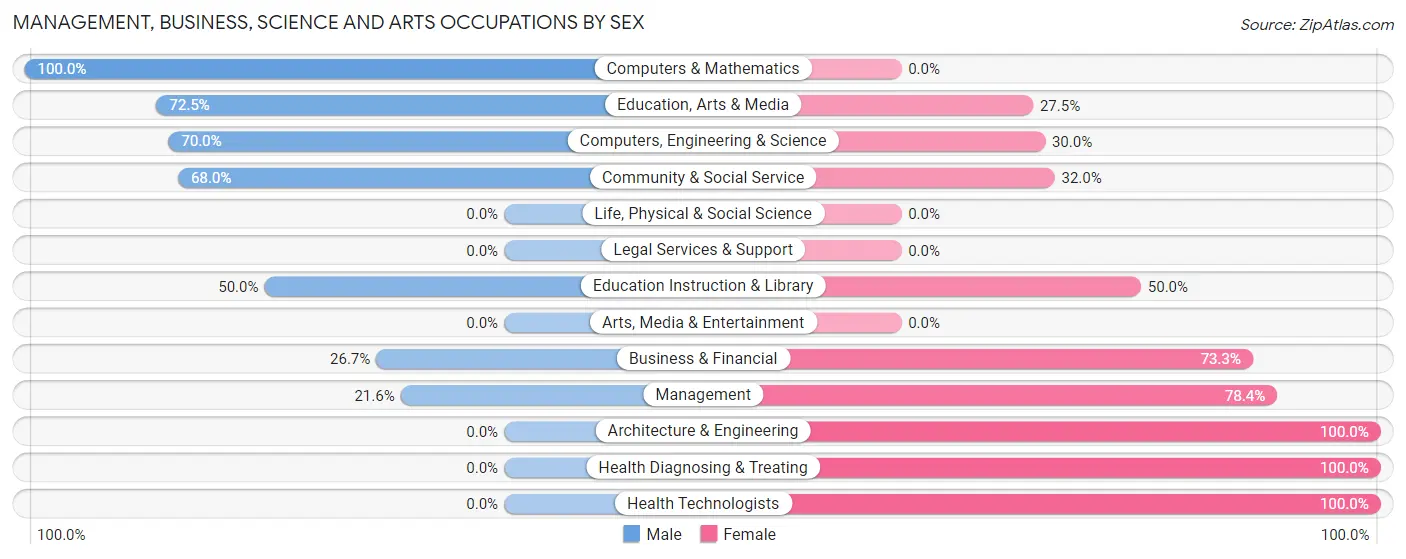
Management, Business, Science and Arts Occupations by Sex
Within the Management, Business, Science and Arts occupations in Johnstonville, the most male-oriented occupations are Computers & Mathematics (100.0%), Education, Arts & Media (72.5%), and Computers, Engineering & Science (70.0%), while the most female-oriented occupations are Architecture & Engineering (100.0%), Health Diagnosing & Treating (100.0%), and Health Technologists (100.0%).
| Occupation | Male | Female |
| Management | 19 (21.6%) | 69 (78.4%) |
| Business & Financial | 4 (26.7%) | 11 (73.3%) |
| Computers, Engineering & Science | 7 (70.0%) | 3 (30.0%) |
| Computers & Mathematics | 7 (100.0%) | 0 (0.0%) |
| Architecture & Engineering | 0 (0.0%) | 3 (100.0%) |
| Life, Physical & Social Science | 0 (0.0%) | 0 (0.0%) |
| Community & Social Service | 34 (68.0%) | 16 (32.0%) |
| Education, Arts & Media | 29 (72.5%) | 11 (27.5%) |
| Legal Services & Support | 0 (0.0%) | 0 (0.0%) |
| Education Instruction & Library | 5 (50.0%) | 5 (50.0%) |
| Arts, Media & Entertainment | 0 (0.0%) | 0 (0.0%) |
| Health Diagnosing & Treating | 0 (0.0%) | 18 (100.0%) |
| Health Technologists | 0 (0.0%) | 15 (100.0%) |
| Total (Category) | 64 (35.4%) | 117 (64.6%) |
| Total (Overall) | 162 (42.4%) | 220 (57.6%) |
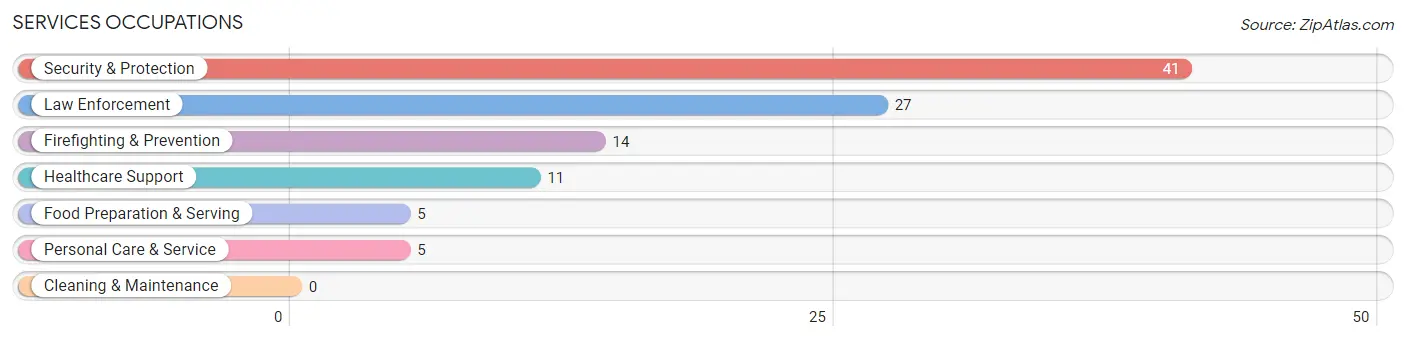
Services Occupations
The most common Services occupations in Johnstonville are Security & Protection (41 | 10.7%), Law Enforcement (27 | 7.1%), Firefighting & Prevention (14 | 3.7%), Healthcare Support (11 | 2.9%), and Food Preparation & Serving (5 | 1.3%).
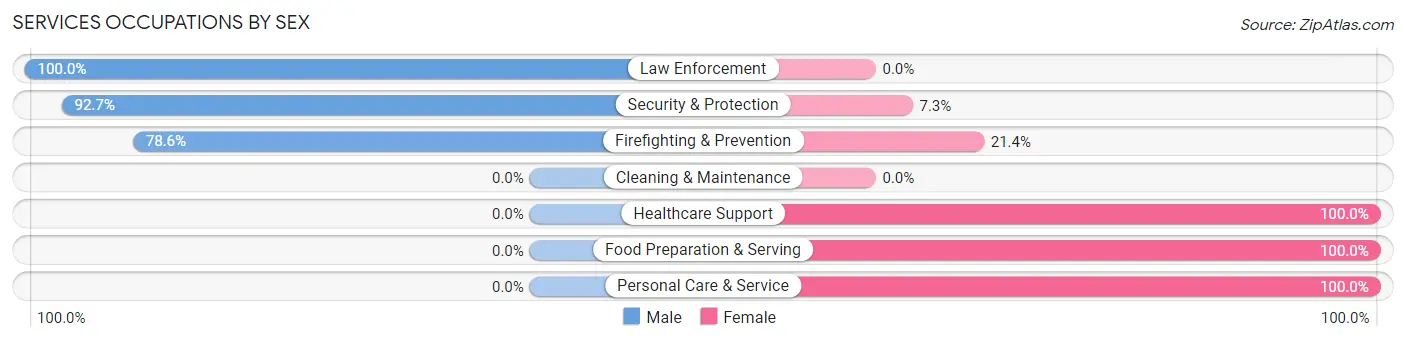
Services Occupations by Sex
Within the Services occupations in Johnstonville, the most male-oriented occupations are Law Enforcement (100.0%), Security & Protection (92.7%), and Firefighting & Prevention (78.6%), while the most female-oriented occupations are Healthcare Support (100.0%), Food Preparation & Serving (100.0%), and Personal Care & Service (100.0%).
| Occupation | Male | Female |
| Healthcare Support | 0 (0.0%) | 11 (100.0%) |
| Security & Protection | 38 (92.7%) | 3 (7.3%) |
| Firefighting & Prevention | 11 (78.6%) | 3 (21.4%) |
| Law Enforcement | 27 (100.0%) | 0 (0.0%) |
| Food Preparation & Serving | 0 (0.0%) | 5 (100.0%) |
| Cleaning & Maintenance | 0 (0.0%) | 0 (0.0%) |
| Personal Care & Service | 0 (0.0%) | 5 (100.0%) |
| Total (Category) | 38 (61.3%) | 24 (38.7%) |
| Total (Overall) | 162 (42.4%) | 220 (57.6%) |
Sales and Office Occupations
The most common Sales and Office occupations in Johnstonville are Office & Administration (68 | 17.8%), and Sales & Related (19 | 5.0%).
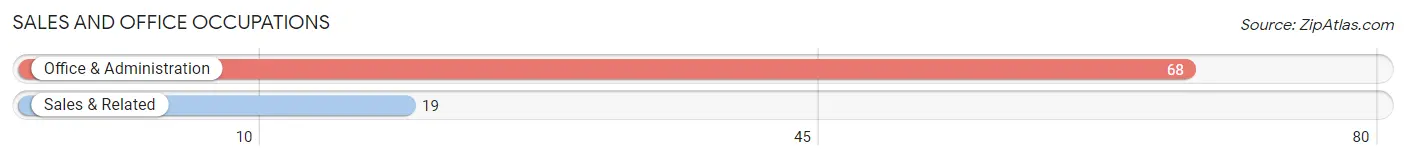
Sales and Office Occupations by Sex
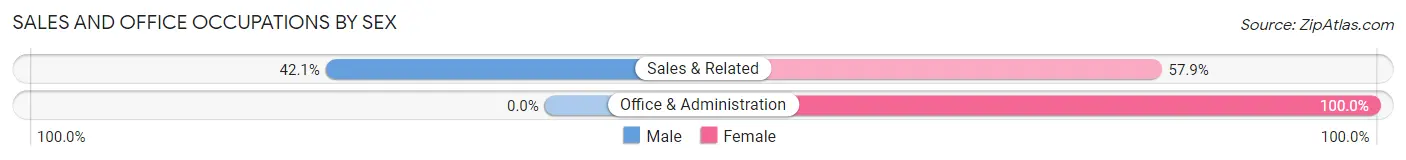
| Occupation | Male | Female |
| Sales & Related | 8 (42.1%) | 11 (57.9%) |
| Office & Administration | 0 (0.0%) | 68 (100.0%) |
| Total (Category) | 8 (9.2%) | 79 (90.8%) |
| Total (Overall) | 162 (42.4%) | 220 (57.6%) |
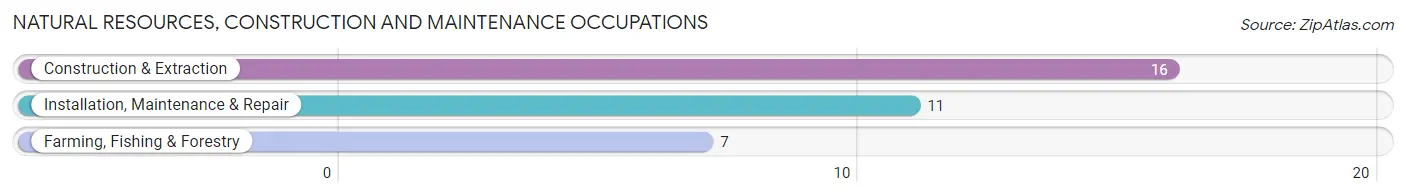
Natural Resources, Construction and Maintenance Occupations
The most common Natural Resources, Construction and Maintenance occupations in Johnstonville are Construction & Extraction (16 | 4.2%), Installation, Maintenance & Repair (11 | 2.9%), and Farming, Fishing & Forestry (7 | 1.8%).
Natural Resources, Construction and Maintenance Occupations by Sex
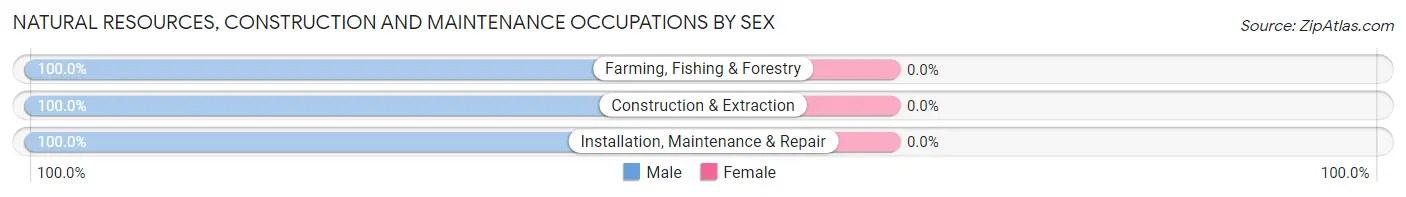
| Occupation | Male | Female |
| Farming, Fishing & Forestry | 7 (100.0%) | 0 (0.0%) |
| Construction & Extraction | 16 (100.0%) | 0 (0.0%) |
| Installation, Maintenance & Repair | 11 (100.0%) | 0 (0.0%) |
| Total (Category) | 34 (100.0%) | 0 (0.0%) |
| Total (Overall) | 162 (42.4%) | 220 (57.6%) |
Production, Transportation and Moving Occupations
The most common Production, Transportation and Moving occupations in Johnstonville are Production (10 | 2.6%), Transportation (7 | 1.8%), and Material Moving (1 | 0.3%).
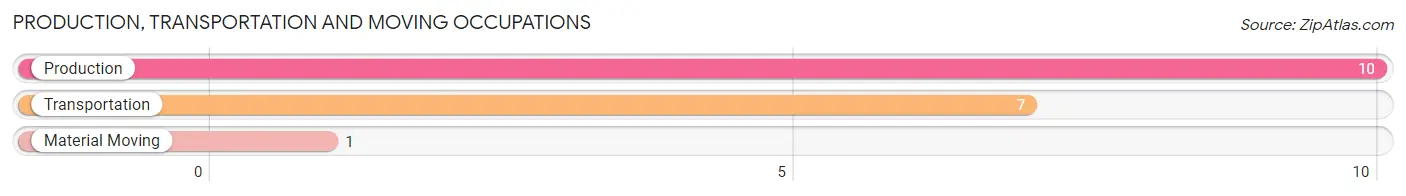
Production, Transportation and Moving Occupations by Sex
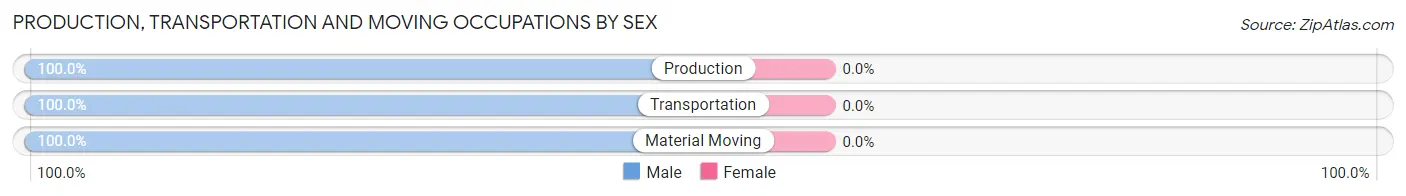
| Occupation | Male | Female |
| Production | 10 (100.0%) | 0 (0.0%) |
| Transportation | 7 (100.0%) | 0 (0.0%) |
| Material Moving | 1 (100.0%) | 0 (0.0%) |
| Total (Category) | 18 (100.0%) | 0 (0.0%) |
| Total (Overall) | 162 (42.4%) | 220 (57.6%) |
Employment Industries by Sex in Johnstonville
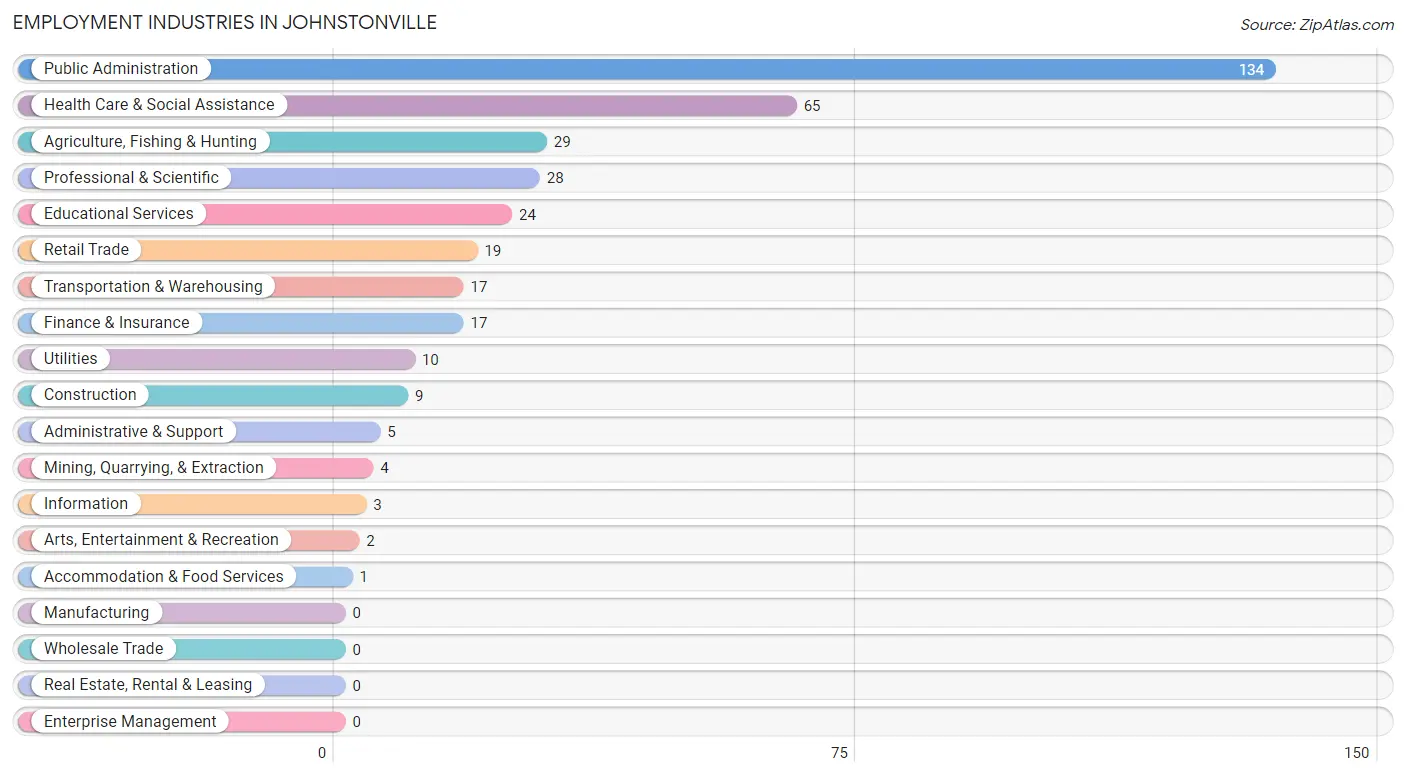
Employment Industries in Johnstonville
The major employment industries in Johnstonville include Public Administration (134 | 35.1%), Health Care & Social Assistance (65 | 17.0%), Agriculture, Fishing & Hunting (29 | 7.6%), Professional & Scientific (28 | 7.3%), and Educational Services (24 | 6.3%).
Employment Industries by Sex in Johnstonville
The Johnstonville industries that see more men than women are Mining, Quarrying, & Extraction (100.0%), Construction (100.0%), and Utilities (100.0%), whereas the industries that tend to have a higher number of women are Finance & Insurance (100.0%), Professional & Scientific (100.0%), and Administrative & Support (100.0%).
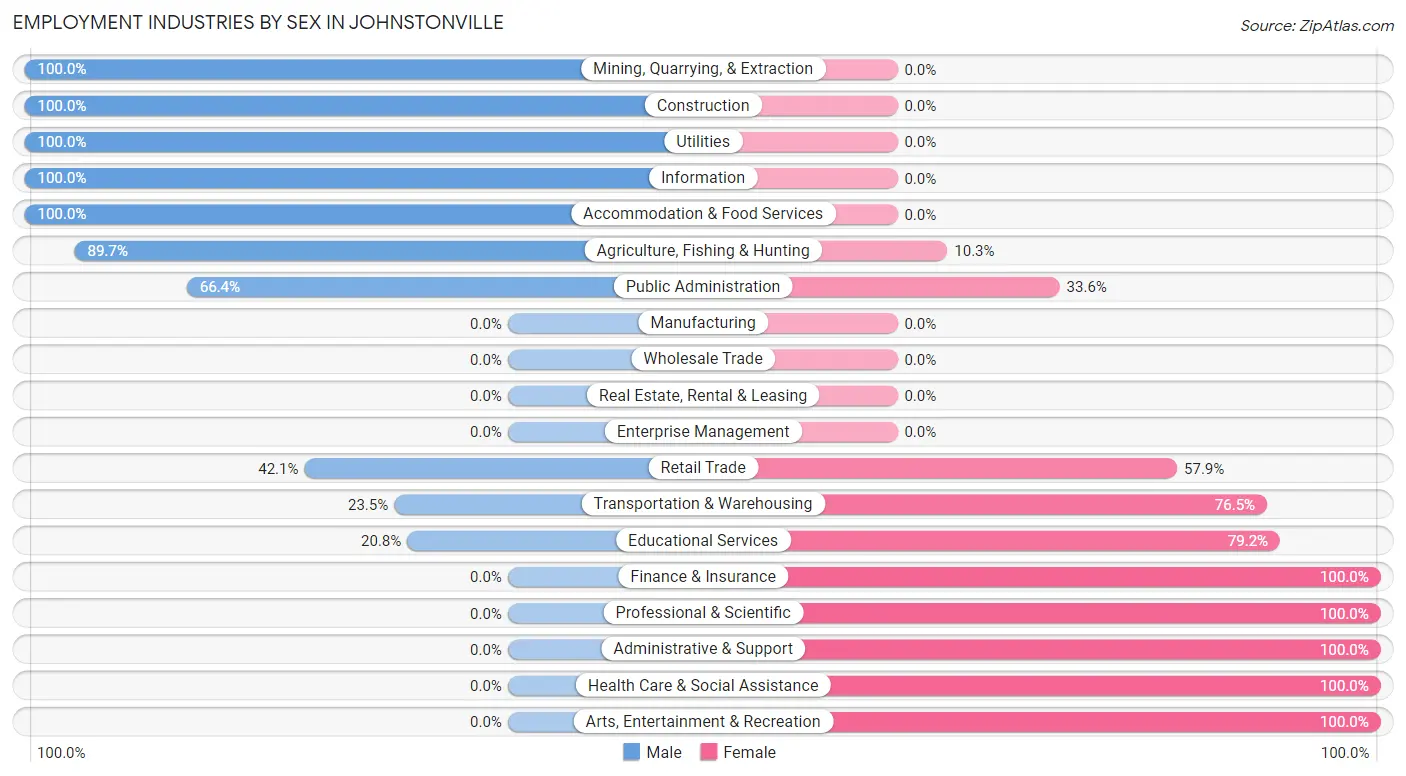
| Industry | Male | Female |
| Agriculture, Fishing & Hunting | 26 (89.7%) | 3 (10.3%) |
| Mining, Quarrying, & Extraction | 4 (100.0%) | 0 (0.0%) |
| Construction | 9 (100.0%) | 0 (0.0%) |
| Manufacturing | 0 (0.0%) | 0 (0.0%) |
| Wholesale Trade | 0 (0.0%) | 0 (0.0%) |
| Retail Trade | 8 (42.1%) | 11 (57.9%) |
| Transportation & Warehousing | 4 (23.5%) | 13 (76.5%) |
| Utilities | 10 (100.0%) | 0 (0.0%) |
| Information | 3 (100.0%) | 0 (0.0%) |
| Finance & Insurance | 0 (0.0%) | 17 (100.0%) |
| Real Estate, Rental & Leasing | 0 (0.0%) | 0 (0.0%) |
| Professional & Scientific | 0 (0.0%) | 28 (100.0%) |
| Enterprise Management | 0 (0.0%) | 0 (0.0%) |
| Administrative & Support | 0 (0.0%) | 5 (100.0%) |
| Educational Services | 5 (20.8%) | 19 (79.2%) |
| Health Care & Social Assistance | 0 (0.0%) | 65 (100.0%) |
| Arts, Entertainment & Recreation | 0 (0.0%) | 2 (100.0%) |
| Accommodation & Food Services | 1 (100.0%) | 0 (0.0%) |
| Public Administration | 89 (66.4%) | 45 (33.6%) |
| Total | 162 (42.4%) | 220 (57.6%) |
Education in Johnstonville
School Enrollment in Johnstonville
The most common levels of schooling among the 288 students in Johnstonville are elementary school (71 | 24.6%), middle school (62 | 21.5%), and college / undergraduate (58 | 20.1%).
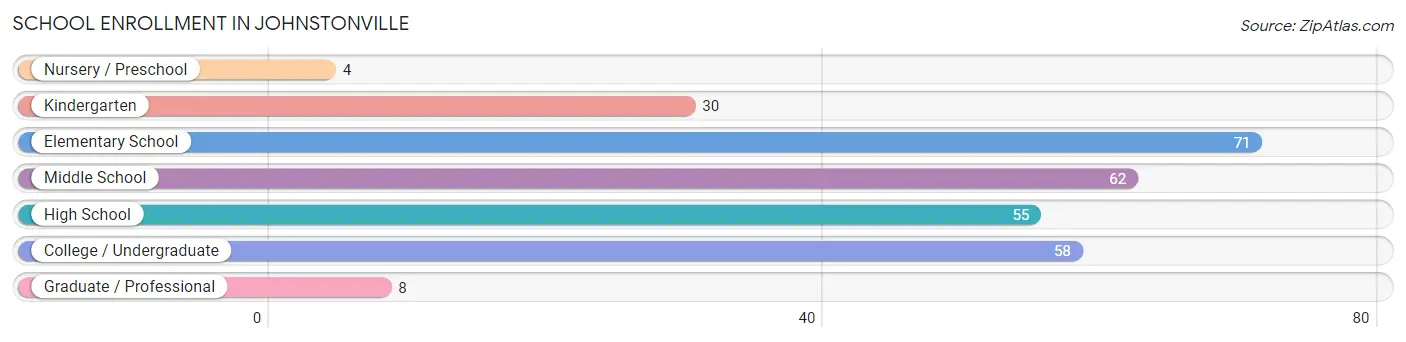
| School Level | # Students | % Students |
| Nursery / Preschool | 4 | 1.4% |
| Kindergarten | 30 | 10.4% |
| Elementary School | 71 | 24.6% |
| Middle School | 62 | 21.5% |
| High School | 55 | 19.1% |
| College / Undergraduate | 58 | 20.1% |
| Graduate / Professional | 8 | 2.8% |
| Total | 288 | 100.0% |
School Enrollment by Age by Funding Source in Johnstonville
Out of a total of 288 students who are enrolled in schools in Johnstonville, 11 (3.8%) attend a private institution, while the remaining 277 (96.2%) are enrolled in public schools. The age group of 35 years and over has the highest likelihood of being enrolled in private schools, with 3 (25.0% in the age bracket) enrolled. Conversely, the age group of 10 to 14 year olds has the lowest likelihood of being enrolled in a private school, with 90 (100.0% in the age bracket) attending a public institution.
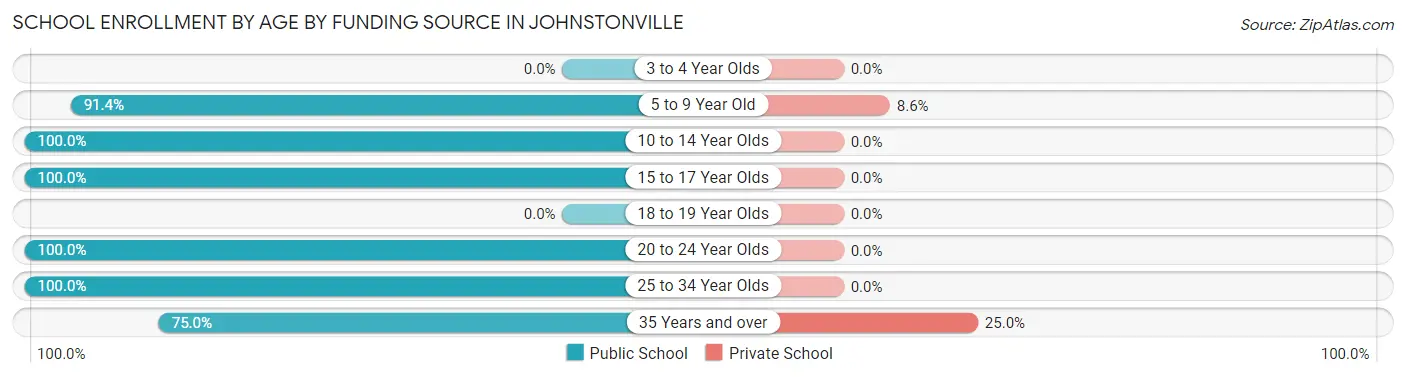
| Age Bracket | Public School | Private School |
| 3 to 4 Year Olds | 0 (0.0%) | 0 (0.0%) |
| 5 to 9 Year Old | 85 (91.4%) | 8 (8.6%) |
| 10 to 14 Year Olds | 90 (100.0%) | 0 (0.0%) |
| 15 to 17 Year Olds | 39 (100.0%) | 0 (0.0%) |
| 18 to 19 Year Olds | 0 (0.0%) | 0 (0.0%) |
| 20 to 24 Year Olds | 14 (100.0%) | 0 (0.0%) |
| 25 to 34 Year Olds | 40 (100.0%) | 0 (0.0%) |
| 35 Years and over | 9 (75.0%) | 3 (25.0%) |
| Total | 277 (96.2%) | 11 (3.8%) |
Educational Attainment by Field of Study in Johnstonville
Business (39 | 24.7%), liberal arts & history (33 | 20.9%), psychology (28 | 17.7%), science & technology (18 | 11.4%), and education (10 | 6.3%) are the most common fields of study among 158 individuals in Johnstonville who have obtained a bachelor's degree or higher.
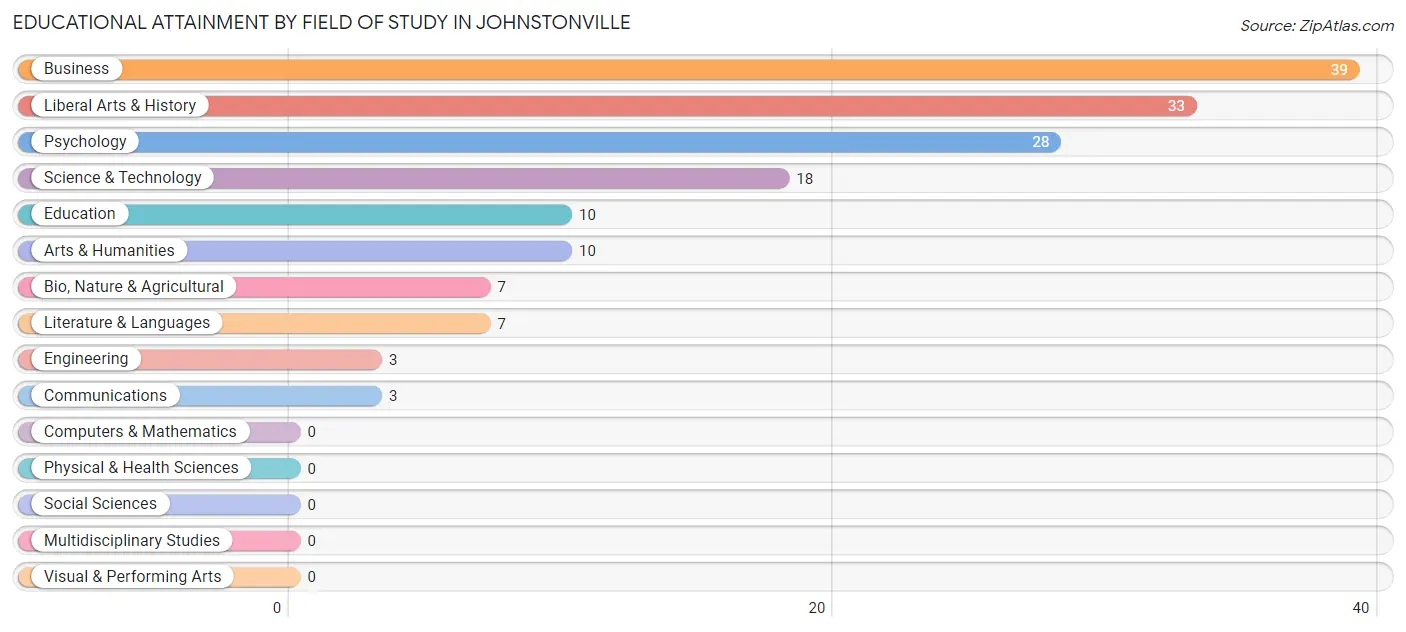
| Field of Study | # Graduates | % Graduates |
| Computers & Mathematics | 0 | 0.0% |
| Bio, Nature & Agricultural | 7 | 4.4% |
| Physical & Health Sciences | 0 | 0.0% |
| Psychology | 28 | 17.7% |
| Social Sciences | 0 | 0.0% |
| Engineering | 3 | 1.9% |
| Multidisciplinary Studies | 0 | 0.0% |
| Science & Technology | 18 | 11.4% |
| Business | 39 | 24.7% |
| Education | 10 | 6.3% |
| Literature & Languages | 7 | 4.4% |
| Liberal Arts & History | 33 | 20.9% |
| Visual & Performing Arts | 0 | 0.0% |
| Communications | 3 | 1.9% |
| Arts & Humanities | 10 | 6.3% |
| Total | 158 | 100.0% |
Transportation & Commute in Johnstonville
Vehicle Availability by Sex in Johnstonville
The most prevalent vehicle ownership categories in Johnstonville are males with 2 vehicles (62, accounting for 38.3%) and females with 2 vehicles (79, making up 30.4%).
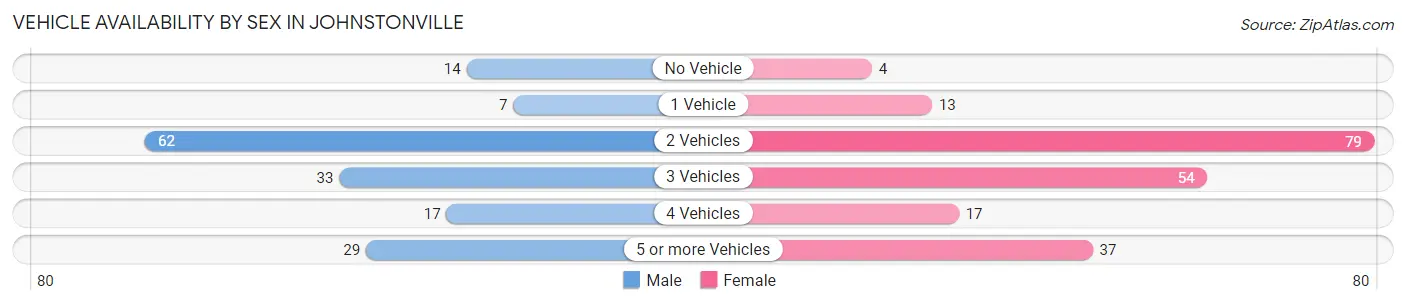
| Vehicles Available | Male | Female |
| No Vehicle | 14 (8.6%) | 4 (2.0%) |
| 1 Vehicle | 7 (4.3%) | 13 (6.4%) |
| 2 Vehicles | 62 (38.3%) | 79 (38.7%) |
| 3 Vehicles | 33 (20.4%) | 54 (26.5%) |
| 4 Vehicles | 17 (10.5%) | 17 (8.3%) |
| 5 or more Vehicles | 29 (17.9%) | 37 (18.1%) |
| Total | 162 (100.0%) | 204 (100.0%) |
Commute Time in Johnstonville
The most frequently occuring commute durations in Johnstonville are 10 to 14 minutes (167 commuters, 50.6%), 5 to 9 minutes (63 commuters, 19.1%), and 15 to 19 minutes (43 commuters, 13.0%).
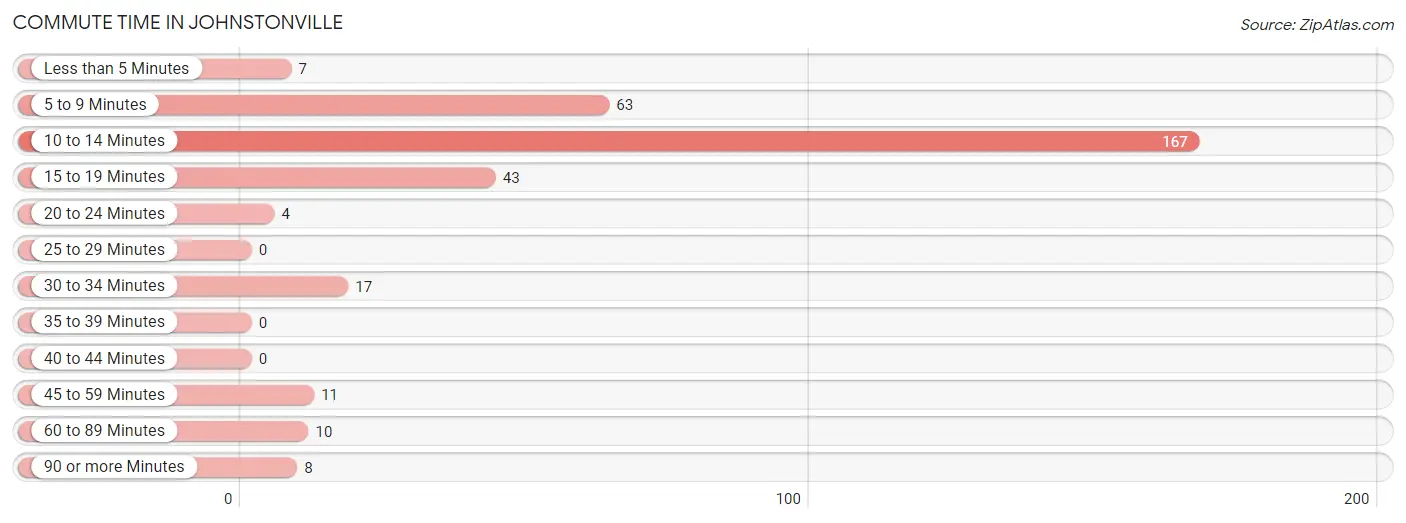
| Commute Time | # Commuters | % Commuters |
| Less than 5 Minutes | 7 | 2.1% |
| 5 to 9 Minutes | 63 | 19.1% |
| 10 to 14 Minutes | 167 | 50.6% |
| 15 to 19 Minutes | 43 | 13.0% |
| 20 to 24 Minutes | 4 | 1.2% |
| 25 to 29 Minutes | 0 | 0.0% |
| 30 to 34 Minutes | 17 | 5.1% |
| 35 to 39 Minutes | 0 | 0.0% |
| 40 to 44 Minutes | 0 | 0.0% |
| 45 to 59 Minutes | 11 | 3.3% |
| 60 to 89 Minutes | 10 | 3.0% |
| 90 or more Minutes | 8 | 2.4% |
Commute Time by Sex in Johnstonville
The most common commute times in Johnstonville are 10 to 14 minutes (73 commuters, 48.0%) for males and 10 to 14 minutes (94 commuters, 52.8%) for females.
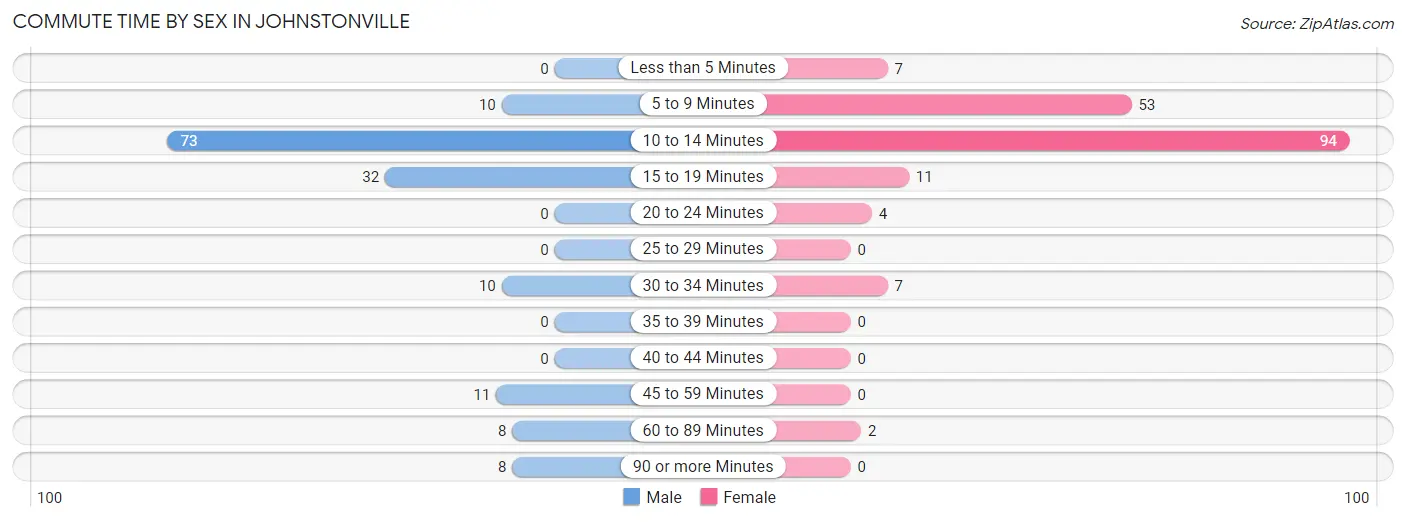
| Commute Time | Male | Female |
| Less than 5 Minutes | 0 (0.0%) | 7 (3.9%) |
| 5 to 9 Minutes | 10 (6.6%) | 53 (29.8%) |
| 10 to 14 Minutes | 73 (48.0%) | 94 (52.8%) |
| 15 to 19 Minutes | 32 (21.0%) | 11 (6.2%) |
| 20 to 24 Minutes | 0 (0.0%) | 4 (2.2%) |
| 25 to 29 Minutes | 0 (0.0%) | 0 (0.0%) |
| 30 to 34 Minutes | 10 (6.6%) | 7 (3.9%) |
| 35 to 39 Minutes | 0 (0.0%) | 0 (0.0%) |
| 40 to 44 Minutes | 0 (0.0%) | 0 (0.0%) |
| 45 to 59 Minutes | 11 (7.2%) | 0 (0.0%) |
| 60 to 89 Minutes | 8 (5.3%) | 2 (1.1%) |
| 90 or more Minutes | 8 (5.3%) | 0 (0.0%) |
Time of Departure to Work by Sex in Johnstonville
The most frequent times of departure to work in Johnstonville are 7:30 AM to 7:59 AM (47, 30.9%) for males and 7:30 AM to 7:59 AM (51, 28.6%) for females.
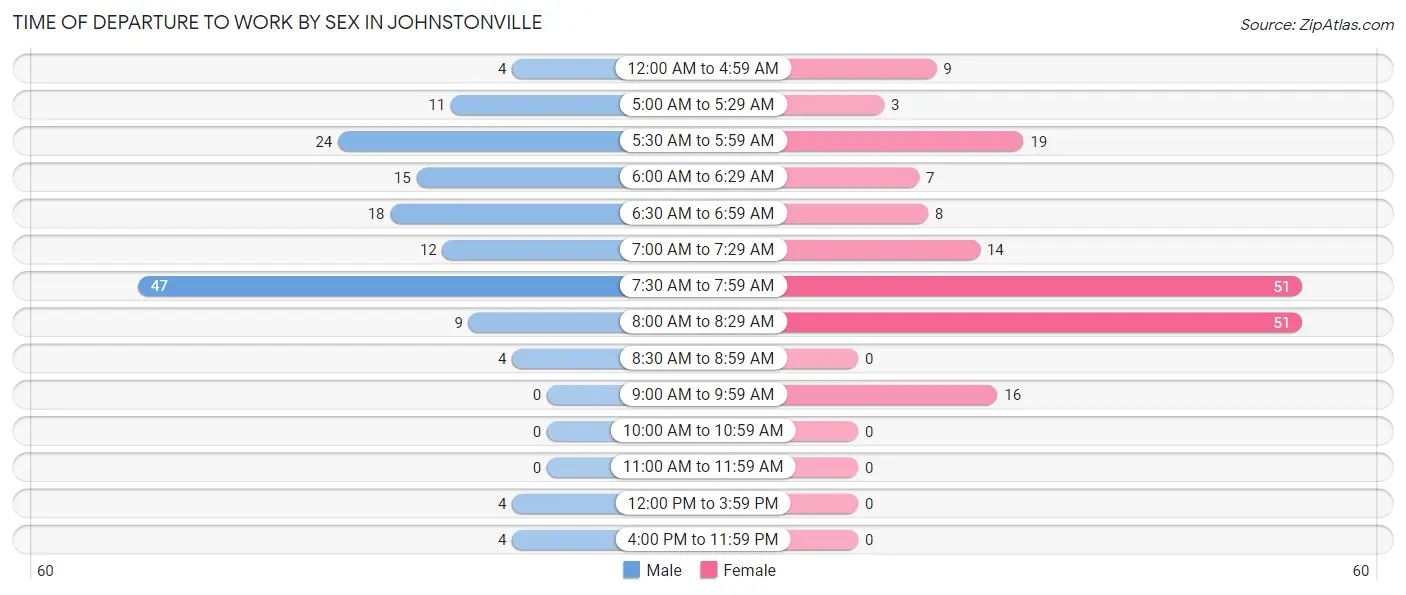
| Time of Departure | Male | Female |
| 12:00 AM to 4:59 AM | 4 (2.6%) | 9 (5.1%) |
| 5:00 AM to 5:29 AM | 11 (7.2%) | 3 (1.7%) |
| 5:30 AM to 5:59 AM | 24 (15.8%) | 19 (10.7%) |
| 6:00 AM to 6:29 AM | 15 (9.9%) | 7 (3.9%) |
| 6:30 AM to 6:59 AM | 18 (11.8%) | 8 (4.5%) |
| 7:00 AM to 7:29 AM | 12 (7.9%) | 14 (7.9%) |
| 7:30 AM to 7:59 AM | 47 (30.9%) | 51 (28.6%) |
| 8:00 AM to 8:29 AM | 9 (5.9%) | 51 (28.6%) |
| 8:30 AM to 8:59 AM | 4 (2.6%) | 0 (0.0%) |
| 9:00 AM to 9:59 AM | 0 (0.0%) | 16 (9.0%) |
| 10:00 AM to 10:59 AM | 0 (0.0%) | 0 (0.0%) |
| 11:00 AM to 11:59 AM | 0 (0.0%) | 0 (0.0%) |
| 12:00 PM to 3:59 PM | 4 (2.6%) | 0 (0.0%) |
| 4:00 PM to 11:59 PM | 4 (2.6%) | 0 (0.0%) |
| Total | 152 (100.0%) | 178 (100.0%) |
Housing Occupancy in Johnstonville
Occupancy by Ownership in Johnstonville
Of the total 347 dwellings in Johnstonville, owner-occupied units account for 312 (89.9%), while renter-occupied units make up 35 (10.1%).
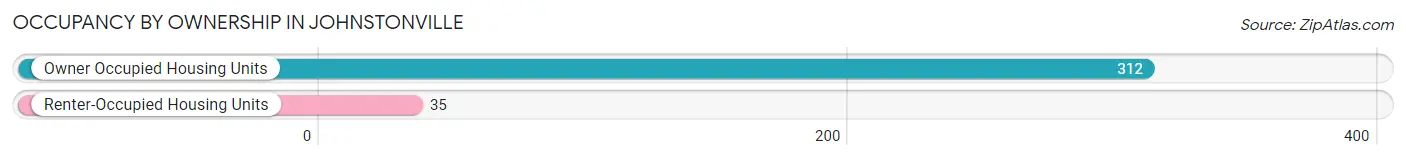
| Occupancy | # Housing Units | % Housing Units |
| Owner Occupied Housing Units | 312 | 89.9% |
| Renter-Occupied Housing Units | 35 | 10.1% |
| Total Occupied Housing Units | 347 | 100.0% |
Occupancy by Household Size in Johnstonville
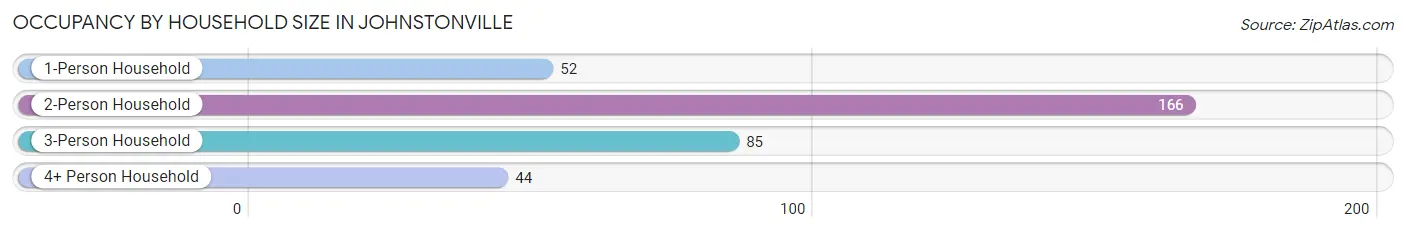
| Household Size | # Housing Units | % Housing Units |
| 1-Person Household | 52 | 15.0% |
| 2-Person Household | 166 | 47.8% |
| 3-Person Household | 85 | 24.5% |
| 4+ Person Household | 44 | 12.7% |
| Total Housing Units | 347 | 100.0% |
Occupancy by Ownership by Household Size in Johnstonville
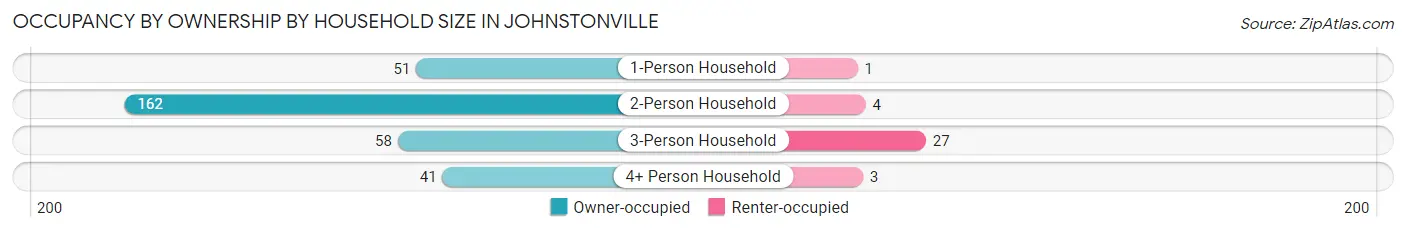
| Household Size | Owner-occupied | Renter-occupied |
| 1-Person Household | 51 (98.1%) | 1 (1.9%) |
| 2-Person Household | 162 (97.6%) | 4 (2.4%) |
| 3-Person Household | 58 (68.2%) | 27 (31.8%) |
| 4+ Person Household | 41 (93.2%) | 3 (6.8%) |
| Total Housing Units | 312 (89.9%) | 35 (10.1%) |
Occupancy by Educational Attainment in Johnstonville
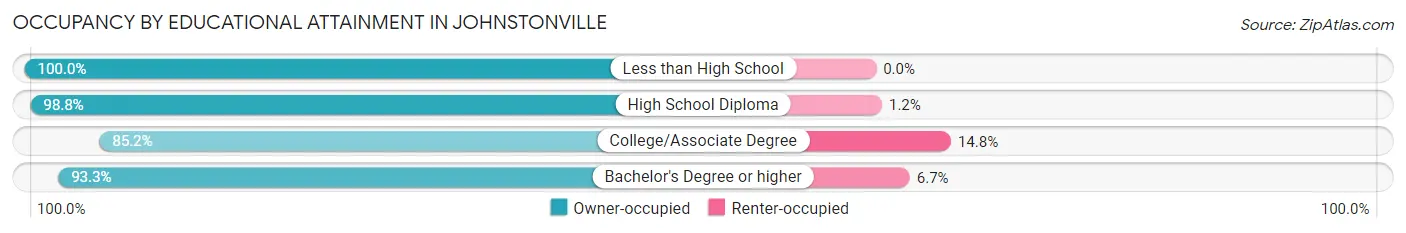
| Household Size | Owner-occupied | Renter-occupied |
| Less than High School | 7 (100.0%) | 0 (0.0%) |
| High School Diploma | 85 (98.8%) | 1 (1.2%) |
| College/Associate Degree | 178 (85.2%) | 31 (14.8%) |
| Bachelor's Degree or higher | 42 (93.3%) | 3 (6.7%) |
Occupancy by Age of Householder in Johnstonville
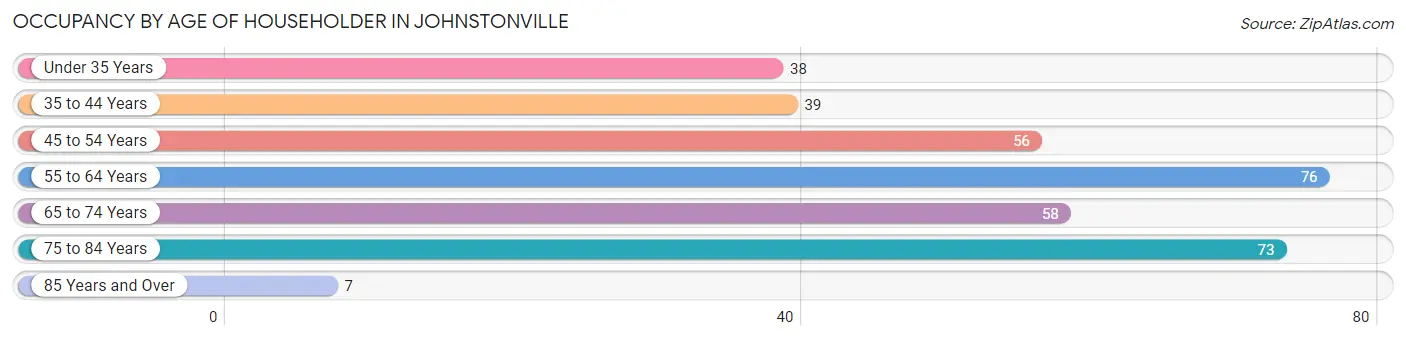
| Age Bracket | # Households | % Households |
| Under 35 Years | 38 | 11.0% |
| 35 to 44 Years | 39 | 11.2% |
| 45 to 54 Years | 56 | 16.1% |
| 55 to 64 Years | 76 | 21.9% |
| 65 to 74 Years | 58 | 16.7% |
| 75 to 84 Years | 73 | 21.0% |
| 85 Years and Over | 7 | 2.0% |
| Total | 347 | 100.0% |
Housing Finances in Johnstonville
Median Income by Occupancy in Johnstonville
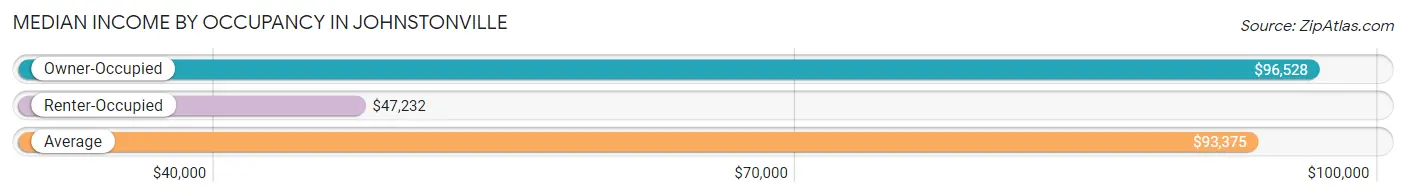
| Occupancy Type | # Households | Median Income |
| Owner-Occupied | 312 (89.9%) | $96,528 |
| Renter-Occupied | 35 (10.1%) | $47,232 |
| Average | 347 (100.0%) | $93,375 |
Occupancy by Householder Income Bracket in Johnstonville
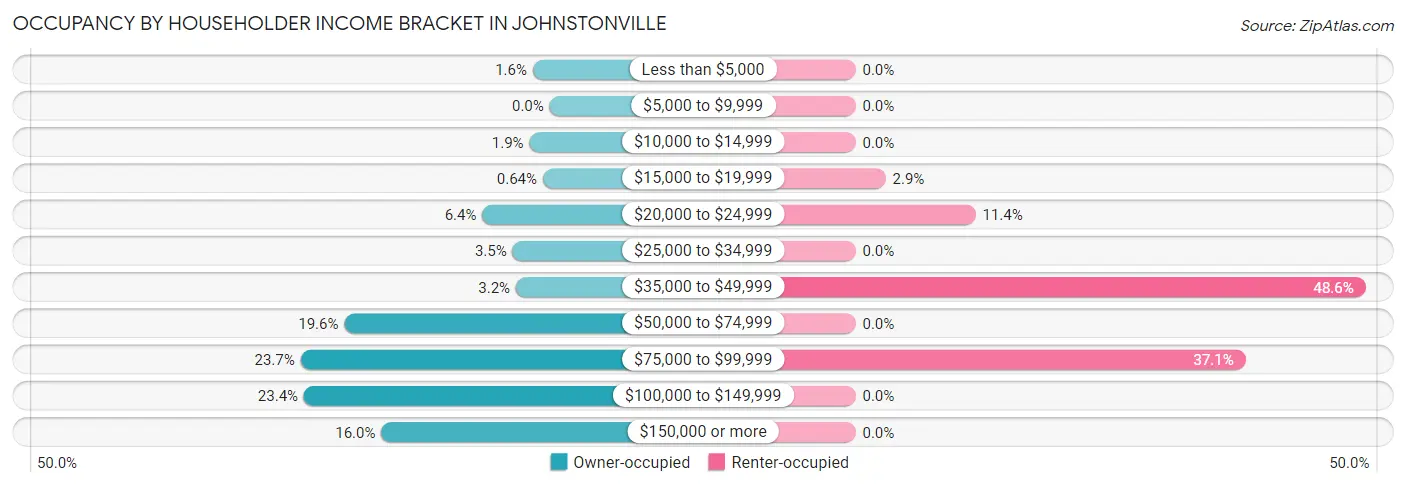
| Income Bracket | Owner-occupied | Renter-occupied |
| Less than $5,000 | 5 (1.6%) | 0 (0.0%) |
| $5,000 to $9,999 | 0 (0.0%) | 0 (0.0%) |
| $10,000 to $14,999 | 6 (1.9%) | 0 (0.0%) |
| $15,000 to $19,999 | 2 (0.6%) | 1 (2.9%) |
| $20,000 to $24,999 | 20 (6.4%) | 4 (11.4%) |
| $25,000 to $34,999 | 11 (3.5%) | 0 (0.0%) |
| $35,000 to $49,999 | 10 (3.2%) | 17 (48.6%) |
| $50,000 to $74,999 | 61 (19.6%) | 0 (0.0%) |
| $75,000 to $99,999 | 74 (23.7%) | 13 (37.1%) |
| $100,000 to $149,999 | 73 (23.4%) | 0 (0.0%) |
| $150,000 or more | 50 (16.0%) | 0 (0.0%) |
| Total | 312 (100.0%) | 35 (100.0%) |
Monthly Housing Cost Tiers in Johnstonville
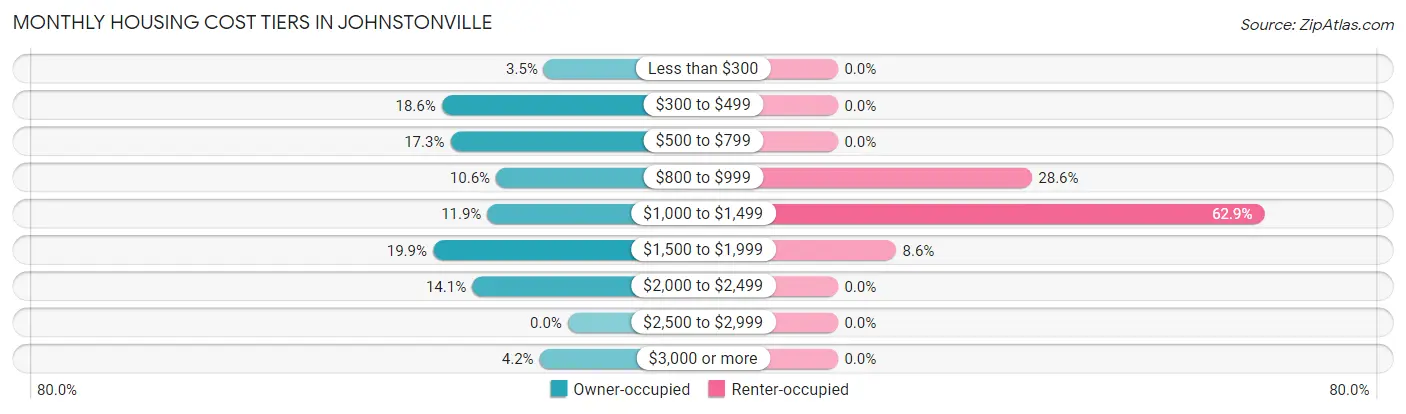
| Monthly Cost | Owner-occupied | Renter-occupied |
| Less than $300 | 11 (3.5%) | 0 (0.0%) |
| $300 to $499 | 58 (18.6%) | 0 (0.0%) |
| $500 to $799 | 54 (17.3%) | 0 (0.0%) |
| $800 to $999 | 33 (10.6%) | 10 (28.6%) |
| $1,000 to $1,499 | 37 (11.9%) | 22 (62.9%) |
| $1,500 to $1,999 | 62 (19.9%) | 3 (8.6%) |
| $2,000 to $2,499 | 44 (14.1%) | 0 (0.0%) |
| $2,500 to $2,999 | 0 (0.0%) | 0 (0.0%) |
| $3,000 or more | 13 (4.2%) | 0 (0.0%) |
| Total | 312 (100.0%) | 35 (100.0%) |
Physical Housing Characteristics in Johnstonville
Housing Structures in Johnstonville
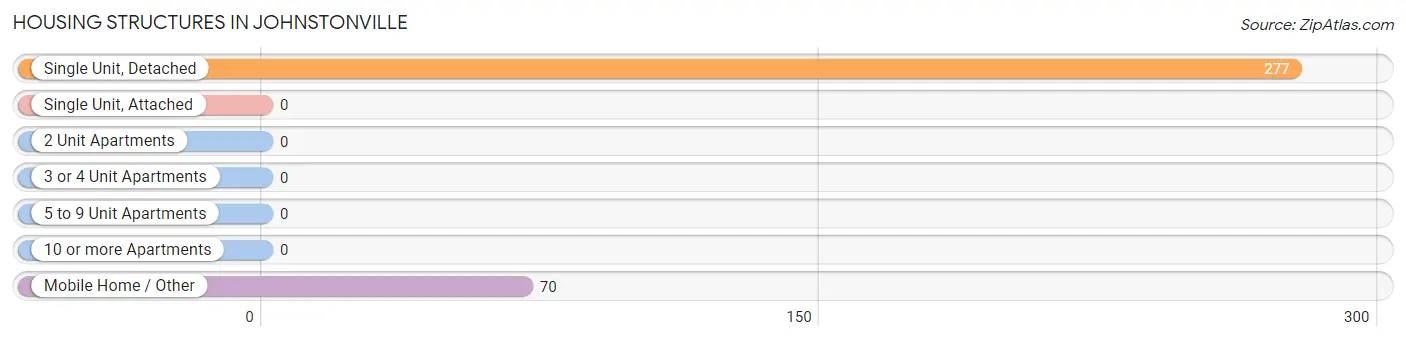
| Structure Type | # Housing Units | % Housing Units |
| Single Unit, Detached | 277 | 79.8% |
| Single Unit, Attached | 0 | 0.0% |
| 2 Unit Apartments | 0 | 0.0% |
| 3 or 4 Unit Apartments | 0 | 0.0% |
| 5 to 9 Unit Apartments | 0 | 0.0% |
| 10 or more Apartments | 0 | 0.0% |
| Mobile Home / Other | 70 | 20.2% |
| Total | 347 | 100.0% |
Housing Structures by Occupancy in Johnstonville
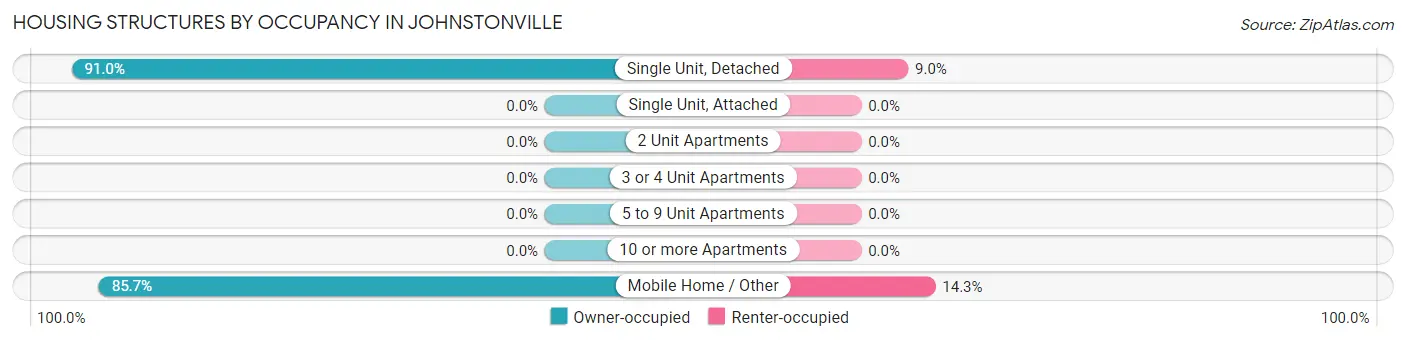
| Structure Type | Owner-occupied | Renter-occupied |
| Single Unit, Detached | 252 (91.0%) | 25 (9.0%) |
| Single Unit, Attached | 0 (0.0%) | 0 (0.0%) |
| 2 Unit Apartments | 0 (0.0%) | 0 (0.0%) |
| 3 or 4 Unit Apartments | 0 (0.0%) | 0 (0.0%) |
| 5 to 9 Unit Apartments | 0 (0.0%) | 0 (0.0%) |
| 10 or more Apartments | 0 (0.0%) | 0 (0.0%) |
| Mobile Home / Other | 60 (85.7%) | 10 (14.3%) |
| Total | 312 (89.9%) | 35 (10.1%) |
Housing Structures by Number of Rooms in Johnstonville
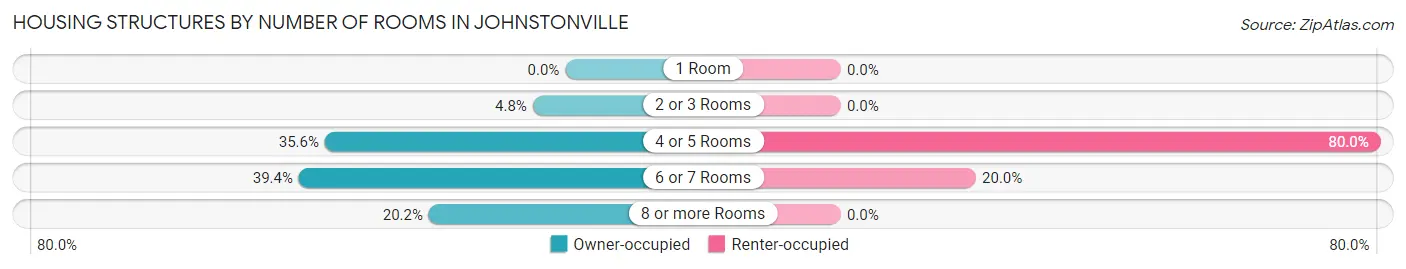
| Number of Rooms | Owner-occupied | Renter-occupied |
| 1 Room | 0 (0.0%) | 0 (0.0%) |
| 2 or 3 Rooms | 15 (4.8%) | 0 (0.0%) |
| 4 or 5 Rooms | 111 (35.6%) | 28 (80.0%) |
| 6 or 7 Rooms | 123 (39.4%) | 7 (20.0%) |
| 8 or more Rooms | 63 (20.2%) | 0 (0.0%) |
| Total | 312 (100.0%) | 35 (100.0%) |
Housing Structure by Heating Type in Johnstonville
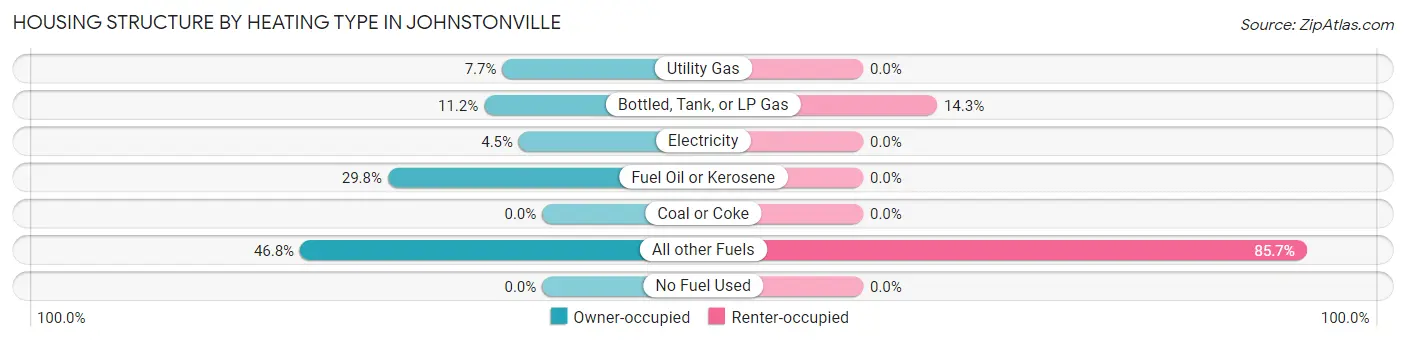
| Heating Type | Owner-occupied | Renter-occupied |
| Utility Gas | 24 (7.7%) | 0 (0.0%) |
| Bottled, Tank, or LP Gas | 35 (11.2%) | 5 (14.3%) |
| Electricity | 14 (4.5%) | 0 (0.0%) |
| Fuel Oil or Kerosene | 93 (29.8%) | 0 (0.0%) |
| Coal or Coke | 0 (0.0%) | 0 (0.0%) |
| All other Fuels | 146 (46.8%) | 30 (85.7%) |
| No Fuel Used | 0 (0.0%) | 0 (0.0%) |
| Total | 312 (100.0%) | 35 (100.0%) |
Household Vehicle Usage in Johnstonville
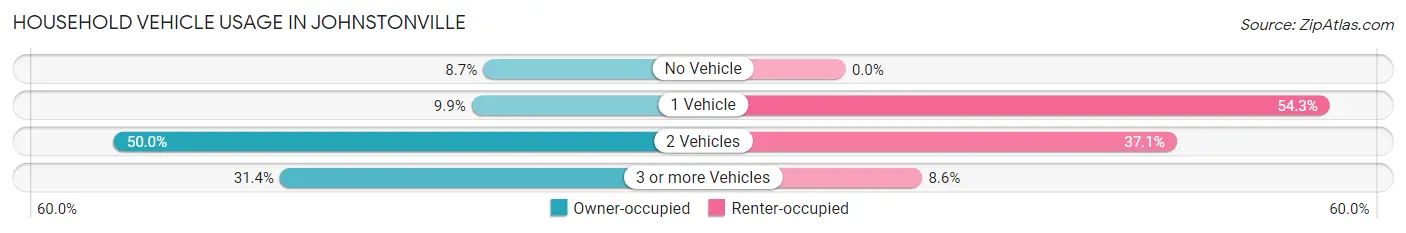
| Vehicles per Household | Owner-occupied | Renter-occupied |
| No Vehicle | 27 (8.6%) | 0 (0.0%) |
| 1 Vehicle | 31 (9.9%) | 19 (54.3%) |
| 2 Vehicles | 156 (50.0%) | 13 (37.1%) |
| 3 or more Vehicles | 98 (31.4%) | 3 (8.6%) |
| Total | 312 (100.0%) | 35 (100.0%) |
Real Estate & Mortgages in Johnstonville
Real Estate and Mortgage Overview in Johnstonville
| Characteristic | Without Mortgage | With Mortgage |
| Housing Units | 156 | 156 |
| Median Property Value | $275,800 | $278,000 |
| Median Household Income | $72,917 | $34 |
| Monthly Housing Costs | $560 | $13 |
| Real Estate Taxes | $1,761 | $17 |
Property Value by Mortgage Status in Johnstonville
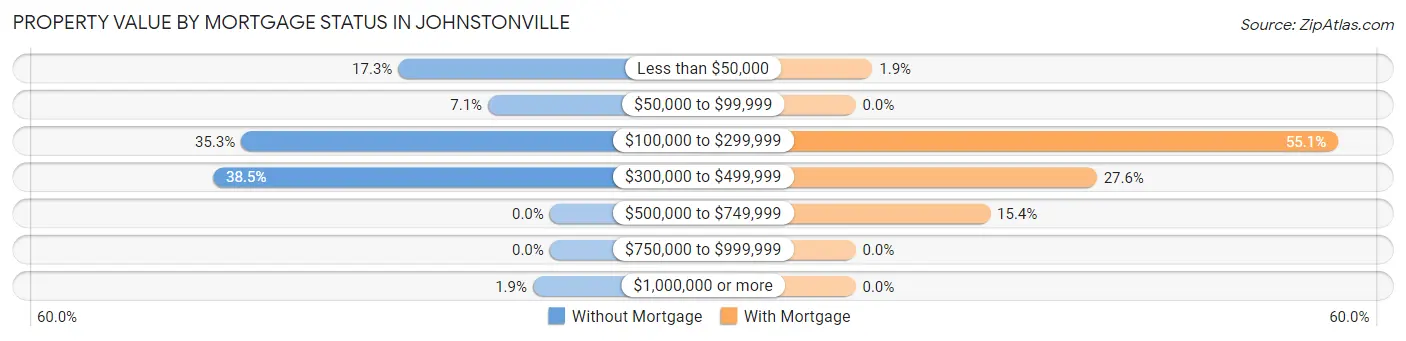
| Property Value | Without Mortgage | With Mortgage |
| Less than $50,000 | 27 (17.3%) | 3 (1.9%) |
| $50,000 to $99,999 | 11 (7.0%) | 0 (0.0%) |
| $100,000 to $299,999 | 55 (35.3%) | 86 (55.1%) |
| $300,000 to $499,999 | 60 (38.5%) | 43 (27.6%) |
| $500,000 to $749,999 | 0 (0.0%) | 24 (15.4%) |
| $750,000 to $999,999 | 0 (0.0%) | 0 (0.0%) |
| $1,000,000 or more | 3 (1.9%) | 0 (0.0%) |
| Total | 156 (100.0%) | 156 (100.0%) |
Household Income by Mortgage Status in Johnstonville
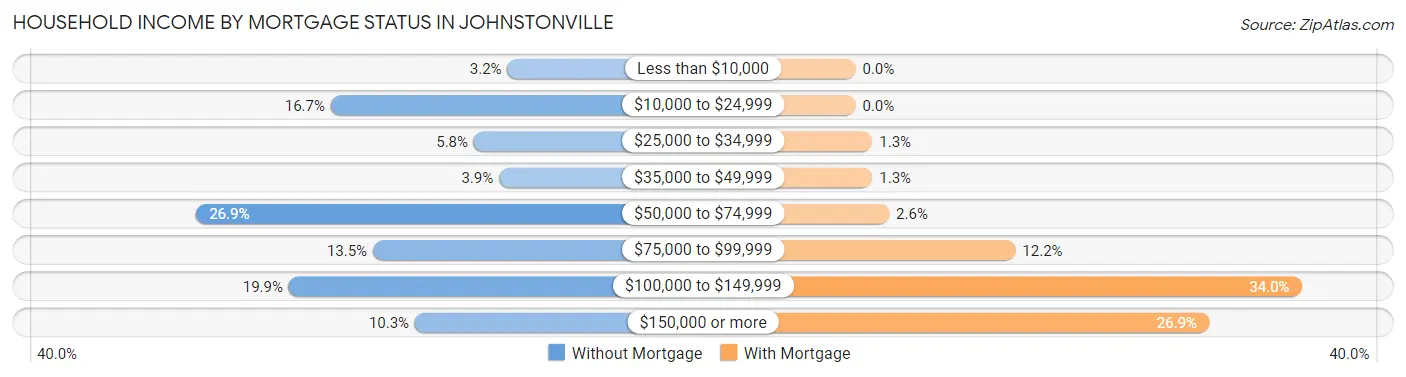
| Household Income | Without Mortgage | With Mortgage |
| Less than $10,000 | 5 (3.2%) | 0 (0.0%) |
| $10,000 to $24,999 | 26 (16.7%) | 0 (0.0%) |
| $25,000 to $34,999 | 9 (5.8%) | 2 (1.3%) |
| $35,000 to $49,999 | 6 (3.8%) | 2 (1.3%) |
| $50,000 to $74,999 | 42 (26.9%) | 4 (2.6%) |
| $75,000 to $99,999 | 21 (13.5%) | 19 (12.2%) |
| $100,000 to $149,999 | 31 (19.9%) | 53 (34.0%) |
| $150,000 or more | 16 (10.3%) | 42 (26.9%) |
| Total | 156 (100.0%) | 156 (100.0%) |
Property Value to Household Income Ratio in Johnstonville
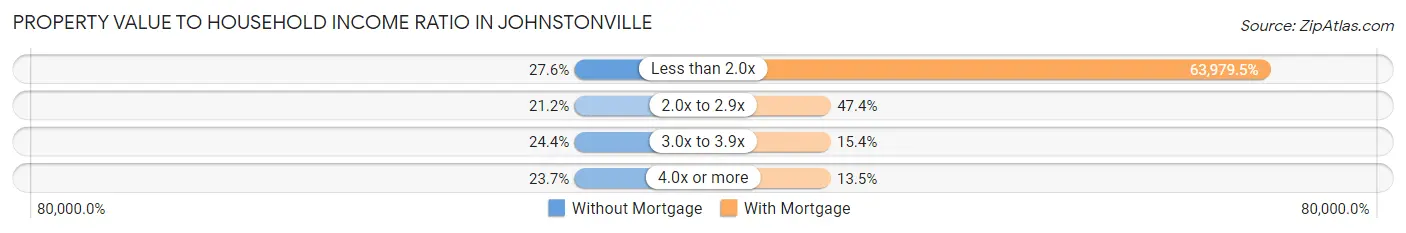
| Value-to-Income Ratio | Without Mortgage | With Mortgage |
| Less than 2.0x | 43 (27.6%) | 99,808 (63,979.5%) |
| 2.0x to 2.9x | 33 (21.1%) | 74 (47.4%) |
| 3.0x to 3.9x | 38 (24.4%) | 24 (15.4%) |
| 4.0x or more | 37 (23.7%) | 21 (13.5%) |
| Total | 156 (100.0%) | 156 (100.0%) |
Real Estate Taxes by Mortgage Status in Johnstonville
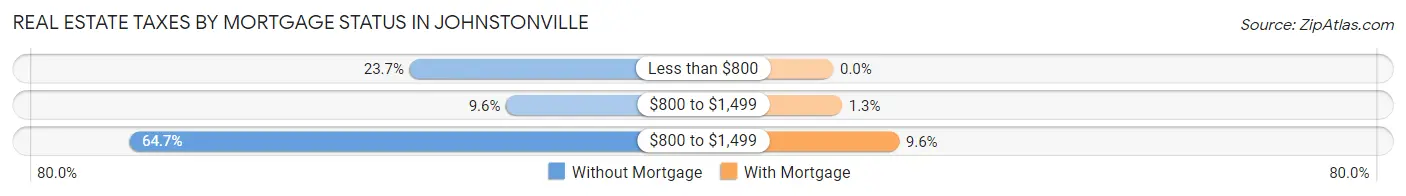
| Property Taxes | Without Mortgage | With Mortgage |
| Less than $800 | 37 (23.7%) | 0 (0.0%) |
| $800 to $1,499 | 15 (9.6%) | 2 (1.3%) |
| $800 to $1,499 | 101 (64.7%) | 15 (9.6%) |
| Total | 156 (100.0%) | 156 (100.0%) |
Health & Disability in Johnstonville
Health Insurance Coverage by Age in Johnstonville
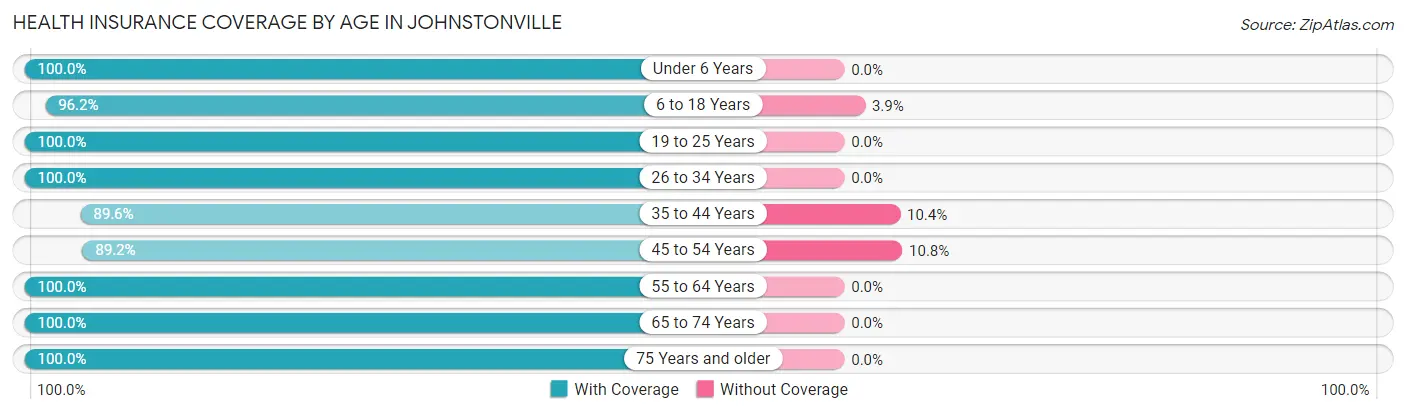
| Age Bracket | With Coverage | Without Coverage |
| Under 6 Years | 40 (100.0%) | 0 (0.0%) |
| 6 to 18 Years | 200 (96.2%) | 8 (3.8%) |
| 19 to 25 Years | 151 (100.0%) | 0 (0.0%) |
| 26 to 34 Years | 67 (100.0%) | 0 (0.0%) |
| 35 to 44 Years | 112 (89.6%) | 13 (10.4%) |
| 45 to 54 Years | 91 (89.2%) | 11 (10.8%) |
| 55 to 64 Years | 153 (100.0%) | 0 (0.0%) |
| 65 to 74 Years | 107 (100.0%) | 0 (0.0%) |
| 75 Years and older | 137 (100.0%) | 0 (0.0%) |
| Total | 1,058 (97.1%) | 32 (2.9%) |
Health Insurance Coverage by Citizenship Status in Johnstonville
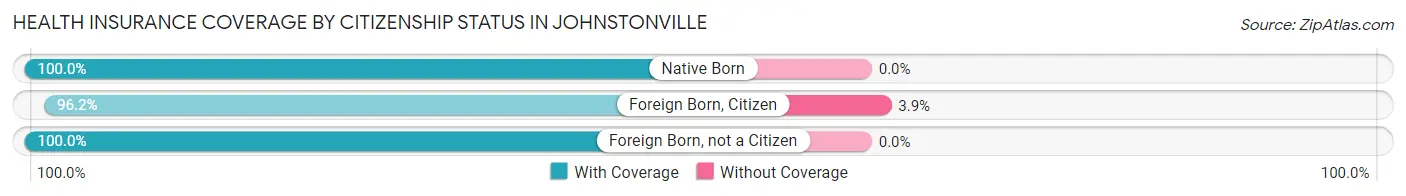
| Citizenship Status | With Coverage | Without Coverage |
| Native Born | 40 (100.0%) | 0 (0.0%) |
| Foreign Born, Citizen | 200 (96.2%) | 8 (3.8%) |
| Foreign Born, not a Citizen | 151 (100.0%) | 0 (0.0%) |
Health Insurance Coverage by Household Income in Johnstonville
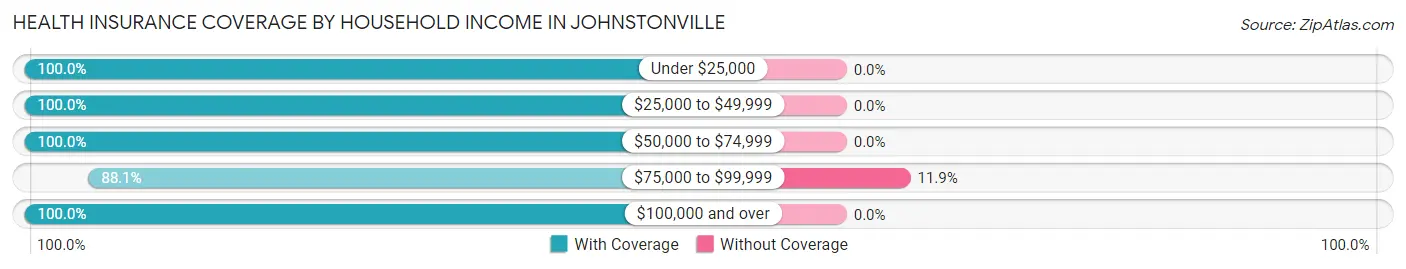
| Household Income | With Coverage | Without Coverage |
| Under $25,000 | 57 (100.0%) | 0 (0.0%) |
| $25,000 to $49,999 | 112 (100.0%) | 0 (0.0%) |
| $50,000 to $74,999 | 135 (100.0%) | 0 (0.0%) |
| $75,000 to $99,999 | 236 (88.1%) | 32 (11.9%) |
| $100,000 and over | 518 (100.0%) | 0 (0.0%) |
Public vs Private Health Insurance Coverage by Age in Johnstonville
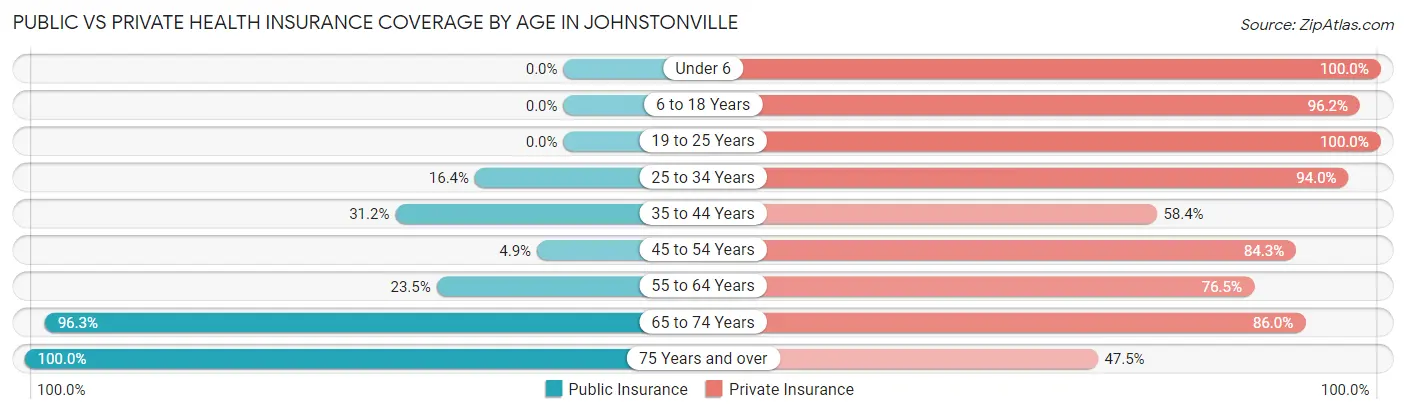
| Age Bracket | Public Insurance | Private Insurance |
| Under 6 | 0 (0.0%) | 40 (100.0%) |
| 6 to 18 Years | 0 (0.0%) | 200 (96.2%) |
| 19 to 25 Years | 0 (0.0%) | 151 (100.0%) |
| 25 to 34 Years | 11 (16.4%) | 63 (94.0%) |
| 35 to 44 Years | 39 (31.2%) | 73 (58.4%) |
| 45 to 54 Years | 5 (4.9%) | 86 (84.3%) |
| 55 to 64 Years | 36 (23.5%) | 117 (76.5%) |
| 65 to 74 Years | 103 (96.3%) | 92 (86.0%) |
| 75 Years and over | 137 (100.0%) | 65 (47.4%) |
| Total | 331 (30.4%) | 887 (81.4%) |
Disability Status by Sex by Age in Johnstonville
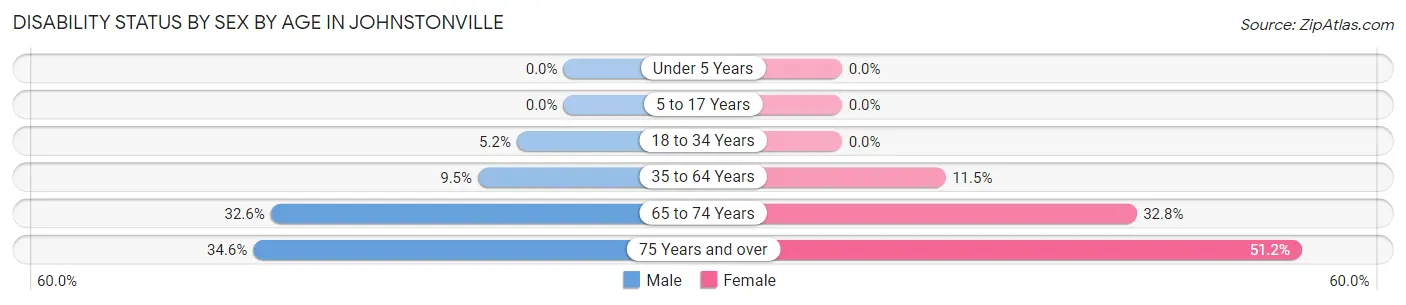
| Age Bracket | Male | Female |
| Under 5 Years | 0 (0.0%) | 0 (0.0%) |
| 5 to 17 Years | 0 (0.0%) | 0 (0.0%) |
| 18 to 34 Years | 7 (5.2%) | 0 (0.0%) |
| 35 to 64 Years | 18 (9.5%) | 22 (11.5%) |
| 65 to 74 Years | 15 (32.6%) | 20 (32.8%) |
| 75 Years and over | 19 (34.5%) | 42 (51.2%) |
Disability Class by Sex by Age in Johnstonville
Disability Class: Hearing Difficulty
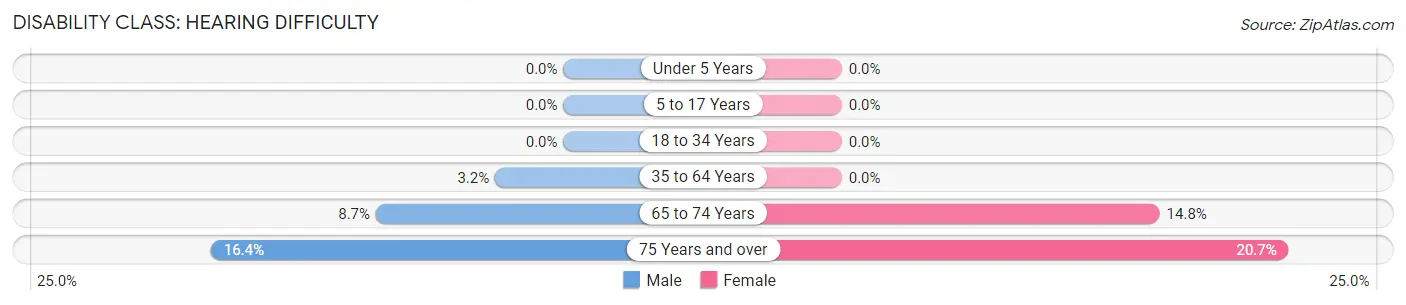
| Age Bracket | Male | Female |
| Under 5 Years | 0 (0.0%) | 0 (0.0%) |
| 5 to 17 Years | 0 (0.0%) | 0 (0.0%) |
| 18 to 34 Years | 0 (0.0%) | 0 (0.0%) |
| 35 to 64 Years | 6 (3.2%) | 0 (0.0%) |
| 65 to 74 Years | 4 (8.7%) | 9 (14.7%) |
| 75 Years and over | 9 (16.4%) | 17 (20.7%) |
Disability Class: Vision Difficulty
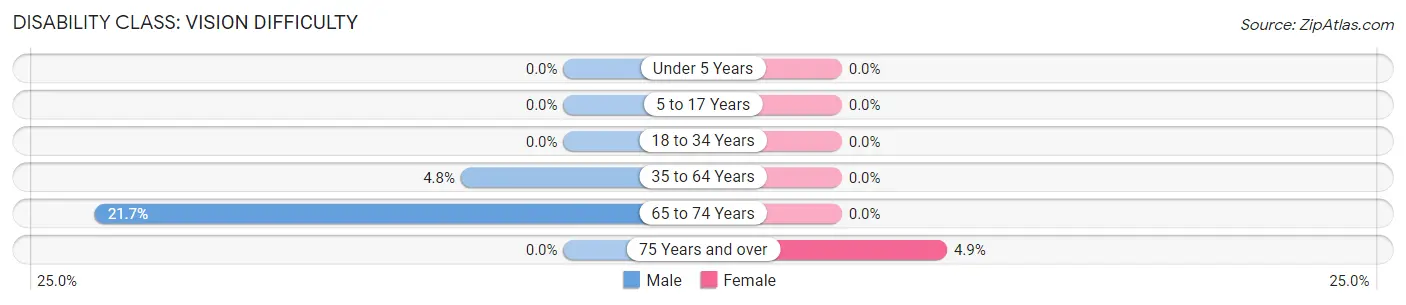
| Age Bracket | Male | Female |
| Under 5 Years | 0 (0.0%) | 0 (0.0%) |
| 5 to 17 Years | 0 (0.0%) | 0 (0.0%) |
| 18 to 34 Years | 0 (0.0%) | 0 (0.0%) |
| 35 to 64 Years | 9 (4.8%) | 0 (0.0%) |
| 65 to 74 Years | 10 (21.7%) | 0 (0.0%) |
| 75 Years and over | 0 (0.0%) | 4 (4.9%) |
Disability Class: Cognitive Difficulty
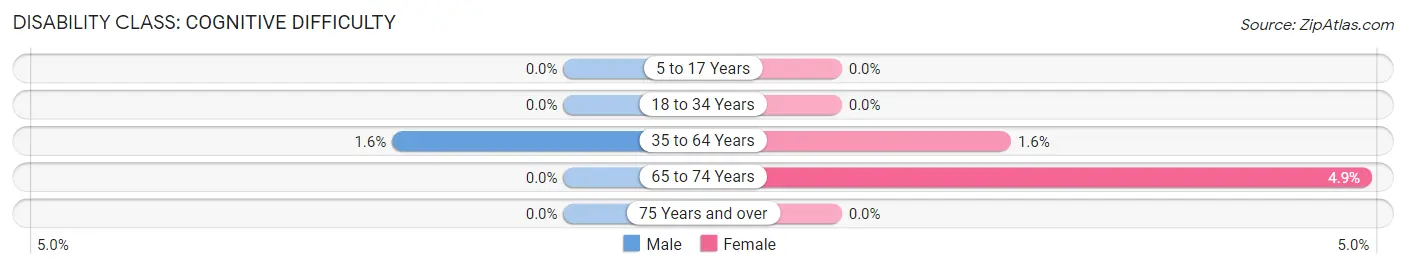
| Age Bracket | Male | Female |
| 5 to 17 Years | 0 (0.0%) | 0 (0.0%) |
| 18 to 34 Years | 0 (0.0%) | 0 (0.0%) |
| 35 to 64 Years | 3 (1.6%) | 3 (1.6%) |
| 65 to 74 Years | 0 (0.0%) | 3 (4.9%) |
| 75 Years and over | 0 (0.0%) | 0 (0.0%) |
Disability Class: Ambulatory Difficulty
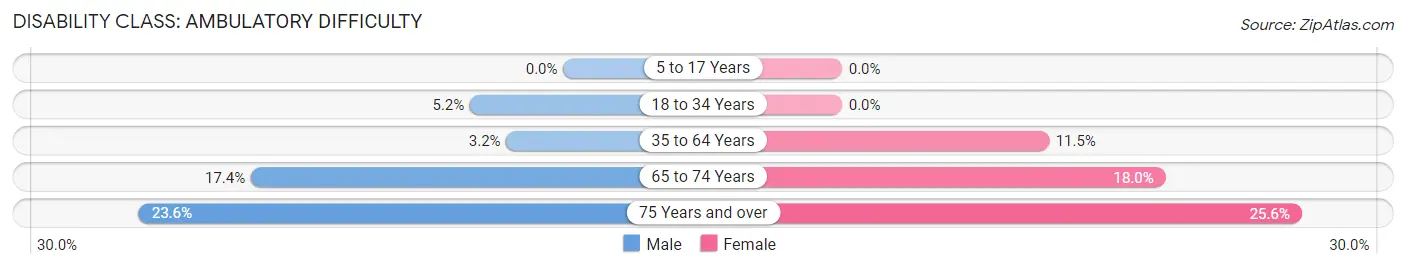
| Age Bracket | Male | Female |
| 5 to 17 Years | 0 (0.0%) | 0 (0.0%) |
| 18 to 34 Years | 7 (5.2%) | 0 (0.0%) |
| 35 to 64 Years | 6 (3.2%) | 22 (11.5%) |
| 65 to 74 Years | 8 (17.4%) | 11 (18.0%) |
| 75 Years and over | 13 (23.6%) | 21 (25.6%) |
Disability Class: Self-Care Difficulty
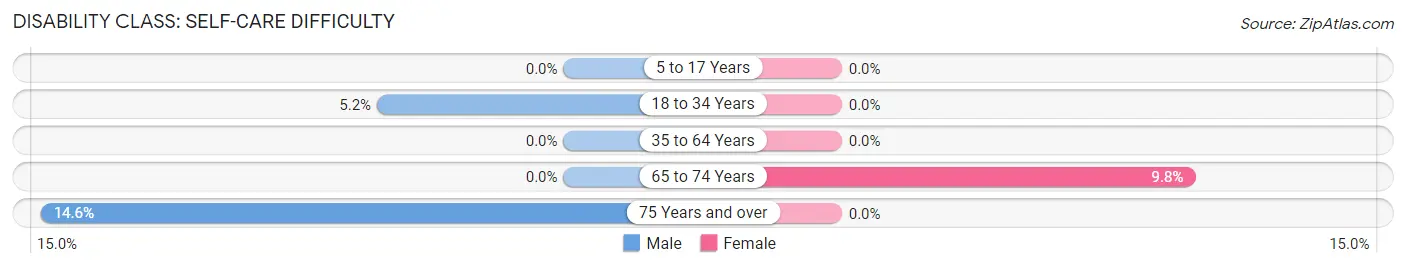
| Age Bracket | Male | Female |
| 5 to 17 Years | 0 (0.0%) | 0 (0.0%) |
| 18 to 34 Years | 7 (5.2%) | 0 (0.0%) |
| 35 to 64 Years | 0 (0.0%) | 0 (0.0%) |
| 65 to 74 Years | 0 (0.0%) | 6 (9.8%) |
| 75 Years and over | 8 (14.5%) | 0 (0.0%) |
Technology Access in Johnstonville
Computing Device Access in Johnstonville
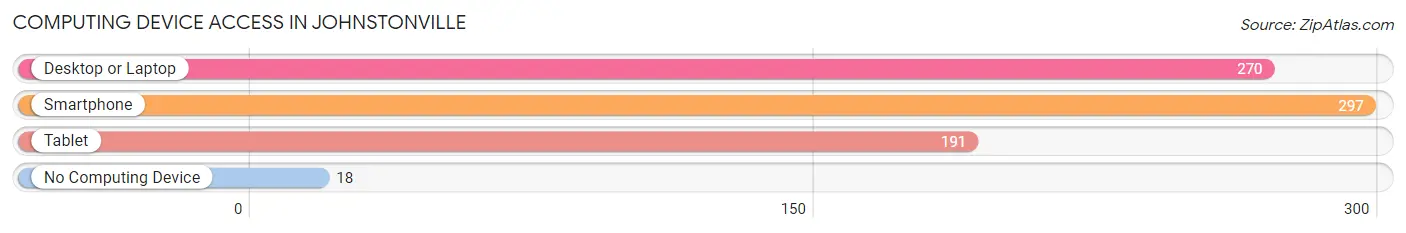
| Device Type | # Households | % Households |
| Desktop or Laptop | 270 | 77.8% |
| Smartphone | 297 | 85.6% |
| Tablet | 191 | 55.0% |
| No Computing Device | 18 | 5.2% |
| Total | 347 | 100.0% |
Internet Access in Johnstonville
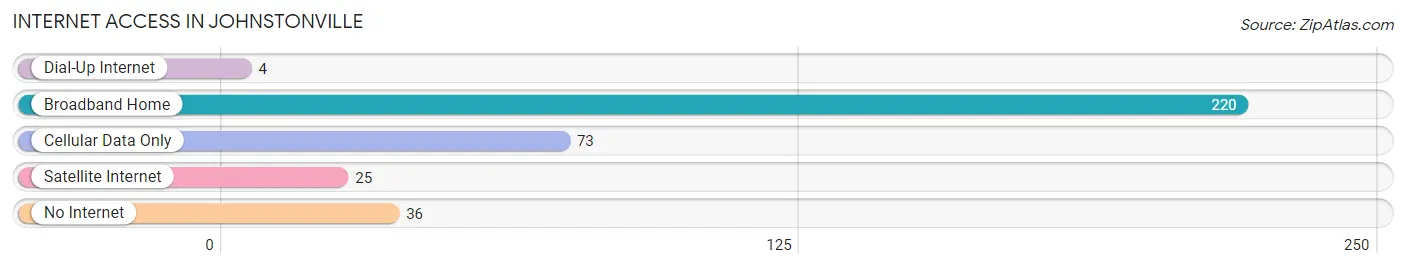
| Internet Type | # Households | % Households |
| Dial-Up Internet | 4 | 1.1% |
| Broadband Home | 220 | 63.4% |
| Cellular Data Only | 73 | 21.0% |
| Satellite Internet | 25 | 7.2% |
| No Internet | 36 | 10.4% |
| Total | 347 | 100.0% |
Johnstonville Summary
Johnstonville is a small unincorporated community located in Plumas County, California. It is situated in the Sierra Nevada foothills, approximately 20 miles east of Quincy and 40 miles west of Reno, Nevada. The community is located along State Route 70, which is the main route connecting Quincy to Reno. The population of Johnstonville is estimated to be around 200 people.
History
Johnstonville was founded in 1852 by John Johnston, a miner who had come to the area in search of gold. He established a trading post and a stagecoach stop, which became a popular spot for travelers. The town was named after him and grew to include a post office, a school, a hotel, and several stores.
In the late 1800s, Johnstonville was a bustling mining town, with several mines in the area producing gold, silver, and other minerals. The town also had a large lumber industry, with several sawmills in the area.
In the early 1900s, the mining industry began to decline and the lumber industry began to take over. The town was eventually abandoned in the 1950s, when the last sawmill closed.
Geography
Johnstonville is located in the Sierra Nevada foothills, at an elevation of 4,000 feet. The town is surrounded by the Plumas National Forest, which provides a variety of outdoor activities such as camping, fishing, and hiking.
The climate in Johnstonville is generally mild, with hot summers and cold winters. The average temperature in the summer is around 80 degrees Fahrenheit, and the average temperature in the winter is around 40 degrees Fahrenheit.
Economy
Johnstonville is a small, rural community with a limited economy. The main industry in the area is logging, with several sawmills in the area. There are also several small businesses in the town, such as a gas station, a grocery store, and a few restaurants.
Demographics
The population of Johnstonville is estimated to be around 200 people. The majority of the population is white (90%), with the remaining 10% being of other races. The median household income in Johnstonville is $35,000, and the median age is 44 years old.
Conclusion
Johnstonville is a small, rural community located in the Sierra Nevada foothills of Plumas County, California. It was founded in 1852 by John Johnston, and was once a bustling mining and lumber town. Today, the town is mostly known for its logging industry, and has a population of around 200 people. The town has a mild climate, with hot summers and cold winters, and the median household income is $35,000.
Common Questions
What is Per Capita Income in Johnstonville?
Per Capita income in Johnstonville is $37,749.
What is the Median Family Income in Johnstonville?
Median Family Income in Johnstonville is $95,278.
What is the Median Household income in Johnstonville?
Median Household Income in Johnstonville is $93,375.
What is Income or Wage Gap in Johnstonville?
Income or Wage Gap in Johnstonville is 7.8%.
Women in Johnstonville earn 92.2 cents for every dollar earned by a man.
What is Inequality or Gini Index in Johnstonville?
Inequality or Gini Index in Johnstonville is 0.36.
What is the Total Population of Johnstonville?
Total Population of Johnstonville is 1,090.
What is the Total Male Population of Johnstonville?
Total Male Population of Johnstonville is 567.
What is the Total Female Population of Johnstonville?
Total Female Population of Johnstonville is 523.
What is the Ratio of Males per 100 Females in Johnstonville?
There are 108.41 Males per 100 Females in Johnstonville.
What is the Ratio of Females per 100 Males in Johnstonville?
There are 92.24 Females per 100 Males in Johnstonville.
What is the Median Population Age in Johnstonville?
Median Population Age in Johnstonville is 41.3 Years.
What is the Average Family Size in Johnstonville
Average Family Size in Johnstonville is 3.4 People.
What is the Average Household Size in Johnstonville
Average Household Size in Johnstonville is 3.1 People.
How Large is the Labor Force in Johnstonville?
There are 436 People in the Labor Forcein in Johnstonville.
What is the Percentage of People in the Labor Force in Johnstonville?
50.3% of People are in the Labor Force in Johnstonville.
What is the Unemployment Rate in Johnstonville?
Unemployment Rate in Johnstonville is 12.4%.