Cities with the Highest Percentage of Population Employed in Security & Protection in Ohio
RELATED REPORTS & OPTIONS
Security & Protection
Ohio
Compare Cities
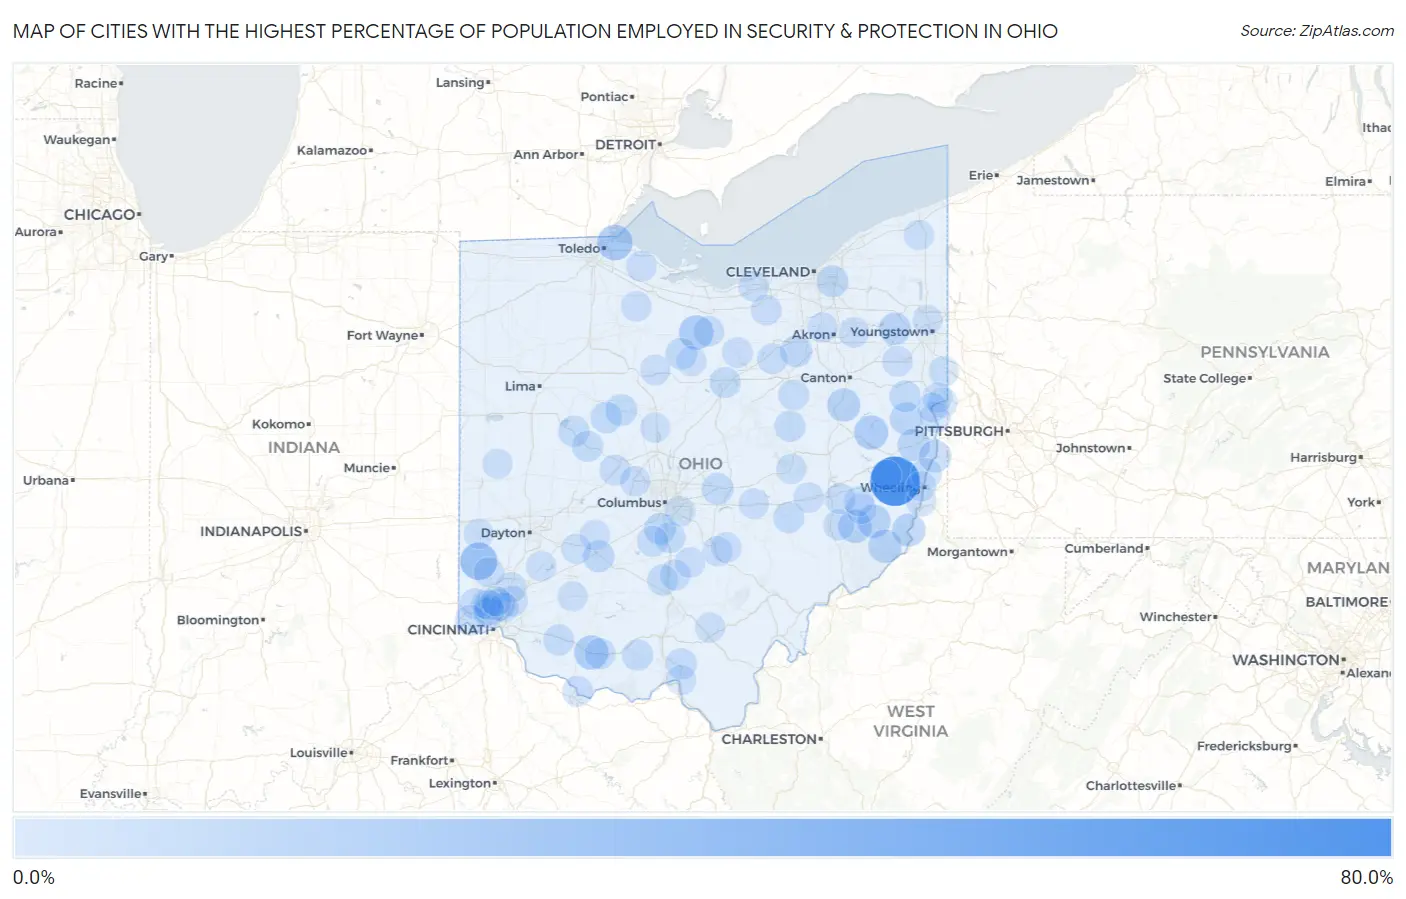
Map of Cities with the Highest Percentage of Population Employed in Security & Protection in Ohio
0.0%
80.0%
Cities with the Highest Percentage of Population Employed in Security & Protection in Ohio
| City | % Employed | vs State | vs National | |
| 1. | Bannock | 66.0% | 1.9%(+64.1)#1 | 2.1%(+63.9)#12 |
| 2. | Somerville | 26.4% | 1.9%(+24.5)#2 | 2.1%(+24.3)#157 |
| 3. | Harbor View | 20.7% | 1.9%(+18.8)#3 | 2.1%(+18.5)#260 |
| 4. | Holiday Lakes | 17.9% | 1.9%(+16.0)#4 | 2.1%(+15.8)#339 |
| 5. | Winchester | 17.1% | 1.9%(+15.2)#5 | 2.1%(+15.0)#376 |
| 6. | Bowerston | 16.6% | 1.9%(+14.6)#6 | 2.1%(+14.4)#405 |
| 7. | Summerfield | 14.5% | 1.9%(+12.6)#7 | 2.1%(+12.4)#520 |
| 8. | Miltonsburg | 14.3% | 1.9%(+12.4)#8 | 2.1%(+12.1)#545 |
| 9. | Antioch | 14.3% | 1.9%(+12.4)#9 | 2.1%(+12.1)#548 |
| 10. | Zoar | 13.9% | 1.9%(+12.0)#10 | 2.1%(+11.7)#578 |
| 11. | Clarington | 13.8% | 1.9%(+11.9)#11 | 2.1%(+11.7)#580 |
| 12. | Bergholz | 11.9% | 1.9%(+10.0)#12 | 2.1%(+9.78)#771 |
| 13. | Bloomingdale | 11.6% | 1.9%(+9.72)#13 | 2.1%(+9.48)#820 |
| 14. | Brilliant | 11.2% | 1.9%(+9.27)#14 | 2.1%(+9.03)#884 |
| 15. | Craig Beach | 11.1% | 1.9%(+9.17)#15 | 2.1%(+8.93)#911 |
| 16. | Glendale | 10.5% | 1.9%(+8.58)#16 | 2.1%(+8.34)#1,016 |
| 17. | Sterling | 10.2% | 1.9%(+8.26)#17 | 2.1%(+8.02)#1,065 |
| 18. | Petersburg | 10.1% | 1.9%(+8.16)#18 | 2.1%(+7.92)#1,086 |
| 19. | North Randall | 9.8% | 1.9%(+7.88)#19 | 2.1%(+7.64)#1,140 |
| 20. | Commercial Point | 9.7% | 1.9%(+7.75)#20 | 2.1%(+7.52)#1,163 |
| 21. | Milledgeville | 9.6% | 1.9%(+7.71)#21 | 2.1%(+7.47)#1,175 |
| 22. | La Rue | 9.3% | 1.9%(+7.39)#22 | 2.1%(+7.15)#1,241 |
| 23. | Granville South | 9.2% | 1.9%(+7.29)#23 | 2.1%(+7.06)#1,264 |
| 24. | Mount Victory | 9.0% | 1.9%(+7.13)#24 | 2.1%(+6.89)#1,324 |
| 25. | Lawrenceville | 8.9% | 1.9%(+7.03)#25 | 2.1%(+6.79)#1,353 |
| 26. | Summitville | 8.9% | 1.9%(+6.98)#26 | 2.1%(+6.74)#1,375 |
| 27. | New Washington | 8.8% | 1.9%(+6.92)#27 | 2.1%(+6.68)#1,386 |
| 28. | Philo | 8.1% | 1.9%(+6.21)#28 | 2.1%(+5.97)#1,615 |
| 29. | Lake Buckhorn | 7.7% | 1.9%(+5.82)#29 | 2.1%(+5.58)#1,750 |
| 30. | Rarden | 7.7% | 1.9%(+5.78)#30 | 2.1%(+5.54)#1,763 |
| 31. | Yorkville | 7.6% | 1.9%(+5.72)#31 | 2.1%(+5.49)#1,783 |
| 32. | Mount Orab | 7.6% | 1.9%(+5.69)#32 | 2.1%(+5.45)#1,799 |
| 33. | Ashville | 7.6% | 1.9%(+5.65)#33 | 2.1%(+5.42)#1,815 |
| 34. | Minford | 7.5% | 1.9%(+5.59)#34 | 2.1%(+5.35)#1,849 |
| 35. | Huntsville | 7.5% | 1.9%(+5.59)#35 | 2.1%(+5.35)#1,850 |
| 36. | Zanesfield | 7.5% | 1.9%(+5.59)#36 | 2.1%(+5.35)#1,852 |
| 37. | Seaman | 7.5% | 1.9%(+5.57)#37 | 2.1%(+5.33)#1,862 |
| 38. | Lincoln Heights | 7.5% | 1.9%(+5.57)#38 | 2.1%(+5.33)#1,863 |
| 39. | Andersonville | 7.5% | 1.9%(+5.54)#39 | 2.1%(+5.30)#1,876 |
| 40. | Reno Beach | 7.4% | 1.9%(+5.46)#40 | 2.1%(+5.22)#1,918 |
| 41. | Milford Center | 7.3% | 1.9%(+5.43)#41 | 2.1%(+5.19)#1,929 |
| 42. | New Baltimore | 7.2% | 1.9%(+5.33)#42 | 2.1%(+5.10)#1,961 |
| 43. | Fredericksburg | 7.0% | 1.9%(+5.10)#43 | 2.1%(+4.86)#2,069 |
| 44. | Sarahsville | 7.0% | 1.9%(+5.07)#44 | 2.1%(+4.83)#2,092 |
| 45. | Lore City | 6.9% | 1.9%(+5.03)#45 | 2.1%(+4.80)#2,106 |
| 46. | North College Hill | 6.9% | 1.9%(+4.99)#46 | 2.1%(+4.76)#2,128 |
| 47. | Darbyville | 6.8% | 1.9%(+4.93)#47 | 2.1%(+4.69)#2,169 |
| 48. | Kingston | 6.6% | 1.9%(+4.73)#48 | 2.1%(+4.49)#2,283 |
| 49. | Congress | 6.5% | 1.9%(+4.54)#49 | 2.1%(+4.30)#2,395 |
| 50. | North Fairfield | 6.4% | 1.9%(+4.53)#50 | 2.1%(+4.29)#2,399 |
| 51. | Mount Healthy | 6.4% | 1.9%(+4.46)#51 | 2.1%(+4.22)#2,449 |
| 52. | Stratton | 6.3% | 1.9%(+4.43)#52 | 2.1%(+4.19)#2,478 |
| 53. | Rocky Ridge | 6.3% | 1.9%(+4.41)#53 | 2.1%(+4.17)#2,484 |
| 54. | Damascus | 6.3% | 1.9%(+4.40)#54 | 2.1%(+4.16)#2,490 |
| 55. | Burgoon | 6.2% | 1.9%(+4.34)#55 | 2.1%(+4.10)#2,528 |
| 56. | Brimfield | 6.2% | 1.9%(+4.34)#56 | 2.1%(+4.10)#2,534 |
| 57. | Savannah | 6.2% | 1.9%(+4.30)#57 | 2.1%(+4.06)#2,555 |
| 58. | Amherst | 6.2% | 1.9%(+4.28)#58 | 2.1%(+4.04)#2,565 |
| 59. | Gratiot | 6.2% | 1.9%(+4.24)#59 | 2.1%(+4.01)#2,588 |
| 60. | Jersey | 6.1% | 1.9%(+4.23)#60 | 2.1%(+3.99)#2,598 |
| 61. | Shadyside | 6.1% | 1.9%(+4.23)#61 | 2.1%(+3.99)#2,602 |
| 62. | Hide A Way Hills | 6.1% | 1.9%(+4.21)#62 | 2.1%(+3.97)#2,614 |
| 63. | Highpoint | 6.0% | 1.9%(+4.09)#63 | 2.1%(+3.85)#2,712 |
| 64. | Lagrange | 5.9% | 1.9%(+4.03)#64 | 2.1%(+3.79)#2,756 |
| 65. | Aberdeen | 5.9% | 1.9%(+4.01)#65 | 2.1%(+3.77)#2,779 |
| 66. | Batesville | 5.9% | 1.9%(+3.97)#66 | 2.1%(+3.73)#2,823 |
| 67. | Tarlton | 5.8% | 1.9%(+3.92)#67 | 2.1%(+3.68)#2,858 |
| 68. | Miami Heights | 5.7% | 1.9%(+3.81)#68 | 2.1%(+3.57)#2,947 |
| 69. | Oceola | 5.6% | 1.9%(+3.72)#69 | 2.1%(+3.49)#3,030 |
| 70. | Four Bridges | 5.6% | 1.9%(+3.68)#70 | 2.1%(+3.44)#3,070 |
| 71. | New Concord | 5.6% | 1.9%(+3.67)#71 | 2.1%(+3.43)#3,082 |
| 72. | East Palestine | 5.5% | 1.9%(+3.64)#72 | 2.1%(+3.40)#3,116 |
| 73. | Seven Mile | 5.5% | 1.9%(+3.62)#73 | 2.1%(+3.39)#3,127 |
| 74. | Plain City | 5.5% | 1.9%(+3.56)#74 | 2.1%(+3.32)#3,197 |
| 75. | Flushing | 5.4% | 1.9%(+3.52)#75 | 2.1%(+3.28)#3,233 |
| 76. | Mount Healthy Heights | 5.4% | 1.9%(+3.50)#76 | 2.1%(+3.26)#3,248 |
| 77. | Fairlawn | 5.3% | 1.9%(+3.43)#77 | 2.1%(+3.19)#3,320 |
| 78. | Conesville | 5.3% | 1.9%(+3.41)#78 | 2.1%(+3.17)#3,341 |
| 79. | Blacklick Estates | 5.3% | 1.9%(+3.40)#79 | 2.1%(+3.17)#3,347 |
| 80. | Bridgeport | 5.3% | 1.9%(+3.39)#80 | 2.1%(+3.15)#3,363 |
| 81. | Jefferson | 5.3% | 1.9%(+3.39)#81 | 2.1%(+3.15)#3,366 |
| 82. | East Liverpool | 5.3% | 1.9%(+3.39)#82 | 2.1%(+3.15)#3,375 |
| 83. | Waynesville | 5.3% | 1.9%(+3.35)#83 | 2.1%(+3.11)#3,423 |
| 84. | Eaton | 5.3% | 1.9%(+3.35)#84 | 2.1%(+3.11)#3,426 |
| 85. | Martinsville | 5.2% | 1.9%(+3.31)#85 | 2.1%(+3.07)#3,466 |
| 86. | South Solon | 5.2% | 1.9%(+3.29)#86 | 2.1%(+3.05)#3,474 |
| 87. | Versailles | 5.2% | 1.9%(+3.25)#87 | 2.1%(+3.01)#3,515 |
| 88. | Coalton | 5.1% | 1.9%(+3.22)#88 | 2.1%(+2.98)#3,552 |
| 89. | Tiro | 5.0% | 1.9%(+3.13)#89 | 2.1%(+2.89)#3,647 |
| 90. | Shawnee Hills | 5.0% | 1.9%(+3.12)#90 | 2.1%(+2.89)#3,653 |
| 91. | Glenmoor | 5.0% | 1.9%(+3.12)#91 | 2.1%(+2.88)#3,656 |
| 92. | Sugar Grove | 5.0% | 1.9%(+3.12)#92 | 2.1%(+2.88)#3,660 |
| 93. | Girard | 5.0% | 1.9%(+3.08)#93 | 2.1%(+2.84)#3,706 |
| 94. | Waldo | 5.0% | 1.9%(+3.06)#94 | 2.1%(+2.82)#3,719 |
| 95. | Evendale | 4.9% | 1.9%(+3.04)#95 | 2.1%(+2.80)#3,749 |
| 96. | New Burlington | 4.9% | 1.9%(+3.00)#96 | 2.1%(+2.77)#3,794 |
| 97. | Springdale | 4.9% | 1.9%(+2.97)#97 | 2.1%(+2.74)#3,826 |
| 98. | Sciotodale | 4.9% | 1.9%(+2.95)#98 | 2.1%(+2.71)#3,858 |
| 99. | Quaker City | 4.8% | 1.9%(+2.94)#99 | 2.1%(+2.70)#3,871 |
| 100. | Wellsville | 4.8% | 1.9%(+2.90)#100 | 2.1%(+2.66)#3,909 |
Common Questions
What are the Top 10 Cities with the Highest Percentage of Population Employed in Security & Protection in Ohio?
Top 10 Cities with the Highest Percentage of Population Employed in Security & Protection in Ohio are:
#1
66.0%
#2
26.4%
#3
20.7%
#4
17.9%
#5
17.1%
#6
16.6%
#7
14.5%
#8
14.3%
#9
14.3%
#10
13.9%
What city has the Highest Percentage of Population Employed in Security & Protection in Ohio?
Bannock has the Highest Percentage of Population Employed in Security & Protection in Ohio with 66.0%.
What is the Percentage of Population Employed in Security & Protection in the State of Ohio?
Percentage of Population Employed in Security & Protection in Ohio is 1.9%.
What is the Percentage of Population Employed in Security & Protection in the United States?
Percentage of Population Employed in Security & Protection in the United States is 2.1%.