Cities with the Highest Percentage of Population Employed in Security & Protection in Iowa
RELATED REPORTS & OPTIONS
Security & Protection
Iowa
Compare Cities
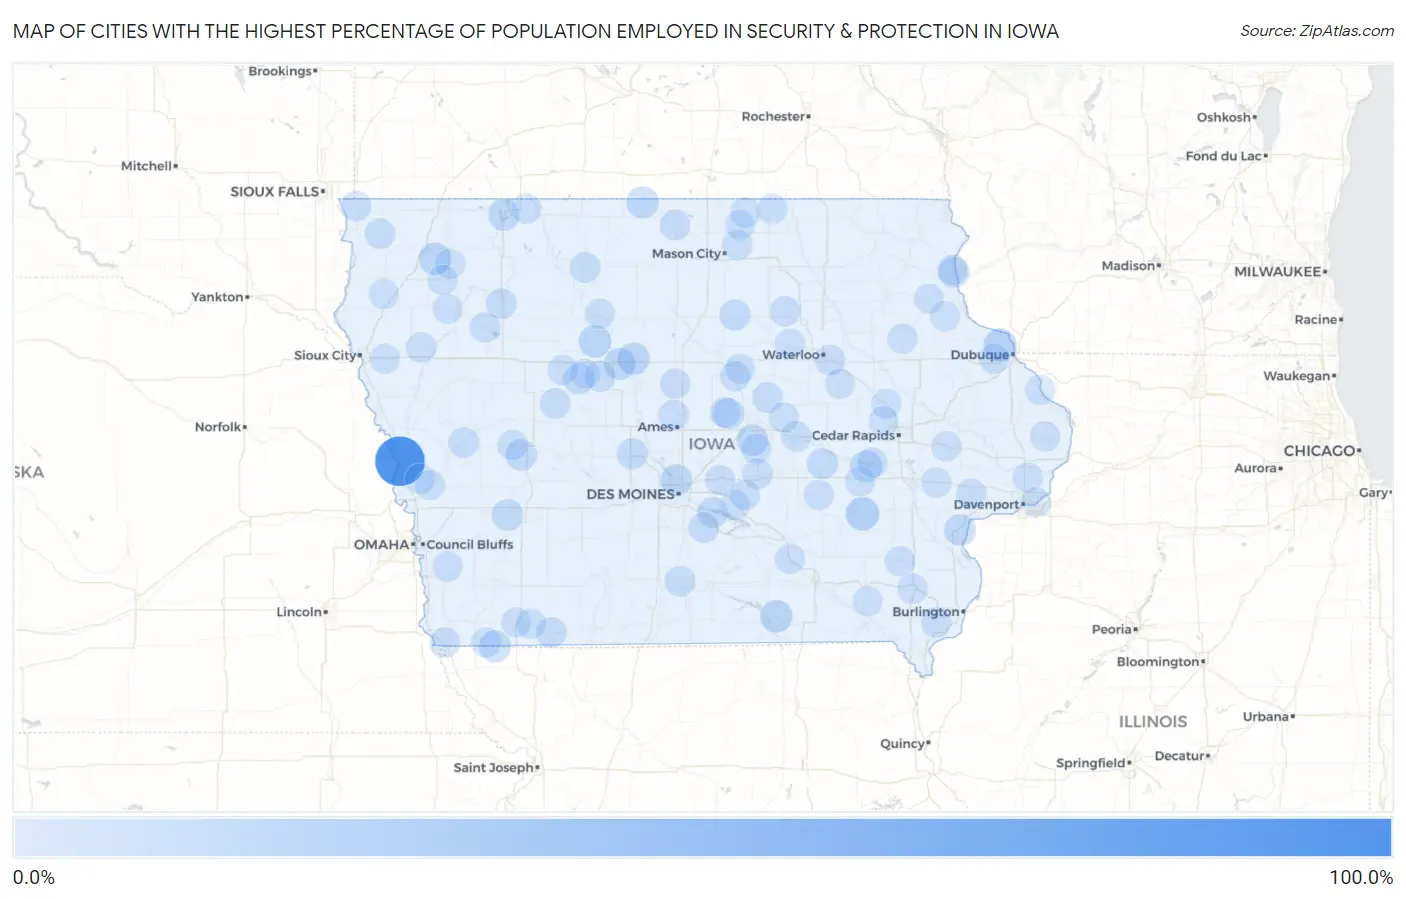
Map of Cities with the Highest Percentage of Population Employed in Security & Protection in Iowa
0.0%
100.0%
Cities with the Highest Percentage of Population Employed in Security & Protection in Iowa
| City | % Employed | vs State | vs National | |
| 1. | River Sioux | 100.0% | 1.4%(+98.6)#1 | 2.1%(+97.9)#6 |
| 2. | Trenton | 36.7% | 1.4%(+35.3)#2 | 2.1%(+34.5)#79 |
| 3. | Kingston | 28.0% | 1.4%(+26.6)#3 | 2.1%(+25.9)#137 |
| 4. | Kinross | 19.4% | 1.4%(+18.0)#4 | 2.1%(+17.2)#293 |
| 5. | Durango | 16.7% | 1.4%(+15.3)#5 | 2.1%(+14.5)#401 |
| 6. | Clare | 14.5% | 1.4%(+13.1)#6 | 2.1%(+12.3)#523 |
| 7. | Udell | 14.3% | 1.4%(+12.9)#7 | 2.1%(+12.1)#549 |
| 8. | Archer | 13.1% | 1.4%(+11.7)#8 | 2.1%(+11.0)#648 |
| 9. | Duncombe | 12.7% | 1.4%(+11.3)#9 | 2.1%(+10.5)#692 |
| 10. | Sperry | 12.1% | 1.4%(+10.7)#10 | 2.1%(+9.94)#748 |
| 11. | South Amana | 11.8% | 1.4%(+10.4)#11 | 2.1%(+9.62)#798 |
| 12. | Rake | 11.4% | 1.4%(+10.1)#12 | 2.1%(+9.28)#845 |
| 13. | Saylorville | 11.3% | 1.4%(+9.94)#13 | 2.1%(+9.16)#863 |
| 14. | Blanchard | 11.1% | 1.4%(+9.74)#14 | 2.1%(+8.96)#907 |
| 15. | Haverhill | 10.9% | 1.4%(+9.50)#15 | 2.1%(+8.72)#942 |
| 16. | Fruitland | 10.8% | 1.4%(+9.38)#16 | 2.1%(+8.61)#962 |
| 17. | Coalville | 10.7% | 1.4%(+9.31)#17 | 2.1%(+8.53)#973 |
| 18. | Marne | 10.6% | 1.4%(+9.27)#18 | 2.1%(+8.49)#990 |
| 19. | Gray | 10.0% | 1.4%(+8.63)#19 | 2.1%(+7.85)#1,098 |
| 20. | Okoboji | 9.8% | 1.4%(+8.44)#20 | 2.1%(+7.66)#1,138 |
| 21. | Rinard | 8.7% | 1.4%(+7.32)#21 | 2.1%(+6.55)#1,438 |
| 22. | Bouton | 8.6% | 1.4%(+7.20)#22 | 2.1%(+6.42)#1,463 |
| 23. | Clemons | 8.0% | 1.4%(+6.63)#23 | 2.1%(+5.85)#1,660 |
| 24. | Hartwick | 7.8% | 1.4%(+6.47)#24 | 2.1%(+5.69)#1,711 |
| 25. | Hansell | 7.5% | 1.4%(+6.17)#25 | 2.1%(+5.40)#1,831 |
| 26. | Callender | 6.9% | 1.4%(+5.56)#26 | 2.1%(+4.79)#2,111 |
| 27. | Mcgregor | 6.9% | 1.4%(+5.48)#27 | 2.1%(+4.71)#2,159 |
| 28. | Woodburn | 6.7% | 1.4%(+5.29)#28 | 2.1%(+4.52)#2,269 |
| 29. | Beaman | 6.6% | 1.4%(+5.22)#29 | 2.1%(+4.44)#2,310 |
| 30. | Whittemore | 6.6% | 1.4%(+5.18)#30 | 2.1%(+4.41)#2,327 |
| 31. | Leland | 6.5% | 1.4%(+5.11)#31 | 2.1%(+4.33)#2,368 |
| 32. | Swan | 6.5% | 1.4%(+5.08)#32 | 2.1%(+4.30)#2,397 |
| 33. | Sandyville | 6.2% | 1.4%(+4.88)#33 | 2.1%(+4.10)#2,533 |
| 34. | Rembrandt | 6.2% | 1.4%(+4.81)#34 | 2.1%(+4.04)#2,568 |
| 35. | Lanesboro | 6.1% | 1.4%(+4.69)#35 | 2.1%(+3.91)#2,664 |
| 36. | Bedford | 6.0% | 1.4%(+4.67)#36 | 2.1%(+3.89)#2,679 |
| 37. | Dow City | 6.0% | 1.4%(+4.66)#37 | 2.1%(+3.89)#2,680 |
| 38. | Doon | 5.8% | 1.4%(+4.45)#38 | 2.1%(+3.67)#2,865 |
| 39. | Kellogg | 5.8% | 1.4%(+4.42)#39 | 2.1%(+3.64)#2,892 |
| 40. | Clarksville | 5.6% | 1.4%(+4.22)#40 | 2.1%(+3.44)#3,067 |
| 41. | Wayland | 5.2% | 1.4%(+3.87)#41 | 2.1%(+3.10)#3,432 |
| 42. | Tama | 5.2% | 1.4%(+3.85)#42 | 2.1%(+3.07)#3,464 |
| 43. | Evansdale | 5.2% | 1.4%(+3.81)#43 | 2.1%(+3.03)#3,497 |
| 44. | Jewell Junction | 5.1% | 1.4%(+3.77)#44 | 2.1%(+3.00)#3,535 |
| 45. | Gilbert | 5.1% | 1.4%(+3.72)#45 | 2.1%(+2.95)#3,591 |
| 46. | Pierson | 5.0% | 1.4%(+3.66)#46 | 2.1%(+2.89)#3,651 |
| 47. | Denmark | 5.0% | 1.4%(+3.63)#47 | 2.1%(+2.85)#3,690 |
| 48. | Marquette | 4.9% | 1.4%(+3.57)#48 | 2.1%(+2.79)#3,754 |
| 49. | Mount Pleasant | 4.9% | 1.4%(+3.53)#49 | 2.1%(+2.75)#3,808 |
| 50. | Goose Lake | 4.8% | 1.4%(+3.47)#50 | 2.1%(+2.69)#3,886 |
| 51. | Silver City | 4.8% | 1.4%(+3.39)#51 | 2.1%(+2.61)#3,963 |
| 52. | Larchwood | 4.8% | 1.4%(+3.38)#52 | 2.1%(+2.61)#3,971 |
| 53. | Alta | 4.7% | 1.4%(+3.30)#53 | 2.1%(+2.52)#4,080 |
| 54. | Manning | 4.6% | 1.4%(+3.26)#54 | 2.1%(+2.49)#4,127 |
| 55. | Colfax | 4.6% | 1.4%(+3.19)#55 | 2.1%(+2.42)#4,223 |
| 56. | St Anthony | 4.5% | 1.4%(+3.17)#56 | 2.1%(+2.40)#4,260 |
| 57. | Hamburg | 4.5% | 1.4%(+3.16)#57 | 2.1%(+2.39)#4,272 |
| 58. | Wilton | 4.3% | 1.4%(+2.96)#58 | 2.1%(+2.18)#4,573 |
| 59. | Centralia | 4.3% | 1.4%(+2.91)#59 | 2.1%(+2.14)#4,634 |
| 60. | Stacyville | 4.2% | 1.4%(+2.83)#60 | 2.1%(+2.05)#4,757 |
| 61. | Eldora | 4.2% | 1.4%(+2.82)#61 | 2.1%(+2.05)#4,763 |
| 62. | New Hartford | 4.2% | 1.4%(+2.79)#62 | 2.1%(+2.02)#4,794 |
| 63. | Lamont | 4.1% | 1.4%(+2.77)#63 | 2.1%(+2.00)#4,840 |
| 64. | Rockwell City | 4.1% | 1.4%(+2.75)#64 | 2.1%(+1.97)#4,887 |
| 65. | Bellevue | 4.1% | 1.4%(+2.74)#65 | 2.1%(+1.97)#4,891 |
| 66. | Rock Falls | 4.1% | 1.4%(+2.74)#66 | 2.1%(+1.96)#4,917 |
| 67. | Magnolia | 4.1% | 1.4%(+2.68)#67 | 2.1%(+1.91)#5,005 |
| 68. | La Porte City | 4.0% | 1.4%(+2.67)#68 | 2.1%(+1.89)#5,018 |
| 69. | Garber | 4.0% | 1.4%(+2.63)#69 | 2.1%(+1.85)#5,103 |
| 70. | Logan | 4.0% | 1.4%(+2.61)#70 | 2.1%(+1.83)#5,142 |
| 71. | Monroe | 4.0% | 1.4%(+2.59)#71 | 2.1%(+1.81)#5,176 |
| 72. | New Market | 4.0% | 1.4%(+2.59)#72 | 2.1%(+1.81)#5,180 |
| 73. | Struble | 3.9% | 1.4%(+2.55)#73 | 2.1%(+1.77)#5,256 |
| 74. | Birmingham | 3.9% | 1.4%(+2.54)#74 | 2.1%(+1.77)#5,261 |
| 75. | Rutland | 3.9% | 1.4%(+2.52)#75 | 2.1%(+1.75)#5,293 |
| 76. | Center Point | 3.9% | 1.4%(+2.50)#76 | 2.1%(+1.73)#5,350 |
| 77. | Lawton | 3.8% | 1.4%(+2.42)#77 | 2.1%(+1.65)#5,494 |
| 78. | Reasnor | 3.8% | 1.4%(+2.42)#78 | 2.1%(+1.65)#5,501 |
| 79. | Williamsburg | 3.8% | 1.4%(+2.41)#79 | 2.1%(+1.64)#5,517 |
| 80. | Primghar | 3.7% | 1.4%(+2.37)#80 | 2.1%(+1.59)#5,621 |
| 81. | Mechanicsville | 3.7% | 1.4%(+2.37)#81 | 2.1%(+1.59)#5,623 |
| 82. | Deep River | 3.7% | 1.4%(+2.33)#82 | 2.1%(+1.56)#5,698 |
| 83. | Middle Amana | 3.7% | 1.4%(+2.30)#83 | 2.1%(+1.53)#5,760 |
| 84. | Clarinda | 3.7% | 1.4%(+2.30)#84 | 2.1%(+1.52)#5,770 |
| 85. | Laurel | 3.7% | 1.4%(+2.30)#85 | 2.1%(+1.52)#5,780 |
| 86. | West Branch | 3.6% | 1.4%(+2.26)#86 | 2.1%(+1.49)#5,853 |
| 87. | Riverdale | 3.6% | 1.4%(+2.25)#87 | 2.1%(+1.47)#5,875 |
| 88. | Park View | 3.6% | 1.4%(+2.23)#88 | 2.1%(+1.45)#5,910 |
| 89. | Palo | 3.6% | 1.4%(+2.23)#89 | 2.1%(+1.45)#5,917 |
| 90. | Somers | 3.6% | 1.4%(+2.20)#90 | 2.1%(+1.42)#5,977 |
| 91. | Meriden | 3.6% | 1.4%(+2.20)#91 | 2.1%(+1.42)#5,978 |
| 92. | Carpenter | 3.6% | 1.4%(+2.20)#92 | 2.1%(+1.42)#5,980 |
| 93. | Superior | 3.5% | 1.4%(+2.14)#93 | 2.1%(+1.36)#6,103 |
| 94. | Eddyville | 3.5% | 1.4%(+2.13)#94 | 2.1%(+1.35)#6,110 |
| 95. | Steamboat Rock | 3.5% | 1.4%(+2.11)#95 | 2.1%(+1.33)#6,183 |
| 96. | Paullina | 3.5% | 1.4%(+2.08)#96 | 2.1%(+1.31)#6,234 |
| 97. | Grafton | 3.4% | 1.4%(+2.08)#97 | 2.1%(+1.30)#6,257 |
| 98. | Elkader | 3.4% | 1.4%(+2.03)#98 | 2.1%(+1.25)#6,380 |
| 99. | Garwin | 3.4% | 1.4%(+2.02)#99 | 2.1%(+1.24)#6,405 |
| 100. | Northboro | 3.4% | 1.4%(+2.02)#100 | 2.1%(+1.24)#6,410 |
Common Questions
What are the Top 10 Cities with the Highest Percentage of Population Employed in Security & Protection in Iowa?
Top 10 Cities with the Highest Percentage of Population Employed in Security & Protection in Iowa are:
#1
100.0%
#2
19.4%
#3
16.7%
#4
14.5%
#5
14.3%
#6
13.1%
#7
12.7%
#8
11.8%
#9
11.4%
#10
11.3%
What city has the Highest Percentage of Population Employed in Security & Protection in Iowa?
River Sioux has the Highest Percentage of Population Employed in Security & Protection in Iowa with 100.0%.
What is the Percentage of Population Employed in Security & Protection in the State of Iowa?
Percentage of Population Employed in Security & Protection in Iowa is 1.4%.
What is the Percentage of Population Employed in Security & Protection in the United States?
Percentage of Population Employed in Security & Protection in the United States is 2.1%.