Cities with the Highest Percentage of Population Employed in Security & Protection in Louisiana
RELATED REPORTS & OPTIONS
Security & Protection
Louisiana
Compare Cities
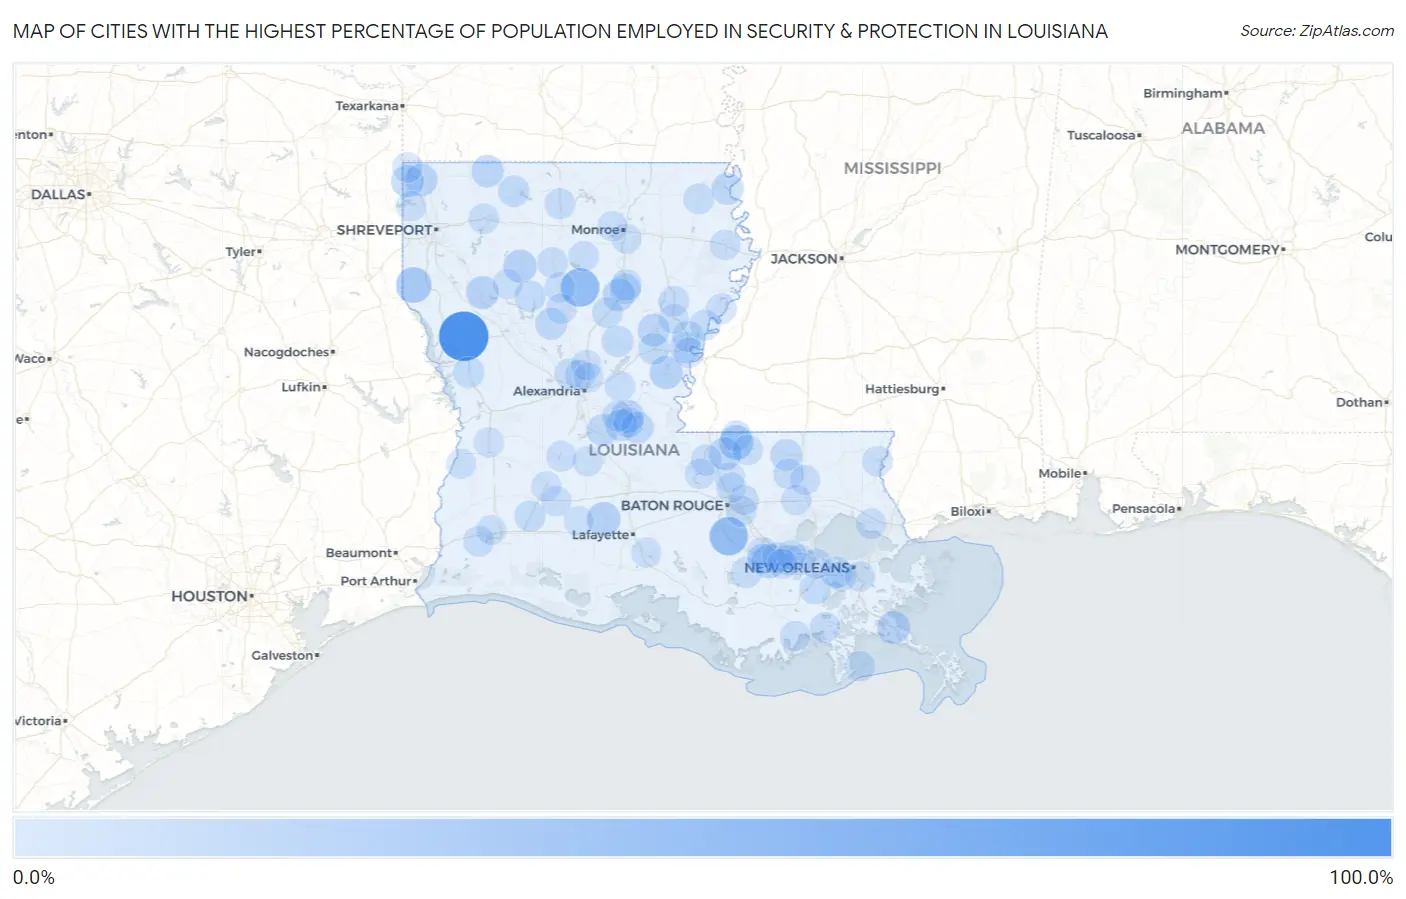
Map of Cities with the Highest Percentage of Population Employed in Security & Protection in Louisiana
0.0%
100.0%
Cities with the Highest Percentage of Population Employed in Security & Protection in Louisiana
| City | % Employed | vs State | vs National | |
| 1. | Belmont | 96.4% | 2.6%(+93.8)#1 | 2.1%(+94.3)#7 |
| 2. | Sikes | 44.0% | 2.6%(+41.4)#2 | 2.1%(+41.9)#45 |
| 3. | Bayou Goula | 42.9% | 2.6%(+40.3)#3 | 2.1%(+40.7)#52 |
| 4. | Longstreet | 29.6% | 2.6%(+27.0)#4 | 2.1%(+27.5)#122 |
| 5. | Wilson | 23.6% | 2.6%(+21.0)#5 | 2.1%(+21.4)#209 |
| 6. | Convent | 22.6% | 2.6%(+20.0)#6 | 2.1%(+20.5)#227 |
| 7. | Branch | 21.1% | 2.6%(+18.5)#7 | 2.1%(+19.0)#250 |
| 8. | Lucky | 19.0% | 2.6%(+16.4)#8 | 2.1%(+16.9)#306 |
| 9. | Monterey | 18.8% | 2.6%(+16.1)#9 | 2.1%(+16.6)#309 |
| 10. | Jackson | 17.9% | 2.6%(+15.3)#10 | 2.1%(+15.8)#338 |
| 11. | Marksville | 17.5% | 2.6%(+14.9)#11 | 2.1%(+15.3)#357 |
| 12. | Edgefield | 17.1% | 2.6%(+14.5)#12 | 2.1%(+15.0)#377 |
| 13. | Port Sulphur | 17.0% | 2.6%(+14.4)#13 | 2.1%(+14.9)#383 |
| 14. | Hosston | 16.5% | 2.6%(+13.9)#14 | 2.1%(+14.3)#410 |
| 15. | Vivian | 15.9% | 2.6%(+13.3)#15 | 2.1%(+13.7)#441 |
| 16. | Shongaloo | 15.4% | 2.6%(+12.8)#16 | 2.1%(+13.2)#465 |
| 17. | Harrisonburg | 15.0% | 2.6%(+12.4)#17 | 2.1%(+12.9)#484 |
| 18. | Clarks | 14.8% | 2.6%(+12.2)#18 | 2.1%(+12.7)#496 |
| 19. | Lake Providence | 13.6% | 2.6%(+11.0)#19 | 2.1%(+11.5)#602 |
| 20. | Atlanta | 13.4% | 2.6%(+10.8)#20 | 2.1%(+11.3)#620 |
| 21. | Hessmer | 13.3% | 2.6%(+10.7)#21 | 2.1%(+11.2)#631 |
| 22. | Moreauville | 13.3% | 2.6%(+10.7)#22 | 2.1%(+11.1)#634 |
| 23. | Greensburg | 12.5% | 2.6%(+9.89)#23 | 2.1%(+10.4)#705 |
| 24. | Cheneyville | 12.3% | 2.6%(+9.72)#24 | 2.1%(+10.2)#724 |
| 25. | Jonesville | 11.8% | 2.6%(+9.16)#25 | 2.1%(+9.62)#790 |
| 26. | Midway | 11.7% | 2.6%(+9.14)#26 | 2.1%(+9.60)#802 |
| 27. | Waggaman | 11.3% | 2.6%(+8.67)#27 | 2.1%(+9.12)#867 |
| 28. | Homer | 10.8% | 2.6%(+8.21)#28 | 2.1%(+8.67)#949 |
| 29. | Florien | 10.3% | 2.6%(+7.71)#29 | 2.1%(+8.17)#1,037 |
| 30. | Ferriday | 10.2% | 2.6%(+7.60)#30 | 2.1%(+8.06)#1,056 |
| 31. | Fenton | 10.2% | 2.6%(+7.56)#31 | 2.1%(+8.02)#1,067 |
| 32. | Goldonna | 10.1% | 2.6%(+7.51)#32 | 2.1%(+7.96)#1,080 |
| 33. | Clayton | 10.1% | 2.6%(+7.46)#33 | 2.1%(+7.92)#1,085 |
| 34. | Bayou Gauche | 9.6% | 2.6%(+6.94)#34 | 2.1%(+7.40)#1,186 |
| 35. | Columbia | 9.5% | 2.6%(+6.88)#35 | 2.1%(+7.33)#1,201 |
| 36. | Olla | 9.2% | 2.6%(+6.62)#36 | 2.1%(+7.08)#1,255 |
| 37. | St Francisville | 9.1% | 2.6%(+6.50)#37 | 2.1%(+6.96)#1,288 |
| 38. | Norwood | 9.1% | 2.6%(+6.48)#38 | 2.1%(+6.94)#1,298 |
| 39. | Banks Springs | 8.9% | 2.6%(+6.33)#39 | 2.1%(+6.79)#1,349 |
| 40. | Union | 8.8% | 2.6%(+6.22)#40 | 2.1%(+6.68)#1,388 |
| 41. | Napoleonville | 8.8% | 2.6%(+6.16)#41 | 2.1%(+6.62)#1,402 |
| 42. | Carlyss | 8.7% | 2.6%(+6.05)#42 | 2.1%(+6.51)#1,445 |
| 43. | Rock Hill | 8.5% | 2.6%(+5.94)#43 | 2.1%(+6.40)#1,471 |
| 44. | Grand Point | 8.5% | 2.6%(+5.86)#44 | 2.1%(+6.31)#1,500 |
| 45. | Pioneer | 8.4% | 2.6%(+5.83)#45 | 2.1%(+6.29)#1,509 |
| 46. | Wisner | 8.4% | 2.6%(+5.76)#46 | 2.1%(+6.22)#1,525 |
| 47. | Edgard | 8.2% | 2.6%(+5.61)#47 | 2.1%(+6.07)#1,581 |
| 48. | Inniswold | 8.1% | 2.6%(+5.52)#48 | 2.1%(+5.98)#1,611 |
| 49. | Creola | 8.1% | 2.6%(+5.50)#49 | 2.1%(+5.96)#1,618 |
| 50. | Hodge | 7.9% | 2.6%(+5.33)#50 | 2.1%(+5.79)#1,674 |
| 51. | Wallace | 7.7% | 2.6%(+5.13)#51 | 2.1%(+5.59)#1,749 |
| 52. | Montpelier | 7.7% | 2.6%(+5.09)#52 | 2.1%(+5.54)#1,759 |
| 53. | Avondale | 7.7% | 2.6%(+5.05)#53 | 2.1%(+5.51)#1,776 |
| 54. | Dubach | 7.6% | 2.6%(+5.02)#54 | 2.1%(+5.48)#1,787 |
| 55. | Waterproof | 7.6% | 2.6%(+5.01)#55 | 2.1%(+5.47)#1,791 |
| 56. | Fifth Ward | 7.6% | 2.6%(+5.01)#56 | 2.1%(+5.47)#1,794 |
| 57. | Bogalusa | 7.6% | 2.6%(+4.96)#57 | 2.1%(+5.42)#1,811 |
| 58. | Cut Off | 7.6% | 2.6%(+4.96)#58 | 2.1%(+5.42)#1,814 |
| 59. | Dodson | 7.6% | 2.6%(+4.96)#59 | 2.1%(+5.41)#1,817 |
| 60. | Lacombe | 7.5% | 2.6%(+4.88)#60 | 2.1%(+5.34)#1,861 |
| 61. | Grand Isle | 7.5% | 2.6%(+4.86)#61 | 2.1%(+5.32)#1,868 |
| 62. | Mansura | 7.4% | 2.6%(+4.75)#62 | 2.1%(+5.20)#1,923 |
| 63. | Chatham | 7.3% | 2.6%(+4.73)#63 | 2.1%(+5.19)#1,930 |
| 64. | Oakdale | 7.3% | 2.6%(+4.71)#64 | 2.1%(+5.17)#1,936 |
| 65. | Ridgecrest | 7.1% | 2.6%(+4.54)#65 | 2.1%(+4.99)#1,998 |
| 66. | Winnfield | 7.1% | 2.6%(+4.49)#66 | 2.1%(+4.95)#2,021 |
| 67. | Midland | 7.1% | 2.6%(+4.47)#67 | 2.1%(+4.93)#2,035 |
| 68. | Elton | 7.0% | 2.6%(+4.40)#68 | 2.1%(+4.86)#2,068 |
| 69. | Ventress | 7.0% | 2.6%(+4.37)#69 | 2.1%(+4.83)#2,084 |
| 70. | Dixie Inn | 6.9% | 2.6%(+4.29)#70 | 2.1%(+4.75)#2,138 |
| 71. | Chauvin | 6.9% | 2.6%(+4.28)#71 | 2.1%(+4.73)#2,145 |
| 72. | St Joseph | 6.8% | 2.6%(+4.17)#72 | 2.1%(+4.63)#2,195 |
| 73. | Deville | 6.7% | 2.6%(+4.13)#73 | 2.1%(+4.59)#2,220 |
| 74. | Norco | 6.7% | 2.6%(+4.13)#74 | 2.1%(+4.59)#2,221 |
| 75. | Rodessa | 6.7% | 2.6%(+4.06)#75 | 2.1%(+4.52)#2,268 |
| 76. | Pollock | 6.6% | 2.6%(+4.03)#76 | 2.1%(+4.49)#2,286 |
| 77. | Tallulah | 6.6% | 2.6%(+4.03)#77 | 2.1%(+4.49)#2,287 |
| 78. | Albany | 6.6% | 2.6%(+4.00)#78 | 2.1%(+4.46)#2,297 |
| 79. | Welcome | 6.6% | 2.6%(+3.99)#79 | 2.1%(+4.45)#2,304 |
| 80. | Monticello | 6.3% | 2.6%(+3.67)#80 | 2.1%(+4.13)#2,510 |
| 81. | Independence | 6.2% | 2.6%(+3.57)#81 | 2.1%(+4.02)#2,575 |
| 82. | Clinton | 6.1% | 2.6%(+3.52)#82 | 2.1%(+3.98)#2,605 |
| 83. | Rosepine | 6.1% | 2.6%(+3.45)#83 | 2.1%(+3.91)#2,667 |
| 84. | Garyville | 6.0% | 2.6%(+3.43)#84 | 2.1%(+3.89)#2,677 |
| 85. | Mooringsport | 5.9% | 2.6%(+3.31)#85 | 2.1%(+3.77)#2,781 |
| 86. | Ashland | 5.9% | 2.6%(+3.28)#86 | 2.1%(+3.73)#2,820 |
| 87. | Pine Prairie | 5.7% | 2.6%(+3.13)#87 | 2.1%(+3.58)#2,938 |
| 88. | Cade | 5.7% | 2.6%(+3.06)#88 | 2.1%(+3.52)#2,990 |
| 89. | North Vacherie | 5.7% | 2.6%(+3.05)#89 | 2.1%(+3.51)#2,996 |
| 90. | Oberlin | 5.7% | 2.6%(+3.05)#90 | 2.1%(+3.50)#3,006 |
| 91. | Richwood | 5.7% | 2.6%(+3.04)#91 | 2.1%(+3.50)#3,007 |
| 92. | Zachary | 5.6% | 2.6%(+3.04)#92 | 2.1%(+3.50)#3,018 |
| 93. | Ball | 5.6% | 2.6%(+3.00)#93 | 2.1%(+3.46)#3,053 |
| 94. | Iota | 5.6% | 2.6%(+2.96)#94 | 2.1%(+3.42)#3,088 |
| 95. | Merryville | 5.5% | 2.6%(+2.93)#95 | 2.1%(+3.39)#3,122 |
| 96. | Sicily Island | 5.5% | 2.6%(+2.90)#96 | 2.1%(+3.36)#3,143 |
| 97. | Terrytown | 5.4% | 2.6%(+2.77)#97 | 2.1%(+3.23)#3,280 |
| 98. | Claiborne | 5.4% | 2.6%(+2.75)#98 | 2.1%(+3.21)#3,297 |
| 99. | Baker | 5.3% | 2.6%(+2.73)#99 | 2.1%(+3.19)#3,322 |
| 100. | Westlake | 5.3% | 2.6%(+2.72)#100 | 2.1%(+3.18)#3,330 |
Common Questions
What are the Top 10 Cities with the Highest Percentage of Population Employed in Security & Protection in Louisiana?
Top 10 Cities with the Highest Percentage of Population Employed in Security & Protection in Louisiana are:
#1
96.4%
#2
44.0%
#3
42.9%
#4
29.6%
#5
23.6%
#6
22.6%
#7
21.1%
#8
19.0%
#9
18.8%
#10
17.9%
What city has the Highest Percentage of Population Employed in Security & Protection in Louisiana?
Belmont has the Highest Percentage of Population Employed in Security & Protection in Louisiana with 96.4%.
What is the Percentage of Population Employed in Security & Protection in the State of Louisiana?
Percentage of Population Employed in Security & Protection in Louisiana is 2.6%.
What is the Percentage of Population Employed in Security & Protection in the United States?
Percentage of Population Employed in Security & Protection in the United States is 2.1%.