Cities with the Highest Percentage of Population Employed in Security & Protection in Arizona
RELATED REPORTS & OPTIONS
Security & Protection
Arizona
Compare Cities
Map of Cities with the Highest Percentage of Population Employed in Security & Protection in Arizona
0.0%
60.0%
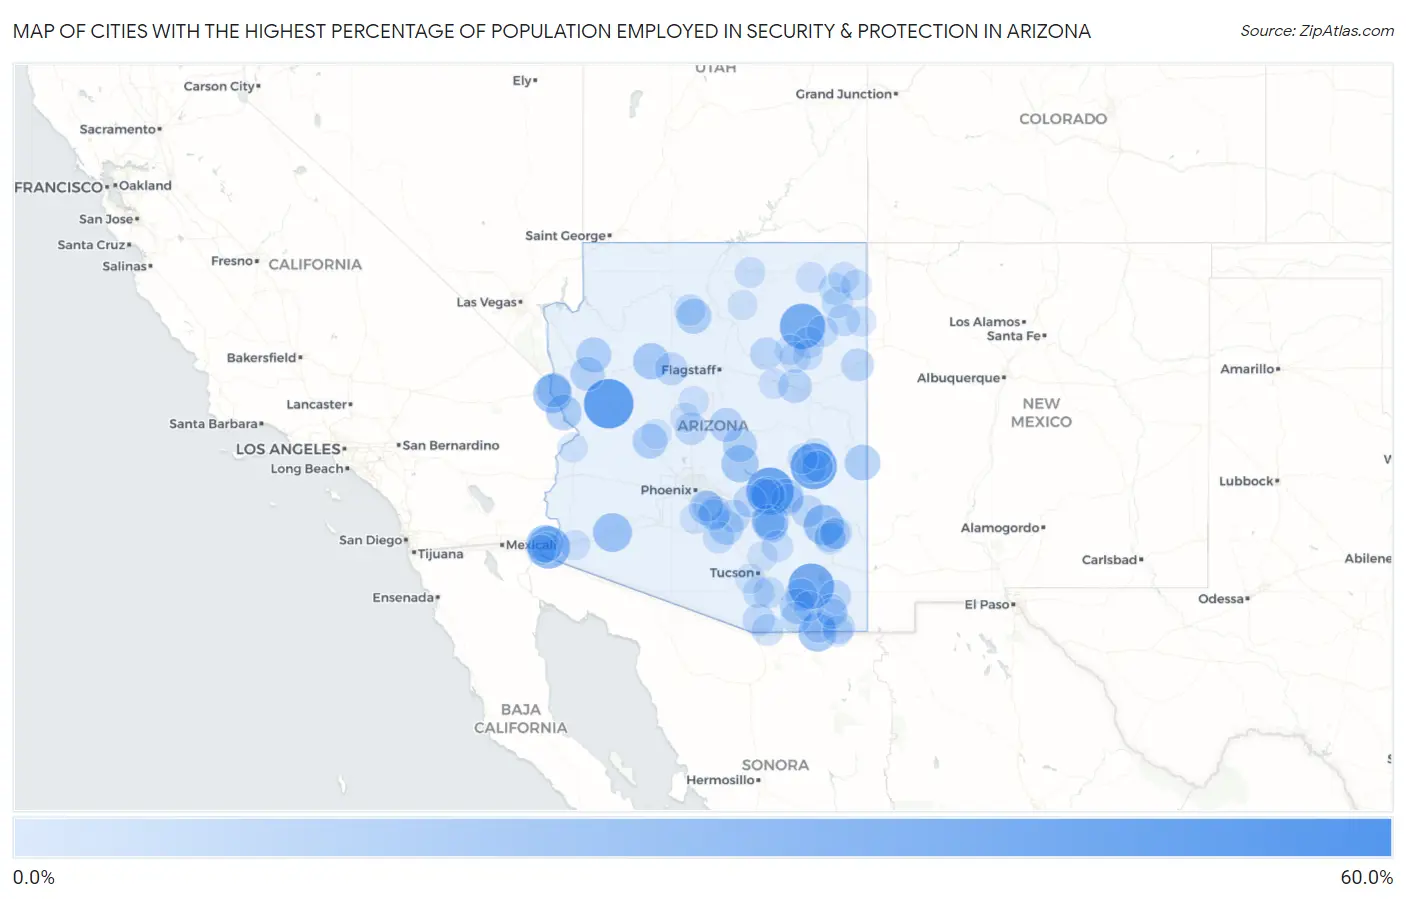
Cities with the Highest Percentage of Population Employed in Security & Protection in Arizona
| City | % Employed | vs State | vs National | |
| 1. | Mormon Lake | 59.4% | 2.5% (+56.9)#1 | 2.1% (+57.2)#18 |
| 2. | Wikieup | 50.0% | 2.5% (+47.5)#2 | 2.1% (+47.9)#30 |
| 3. | Copper Hill | 44.7% | 2.5% (+42.3)#3 | 2.1% (+42.6)#42 |
| 4. | Fort Apache | 41.9% | 2.5% (+39.4)#4 | 2.1% (+39.7)#55 |
| 5. | Dragoon | 41.0% | 2.5% (+38.5)#5 | 2.1% (+38.8)#62 |
| 6. | Keams Canyon | 40.0% | 2.5% (+37.5)#6 | 2.1% (+37.9)#64 |
| 7. | Orange Grove Mobile Manor | 32.8% | 2.5% (+30.3)#7 | 2.1% (+30.7)#96 |
| 8. | Blue Ridge | 29.7% | 2.5% (+27.2)#8 | 2.1% (+27.5)#120 |
| 9. | Bryce | 28.0% | 2.5% (+25.5)#9 | 2.1% (+25.9)#136 |
| 10. | Dateland | 25.0% | 2.5% (+22.5)#10 | 2.1% (+22.9)#177 |
| 11. | Arizona Village | 24.2% | 2.5% (+21.7)#11 | 2.1% (+22.0)#198 |
| 12. | Naco | 23.5% | 2.5% (+21.1)#12 | 2.1% (+21.4)#212 |
| 13. | Winkelman | 21.7% | 2.5% (+19.3)#13 | 2.1% (+19.6)#237 |
| 14. | Wall Lane | 21.3% | 2.5% (+18.8)#14 | 2.1% (+19.1)#247 |
| 15. | Tonto Basin | 20.8% | 2.5% (+18.4)#15 | 2.1% (+18.7)#257 |
| 16. | Seligman | 19.1% | 2.5% (+16.7)#16 | 2.1% (+17.0)#303 |
| 17. | Alpine | 17.6% | 2.5% (+15.2)#17 | 2.1% (+15.5)#347 |
| 18. | Crystal Beach | 17.4% | 2.5% (+14.9)#18 | 2.1% (+15.2)#361 |
| 19. | Whetstone | 16.6% | 2.5% (+14.2)#19 | 2.1% (+14.5)#403 |
| 20. | Tusayan | 16.4% | 2.5% (+14.0)#20 | 2.1% (+14.3)#412 |
| 21. | Valle Vista | 16.1% | 2.5% (+13.6)#21 | 2.1% (+13.9)#429 |
| 22. | San Carlos | 16.1% | 2.5% (+13.6)#22 | 2.1% (+13.9)#430 |
| 23. | Congress | 15.6% | 2.5% (+13.1)#23 | 2.1% (+13.4)#455 |
| 24. | Coolidge | 15.2% | 2.5% (+12.8)#24 | 2.1% (+13.1)#473 |
| 25. | Mohave Valley | 15.2% | 2.5% (+12.7)#25 | 2.1% (+13.0)#476 |
| 26. | Gisela | 14.3% | 2.5% (+11.8)#26 | 2.1% (+12.1)#538 |
| 27. | Goodyear Village | 14.3% | 2.5% (+11.8)#27 | 2.1% (+12.1)#539 |
| 28. | Six Shooter Canyon | 14.1% | 2.5% (+11.7)#28 | 2.1% (+12.0)#555 |
| 29. | Strawberry | 14.1% | 2.5% (+11.6)#29 | 2.1% (+11.9)#559 |
| 30. | Lazy Y U | 13.9% | 2.5% (+11.4)#30 | 2.1% (+11.7)#575 |
| 31. | Central Heights Midland City | 13.5% | 2.5% (+11.0)#31 | 2.1% (+11.3)#619 |
| 32. | Joseph City | 13.1% | 2.5% (+10.6)#32 | 2.1% (+10.9)#655 |
| 33. | Dudleyville | 11.7% | 2.5% (+9.20)#33 | 2.1% (+9.51)#816 |
| 34. | Turkey Creek | 11.3% | 2.5% (+8.87)#34 | 2.1% (+9.17)#860 |
| 35. | Florence | 11.3% | 2.5% (+8.85)#35 | 2.1% (+9.16)#864 |
| 36. | Houck | 11.2% | 2.5% (+8.70)#36 | 2.1% (+9.01)#888 |
| 37. | St David | 11.1% | 2.5% (+8.68)#37 | 2.1% (+8.99)#890 |
| 38. | Upper Santan Village | 11.1% | 2.5% (+8.66)#38 | 2.1% (+8.96)#894 |
| 39. | Bisbee | 11.1% | 2.5% (+8.63)#39 | 2.1% (+8.93)#912 |
| 40. | Ash Fork | 11.0% | 2.5% (+8.55)#40 | 2.1% (+8.85)#922 |
| 41. | Hayden | 10.8% | 2.5% (+8.34)#41 | 2.1% (+8.64)#954 |
| 42. | Tolani Lake | 10.7% | 2.5% (+8.20)#42 | 2.1% (+8.50)#984 |
| 43. | Superior | 10.6% | 2.5% (+8.15)#43 | 2.1% (+8.45)#997 |
| 44. | Sunizona | 10.5% | 2.5% (+8.07)#44 | 2.1% (+8.38)#1,008 |
| 45. | Bylas | 10.5% | 2.5% (+8.00)#45 | 2.1% (+8.30)#1,019 |
| 46. | Spring Valley | 10.4% | 2.5% (+7.97)#46 | 2.1% (+8.27)#1,024 |
| 47. | Rio Rico | 9.9% | 2.5% (+7.49)#47 | 2.1% (+7.80)#1,103 |
| 48. | Greenehaven | 9.9% | 2.5% (+7.46)#48 | 2.1% (+7.76)#1,111 |
| 49. | Douglas | 9.9% | 2.5% (+7.43)#49 | 2.1% (+7.74)#1,116 |
| 50. | Nazlini | 9.7% | 2.5% (+7.23)#50 | 2.1% (+7.53)#1,158 |
| 51. | Many Farms | 9.1% | 2.5% (+6.68)#51 | 2.1% (+6.98)#1,281 |
| 52. | Peridot | 9.0% | 2.5% (+6.56)#52 | 2.1% (+6.86)#1,332 |
| 53. | San Jose | 8.9% | 2.5% (+6.48)#53 | 2.1% (+6.79)#1,352 |
| 54. | Arizona City | 8.7% | 2.5% (+6.30)#54 | 2.1% (+6.60)#1,405 |
| 55. | Kino Springs | 8.7% | 2.5% (+6.24)#55 | 2.1% (+6.55)#1,434 |
| 56. | Whitecone | 8.6% | 2.5% (+6.19)#56 | 2.1% (+6.49)#1,447 |
| 57. | Sahuarita | 8.6% | 2.5% (+6.11)#57 | 2.1% (+6.41)#1,468 |
| 58. | Grand Canyon Village | 8.5% | 2.5% (+6.07)#58 | 2.1% (+6.38)#1,481 |
| 59. | Swift Trail Junction | 8.4% | 2.5% (+5.91)#59 | 2.1% (+6.21)#1,529 |
| 60. | Elfrida | 8.3% | 2.5% (+5.88)#60 | 2.1% (+6.18)#1,541 |
| 61. | Sacaton | 8.3% | 2.5% (+5.85)#61 | 2.1% (+6.15)#1,559 |
| 62. | Steamboat | 8.2% | 2.5% (+5.80)#62 | 2.1% (+6.10)#1,573 |
| 63. | Cactus Flats | 8.2% | 2.5% (+5.75)#63 | 2.1% (+6.05)#1,591 |
| 64. | Corona De Tucson | 8.1% | 2.5% (+5.68)#64 | 2.1% (+5.99)#1,609 |
| 65. | San Manuel | 8.1% | 2.5% (+5.61)#65 | 2.1% (+5.91)#1,635 |
| 66. | Chinle | 8.1% | 2.5% (+5.61)#66 | 2.1% (+5.91)#1,637 |
| 67. | Canyon Day | 7.9% | 2.5% (+5.50)#67 | 2.1% (+5.80)#1,673 |
| 68. | Bellemont | 7.8% | 2.5% (+5.33)#68 | 2.1% (+5.63)#1,734 |
| 69. | Dilkon | 7.6% | 2.5% (+5.15)#69 | 2.1% (+5.45)#1,801 |
| 70. | Sierra Vista | 7.4% | 2.5% (+4.93)#70 | 2.1% (+5.23)#1,910 |
| 71. | Red Rock Cdp Pinal County | 7.3% | 2.5% (+4.85)#71 | 2.1% (+5.15)#1,947 |
| 72. | North Fork | 7.3% | 2.5% (+4.83)#72 | 2.1% (+5.14)#1,950 |
| 73. | Round Rock | 7.3% | 2.5% (+4.82)#73 | 2.1% (+5.12)#1,954 |
| 74. | East Fork | 7.2% | 2.5% (+4.73)#74 | 2.1% (+5.04)#1,987 |
| 75. | Lukachukai | 7.0% | 2.5% (+4.53)#75 | 2.1% (+4.83)#2,083 |
| 76. | Solomon | 6.8% | 2.5% (+4.34)#76 | 2.1% (+4.65)#2,186 |
| 77. | Pirtleville | 6.7% | 2.5% (+4.24)#77 | 2.1% (+4.55)#2,241 |
| 78. | Kaibito | 6.7% | 2.5% (+4.20)#78 | 2.1% (+4.51)#2,278 |
| 79. | Sun Lakes | 6.4% | 2.5% (+3.99)#79 | 2.1% (+4.29)#2,401 |
| 80. | Ak Chin Village | 6.4% | 2.5% (+3.96)#80 | 2.1% (+4.26)#2,419 |
| 81. | Sawmill | 6.4% | 2.5% (+3.94)#81 | 2.1% (+4.25)#2,426 |
| 82. | Tees Toh | 6.3% | 2.5% (+3.84)#82 | 2.1% (+4.15)#2,498 |
| 83. | Chilchinbito | 6.3% | 2.5% (+3.83)#83 | 2.1% (+4.14)#2,503 |
| 84. | Somerton | 6.2% | 2.5% (+3.77)#84 | 2.1% (+4.08)#2,547 |
| 85. | Jerome | 6.2% | 2.5% (+3.77)#85 | 2.1% (+4.07)#2,551 |
| 86. | Mcneal | 6.1% | 2.5% (+3.67)#86 | 2.1% (+3.97)#2,611 |
| 87. | Wellton | 6.0% | 2.5% (+3.57)#87 | 2.1% (+3.88)#2,689 |
| 88. | Gadsden | 5.9% | 2.5% (+3.45)#88 | 2.1% (+3.75)#2,795 |
| 89. | Miami | 5.9% | 2.5% (+3.43)#89 | 2.1% (+3.73)#2,811 |
| 90. | Indian Wells | 5.9% | 2.5% (+3.43)#90 | 2.1% (+3.73)#2,816 |
| 91. | Winslow West | 5.8% | 2.5% (+3.33)#91 | 2.1% (+3.64)#2,898 |
| 92. | Cedar Creek | 5.7% | 2.5% (+3.28)#92 | 2.1% (+3.58)#2,939 |
| 93. | Tombstone | 5.7% | 2.5% (+3.23)#93 | 2.1% (+3.53)#2,984 |
| 94. | Valencia West | 5.6% | 2.5% (+3.11)#94 | 2.1% (+3.41)#3,097 |
| 95. | Peeples Valley | 5.6% | 2.5% (+3.10)#95 | 2.1% (+3.41)#3,103 |
| 96. | Catalina | 5.5% | 2.5% (+3.03)#96 | 2.1% (+3.33)#3,188 |
| 97. | Tuba City | 5.3% | 2.5% (+2.87)#97 | 2.1% (+3.17)#3,334 |
| 98. | Parker | 5.3% | 2.5% (+2.82)#98 | 2.1% (+3.12)#3,399 |
| 99. | Dewey Humboldt | 5.2% | 2.5% (+2.71)#99 | 2.1% (+3.01)#3,519 |
| 100. | J-Six Ranchettes | 5.1% | 2.5% (+2.66)#100 | 2.1% (+2.97)#3,569 |
Common Questions
What are the Top 10 Cities with the Highest Percentage of Population Employed in Security & Protection in Arizona?
Top 10 Cities with the Highest Percentage of Population Employed in Security & Protection in Arizona are:
#1
50.0%
#2
44.7%
#3
41.9%
#4
41.0%
#5
40.0%
#6
32.8%
#7
28.0%
#8
25.0%
#9
24.2%
#10
23.5%
What city has the Highest Percentage of Population Employed in Security & Protection in Arizona?
Wikieup has the Highest Percentage of Population Employed in Security & Protection in Arizona with 50.0%.
What is the Percentage of Population Employed in Security & Protection in the State of Arizona?
Percentage of Population Employed in Security & Protection in Arizona is 2.5%.
What is the Percentage of Population Employed in Security & Protection in the United States?
Percentage of Population Employed in Security & Protection in the United States is 2.1%.