Cities with the Highest Percentage of Population Employed in Security & Protection in Montana
RELATED REPORTS & OPTIONS
Security & Protection
Montana
Compare Cities
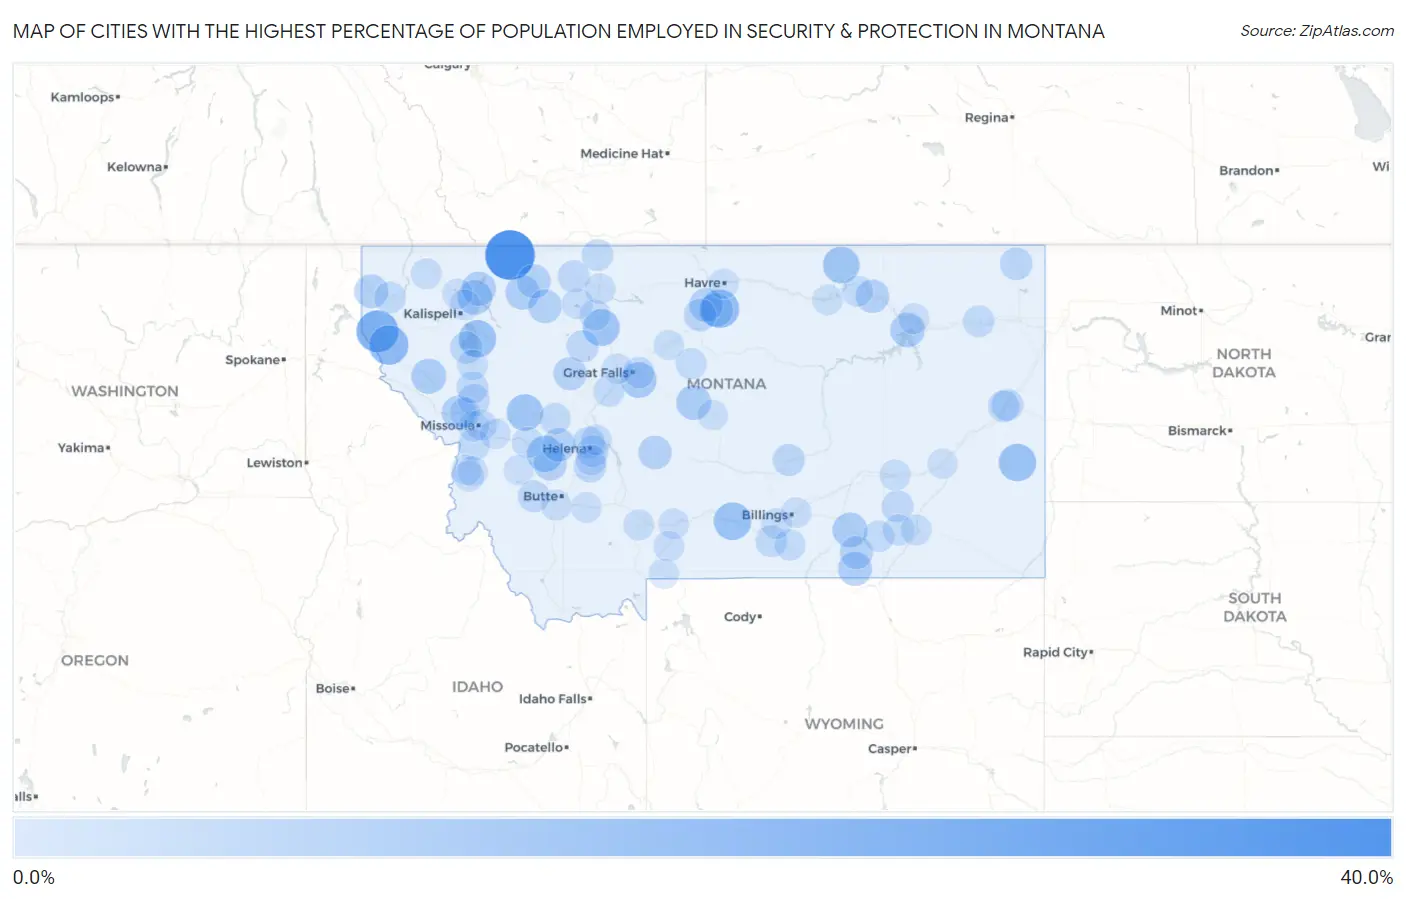
Map of Cities with the Highest Percentage of Population Employed in Security & Protection in Montana
0.0%
40.0%
Cities with the Highest Percentage of Population Employed in Security & Protection in Montana
| City | % Employed | vs State | vs National | |
| 1. | Babb | 36.9% | 1.9%(+35.0)#1 | 2.1%(+34.7)#77 |
| 2. | Potomac | 27.8% | 1.9%(+25.9)#2 | 2.1%(+25.6)#141 |
| 3. | Noxon | 23.0% | 1.9%(+21.1)#3 | 2.1%(+20.9)#219 |
| 4. | Trout Creek | 18.4% | 1.9%(+16.5)#4 | 2.1%(+16.3)#319 |
| 5. | Rocky Boy S Agency | 16.7% | 1.9%(+14.8)#5 | 2.1%(+14.5)#396 |
| 6. | Wise River | 16.7% | 1.9%(+14.8)#6 | 2.1%(+14.5)#400 |
| 7. | Hall | 15.4% | 1.9%(+13.5)#7 | 2.1%(+13.2)#468 |
| 8. | Reed Point | 15.1% | 1.9%(+13.2)#8 | 2.1%(+13.0)#480 |
| 9. | Plevna | 14.9% | 1.9%(+13.0)#9 | 2.1%(+12.8)#494 |
| 10. | Bear Dance | 14.8% | 1.9%(+12.9)#10 | 2.1%(+12.7)#497 |
| 11. | Brady | 14.0% | 1.9%(+12.0)#11 | 2.1%(+11.8)#569 |
| 12. | Whitewater | 13.5% | 1.9%(+11.6)#12 | 2.1%(+11.3)#618 |
| 13. | Ovando | 13.0% | 1.9%(+11.1)#13 | 2.1%(+10.9)#659 |
| 14. | Garrison | 12.5% | 1.9%(+10.6)#14 | 2.1%(+10.4)#712 |
| 15. | Sand Coulee | 11.7% | 1.9%(+9.79)#15 | 2.1%(+9.55)#809 |
| 16. | Plains | 10.7% | 1.9%(+8.74)#16 | 2.1%(+8.50)#983 |
| 17. | Crow Agency | 10.3% | 1.9%(+8.35)#17 | 2.1%(+8.11)#1,046 |
| 18. | Stanford | 10.1% | 1.9%(+8.18)#18 | 2.1%(+7.94)#1,082 |
| 19. | Fort Peck | 9.9% | 1.9%(+8.00)#19 | 2.1%(+7.76)#1,112 |
| 20. | Hungry Horse | 9.5% | 1.9%(+7.63)#20 | 2.1%(+7.39)#1,187 |
| 21. | East Glacier Park Village | 9.4% | 1.9%(+7.54)#21 | 2.1%(+7.30)#1,210 |
| 22. | West Glacier | 9.2% | 1.9%(+7.27)#22 | 2.1%(+7.04)#1,270 |
| 23. | Huson | 9.1% | 1.9%(+7.18)#23 | 2.1%(+6.94)#1,305 |
| 24. | Wyola | 9.0% | 1.9%(+7.05)#24 | 2.1%(+6.81)#1,342 |
| 25. | St Pierre | 8.7% | 1.9%(+6.84)#25 | 2.1%(+6.60)#1,408 |
| 26. | Rocky Boy West | 8.7% | 1.9%(+6.75)#26 | 2.1%(+6.51)#1,444 |
| 27. | North Browning | 8.6% | 1.9%(+6.65)#27 | 2.1%(+6.41)#1,465 |
| 28. | Heart Butte | 8.6% | 1.9%(+6.64)#28 | 2.1%(+6.40)#1,469 |
| 29. | Troy | 8.3% | 1.9%(+6.42)#29 | 2.1%(+6.18)#1,536 |
| 30. | Deer Lodge | 8.1% | 1.9%(+6.18)#30 | 2.1%(+5.94)#1,627 |
| 31. | White Sulphur Springs | 8.0% | 1.9%(+6.14)#31 | 2.1%(+5.90)#1,643 |
| 32. | Avon | 8.0% | 1.9%(+6.09)#32 | 2.1%(+5.85)#1,658 |
| 33. | Hinsdale | 7.9% | 1.9%(+6.00)#33 | 2.1%(+5.77)#1,685 |
| 34. | Augusta | 7.4% | 1.9%(+5.50)#34 | 2.1%(+5.26)#1,899 |
| 35. | Lodge Grass | 7.4% | 1.9%(+5.47)#35 | 2.1%(+5.23)#1,917 |
| 36. | Big Sandy | 6.5% | 1.9%(+4.57)#36 | 2.1%(+4.33)#2,367 |
| 37. | Plentywood | 6.4% | 1.9%(+4.46)#37 | 2.1%(+4.22)#2,451 |
| 38. | Cyr | 6.2% | 1.9%(+4.34)#38 | 2.1%(+4.10)#2,531 |
| 39. | Jefferson City | 6.0% | 1.9%(+4.08)#39 | 2.1%(+3.84)#2,717 |
| 40. | Lindisfarne | 6.0% | 1.9%(+4.08)#40 | 2.1%(+3.84)#2,719 |
| 41. | Roundup | 5.6% | 1.9%(+3.65)#41 | 2.1%(+3.41)#3,091 |
| 42. | Cut Bank | 5.4% | 1.9%(+3.45)#42 | 2.1%(+3.22)#3,289 |
| 43. | Anaconda Deer Lodge County | 5.3% | 1.9%(+3.42)#43 | 2.1%(+3.18)#3,333 |
| 44. | Choteau | 5.3% | 1.9%(+3.35)#44 | 2.1%(+3.11)#3,405 |
| 45. | Arlee | 5.2% | 1.9%(+3.34)#45 | 2.1%(+3.10)#3,434 |
| 46. | Helena Valley West Central | 5.2% | 1.9%(+3.30)#46 | 2.1%(+3.06)#3,470 |
| 47. | Glendive | 5.2% | 1.9%(+3.30)#47 | 2.1%(+3.06)#3,473 |
| 48. | West Glendive | 5.0% | 1.9%(+3.09)#48 | 2.1%(+2.85)#3,684 |
| 49. | South Hills | 5.0% | 1.9%(+3.06)#49 | 2.1%(+2.82)#3,722 |
| 50. | Colstrip | 5.0% | 1.9%(+3.06)#50 | 2.1%(+2.82)#3,728 |
| 51. | St Ignatius | 4.9% | 1.9%(+3.00)#51 | 2.1%(+2.76)#3,801 |
| 52. | Edgar | 4.9% | 1.9%(+2.97)#52 | 2.1%(+2.73)#3,838 |
| 53. | Libby | 4.9% | 1.9%(+2.97)#53 | 2.1%(+2.73)#3,842 |
| 54. | Sunburst | 4.8% | 1.9%(+2.90)#54 | 2.1%(+2.66)#3,911 |
| 55. | Florence | 4.8% | 1.9%(+2.90)#55 | 2.1%(+2.66)#3,918 |
| 56. | Poplar | 4.7% | 1.9%(+2.79)#56 | 2.1%(+2.55)#4,041 |
| 57. | Lincoln | 4.4% | 1.9%(+2.52)#57 | 2.1%(+2.28)#4,423 |
| 58. | Malmstrom Afb | 4.3% | 1.9%(+2.39)#58 | 2.1%(+2.15)#4,622 |
| 59. | Lame Deer | 4.2% | 1.9%(+2.27)#59 | 2.1%(+2.03)#4,784 |
| 60. | Busby | 4.1% | 1.9%(+2.20)#60 | 2.1%(+1.96)#4,912 |
| 61. | Geraldine | 4.0% | 1.9%(+2.13)#61 | 2.1%(+1.89)#5,023 |
| 62. | Drummond | 4.0% | 1.9%(+2.05)#62 | 2.1%(+1.81)#5,181 |
| 63. | Cascade | 3.9% | 1.9%(+2.04)#63 | 2.1%(+1.80)#5,202 |
| 64. | East Missoula | 3.9% | 1.9%(+1.99)#64 | 2.1%(+1.75)#5,286 |
| 65. | Pryor | 3.8% | 1.9%(+1.88)#65 | 2.1%(+1.64)#5,511 |
| 66. | Pine Creek | 3.7% | 1.9%(+1.84)#66 | 2.1%(+1.60)#5,604 |
| 67. | Saco | 3.7% | 1.9%(+1.84)#67 | 2.1%(+1.60)#5,605 |
| 68. | Ashland | 3.7% | 1.9%(+1.82)#68 | 2.1%(+1.58)#5,652 |
| 69. | Nashua | 3.7% | 1.9%(+1.79)#69 | 2.1%(+1.56)#5,699 |
| 70. | Conrad | 3.7% | 1.9%(+1.79)#70 | 2.1%(+1.55)#5,713 |
| 71. | Forsyth | 3.7% | 1.9%(+1.78)#71 | 2.1%(+1.54)#5,748 |
| 72. | Butte Silver Bow Balance | 3.7% | 1.9%(+1.75)#72 | 2.1%(+1.51)#5,812 |
| 73. | Orchard Homes | 3.6% | 1.9%(+1.68)#73 | 2.1%(+1.44)#5,939 |
| 74. | Laurel | 3.6% | 1.9%(+1.66)#74 | 2.1%(+1.42)#5,986 |
| 75. | Valier | 3.4% | 1.9%(+1.54)#75 | 2.1%(+1.30)#6,251 |
| 76. | Helena Valley Northeast | 3.4% | 1.9%(+1.44)#76 | 2.1%(+1.21)#6,490 |
| 77. | Shelby | 3.3% | 1.9%(+1.41)#77 | 2.1%(+1.17)#6,581 |
| 78. | Clancy | 3.3% | 1.9%(+1.40)#78 | 2.1%(+1.17)#6,601 |
| 79. | Four Corners | 3.3% | 1.9%(+1.37)#79 | 2.1%(+1.13)#6,686 |
| 80. | Pablo | 3.2% | 1.9%(+1.30)#80 | 2.1%(+1.06)#6,859 |
| 81. | Hamilton | 3.2% | 1.9%(+1.27)#81 | 2.1%(+1.03)#6,917 |
| 82. | Trego | 3.2% | 1.9%(+1.26)#82 | 2.1%(+1.02)#6,953 |
| 83. | Helena Flats | 3.2% | 1.9%(+1.25)#83 | 2.1%(+1.01)#6,992 |
| 84. | Livingston | 3.1% | 1.9%(+1.19)#84 | 2.1%(+0.948)#7,166 |
| 85. | Whitehall | 3.1% | 1.9%(+1.17)#85 | 2.1%(+0.932)#7,221 |
| 86. | Malta | 3.1% | 1.9%(+1.15)#86 | 2.1%(+0.915)#7,274 |
| 87. | Hobson | 3.0% | 1.9%(+1.12)#87 | 2.1%(+0.882)#7,395 |
| 88. | Pray | 3.0% | 1.9%(+1.10)#88 | 2.1%(+0.862)#7,458 |
| 89. | Frenchtown | 3.0% | 1.9%(+1.09)#89 | 2.1%(+0.848)#7,502 |
| 90. | Vaughn | 3.0% | 1.9%(+1.06)#90 | 2.1%(+0.824)#7,581 |
| 91. | Whitefish | 2.9% | 1.9%(+1.03)#91 | 2.1%(+0.793)#7,676 |
| 92. | Clinton | 2.9% | 1.9%(+1.01)#92 | 2.1%(+0.769)#7,766 |
| 93. | Lockwood | 2.7% | 1.9%(+0.840)#93 | 2.1%(+0.601)#8,317 |
| 94. | Pinesdale | 2.7% | 1.9%(+0.787)#94 | 2.1%(+0.548)#8,510 |
| 95. | Fort Benton | 2.7% | 1.9%(+0.753)#95 | 2.1%(+0.514)#8,609 |
| 96. | Havre | 2.6% | 1.9%(+0.652)#96 | 2.1%(+0.413)#8,977 |
| 97. | Corvallis | 2.5% | 1.9%(+0.604)#97 | 2.1%(+0.365)#9,165 |
| 98. | Miles City | 2.4% | 1.9%(+0.490)#98 | 2.1%(+0.251)#9,603 |
| 99. | Gardiner | 2.4% | 1.9%(+0.485)#99 | 2.1%(+0.246)#9,617 |
| 100. | Philipsburg | 2.3% | 1.9%(+0.383)#100 | 2.1%(+0.144)#10,029 |
Common Questions
What are the Top 10 Cities with the Highest Percentage of Population Employed in Security & Protection in Montana?
Top 10 Cities with the Highest Percentage of Population Employed in Security & Protection in Montana are:
#1
36.9%
#2
23.0%
#3
18.4%
#4
16.7%
#5
15.1%
#6
14.9%
#7
14.8%
#8
14.0%
#9
13.5%
#10
13.0%
What city has the Highest Percentage of Population Employed in Security & Protection in Montana?
Babb has the Highest Percentage of Population Employed in Security & Protection in Montana with 36.9%.
What is the Percentage of Population Employed in Security & Protection in the State of Montana?
Percentage of Population Employed in Security & Protection in Montana is 1.9%.
What is the Percentage of Population Employed in Security & Protection in the United States?
Percentage of Population Employed in Security & Protection in the United States is 2.1%.