Cities with the Highest Percentage of Population Employed in Security & Protection in Alaska
RELATED REPORTS & OPTIONS
Security & Protection
Alaska
Compare Cities
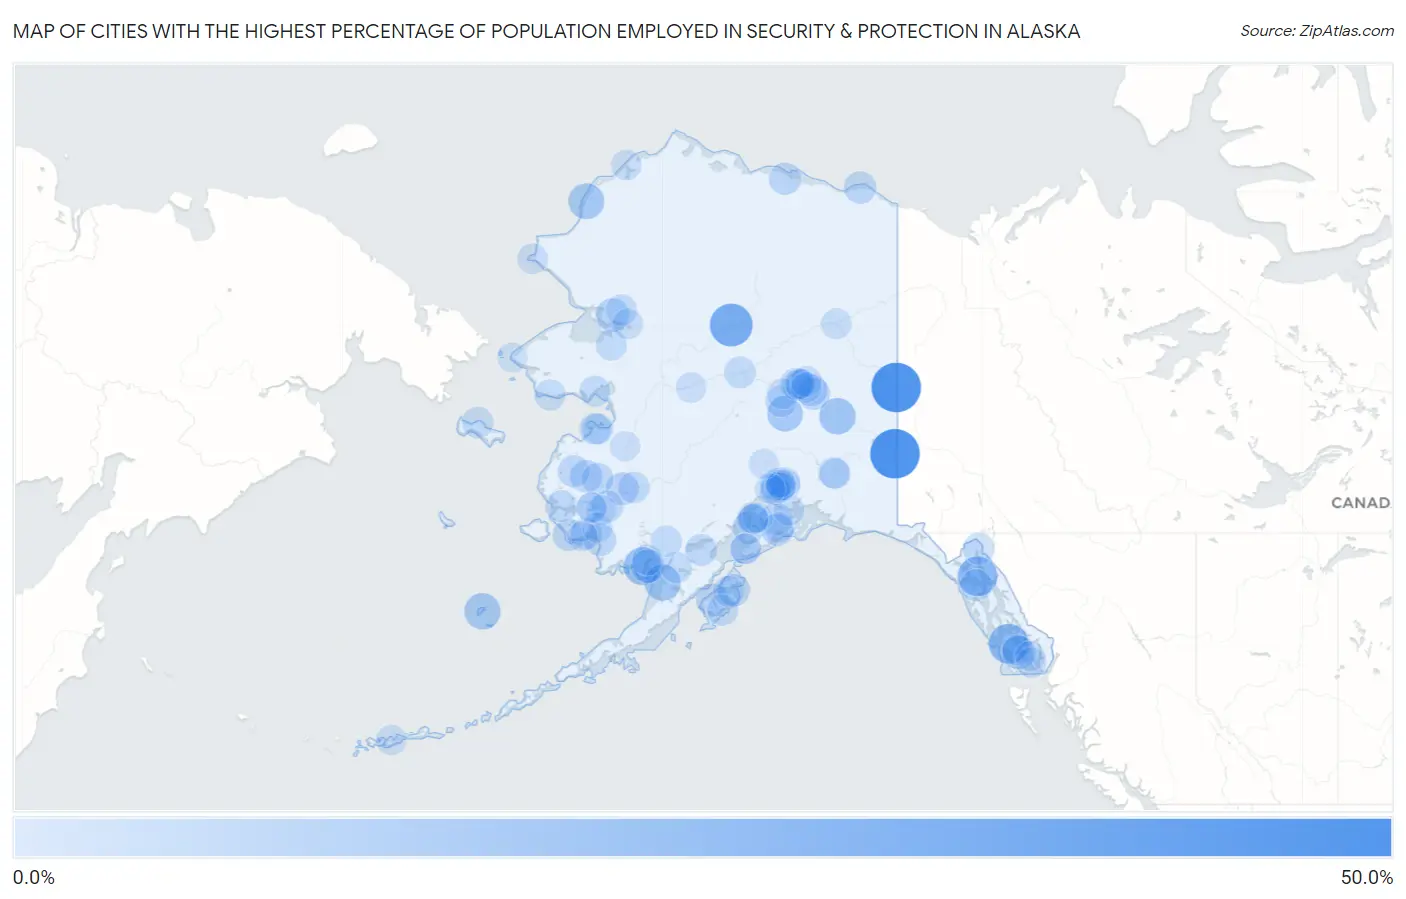
Map of Cities with the Highest Percentage of Population Employed in Security & Protection in Alaska
0.0%
50.0%
Cities with the Highest Percentage of Population Employed in Security & Protection in Alaska
| City | % Employed | vs State | vs National | |
| 1. | Alcan Border | 50.0% | 2.9%(+47.1)#1 | 2.1%(+47.9)#25 |
| 2. | Eagle Village | 50.0% | 2.9%(+47.1)#2 | 2.1%(+47.9)#29 |
| 3. | Allakaket | 33.3% | 2.9%(+30.4)#3 | 2.1%(+31.2)#89 |
| 4. | Naukati Bay | 26.0% | 2.9%(+23.0)#4 | 2.1%(+23.8)#162 |
| 5. | Excursion Inlet | 25.5% | 2.9%(+22.6)#5 | 2.1%(+23.4)#169 |
| 6. | Manokotak | 21.0% | 2.9%(+18.1)#6 | 2.1%(+18.9)#254 |
| 7. | Deltana | 17.7% | 2.9%(+14.8)#7 | 2.1%(+15.6)#344 |
| 8. | Egegik | 17.4% | 2.9%(+14.4)#8 | 2.1%(+15.2)#363 |
| 9. | St Paul | 17.3% | 2.9%(+14.3)#9 | 2.1%(+15.1)#369 |
| 10. | Point Lay | 16.1% | 2.9%(+13.2)#10 | 2.1%(+14.0)#428 |
| 11. | Healy | 15.4% | 2.9%(+12.5)#11 | 2.1%(+13.3)#461 |
| 12. | Kasaan | 11.4% | 2.9%(+8.42)#12 | 2.1%(+9.22)#855 |
| 13. | Clark S Point | 11.1% | 2.9%(+8.17)#13 | 2.1%(+8.96)#908 |
| 14. | Noorvik | 10.3% | 2.9%(+7.37)#14 | 2.1%(+8.17)#1,038 |
| 15. | Larsen Bay | 9.7% | 2.9%(+6.73)#15 | 2.1%(+7.53)#1,162 |
| 16. | Lower Kalskag | 9.2% | 2.9%(+6.29)#16 | 2.1%(+7.08)#1,257 |
| 17. | Eareckson Station | 8.8% | 2.9%(+5.90)#17 | 2.1%(+6.70)#1,384 |
| 18. | Moose Pass | 8.8% | 2.9%(+5.88)#18 | 2.1%(+6.68)#1,390 |
| 19. | Ouzinkie | 8.7% | 2.9%(+5.75)#19 | 2.1%(+6.55)#1,437 |
| 20. | Pilot Station | 8.6% | 2.9%(+5.63)#20 | 2.1%(+6.42)#1,460 |
| 21. | Salcha | 8.3% | 2.9%(+5.39)#21 | 2.1%(+6.18)#1,537 |
| 22. | Eielson Afb | 8.2% | 2.9%(+5.28)#22 | 2.1%(+6.07)#1,579 |
| 23. | Kaktovik | 8.1% | 2.9%(+5.16)#23 | 2.1%(+5.96)#1,619 |
| 24. | Kipnuk | 8.0% | 2.9%(+5.08)#24 | 2.1%(+5.88)#1,649 |
| 25. | Clam Gulch | 7.9% | 2.9%(+4.93)#25 | 2.1%(+5.73)#1,696 |
| 26. | Mill Bay | 7.8% | 2.9%(+4.90)#26 | 2.1%(+5.69)#1,712 |
| 27. | Prudhoe Bay | 7.8% | 2.9%(+4.86)#27 | 2.1%(+5.66)#1,727 |
| 28. | Quinhagak | 7.4% | 2.9%(+4.45)#28 | 2.1%(+5.24)#1,908 |
| 29. | Seward | 7.3% | 2.9%(+4.39)#29 | 2.1%(+5.19)#1,927 |
| 30. | Mountain Village | 7.2% | 2.9%(+4.23)#30 | 2.1%(+5.03)#1,991 |
| 31. | Hoonah | 7.1% | 2.9%(+4.20)#31 | 2.1%(+4.99)#1,997 |
| 32. | Skagway | 7.0% | 2.9%(+4.01)#32 | 2.1%(+4.81)#2,099 |
| 33. | Newtok | 6.9% | 2.9%(+3.95)#33 | 2.1%(+4.75)#2,143 |
| 34. | Ester | 6.8% | 2.9%(+3.84)#34 | 2.1%(+4.64)#2,193 |
| 35. | Wrangell City And Borough | 6.7% | 2.9%(+3.80)#35 | 2.1%(+4.60)#2,205 |
| 36. | Kongiganak | 6.7% | 2.9%(+3.80)#36 | 2.1%(+4.59)#2,215 |
| 37. | Marshall | 6.7% | 2.9%(+3.72)#37 | 2.1%(+4.52)#2,266 |
| 38. | Kokhanok | 6.7% | 2.9%(+3.72)#38 | 2.1%(+4.52)#2,271 |
| 39. | Tanana | 6.5% | 2.9%(+3.51)#39 | 2.1%(+4.30)#2,393 |
| 40. | Akiachak | 6.4% | 2.9%(+3.44)#40 | 2.1%(+4.23)#2,439 |
| 41. | Anderson | 6.4% | 2.9%(+3.44)#41 | 2.1%(+4.23)#2,441 |
| 42. | Stebbins | 6.2% | 2.9%(+3.27)#42 | 2.1%(+4.07)#2,550 |
| 43. | Savoonga | 6.2% | 2.9%(+3.21)#43 | 2.1%(+4.01)#2,587 |
| 44. | Aniak | 5.9% | 2.9%(+2.98)#44 | 2.1%(+3.77)#2,775 |
| 45. | St Michael | 5.7% | 2.9%(+2.77)#45 | 2.1%(+3.57)#2,952 |
| 46. | King Salmon | 5.7% | 2.9%(+2.71)#46 | 2.1%(+3.51)#2,999 |
| 47. | Koliganek | 5.7% | 2.9%(+2.71)#47 | 2.1%(+3.51)#3,001 |
| 48. | Kiana | 5.6% | 2.9%(+2.61)#48 | 2.1%(+3.41)#3,107 |
| 49. | Tazlina | 5.5% | 2.9%(+2.53)#49 | 2.1%(+3.32)#3,195 |
| 50. | Buckland | 5.4% | 2.9%(+2.46)#50 | 2.1%(+3.26)#3,253 |
| 51. | Old Harbor | 5.4% | 2.9%(+2.41)#51 | 2.1%(+3.21)#3,303 |
| 52. | Port Lions | 5.1% | 2.9%(+2.14)#52 | 2.1%(+2.94)#3,612 |
| 53. | Nome | 5.0% | 2.9%(+2.07)#53 | 2.1%(+2.87)#3,669 |
| 54. | Elim | 5.0% | 2.9%(+2.05)#54 | 2.1%(+2.85)#3,694 |
| 55. | Seldovia Village | 4.9% | 2.9%(+1.99)#55 | 2.1%(+2.79)#3,763 |
| 56. | Chena Ridge | 4.9% | 2.9%(+1.99)#56 | 2.1%(+2.79)#3,765 |
| 57. | Utqiagvik | 4.9% | 2.9%(+1.93)#57 | 2.1%(+2.73)#3,843 |
| 58. | Dillingham | 4.8% | 2.9%(+1.88)#58 | 2.1%(+2.68)#3,899 |
| 59. | South Van Horn | 4.8% | 2.9%(+1.86)#59 | 2.1%(+2.66)#3,920 |
| 60. | Whittier | 4.8% | 2.9%(+1.84)#60 | 2.1%(+2.64)#3,932 |
| 61. | Lazy Mountain | 4.7% | 2.9%(+1.77)#61 | 2.1%(+2.57)#4,014 |
| 62. | Nenana | 4.7% | 2.9%(+1.72)#62 | 2.1%(+2.52)#4,088 |
| 63. | Juneau City And Borough | 4.6% | 2.9%(+1.66)#63 | 2.1%(+2.45)#4,181 |
| 64. | Silver Springs | 4.5% | 2.9%(+1.53)#64 | 2.1%(+2.33)#4,349 |
| 65. | Fort Yukon | 4.5% | 2.9%(+1.51)#65 | 2.1%(+2.31)#4,381 |
| 66. | Selawik | 4.4% | 2.9%(+1.45)#66 | 2.1%(+2.25)#4,470 |
| 67. | Steele Creek | 4.4% | 2.9%(+1.40)#67 | 2.1%(+2.20)#4,531 |
| 68. | Kenai | 4.3% | 2.9%(+1.40)#68 | 2.1%(+2.20)#4,553 |
| 69. | Kalifornsky | 4.2% | 2.9%(+1.26)#69 | 2.1%(+2.06)#4,751 |
| 70. | Point Hope | 4.2% | 2.9%(+1.25)#70 | 2.1%(+2.05)#4,766 |
| 71. | Thorne Bay | 4.1% | 2.9%(+1.15)#71 | 2.1%(+1.94)#4,952 |
| 72. | North Pole | 4.0% | 2.9%(+1.03)#72 | 2.1%(+1.83)#5,143 |
| 73. | Ruby | 3.8% | 2.9%(+0.852)#73 | 2.1%(+1.65)#5,499 |
| 74. | Bear Creek | 3.8% | 2.9%(+0.828)#74 | 2.1%(+1.63)#5,545 |
| 75. | Nunapitchuk | 3.7% | 2.9%(+0.789)#75 | 2.1%(+1.59)#5,636 |
| 76. | Sutton Alpine | 3.7% | 2.9%(+0.779)#76 | 2.1%(+1.58)#5,651 |
| 77. | Sitka City And Borough | 3.7% | 2.9%(+0.770)#77 | 2.1%(+1.57)#5,671 |
| 78. | Wainwright | 3.7% | 2.9%(+0.758)#78 | 2.1%(+1.56)#5,695 |
| 79. | Meadow Lakes | 3.7% | 2.9%(+0.749)#79 | 2.1%(+1.55)#5,724 |
| 80. | Metlakatla | 3.7% | 2.9%(+0.709)#80 | 2.1%(+1.51)#5,814 |
| 81. | Adak | 3.6% | 2.9%(+0.681)#81 | 2.1%(+1.48)#5,871 |
| 82. | Wasilla | 3.6% | 2.9%(+0.632)#82 | 2.1%(+1.43)#5,956 |
| 83. | Bethel | 3.5% | 2.9%(+0.603)#83 | 2.1%(+1.40)#6,010 |
| 84. | Palmer | 3.5% | 2.9%(+0.554)#84 | 2.1%(+1.35)#6,119 |
| 85. | Seldovia | 3.5% | 2.9%(+0.543)#85 | 2.1%(+1.34)#6,152 |
| 86. | College | 3.5% | 2.9%(+0.514)#86 | 2.1%(+1.31)#6,228 |
| 87. | Eek | 3.4% | 2.9%(+0.479)#87 | 2.1%(+1.28)#6,310 |
| 88. | Knik Fairview | 3.4% | 2.9%(+0.460)#88 | 2.1%(+1.26)#6,355 |
| 89. | Gateway | 3.4% | 2.9%(+0.458)#89 | 2.1%(+1.25)#6,363 |
| 90. | Fishhook | 3.3% | 2.9%(+0.393)#90 | 2.1%(+1.19)#6,533 |
| 91. | Kasigluk | 3.3% | 2.9%(+0.388)#91 | 2.1%(+1.18)#6,552 |
| 92. | Farm Loop | 3.3% | 2.9%(+0.369)#92 | 2.1%(+1.17)#6,595 |
| 93. | Kwigillingok | 3.3% | 2.9%(+0.333)#93 | 2.1%(+1.13)#6,669 |
| 94. | Big Lake | 3.2% | 2.9%(+0.298)#94 | 2.1%(+1.09)#6,761 |
| 95. | Grayling | 3.2% | 2.9%(+0.229)#95 | 2.1%(+1.03)#6,940 |
| 96. | Ketchikan | 3.2% | 2.9%(+0.206)#96 | 2.1%(+1.00)#7,004 |
| 97. | Sterling | 3.1% | 2.9%(+0.144)#97 | 2.1%(+0.941)#7,197 |
| 98. | Trapper Creek | 3.1% | 2.9%(+0.131)#98 | 2.1%(+0.929)#7,236 |
| 99. | Soldotna | 3.1% | 2.9%(+0.105)#99 | 2.1%(+0.902)#7,315 |
| 100. | Wales | 3.0% | 2.9%(+0.085)#100 | 2.1%(+0.882)#7,385 |
Common Questions
What are the Top 10 Cities with the Highest Percentage of Population Employed in Security & Protection in Alaska?
Top 10 Cities with the Highest Percentage of Population Employed in Security & Protection in Alaska are:
#1
50.0%
#2
50.0%
#3
33.3%
#4
26.0%
#5
25.5%
#6
21.0%
#7
17.7%
#8
17.4%
#9
17.3%
#10
16.1%
What city has the Highest Percentage of Population Employed in Security & Protection in Alaska?
Alcan Border has the Highest Percentage of Population Employed in Security & Protection in Alaska with 50.0%.
What is the Percentage of Population Employed in Security & Protection in the State of Alaska?
Percentage of Population Employed in Security & Protection in Alaska is 2.9%.
What is the Percentage of Population Employed in Security & Protection in the United States?
Percentage of Population Employed in Security & Protection in the United States is 2.1%.