Airport, CA Map & Demographics
Airport Map
Airport Overview
$17,701
PER CAPITA INCOME
$29,479
AVG HOUSEHOLD INCOME
16.5%
WAGE / INCOME GAP [ % ]
83.5¢/ $1
WAGE / INCOME GAP [ $ ]
0.57
INEQUALITY / GINI INDEX
1,387
TOTAL POPULATION
609
MALE POPULATION
778
FEMALE POPULATION
78.28
MALES / 100 FEMALES
127.75
FEMALES / 100 MALES
33.7
MEDIAN AGE
4.2
AVG FAMILY SIZE
3.5
AVG HOUSEHOLD SIZE
535
LABOR FORCE [ PEOPLE ]
46.7%
PERCENT IN LABOR FORCE
19.8%
UNEMPLOYMENT RATE
Income in Airport
Income Overview in Airport
| Characteristic | Number | Measure |
| Per Capita Income | 1,387 | $17,701 |
| Median Family Income | 279 | $0 |
| Mean Family Income | 279 | $76,709 |
| Median Household Income | 393 | $29,479 |
| Mean Household Income | 393 | $60,250 |
| Income Deficit | 279 | $0 |
| Wage / Income Gap (%) | 1,387 | 16.55% |
| Wage / Income Gap ($) | 1,387 | 83.45¢ per $1 |
| Gini / Inequality Index | 1,387 | 0.57 |
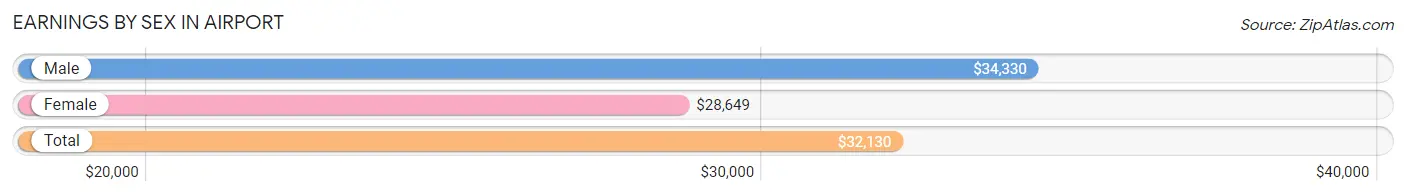
Earnings by Sex in Airport
Average Earnings in Airport are $32,130, $34,330 for men and $28,649 for women, a difference of 16.6%.
| Sex | Number | Average Earnings |
| Male | 228 (43.2%) | $34,330 |
| Female | 300 (56.8%) | $28,649 |
| Total | 528 (100.0%) | $32,130 |
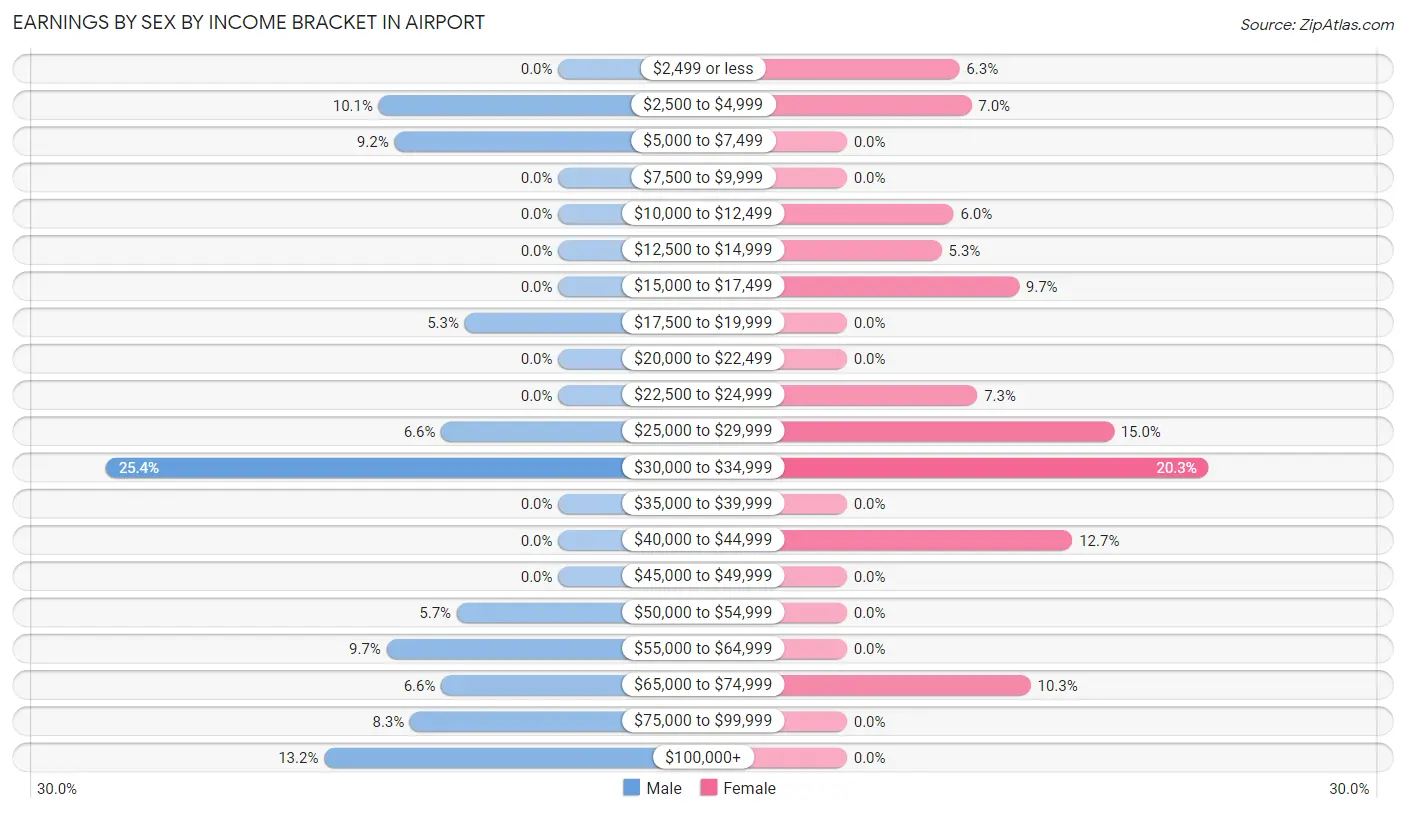
Earnings by Sex by Income Bracket in Airport
The most common earnings brackets in Airport are $30,000 to $34,999 for men (58 | 25.4%) and $30,000 to $34,999 for women (61 | 20.3%).
| Income | Male | Female |
| $2,499 or less | 0 (0.0%) | 19 (6.3%) |
| $2,500 to $4,999 | 23 (10.1%) | 21 (7.0%) |
| $5,000 to $7,499 | 21 (9.2%) | 0 (0.0%) |
| $7,500 to $9,999 | 0 (0.0%) | 0 (0.0%) |
| $10,000 to $12,499 | 0 (0.0%) | 18 (6.0%) |
| $12,500 to $14,999 | 0 (0.0%) | 16 (5.3%) |
| $15,000 to $17,499 | 0 (0.0%) | 29 (9.7%) |
| $17,500 to $19,999 | 12 (5.3%) | 0 (0.0%) |
| $20,000 to $22,499 | 0 (0.0%) | 0 (0.0%) |
| $22,500 to $24,999 | 0 (0.0%) | 22 (7.3%) |
| $25,000 to $29,999 | 15 (6.6%) | 45 (15.0%) |
| $30,000 to $34,999 | 58 (25.4%) | 61 (20.3%) |
| $35,000 to $39,999 | 0 (0.0%) | 0 (0.0%) |
| $40,000 to $44,999 | 0 (0.0%) | 38 (12.7%) |
| $45,000 to $49,999 | 0 (0.0%) | 0 (0.0%) |
| $50,000 to $54,999 | 13 (5.7%) | 0 (0.0%) |
| $55,000 to $64,999 | 22 (9.7%) | 0 (0.0%) |
| $65,000 to $74,999 | 15 (6.6%) | 31 (10.3%) |
| $75,000 to $99,999 | 19 (8.3%) | 0 (0.0%) |
| $100,000+ | 30 (13.2%) | 0 (0.0%) |
| Total | 228 (100.0%) | 300 (100.0%) |
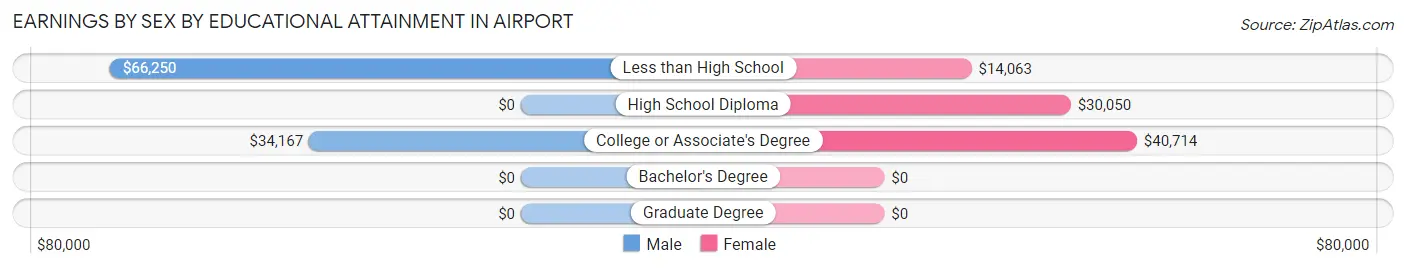
Earnings by Sex by Educational Attainment in Airport
Average earnings in Airport are $34,576 for men and $29,527 for women, a difference of 14.6%. Men with an educational attainment of less than high school enjoy the highest average annual earnings of $66,250, while those with college or associate's degree education earn the least with $34,167. Women with an educational attainment of college or associate's degree earn the most with the average annual earnings of $40,714, while those with less than high school education have the smallest earnings of $14,063.
| Educational Attainment | Male Income | Female Income |
| Less than High School | $66,250 | $14,063 |
| High School Diploma | - | - |
| College or Associate's Degree | $34,167 | $40,714 |
| Bachelor's Degree | - | - |
| Graduate Degree | - | - |
| Total | $34,576 | $29,527 |
Family Income in Airport
Family Income Brackets in Airport
According to the Airport family income data, there are 68 families falling into the $15,000 to $24,999 income range, which is the most common income bracket and makes up 24.4% of all families.
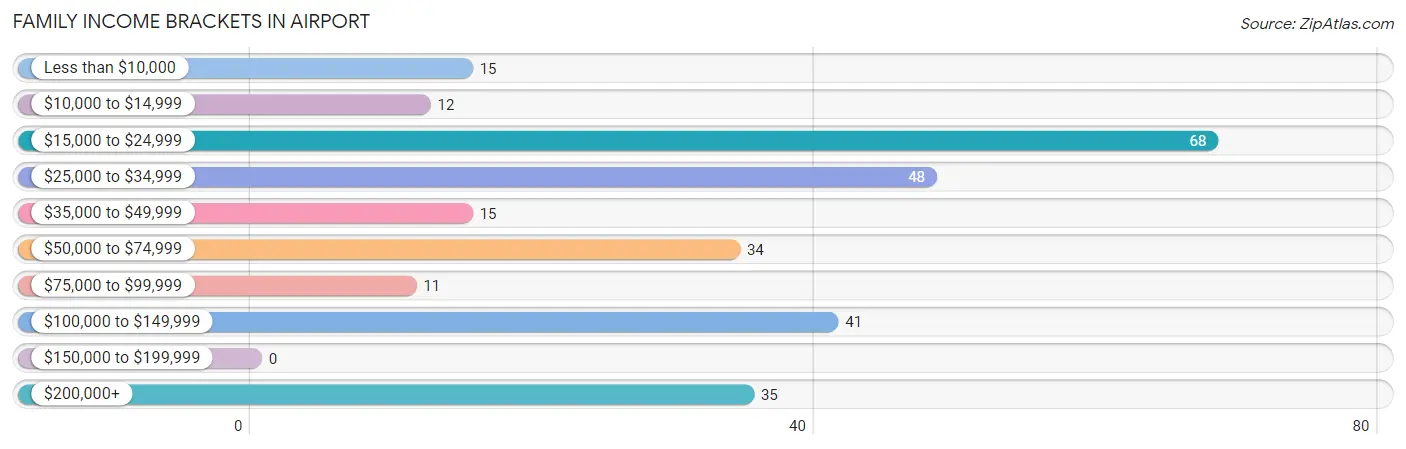
| Income Bracket | # Families | % Families |
| Less than $10,000 | 15 | 5.4% |
| $10,000 to $14,999 | 12 | 4.3% |
| $15,000 to $24,999 | 68 | 24.4% |
| $25,000 to $34,999 | 48 | 17.2% |
| $35,000 to $49,999 | 15 | 5.4% |
| $50,000 to $74,999 | 34 | 12.2% |
| $75,000 to $99,999 | 11 | 3.9% |
| $100,000 to $149,999 | 41 | 14.7% |
| $150,000 to $199,999 | 0 | 0.0% |
| $200,000+ | 35 | 12.5% |
Family Income by Famaliy Size in Airport
4-person families (64 | 22.9%) account for the highest median family income in Airport with $60,227 per family, while 4-person families (64 | 22.9%) have the highest median income of $15,057 per family member.
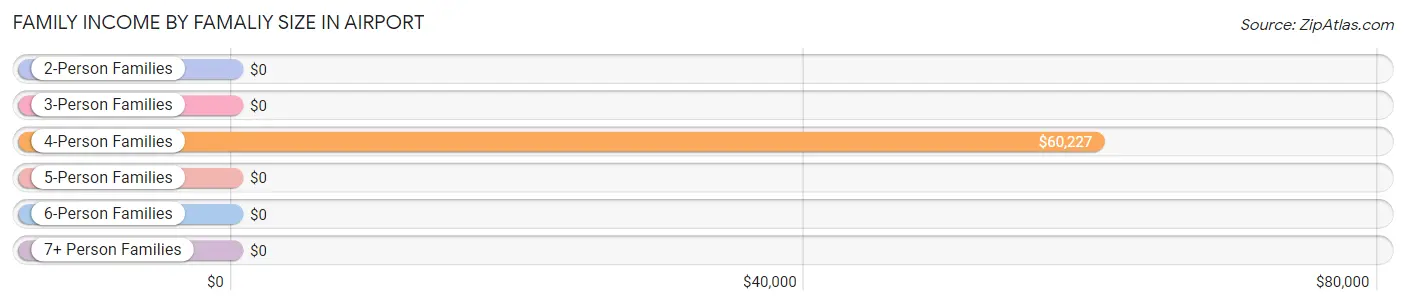
| Income Bracket | # Families | Median Income |
| 2-Person Families | 71 (25.5%) | $0 |
| 3-Person Families | 70 (25.1%) | $0 |
| 4-Person Families | 64 (22.9%) | $60,227 |
| 5-Person Families | 24 (8.6%) | $0 |
| 6-Person Families | 15 (5.4%) | $0 |
| 7+ Person Families | 35 (12.5%) | $0 |
| Total | 279 (100.0%) | $0 |
Family Income by Number of Earners in Airport
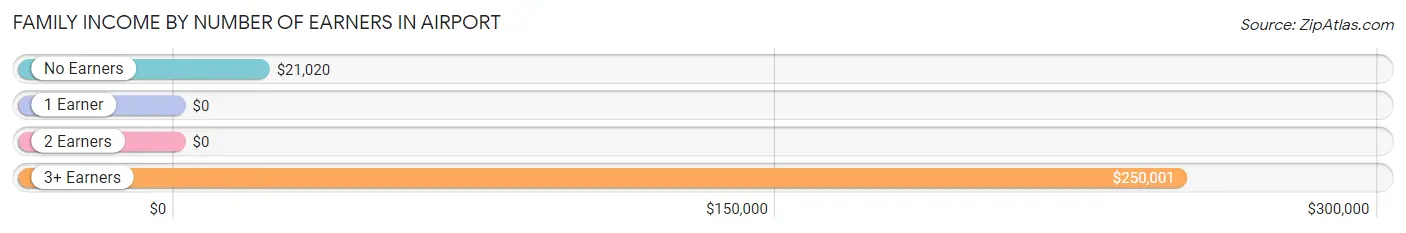
| Number of Earners | # Families | Median Income |
| No Earners | 61 (21.9%) | $21,020 |
| 1 Earner | 111 (39.8%) | $0 |
| 2 Earners | 62 (22.2%) | $0 |
| 3+ Earners | 45 (16.1%) | $250,001 |
| Total | 279 (100.0%) | $0 |
Household Income in Airport
Household Income Brackets in Airport
With 77 households falling in the category, the $15,000 to $24,999 income range is the most frequent in Airport, accounting for 19.6% of all households.
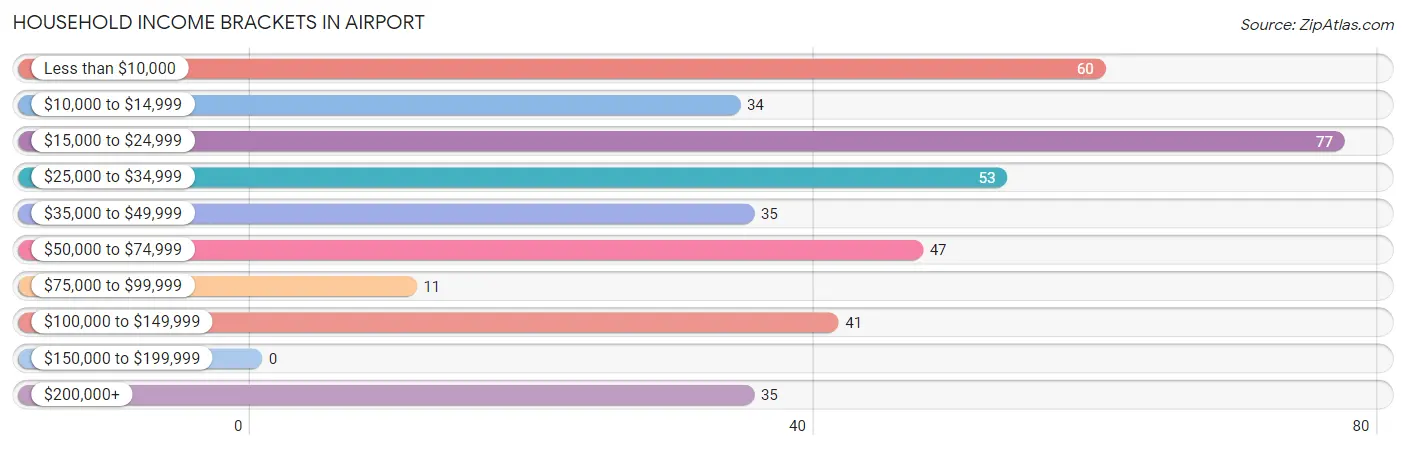
| Income Bracket | # Households | % Households |
| Less than $10,000 | 60 | 15.3% |
| $10,000 to $14,999 | 34 | 8.7% |
| $15,000 to $24,999 | 77 | 19.6% |
| $25,000 to $34,999 | 53 | 13.5% |
| $35,000 to $49,999 | 35 | 8.9% |
| $50,000 to $74,999 | 47 | 12.0% |
| $75,000 to $99,999 | 11 | 2.8% |
| $100,000 to $149,999 | 41 | 10.4% |
| $150,000 to $199,999 | 0 | 0.0% |
| $200,000+ | 35 | 8.9% |
Household Income by Householder Age in Airport
The median household income in Airport is $29,479, with the highest median household income of $50,288 found in the 25 to 44 years age bracket for the primary householder. A total of 209 households (53.2%) fall into this category.
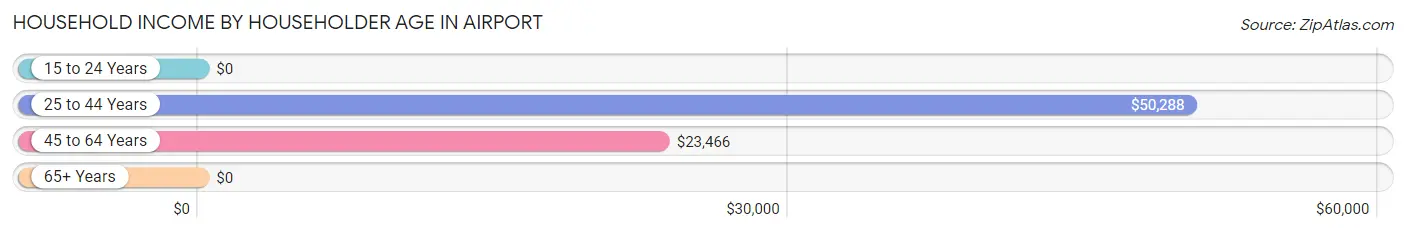
| Income Bracket | # Households | Median Income |
| 15 to 24 Years | 0 (0.0%) | $0 |
| 25 to 44 Years | 209 (53.2%) | $50,288 |
| 45 to 64 Years | 113 (28.7%) | $23,466 |
| 65+ Years | 71 (18.1%) | $0 |
| Total | 393 (100.0%) | $29,479 |
Poverty in Airport
Income Below Poverty by Sex and Age in Airport
With 38.8% poverty level for males and 39.2% for females among the residents of Airport, 25 to 34 year old males and 75 year old and over females are the most vulnerable to poverty, with 86 males (98.9%) and 17 females (65.4%) in their respective age groups living below the poverty level.
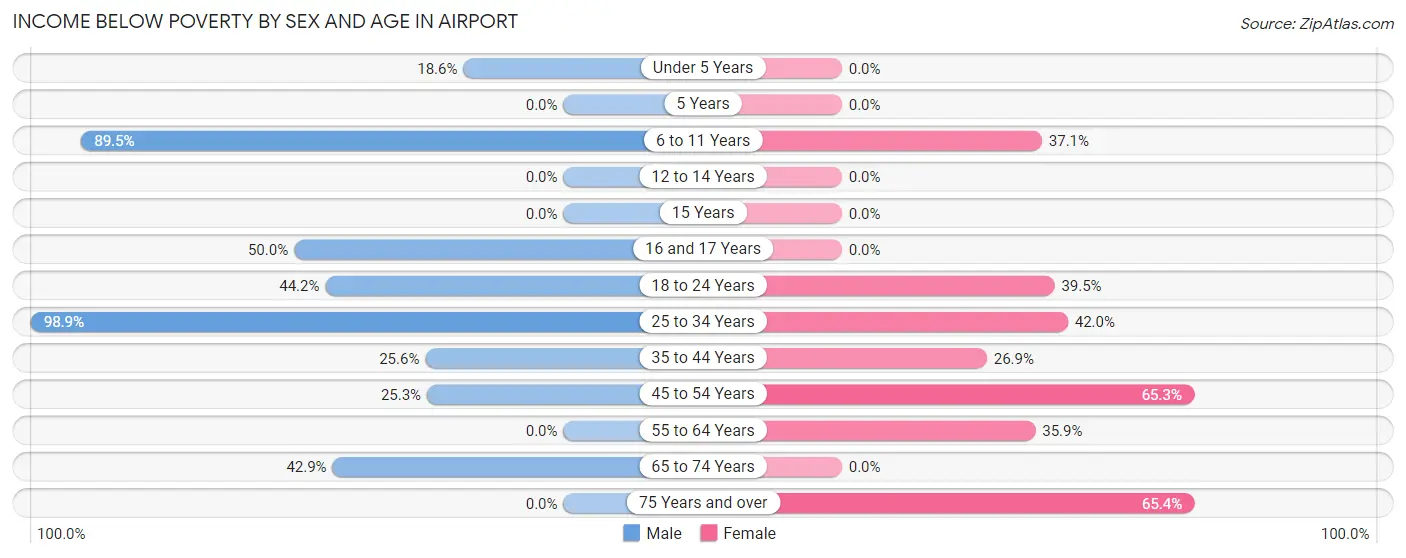
| Age Bracket | Male | Female |
| Under 5 Years | 13 (18.6%) | 0 (0.0%) |
| 5 Years | 0 (0.0%) | 0 (0.0%) |
| 6 to 11 Years | 34 (89.5%) | 13 (37.1%) |
| 12 to 14 Years | 0 (0.0%) | 0 (0.0%) |
| 15 Years | 0 (0.0%) | 0 (0.0%) |
| 16 and 17 Years | 12 (50.0%) | 0 (0.0%) |
| 18 to 24 Years | 19 (44.2%) | 30 (39.5%) |
| 25 to 34 Years | 86 (98.9%) | 99 (41.9%) |
| 35 to 44 Years | 40 (25.6%) | 28 (26.9%) |
| 45 to 54 Years | 20 (25.3%) | 81 (65.3%) |
| 55 to 64 Years | 0 (0.0%) | 37 (35.9%) |
| 65 to 74 Years | 12 (42.9%) | 0 (0.0%) |
| 75 Years and over | 0 (0.0%) | 17 (65.4%) |
| Total | 236 (38.8%) | 305 (39.2%) |
Income Above Poverty by Sex and Age in Airport
According to the poverty statistics in Airport, males aged 12 to 14 years and females aged 12 to 14 years are the age groups that are most secure financially, with 100.0% of males and 100.0% of females in these age groups living above the poverty line.
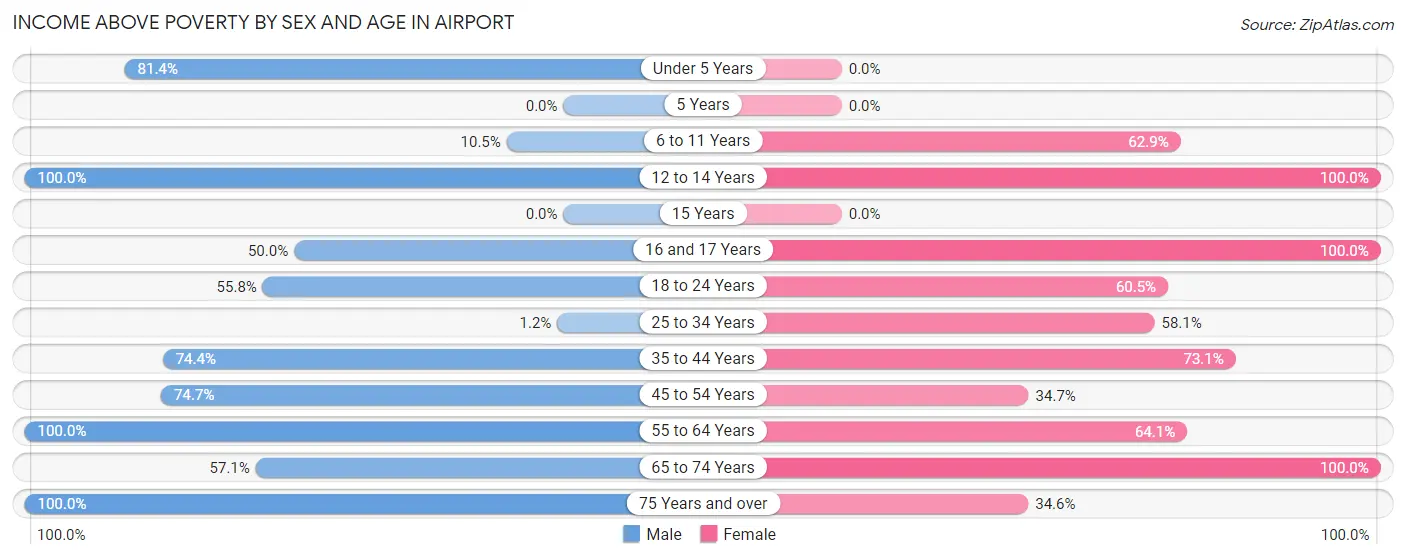
| Age Bracket | Male | Female |
| Under 5 Years | 57 (81.4%) | 0 (0.0%) |
| 5 Years | 0 (0.0%) | 0 (0.0%) |
| 6 to 11 Years | 4 (10.5%) | 22 (62.9%) |
| 12 to 14 Years | 66 (100.0%) | 33 (100.0%) |
| 15 Years | 0 (0.0%) | 0 (0.0%) |
| 16 and 17 Years | 12 (50.0%) | 17 (100.0%) |
| 18 to 24 Years | 24 (55.8%) | 46 (60.5%) |
| 25 to 34 Years | 1 (1.1%) | 137 (58.1%) |
| 35 to 44 Years | 116 (74.4%) | 76 (73.1%) |
| 45 to 54 Years | 59 (74.7%) | 43 (34.7%) |
| 55 to 64 Years | 10 (100.0%) | 66 (64.1%) |
| 65 to 74 Years | 16 (57.1%) | 24 (100.0%) |
| 75 Years and over | 8 (100.0%) | 9 (34.6%) |
| Total | 373 (61.3%) | 473 (60.8%) |
Income Below Poverty Among Married-Couple Families in Airport
The poverty statistics for married-couple families in Airport show that 12.5% or 17 of the total 136 families live below the poverty line. Families with 1 or 2 children have the highest poverty rate of 16.5%, comprising of 17 families. On the other hand, families with no children have the lowest poverty rate of 0.0%, which includes 0 families.
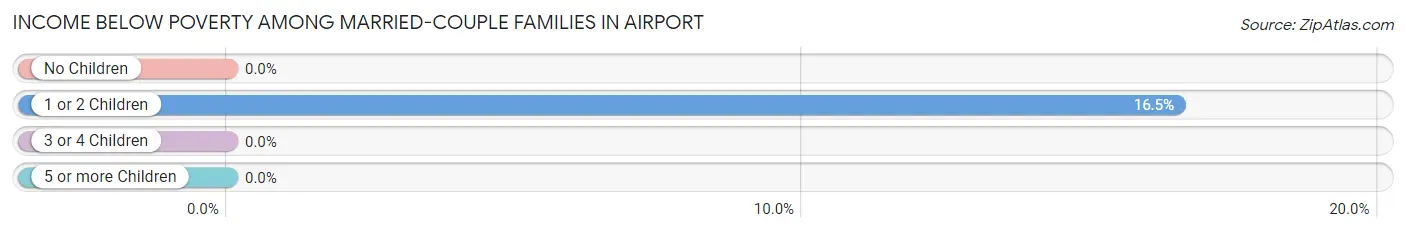
| Children | Above Poverty | Below Poverty |
| No Children | 26 (100.0%) | 0 (0.0%) |
| 1 or 2 Children | 86 (83.5%) | 17 (16.5%) |
| 3 or 4 Children | 7 (100.0%) | 0 (0.0%) |
| 5 or more Children | 0 (0.0%) | 0 (0.0%) |
| Total | 119 (87.5%) | 17 (12.5%) |
Income Below Poverty Among Single-Parent Households in Airport
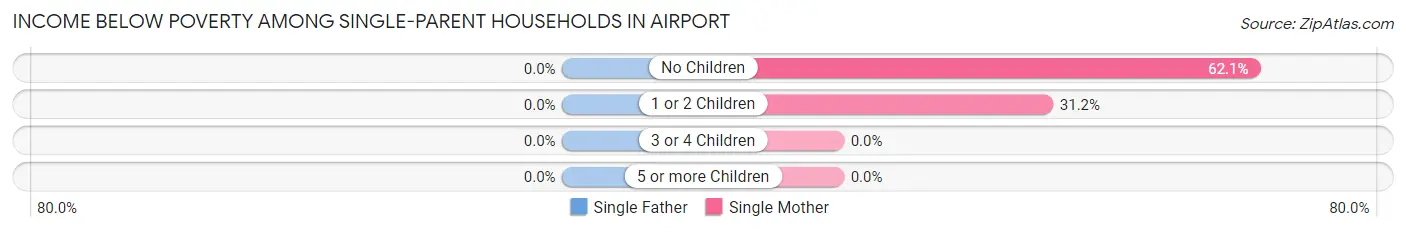
| Children | Single Father | Single Mother |
| No Children | 0 (0.0%) | 36 (62.1%) |
| 1 or 2 Children | 0 (0.0%) | 24 (31.2%) |
| 3 or 4 Children | 0 (0.0%) | 0 (0.0%) |
| 5 or more Children | 0 (0.0%) | 0 (0.0%) |
| Total | 0 (0.0%) | 60 (44.4%) |
Income Below Poverty Among Married-Couple vs Single-Parent Households in Airport
The poverty data for Airport shows that 17 of the married-couple family households (12.5%) and 60 of the single-parent households (42.0%) are living below the poverty level. Within the married-couple family households, those with 1 or 2 children have the highest poverty rate, with 17 households (16.5%) falling below the poverty line. Among the single-parent households, those with no children have the highest poverty rate, with 36 household (54.5%) living below poverty.
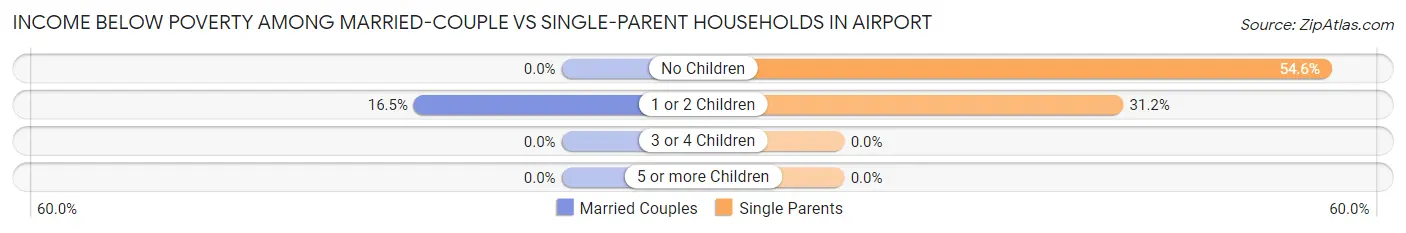
| Children | Married-Couple Families | Single-Parent Households |
| No Children | 0 (0.0%) | 36 (54.5%) |
| 1 or 2 Children | 17 (16.5%) | 24 (31.2%) |
| 3 or 4 Children | 0 (0.0%) | 0 (0.0%) |
| 5 or more Children | 0 (0.0%) | 0 (0.0%) |
| Total | 17 (12.5%) | 60 (42.0%) |
Race in Airport
The most populous races in Airport are White / Caucasian (769 | 55.4%), Hispanic or Latino (727 | 52.4%), and Two or more Races (281 | 20.3%).
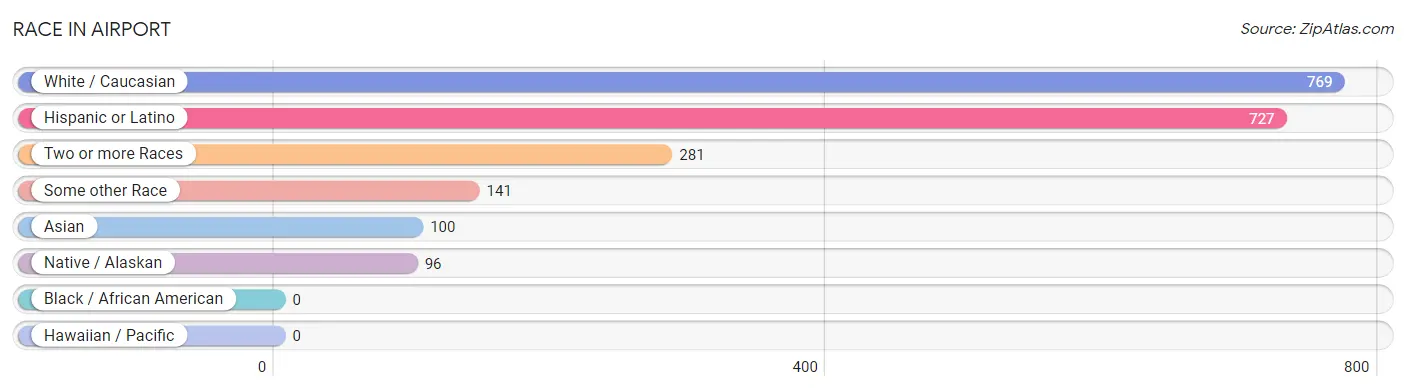
| Race | # Population | % Population |
| Asian | 100 | 7.2% |
| Black / African American | 0 | 0.0% |
| Hawaiian / Pacific | 0 | 0.0% |
| Hispanic or Latino | 727 | 52.4% |
| Native / Alaskan | 96 | 6.9% |
| White / Caucasian | 769 | 55.4% |
| Two or more Races | 281 | 20.3% |
| Some other Race | 141 | 10.2% |
| Total | 1,387 | 100.0% |
Ancestry in Airport
The most populous ancestries reported in Airport are Mexican (727 | 52.4%), Irish (129 | 9.3%), American (106 | 7.6%), Italian (97 | 7.0%), and Filipino (49 | 3.5%), together accounting for 79.9% of all Airport residents.
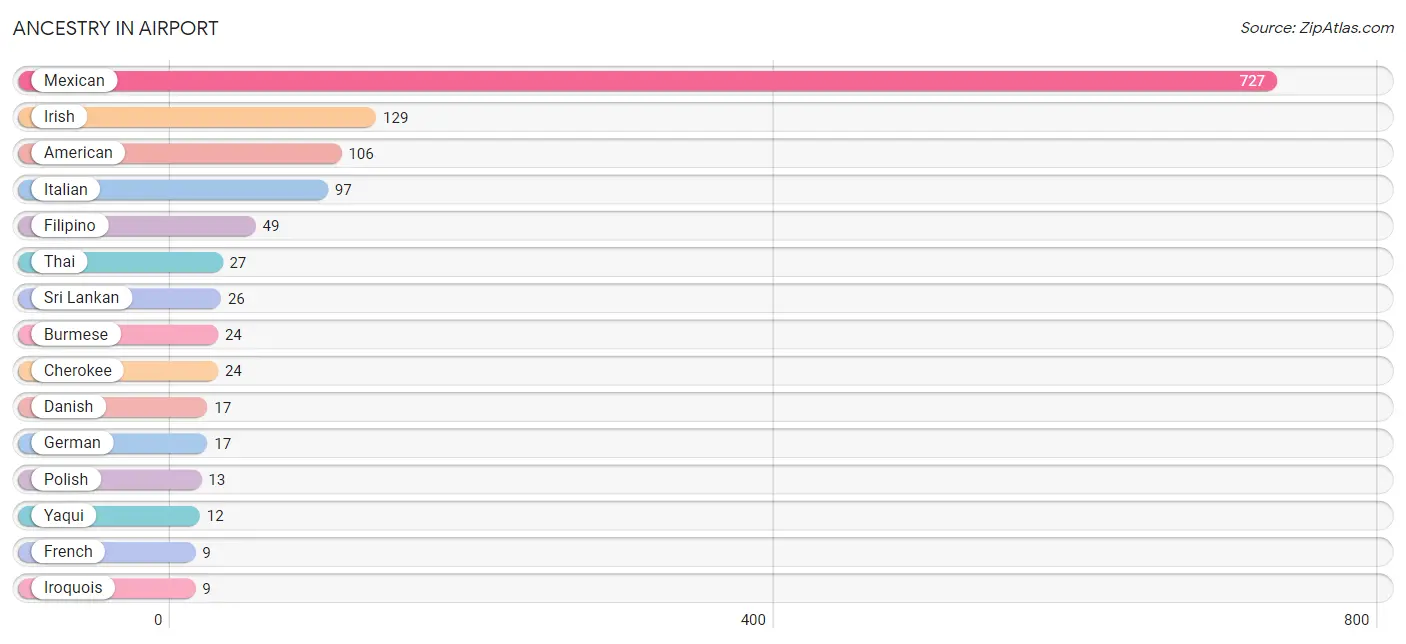
| Ancestry | # Population | % Population |
| American | 106 | 7.6% |
| Burmese | 24 | 1.7% |
| Cherokee | 24 | 1.7% |
| Danish | 17 | 1.2% |
| Dutch | 8 | 0.6% |
| Filipino | 49 | 3.5% |
| French | 9 | 0.6% |
| German | 17 | 1.2% |
| Irish | 129 | 9.3% |
| Iroquois | 9 | 0.6% |
| Italian | 97 | 7.0% |
| Mexican | 727 | 52.4% |
| Polish | 13 | 0.9% |
| Sri Lankan | 26 | 1.9% |
| Thai | 27 | 1.9% |
| Yaqui | 12 | 0.9% | View All 16 Rows |
Immigrants in Airport
The most numerous immigrant groups reported in Airport came from Central America (299 | 21.6%), Latin America (299 | 21.6%), Mexico (299 | 21.6%), Asia (97 | 7.0%), and Eastern Asia (47 | 3.4%), together accounting for 75.1% of all Airport residents.
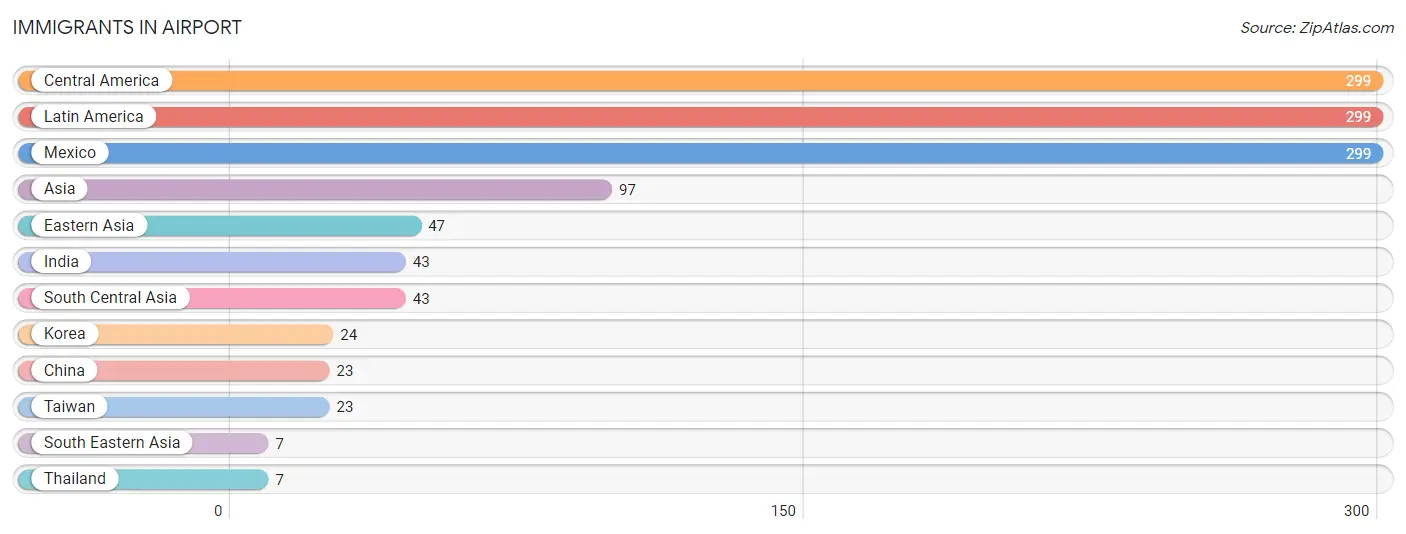
| Immigration Origin | # Population | % Population |
| Asia | 97 | 7.0% |
| Central America | 299 | 21.6% |
| China | 23 | 1.7% |
| Eastern Asia | 47 | 3.4% |
| India | 43 | 3.1% |
| Korea | 24 | 1.7% |
| Latin America | 299 | 21.6% |
| Mexico | 299 | 21.6% |
| South Central Asia | 43 | 3.1% |
| South Eastern Asia | 7 | 0.5% |
| Taiwan | 23 | 1.7% |
| Thailand | 7 | 0.5% | View All 12 Rows |
Sex and Age in Airport
Sex and Age in Airport
The most populous age groups in Airport are 40 to 44 Years (126 | 20.7%) for men and 25 to 29 Years (157 | 20.2%) for women.
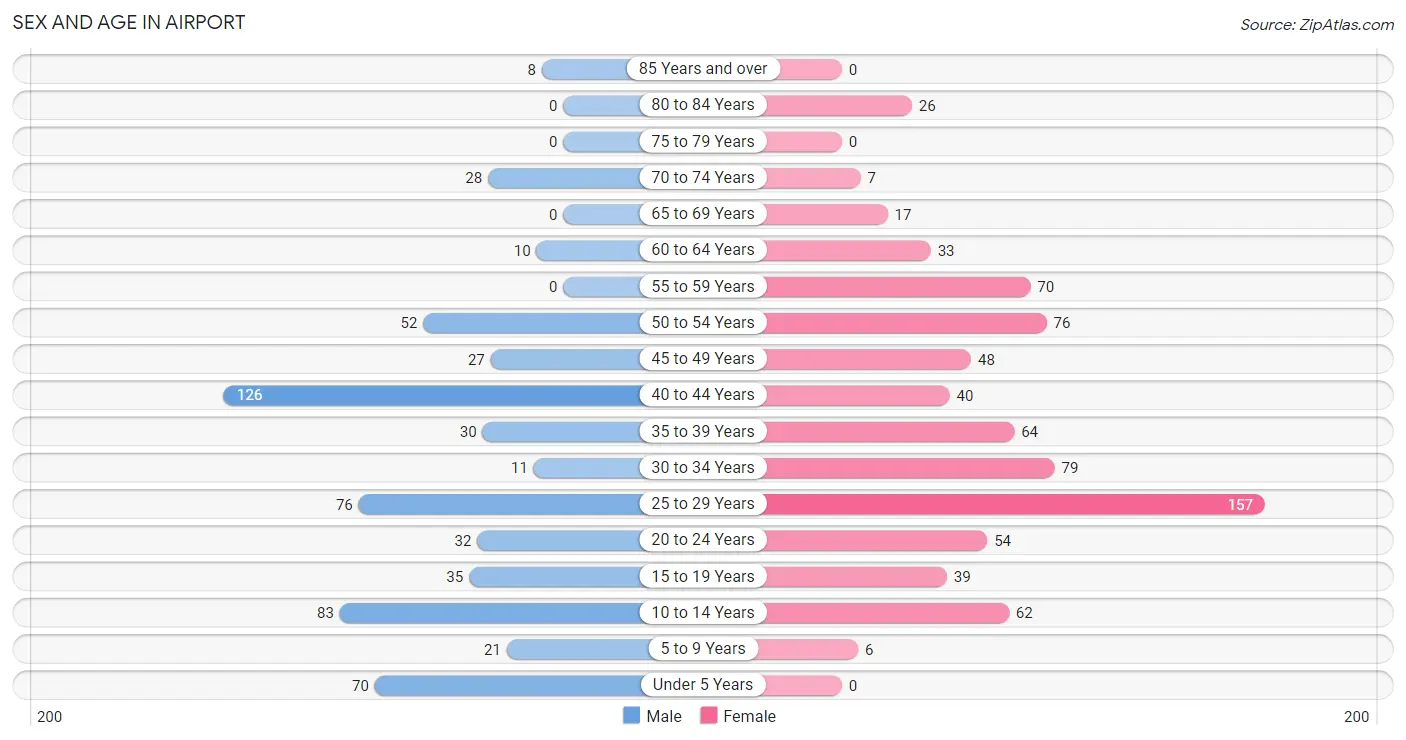
| Age Bracket | Male | Female |
| Under 5 Years | 70 (11.5%) | 0 (0.0%) |
| 5 to 9 Years | 21 (3.5%) | 6 (0.8%) |
| 10 to 14 Years | 83 (13.6%) | 62 (8.0%) |
| 15 to 19 Years | 35 (5.8%) | 39 (5.0%) |
| 20 to 24 Years | 32 (5.2%) | 54 (6.9%) |
| 25 to 29 Years | 76 (12.5%) | 157 (20.2%) |
| 30 to 34 Years | 11 (1.8%) | 79 (10.2%) |
| 35 to 39 Years | 30 (4.9%) | 64 (8.2%) |
| 40 to 44 Years | 126 (20.7%) | 40 (5.1%) |
| 45 to 49 Years | 27 (4.4%) | 48 (6.2%) |
| 50 to 54 Years | 52 (8.5%) | 76 (9.8%) |
| 55 to 59 Years | 0 (0.0%) | 70 (9.0%) |
| 60 to 64 Years | 10 (1.6%) | 33 (4.2%) |
| 65 to 69 Years | 0 (0.0%) | 17 (2.2%) |
| 70 to 74 Years | 28 (4.6%) | 7 (0.9%) |
| 75 to 79 Years | 0 (0.0%) | 0 (0.0%) |
| 80 to 84 Years | 0 (0.0%) | 26 (3.3%) |
| 85 Years and over | 8 (1.3%) | 0 (0.0%) |
| Total | 609 (100.0%) | 778 (100.0%) |
Families and Households in Airport
Median Family Size in Airport
The median family size in Airport is 4.23 persons per family, with single female/mother families (135 | 48.4%) accounting for the largest median family size of 4.7 persons per family. On the other hand, single male/father families (8 | 2.9%) represent the smallest median family size with 2.13 persons per family.
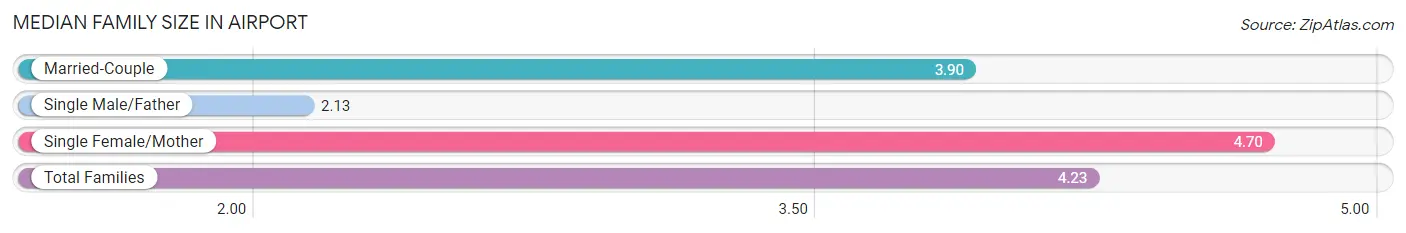
| Family Type | # Families | Family Size |
| Married-Couple | 136 (48.7%) | 3.90 |
| Single Male/Father | 8 (2.9%) | 2.13 |
| Single Female/Mother | 135 (48.4%) | 4.70 |
| Total Families | 279 (100.0%) | 4.23 |
Median Household Size in Airport
The median household size in Airport is 3.53 persons per household, with single female/mother households (135 | 34.4%) accounting for the largest median household size of 4.7 persons per household. non-family households (114 | 29.0%) represent the smallest median household size with 1.70 persons per household.
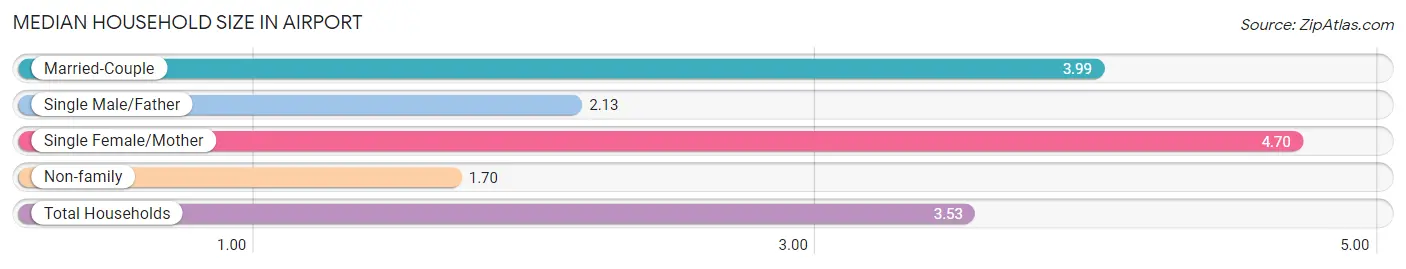
| Household Type | # Households | Household Size |
| Married-Couple | 136 (34.6%) | 3.99 |
| Single Male/Father | 8 (2.0%) | 2.13 |
| Single Female/Mother | 135 (34.4%) | 4.70 |
| Non-family | 114 (29.0%) | 1.70 |
| Total Households | 393 (100.0%) | 3.53 |
Household Size by Marriage Status in Airport
Out of a total of 393 households in Airport, 279 (71.0%) are family households, while 114 (29.0%) are nonfamily households. The most numerous type of family households are 2-person households, comprising 71, and the most common type of nonfamily households are 1-person households, comprising 70.
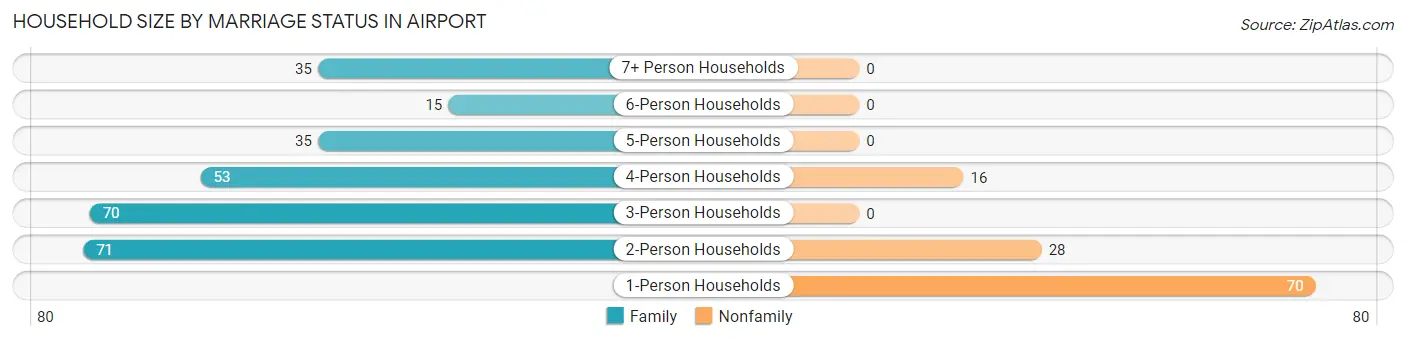
| Household Size | Family Households | Nonfamily Households |
| 1-Person Households | - | 70 (17.8%) |
| 2-Person Households | 71 (18.1%) | 28 (7.1%) |
| 3-Person Households | 70 (17.8%) | 0 (0.0%) |
| 4-Person Households | 53 (13.5%) | 16 (4.1%) |
| 5-Person Households | 35 (8.9%) | 0 (0.0%) |
| 6-Person Households | 15 (3.8%) | 0 (0.0%) |
| 7+ Person Households | 35 (8.9%) | 0 (0.0%) |
| Total | 279 (71.0%) | 114 (29.0%) |
Female Fertility in Airport
Fertility by Age in Airport
Average fertility rate in Airport is 143.0 births per 1,000 women. Women in the age bracket of 20 to 34 years have the highest fertility rate with 159.0 births per 1,000 women. Women in the age bracket of 20 to 34 years acount for 66.7% of all women with births.
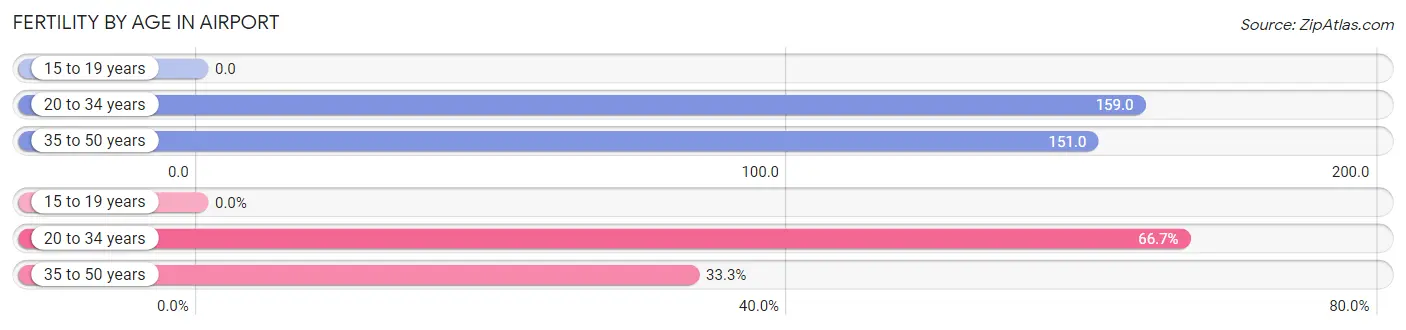
| Age Bracket | Women with Births | Births / 1,000 Women |
| 15 to 19 years | 0 (0.0%) | 0.0 |
| 20 to 34 years | 46 (66.7%) | 159.0 |
| 35 to 50 years | 23 (33.3%) | 151.0 |
| Total | 69 (100.0%) | 143.0 |
Fertility by Age by Marriage Status in Airport
39.1% of women with births (69) in Airport are married. The highest percentage of unmarried women with births falls into 20 to 34 years age bracket with 91.3% of them unmarried at the time of birth, while the lowest percentage of unmarried women with births belong to 35 to 50 years age bracket with 0.0% of them unmarried.
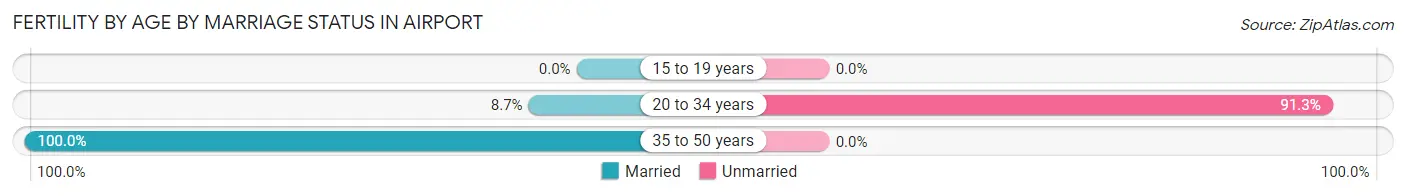
| Age Bracket | Married | Unmarried |
| 15 to 19 years | 0 (0.0%) | 0 (0.0%) |
| 20 to 34 years | 4 (8.7%) | 42 (91.3%) |
| 35 to 50 years | 23 (100.0%) | 0 (0.0%) |
| Total | 27 (39.1%) | 42 (60.9%) |
Fertility by Education in Airport
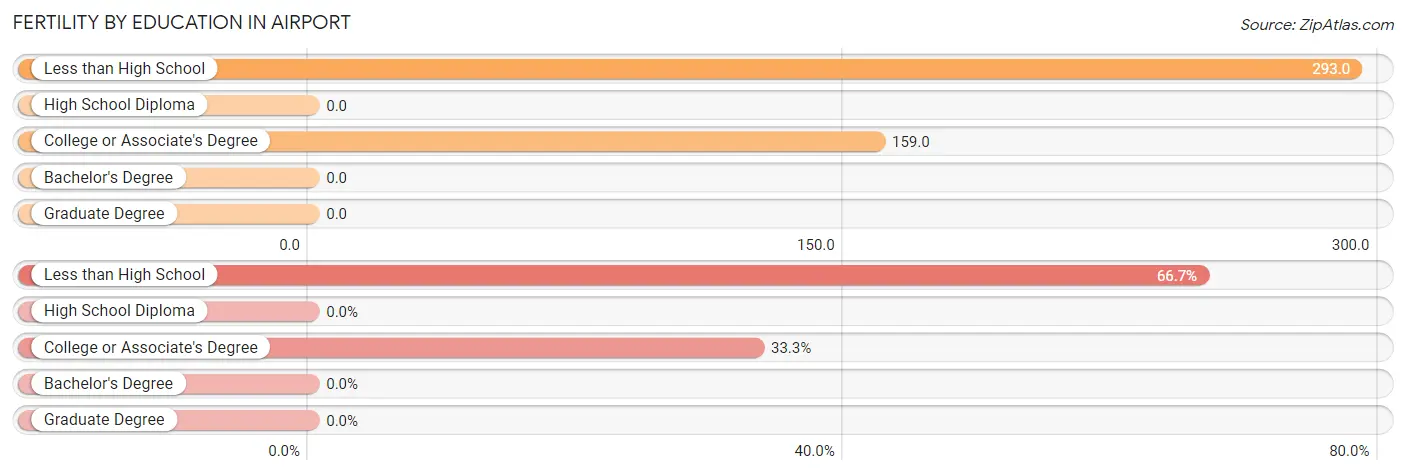
| Educational Attainment | Women with Births | Births / 1,000 Women |
| Less than High School | 46 (66.7%) | 293.0 |
| High School Diploma | 0 (0.0%) | 0.0 |
| College or Associate's Degree | 23 (33.3%) | 159.0 |
| Bachelor's Degree | 0 (0.0%) | 0.0 |
| Graduate Degree | 0 (0.0%) | 0.0 |
| Total | 69 (100.0%) | 143.0 |
Fertility by Education by Marriage Status in Airport
60.9% of women with births in Airport are unmarried. Women with the educational attainment of college or associate's degree are most likely to be married with 100.0% of them married at childbirth, while women with the educational attainment of less than high school are least likely to be married with 91.3% of them unmarried at childbirth.
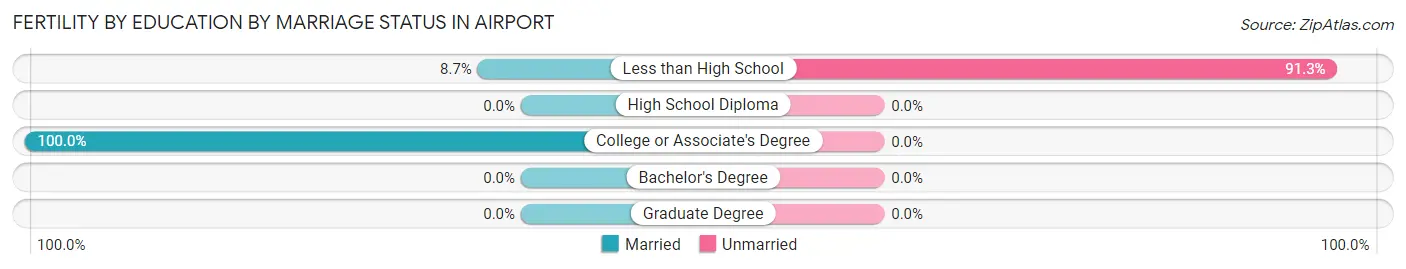
| Educational Attainment | Married | Unmarried |
| Less than High School | 4 (8.7%) | 42 (91.3%) |
| High School Diploma | 0 (0.0%) | 0 (0.0%) |
| College or Associate's Degree | 23 (100.0%) | 0 (0.0%) |
| Bachelor's Degree | 0 (0.0%) | 0 (0.0%) |
| Graduate Degree | 0 (0.0%) | 0 (0.0%) |
| Total | 27 (39.1%) | 42 (60.9%) |
Employment Characteristics in Airport
Employment by Class of Employer in Airport
Among the 429 employed individuals in Airport, private company employees (310 | 72.3%), self-employed (not incorporated) (58 | 13.5%), and state government employees (38 | 8.9%) make up the most common classes of employment.
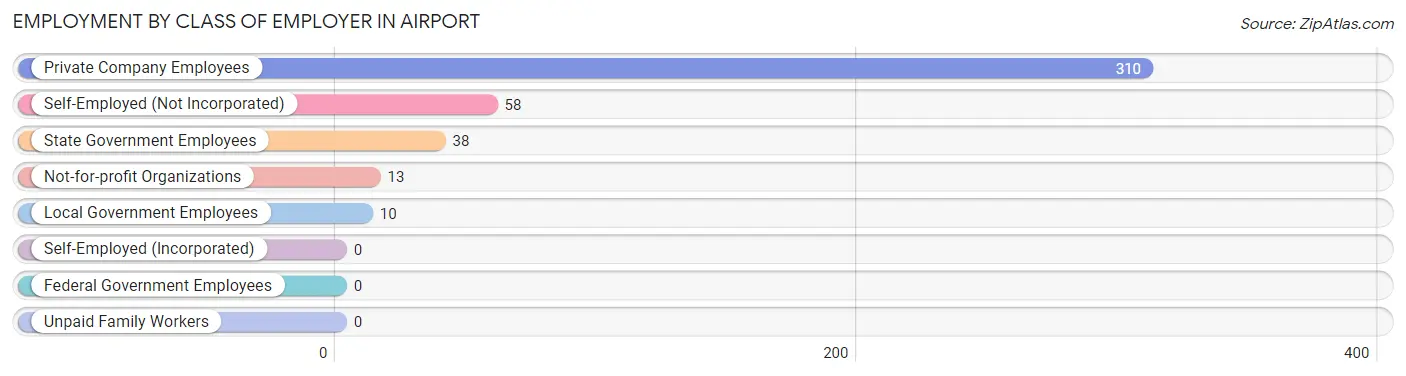
| Employer Class | # Employees | % Employees |
| Private Company Employees | 310 | 72.3% |
| Self-Employed (Incorporated) | 0 | 0.0% |
| Self-Employed (Not Incorporated) | 58 | 13.5% |
| Not-for-profit Organizations | 13 | 3.0% |
| Local Government Employees | 10 | 2.3% |
| State Government Employees | 38 | 8.9% |
| Federal Government Employees | 0 | 0.0% |
| Unpaid Family Workers | 0 | 0.0% |
| Total | 429 | 100.0% |
Employment Status by Age in Airport
According to the labor force statistics for Airport, out of the total population over 16 years of age (1,145), 46.7% or 535 individuals are in the labor force, with 19.8% or 106 of them unemployed. The age group with the highest labor force participation rate is 30 to 34 years, with 88.9% or 80 individuals in the labor force. Within the labor force, the 45 to 54 years age range has the highest percentage of unemployed individuals, with 48.3% or 56 of them being unemployed.
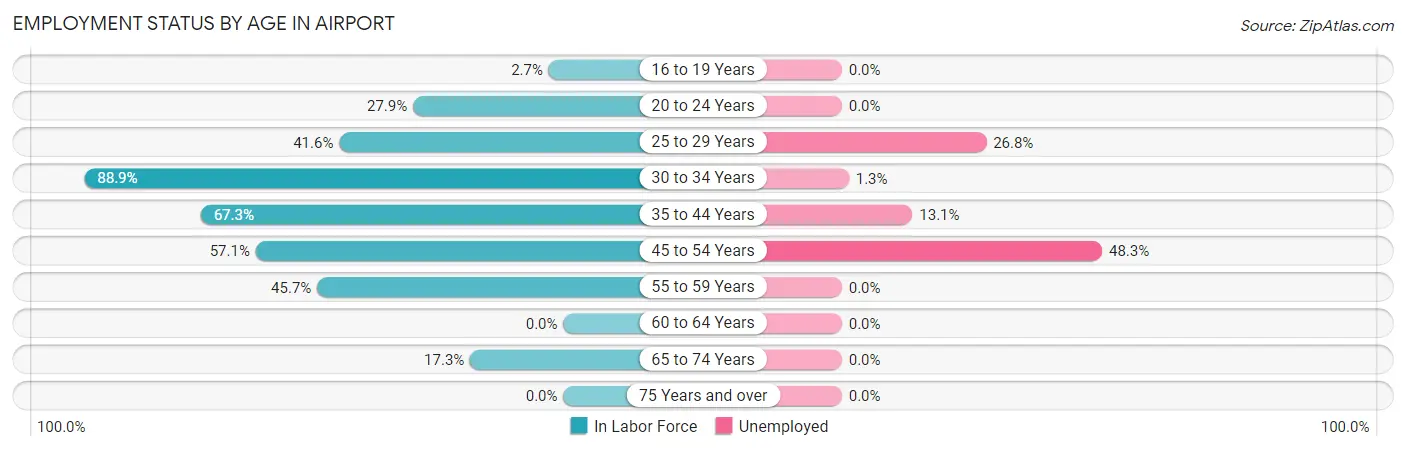
| Age Bracket | In Labor Force | Unemployed |
| 16 to 19 Years | 2 (2.7%) | 0 (0.0%) |
| 20 to 24 Years | 24 (27.9%) | 0 (0.0%) |
| 25 to 29 Years | 97 (41.6%) | 26 (26.8%) |
| 30 to 34 Years | 80 (88.9%) | 1 (1.3%) |
| 35 to 44 Years | 175 (67.3%) | 23 (13.1%) |
| 45 to 54 Years | 116 (57.1%) | 56 (48.3%) |
| 55 to 59 Years | 32 (45.7%) | 0 (0.0%) |
| 60 to 64 Years | 0 (0.0%) | 0 (0.0%) |
| 65 to 74 Years | 9 (17.3%) | 0 (0.0%) |
| 75 Years and over | 0 (0.0%) | 0 (0.0%) |
| Total | 535 (46.7%) | 106 (19.8%) |
Employment Status by Educational Attainment in Airport
According to labor force statistics for Airport, 55.6% of individuals (500) out of the total population between 25 and 64 years of age (899) are in the labor force, with 21.2% or 106 of them being unemployed. The group with the highest labor force participation rate are those with the educational attainment of college / associate degree, with 73.1% or 171 individuals in the labor force. Within the labor force, individuals with college / associate degree education have the highest percentage of unemployment, with 32.7% or 56 of them being unemployed.
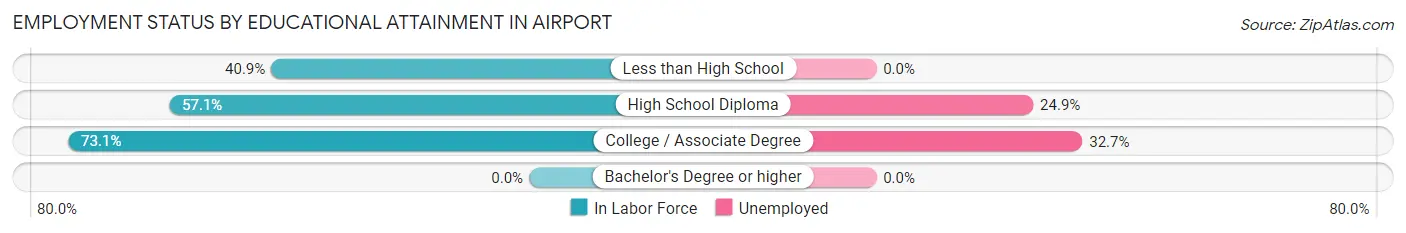
| Educational Attainment | In Labor Force | Unemployed |
| Less than High School | 128 (40.9%) | 0 (0.0%) |
| High School Diploma | 201 (57.1%) | 88 (24.9%) |
| College / Associate Degree | 171 (73.1%) | 77 (32.7%) |
| Bachelor's Degree or higher | 0 (0.0%) | 0 (0.0%) |
| Total | 500 (55.6%) | 191 (21.2%) |
Employment Occupations by Sex in Airport
Management, Business, Science and Arts Occupations
The most common Management, Business, Science and Arts occupations in Airport are Community & Social Service (37 | 8.6%), Arts, Media & Entertainment (37 | 8.6%), Management (25 | 5.8%), and Health Diagnosing & Treating (7 | 1.6%).
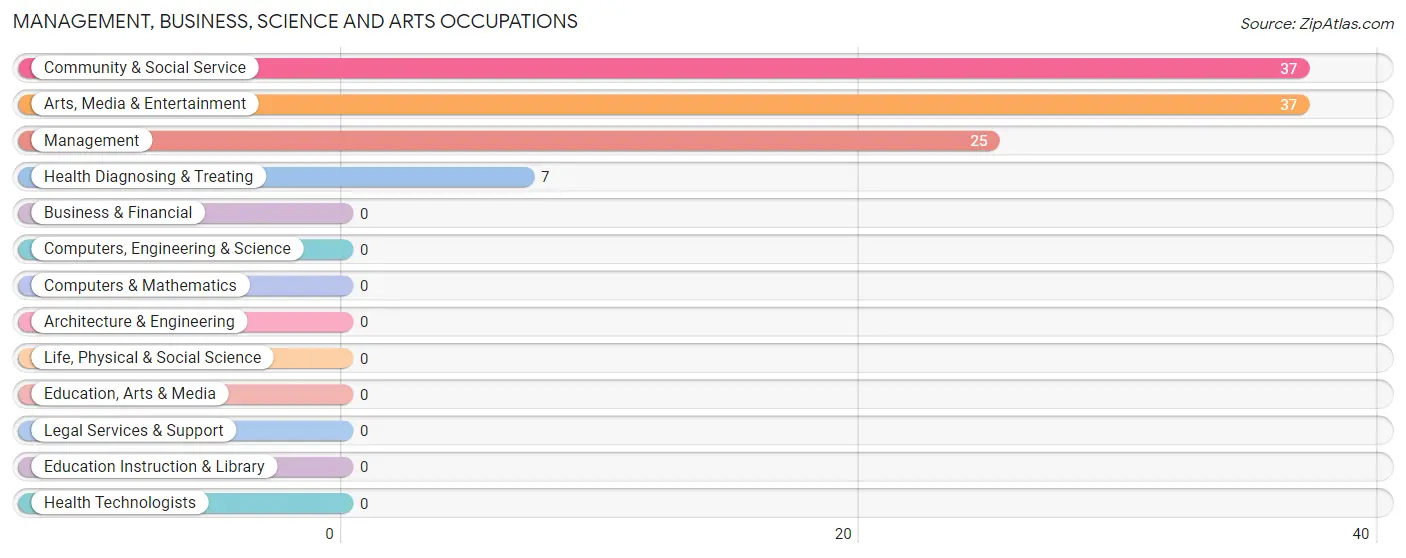
Management, Business, Science and Arts Occupations by Sex
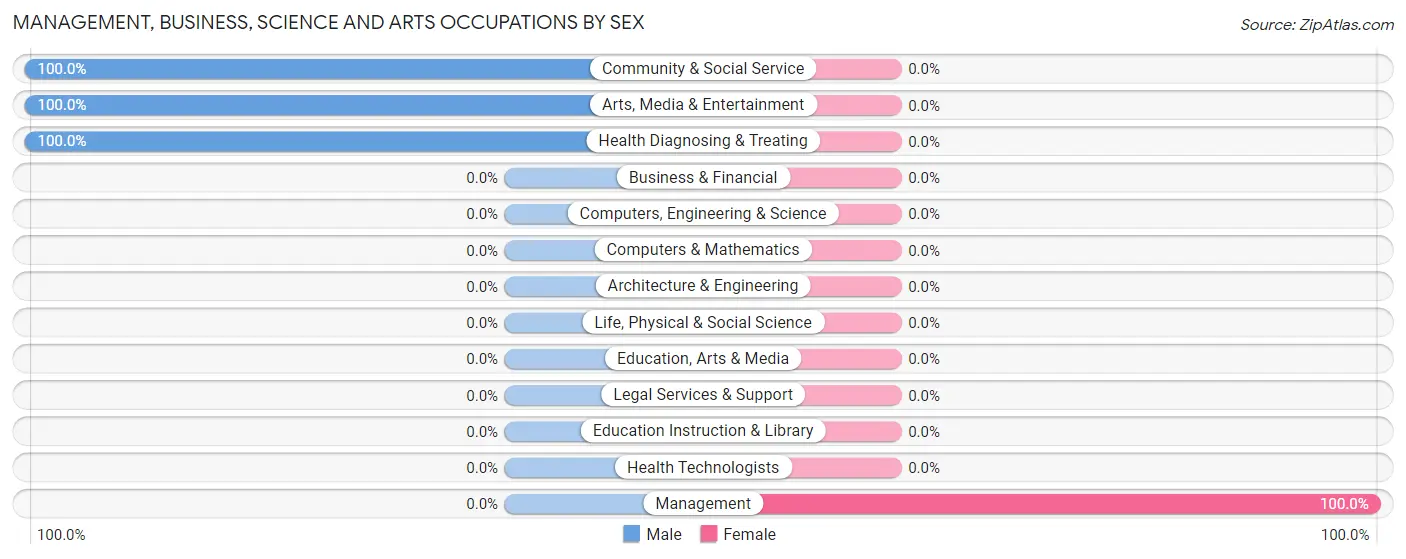
| Occupation | Male | Female |
| Management | 0 (0.0%) | 25 (100.0%) |
| Business & Financial | 0 (0.0%) | 0 (0.0%) |
| Computers, Engineering & Science | 0 (0.0%) | 0 (0.0%) |
| Computers & Mathematics | 0 (0.0%) | 0 (0.0%) |
| Architecture & Engineering | 0 (0.0%) | 0 (0.0%) |
| Life, Physical & Social Science | 0 (0.0%) | 0 (0.0%) |
| Community & Social Service | 37 (100.0%) | 0 (0.0%) |
| Education, Arts & Media | 0 (0.0%) | 0 (0.0%) |
| Legal Services & Support | 0 (0.0%) | 0 (0.0%) |
| Education Instruction & Library | 0 (0.0%) | 0 (0.0%) |
| Arts, Media & Entertainment | 37 (100.0%) | 0 (0.0%) |
| Health Diagnosing & Treating | 7 (100.0%) | 0 (0.0%) |
| Health Technologists | 0 (0.0%) | 0 (0.0%) |
| Total (Category) | 44 (63.8%) | 25 (36.2%) |
| Total (Overall) | 184 (42.9%) | 245 (57.1%) |
Services Occupations
The most common Services occupations in Airport are Security & Protection (31 | 7.2%), Law Enforcement (31 | 7.2%), Food Preparation & Serving (31 | 7.2%), Healthcare Support (28 | 6.5%), and Cleaning & Maintenance (22 | 5.1%).
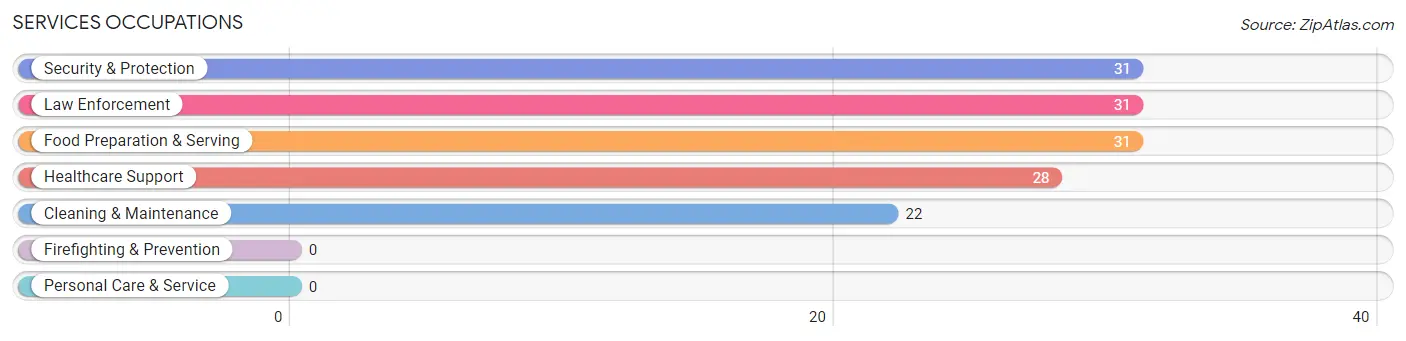
Services Occupations by Sex
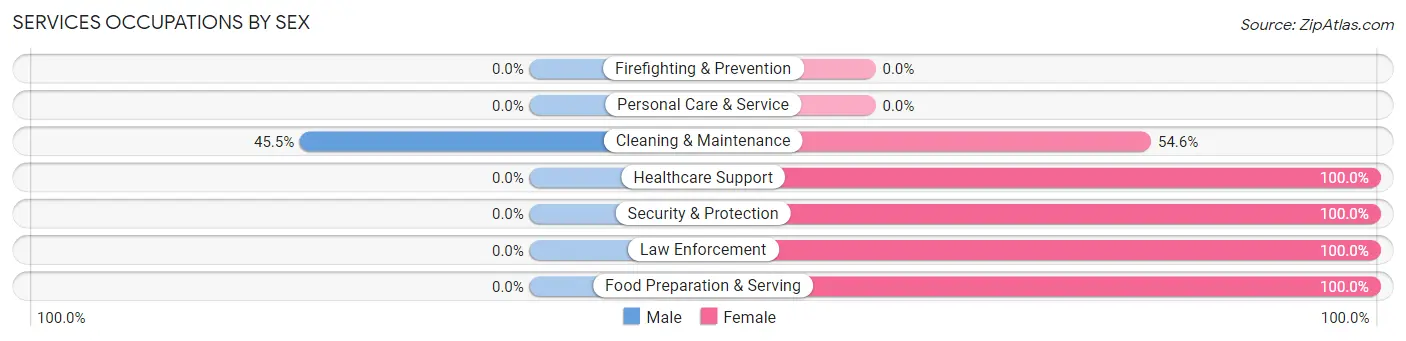
| Occupation | Male | Female |
| Healthcare Support | 0 (0.0%) | 28 (100.0%) |
| Security & Protection | 0 (0.0%) | 31 (100.0%) |
| Firefighting & Prevention | 0 (0.0%) | 0 (0.0%) |
| Law Enforcement | 0 (0.0%) | 31 (100.0%) |
| Food Preparation & Serving | 0 (0.0%) | 31 (100.0%) |
| Cleaning & Maintenance | 10 (45.5%) | 12 (54.5%) |
| Personal Care & Service | 0 (0.0%) | 0 (0.0%) |
| Total (Category) | 10 (8.9%) | 102 (91.1%) |
| Total (Overall) | 184 (42.9%) | 245 (57.1%) |
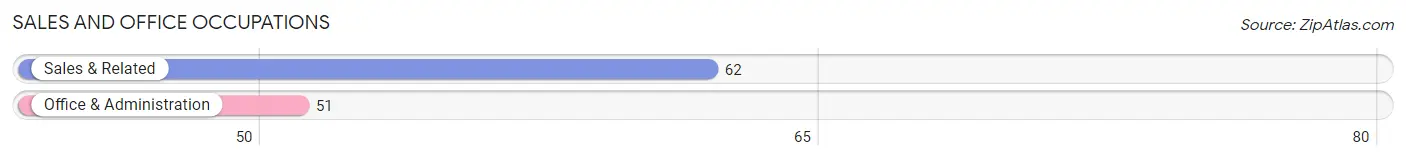
Sales and Office Occupations
The most common Sales and Office occupations in Airport are Sales & Related (62 | 14.4%), and Office & Administration (51 | 11.9%).
Sales and Office Occupations by Sex
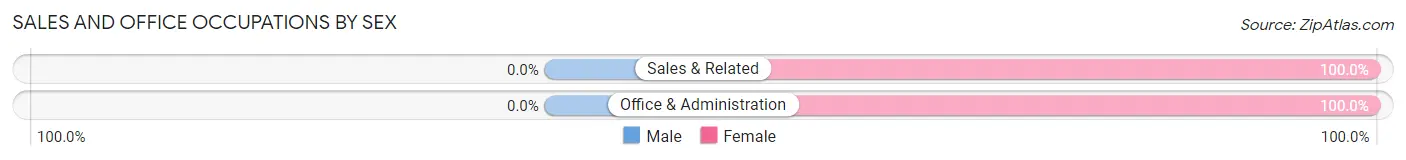
| Occupation | Male | Female |
| Sales & Related | 0 (0.0%) | 62 (100.0%) |
| Office & Administration | 0 (0.0%) | 51 (100.0%) |
| Total (Category) | 0 (0.0%) | 113 (100.0%) |
| Total (Overall) | 184 (42.9%) | 245 (57.1%) |
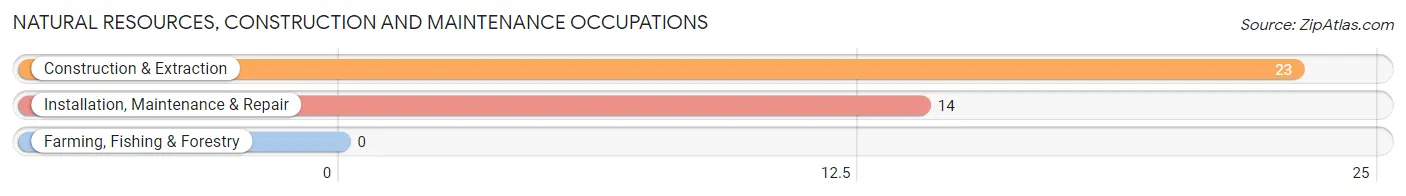
Natural Resources, Construction and Maintenance Occupations
The most common Natural Resources, Construction and Maintenance occupations in Airport are Construction & Extraction (23 | 5.4%), and Installation, Maintenance & Repair (14 | 3.3%).
Natural Resources, Construction and Maintenance Occupations by Sex

| Occupation | Male | Female |
| Farming, Fishing & Forestry | 0 (0.0%) | 0 (0.0%) |
| Construction & Extraction | 23 (100.0%) | 0 (0.0%) |
| Installation, Maintenance & Repair | 14 (100.0%) | 0 (0.0%) |
| Total (Category) | 37 (100.0%) | 0 (0.0%) |
| Total (Overall) | 184 (42.9%) | 245 (57.1%) |
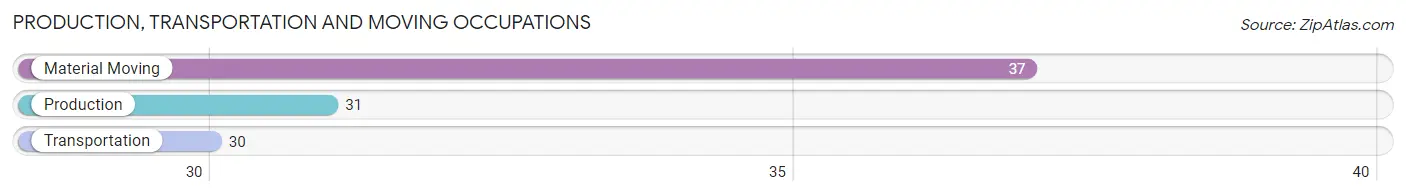
Production, Transportation and Moving Occupations
The most common Production, Transportation and Moving occupations in Airport are Material Moving (37 | 8.6%), Production (31 | 7.2%), and Transportation (30 | 7.0%).
Production, Transportation and Moving Occupations by Sex
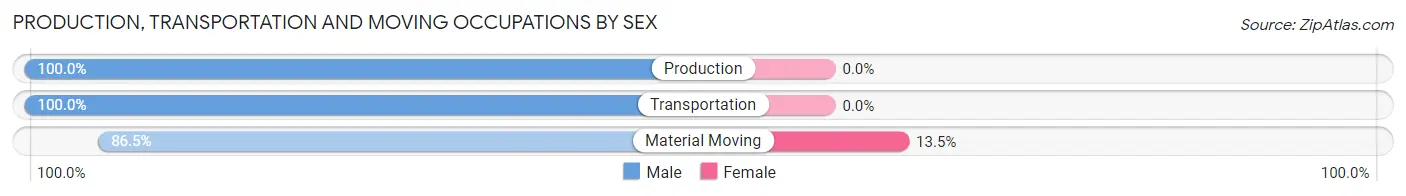
| Occupation | Male | Female |
| Production | 31 (100.0%) | 0 (0.0%) |
| Transportation | 30 (100.0%) | 0 (0.0%) |
| Material Moving | 32 (86.5%) | 5 (13.5%) |
| Total (Category) | 93 (94.9%) | 5 (5.1%) |
| Total (Overall) | 184 (42.9%) | 245 (57.1%) |
Employment Industries by Sex in Airport
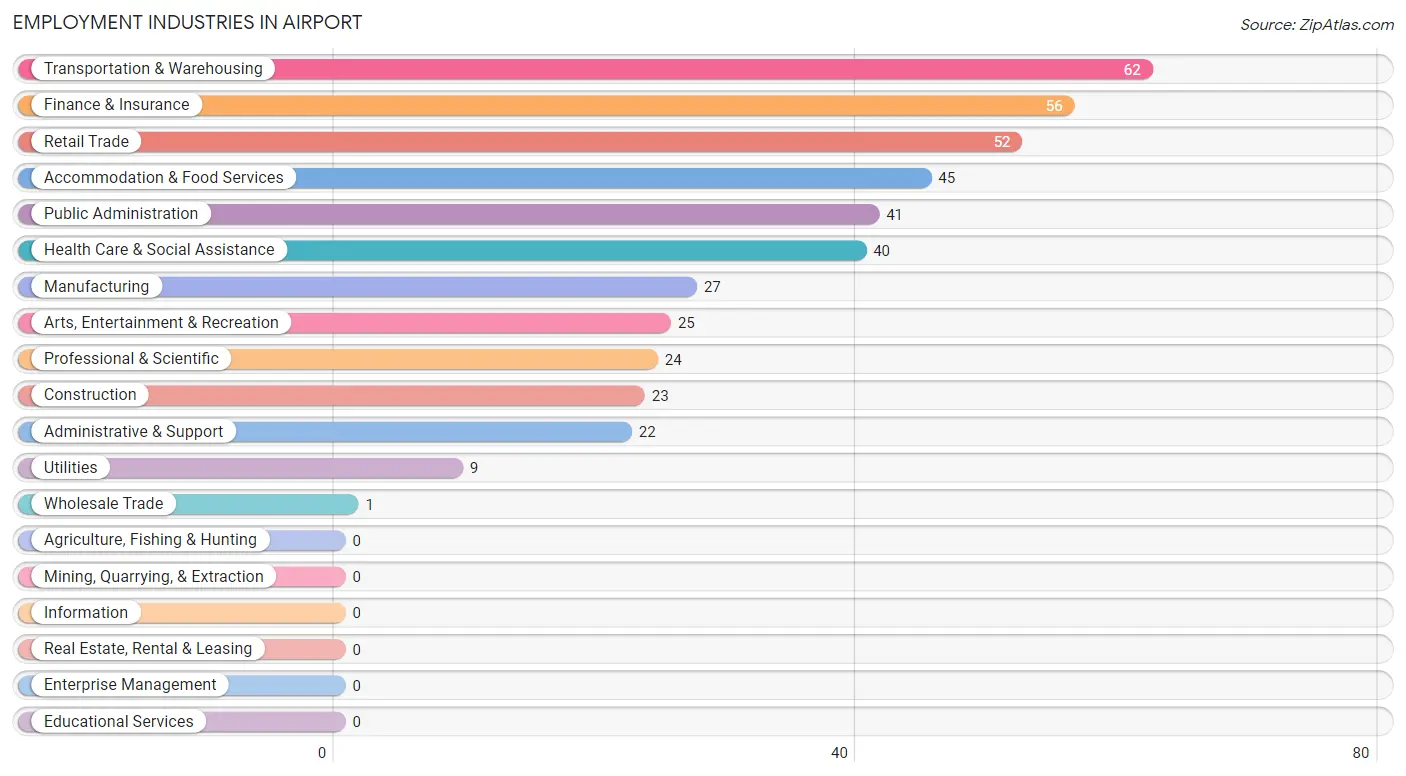
Employment Industries in Airport
The major employment industries in Airport include Transportation & Warehousing (62 | 14.4%), Finance & Insurance (56 | 13.1%), Retail Trade (52 | 12.1%), Accommodation & Food Services (45 | 10.5%), and Public Administration (41 | 9.6%).
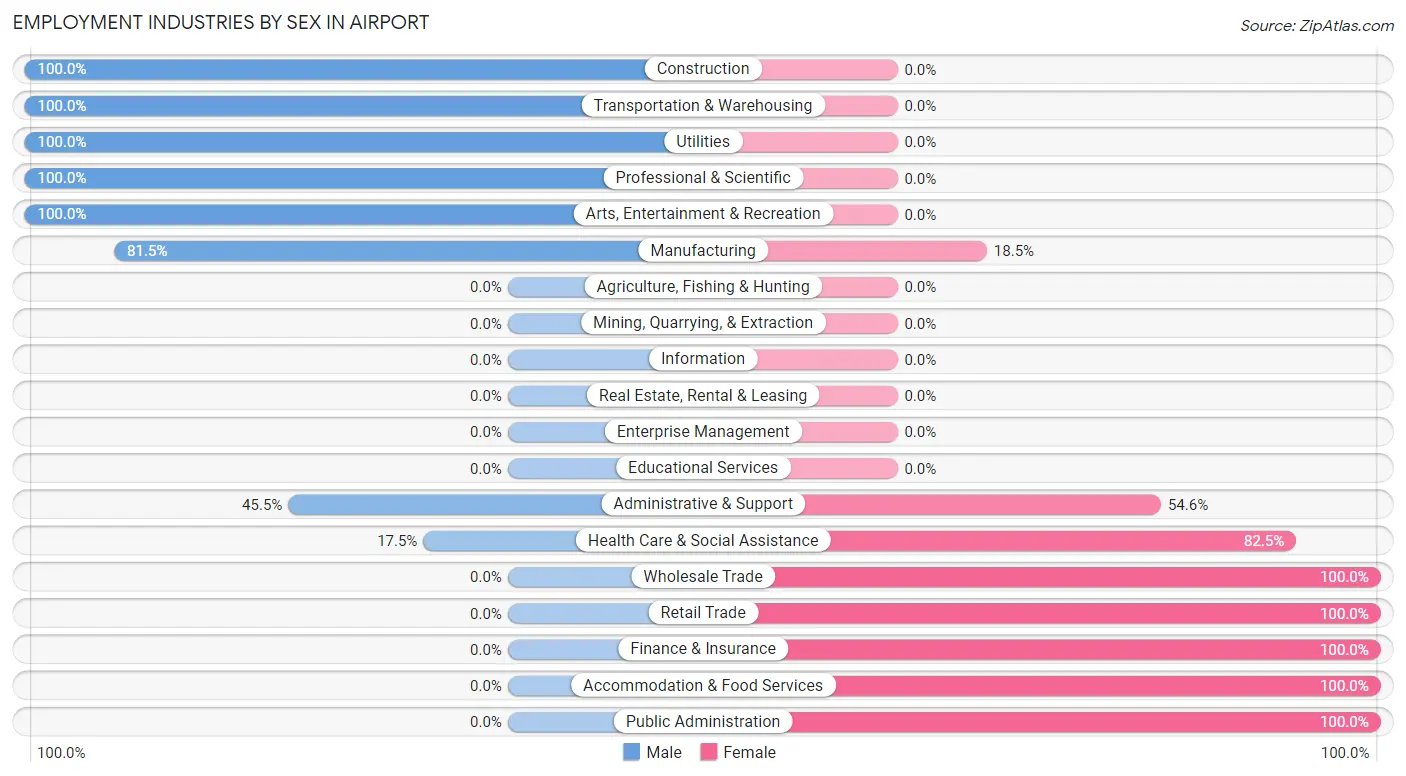
Employment Industries by Sex in Airport
The Airport industries that see more men than women are Construction (100.0%), Transportation & Warehousing (100.0%), and Utilities (100.0%), whereas the industries that tend to have a higher number of women are Wholesale Trade (100.0%), Retail Trade (100.0%), and Finance & Insurance (100.0%).
| Industry | Male | Female |
| Agriculture, Fishing & Hunting | 0 (0.0%) | 0 (0.0%) |
| Mining, Quarrying, & Extraction | 0 (0.0%) | 0 (0.0%) |
| Construction | 23 (100.0%) | 0 (0.0%) |
| Manufacturing | 22 (81.5%) | 5 (18.5%) |
| Wholesale Trade | 0 (0.0%) | 1 (100.0%) |
| Retail Trade | 0 (0.0%) | 52 (100.0%) |
| Transportation & Warehousing | 62 (100.0%) | 0 (0.0%) |
| Utilities | 9 (100.0%) | 0 (0.0%) |
| Information | 0 (0.0%) | 0 (0.0%) |
| Finance & Insurance | 0 (0.0%) | 56 (100.0%) |
| Real Estate, Rental & Leasing | 0 (0.0%) | 0 (0.0%) |
| Professional & Scientific | 24 (100.0%) | 0 (0.0%) |
| Enterprise Management | 0 (0.0%) | 0 (0.0%) |
| Administrative & Support | 10 (45.5%) | 12 (54.5%) |
| Educational Services | 0 (0.0%) | 0 (0.0%) |
| Health Care & Social Assistance | 7 (17.5%) | 33 (82.5%) |
| Arts, Entertainment & Recreation | 25 (100.0%) | 0 (0.0%) |
| Accommodation & Food Services | 0 (0.0%) | 45 (100.0%) |
| Public Administration | 0 (0.0%) | 41 (100.0%) |
| Total | 184 (42.9%) | 245 (57.1%) |
Education in Airport
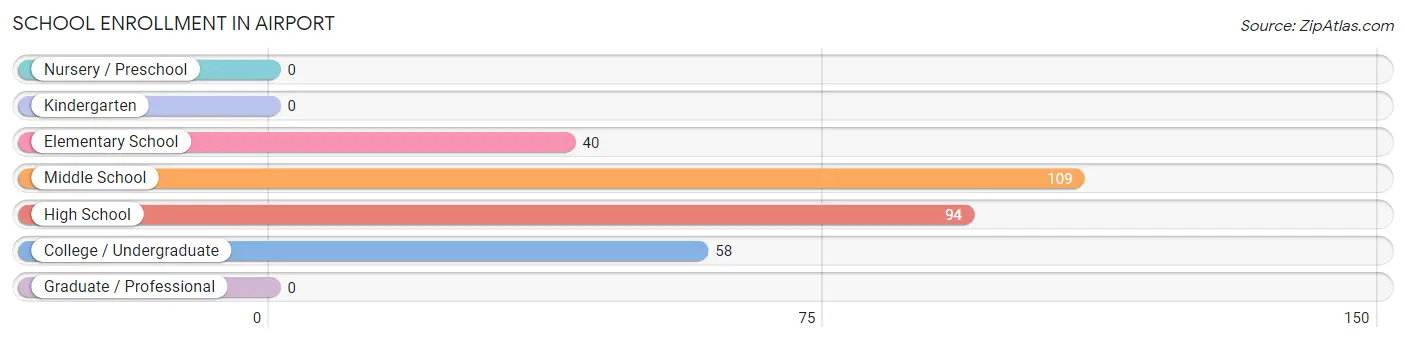
School Enrollment in Airport
The most common levels of schooling among the 301 students in Airport are middle school (109 | 36.2%), high school (94 | 31.2%), and college / undergraduate (58 | 19.3%).
| School Level | # Students | % Students |
| Nursery / Preschool | 0 | 0.0% |
| Kindergarten | 0 | 0.0% |
| Elementary School | 40 | 13.3% |
| Middle School | 109 | 36.2% |
| High School | 94 | 31.2% |
| College / Undergraduate | 58 | 19.3% |
| Graduate / Professional | 0 | 0.0% |
| Total | 301 | 100.0% |
School Enrollment by Age by Funding Source in Airport
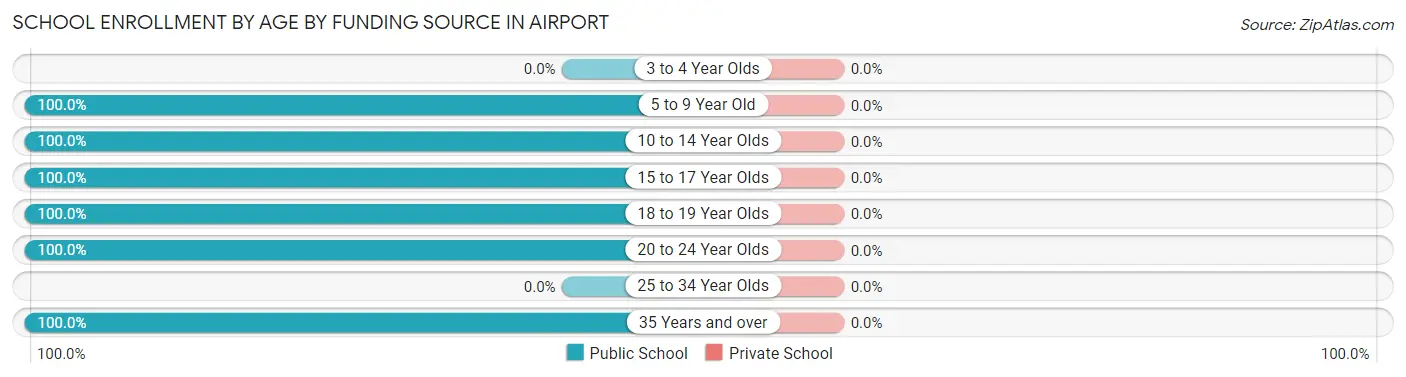
| Age Bracket | Public School | Private School |
| 3 to 4 Year Olds | 0 (0.0%) | 0 (0.0%) |
| 5 to 9 Year Old | 27 (100.0%) | 0 (0.0%) |
| 10 to 14 Year Olds | 145 (100.0%) | 0 (0.0%) |
| 15 to 17 Year Olds | 41 (100.0%) | 0 (0.0%) |
| 18 to 19 Year Olds | 33 (100.0%) | 0 (0.0%) |
| 20 to 24 Year Olds | 19 (100.0%) | 0 (0.0%) |
| 25 to 34 Year Olds | 0 (0.0%) | 0 (0.0%) |
| 35 Years and over | 36 (100.0%) | 0 (0.0%) |
| Total | 301 (100.0%) | 0 (0.0%) |
Educational Attainment by Field of Study in Airport
, and business (7 | 100.0%) are the most common fields of study among 7 individuals in Airport who have obtained a bachelor's degree or higher.
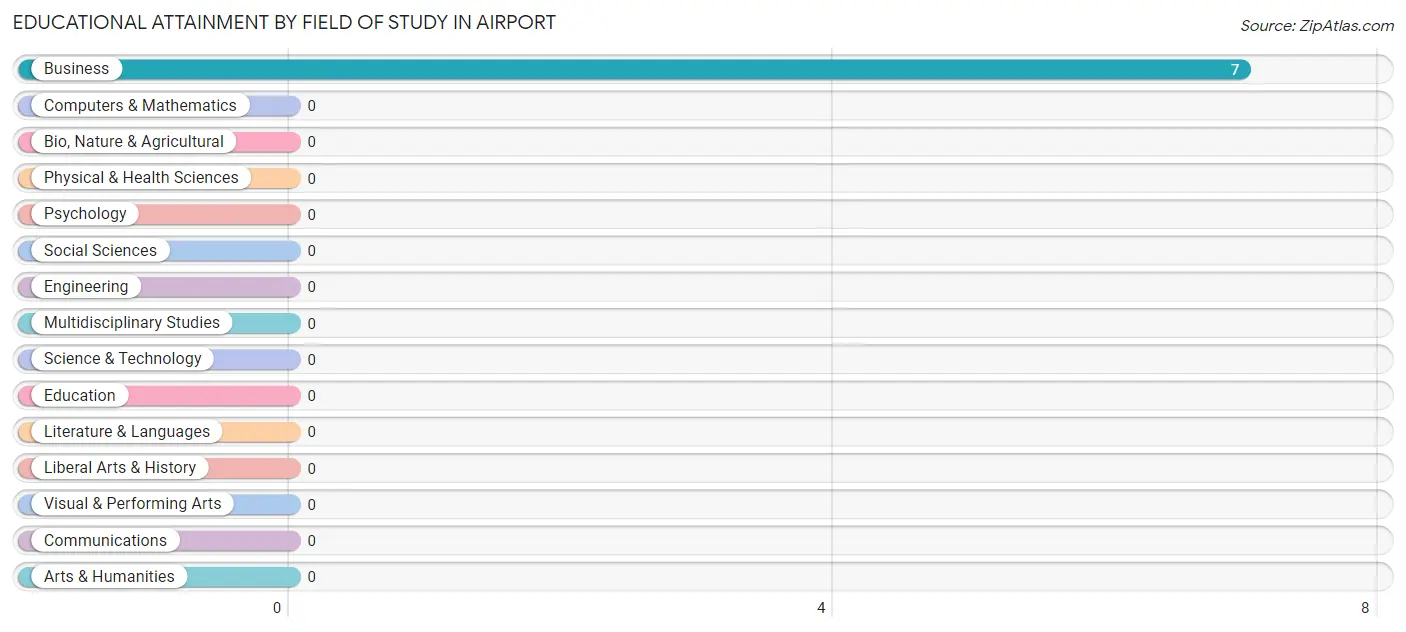
| Field of Study | # Graduates | % Graduates |
| Computers & Mathematics | 0 | 0.0% |
| Bio, Nature & Agricultural | 0 | 0.0% |
| Physical & Health Sciences | 0 | 0.0% |
| Psychology | 0 | 0.0% |
| Social Sciences | 0 | 0.0% |
| Engineering | 0 | 0.0% |
| Multidisciplinary Studies | 0 | 0.0% |
| Science & Technology | 0 | 0.0% |
| Business | 7 | 100.0% |
| Education | 0 | 0.0% |
| Literature & Languages | 0 | 0.0% |
| Liberal Arts & History | 0 | 0.0% |
| Visual & Performing Arts | 0 | 0.0% |
| Communications | 0 | 0.0% |
| Arts & Humanities | 0 | 0.0% |
| Total | 7 | 100.0% |
Transportation & Commute in Airport
Vehicle Availability by Sex in Airport
The most prevalent vehicle ownership categories in Airport are males with 4 vehicles (79, accounting for 42.9%) and females with 4 vehicles (109, making up 32.2%).
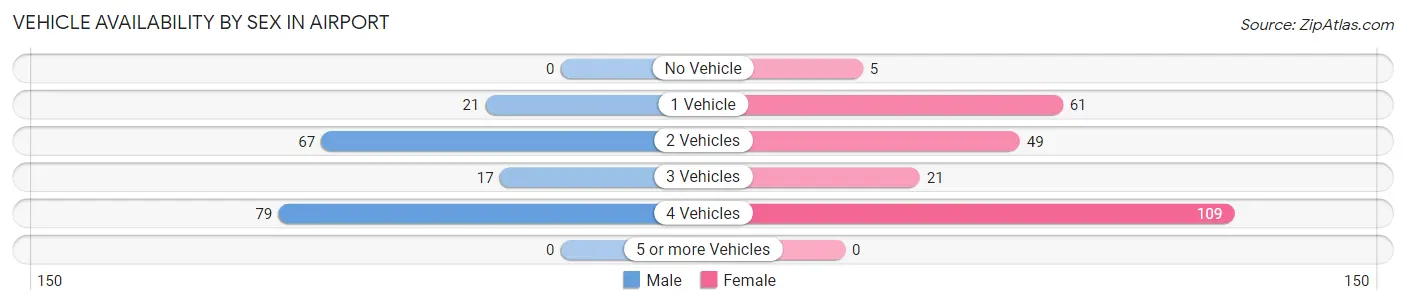
| Vehicles Available | Male | Female |
| No Vehicle | 0 (0.0%) | 5 (2.0%) |
| 1 Vehicle | 21 (11.4%) | 61 (24.9%) |
| 2 Vehicles | 67 (36.4%) | 49 (20.0%) |
| 3 Vehicles | 17 (9.2%) | 21 (8.6%) |
| 4 Vehicles | 79 (42.9%) | 109 (44.5%) |
| 5 or more Vehicles | 0 (0.0%) | 0 (0.0%) |
| Total | 184 (100.0%) | 245 (100.0%) |
Commute Time in Airport
The most frequently occuring commute durations in Airport are 10 to 14 minutes (128 commuters, 30.6%), 90 or more minutes (61 commuters, 14.6%), and 20 to 24 minutes (56 commuters, 13.4%).
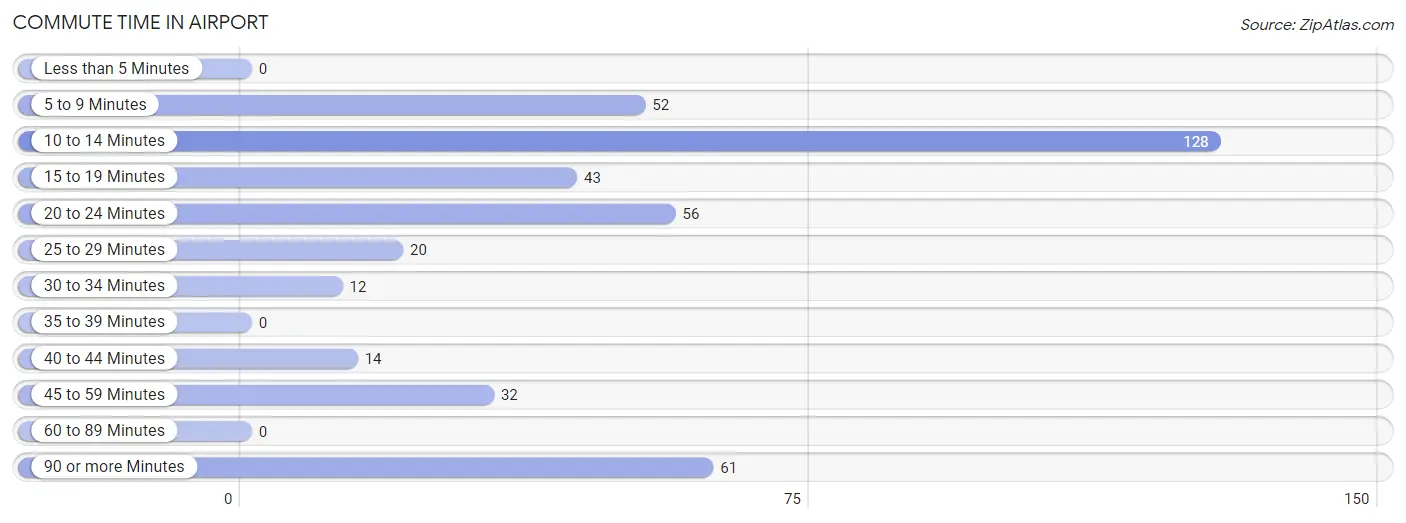
| Commute Time | # Commuters | % Commuters |
| Less than 5 Minutes | 0 | 0.0% |
| 5 to 9 Minutes | 52 | 12.4% |
| 10 to 14 Minutes | 128 | 30.6% |
| 15 to 19 Minutes | 43 | 10.3% |
| 20 to 24 Minutes | 56 | 13.4% |
| 25 to 29 Minutes | 20 | 4.8% |
| 30 to 34 Minutes | 12 | 2.9% |
| 35 to 39 Minutes | 0 | 0.0% |
| 40 to 44 Minutes | 14 | 3.4% |
| 45 to 59 Minutes | 32 | 7.7% |
| 60 to 89 Minutes | 0 | 0.0% |
| 90 or more Minutes | 61 | 14.6% |
Commute Time by Sex in Airport
The most common commute times in Airport are 10 to 14 minutes (56 commuters, 30.4%) for males and 10 to 14 minutes (72 commuters, 30.8%) for females.
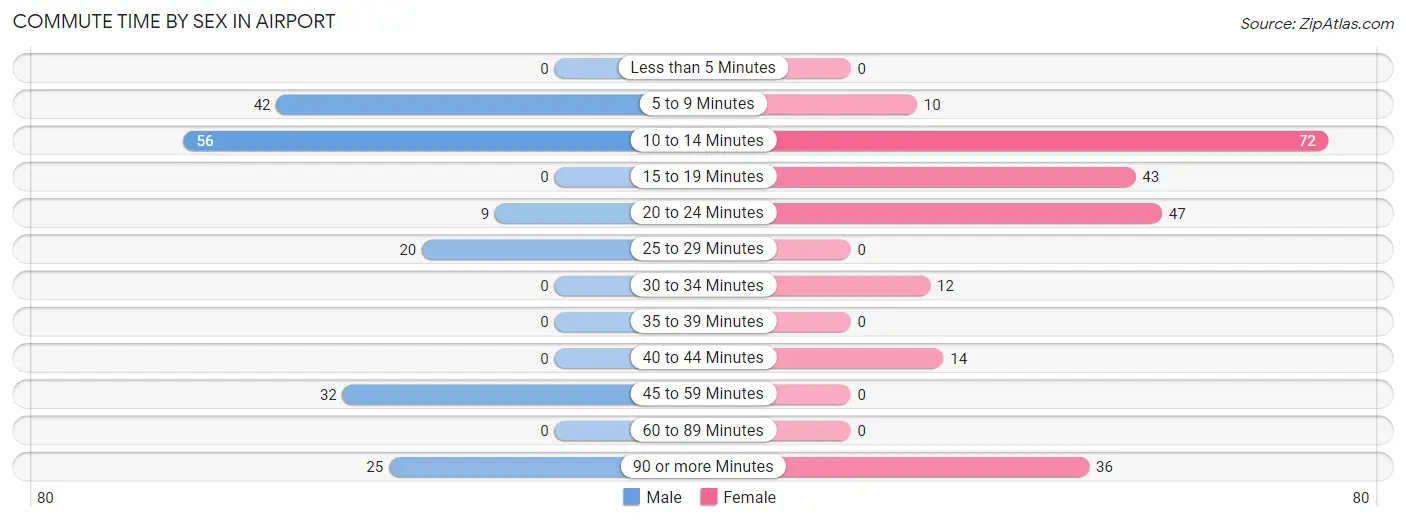
| Commute Time | Male | Female |
| Less than 5 Minutes | 0 (0.0%) | 0 (0.0%) |
| 5 to 9 Minutes | 42 (22.8%) | 10 (4.3%) |
| 10 to 14 Minutes | 56 (30.4%) | 72 (30.8%) |
| 15 to 19 Minutes | 0 (0.0%) | 43 (18.4%) |
| 20 to 24 Minutes | 9 (4.9%) | 47 (20.1%) |
| 25 to 29 Minutes | 20 (10.9%) | 0 (0.0%) |
| 30 to 34 Minutes | 0 (0.0%) | 12 (5.1%) |
| 35 to 39 Minutes | 0 (0.0%) | 0 (0.0%) |
| 40 to 44 Minutes | 0 (0.0%) | 14 (6.0%) |
| 45 to 59 Minutes | 32 (17.4%) | 0 (0.0%) |
| 60 to 89 Minutes | 0 (0.0%) | 0 (0.0%) |
| 90 or more Minutes | 25 (13.6%) | 36 (15.4%) |
Time of Departure to Work by Sex in Airport
The most frequent times of departure to work in Airport are 12:00 AM to 4:59 AM (45, 24.5%) for males and 12:00 PM to 3:59 PM (55, 23.5%) for females.
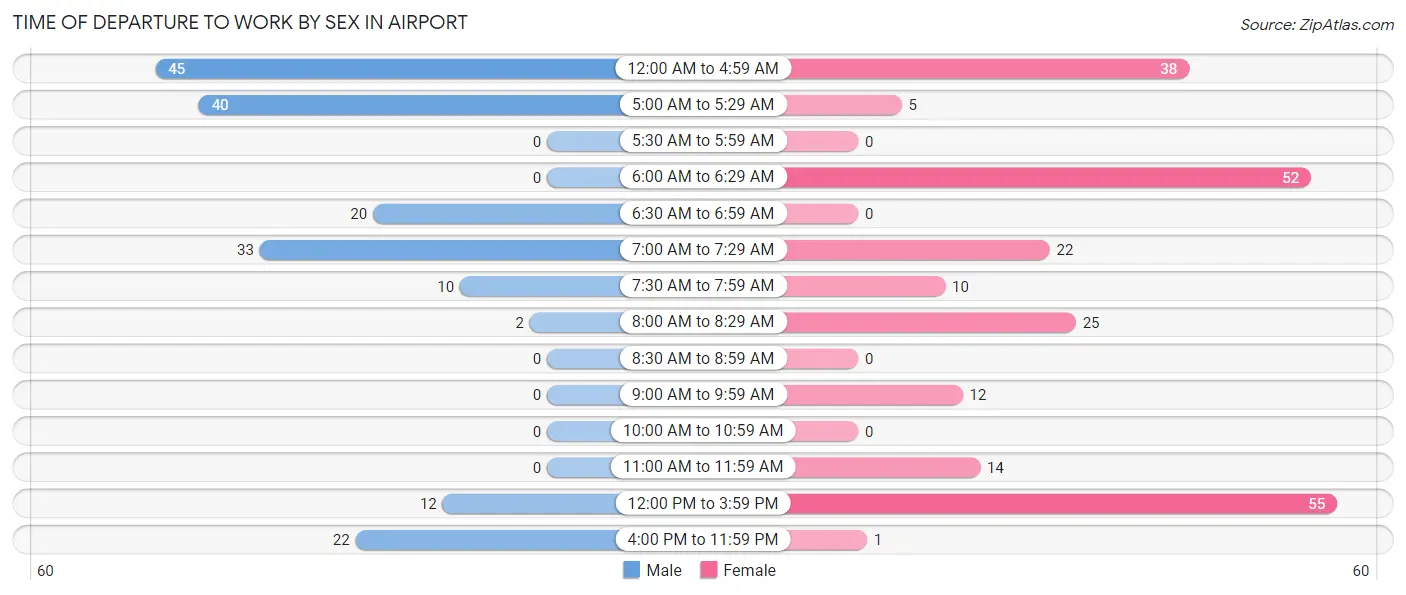
| Time of Departure | Male | Female |
| 12:00 AM to 4:59 AM | 45 (24.5%) | 38 (16.2%) |
| 5:00 AM to 5:29 AM | 40 (21.7%) | 5 (2.1%) |
| 5:30 AM to 5:59 AM | 0 (0.0%) | 0 (0.0%) |
| 6:00 AM to 6:29 AM | 0 (0.0%) | 52 (22.2%) |
| 6:30 AM to 6:59 AM | 20 (10.9%) | 0 (0.0%) |
| 7:00 AM to 7:29 AM | 33 (17.9%) | 22 (9.4%) |
| 7:30 AM to 7:59 AM | 10 (5.4%) | 10 (4.3%) |
| 8:00 AM to 8:29 AM | 2 (1.1%) | 25 (10.7%) |
| 8:30 AM to 8:59 AM | 0 (0.0%) | 0 (0.0%) |
| 9:00 AM to 9:59 AM | 0 (0.0%) | 12 (5.1%) |
| 10:00 AM to 10:59 AM | 0 (0.0%) | 0 (0.0%) |
| 11:00 AM to 11:59 AM | 0 (0.0%) | 14 (6.0%) |
| 12:00 PM to 3:59 PM | 12 (6.5%) | 55 (23.5%) |
| 4:00 PM to 11:59 PM | 22 (12.0%) | 1 (0.4%) |
| Total | 184 (100.0%) | 234 (100.0%) |
Housing Occupancy in Airport
Occupancy by Ownership in Airport
Of the total 393 dwellings in Airport, owner-occupied units account for 122 (31.0%), while renter-occupied units make up 271 (69.0%).
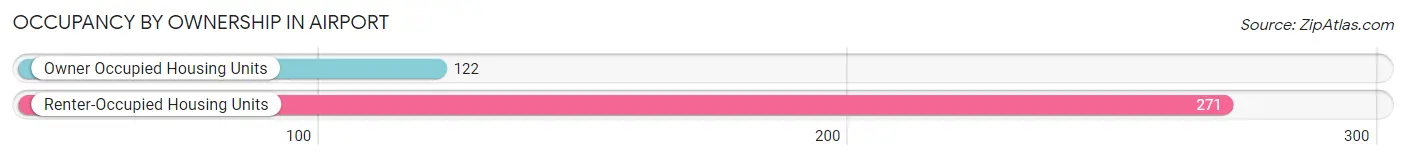
| Occupancy | # Housing Units | % Housing Units |
| Owner Occupied Housing Units | 122 | 31.0% |
| Renter-Occupied Housing Units | 271 | 69.0% |
| Total Occupied Housing Units | 393 | 100.0% |
Occupancy by Household Size in Airport
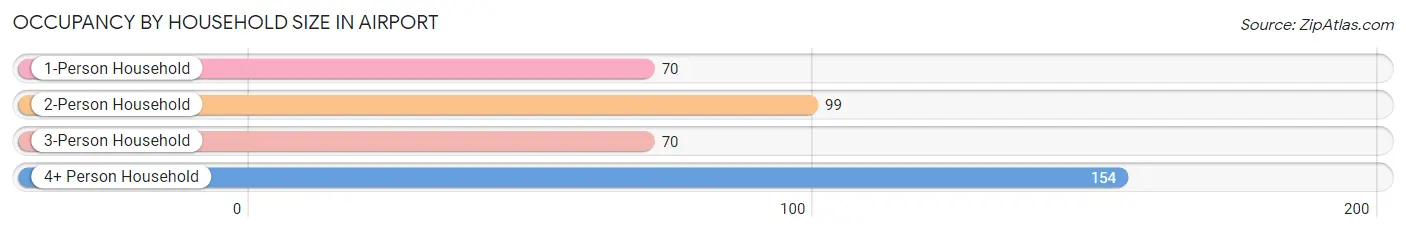
| Household Size | # Housing Units | % Housing Units |
| 1-Person Household | 70 | 17.8% |
| 2-Person Household | 99 | 25.2% |
| 3-Person Household | 70 | 17.8% |
| 4+ Person Household | 154 | 39.2% |
| Total Housing Units | 393 | 100.0% |
Occupancy by Ownership by Household Size in Airport
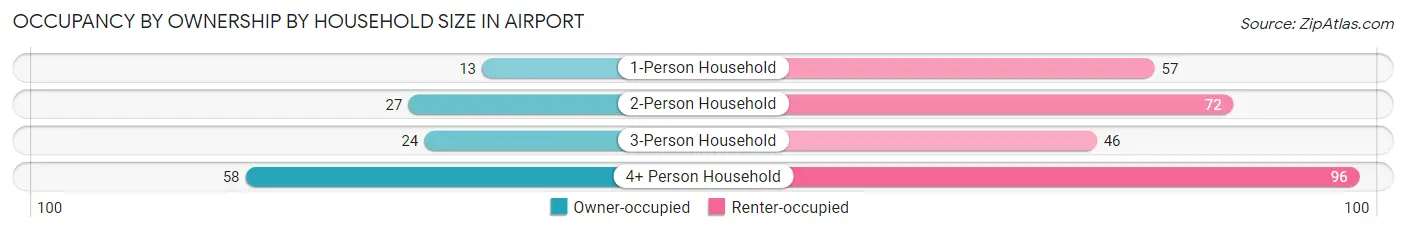
| Household Size | Owner-occupied | Renter-occupied |
| 1-Person Household | 13 (18.6%) | 57 (81.4%) |
| 2-Person Household | 27 (27.3%) | 72 (72.7%) |
| 3-Person Household | 24 (34.3%) | 46 (65.7%) |
| 4+ Person Household | 58 (37.7%) | 96 (62.3%) |
| Total Housing Units | 122 (31.0%) | 271 (69.0%) |
Occupancy by Educational Attainment in Airport
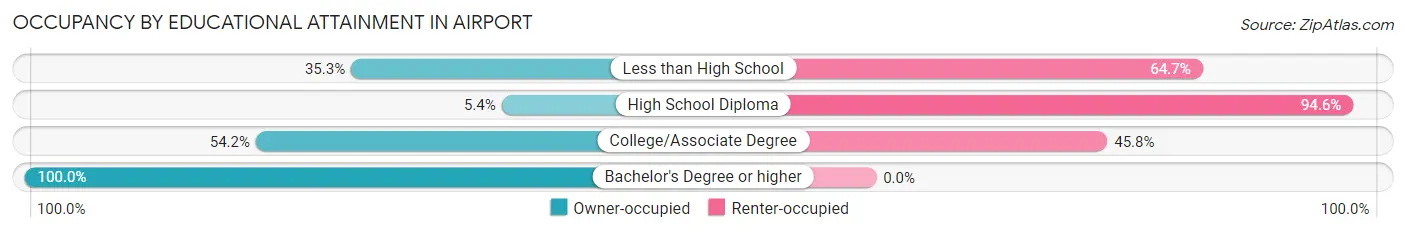
| Household Size | Owner-occupied | Renter-occupied |
| Less than High School | 42 (35.3%) | 77 (64.7%) |
| High School Diploma | 8 (5.4%) | 139 (94.6%) |
| College/Associate Degree | 65 (54.2%) | 55 (45.8%) |
| Bachelor's Degree or higher | 7 (100.0%) | 0 (0.0%) |
Occupancy by Age of Householder in Airport
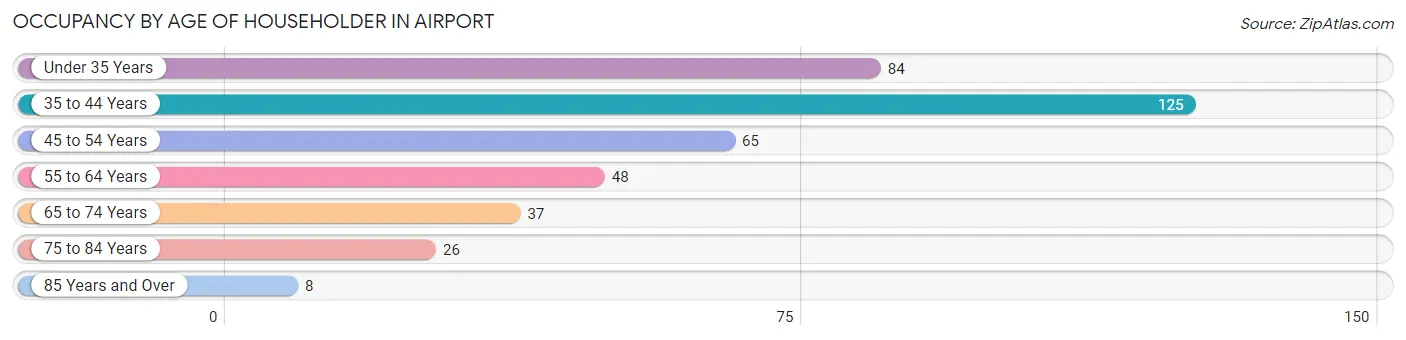
| Age Bracket | # Households | % Households |
| Under 35 Years | 84 | 21.4% |
| 35 to 44 Years | 125 | 31.8% |
| 45 to 54 Years | 65 | 16.5% |
| 55 to 64 Years | 48 | 12.2% |
| 65 to 74 Years | 37 | 9.4% |
| 75 to 84 Years | 26 | 6.6% |
| 85 Years and Over | 8 | 2.0% |
| Total | 393 | 100.0% |
Housing Finances in Airport
Median Income by Occupancy in Airport
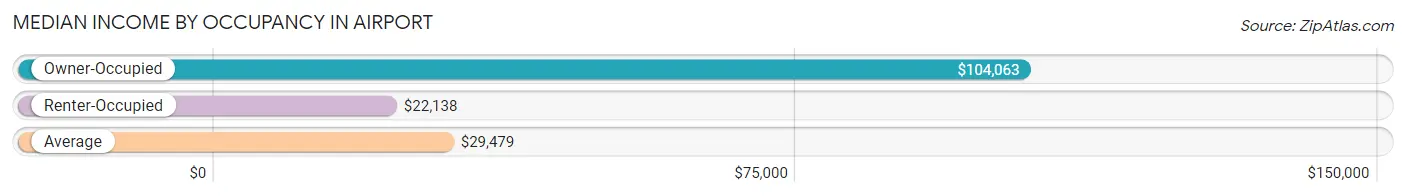
| Occupancy Type | # Households | Median Income |
| Owner-Occupied | 122 (31.0%) | $104,063 |
| Renter-Occupied | 271 (69.0%) | $22,138 |
| Average | 393 (100.0%) | $29,479 |
Occupancy by Householder Income Bracket in Airport
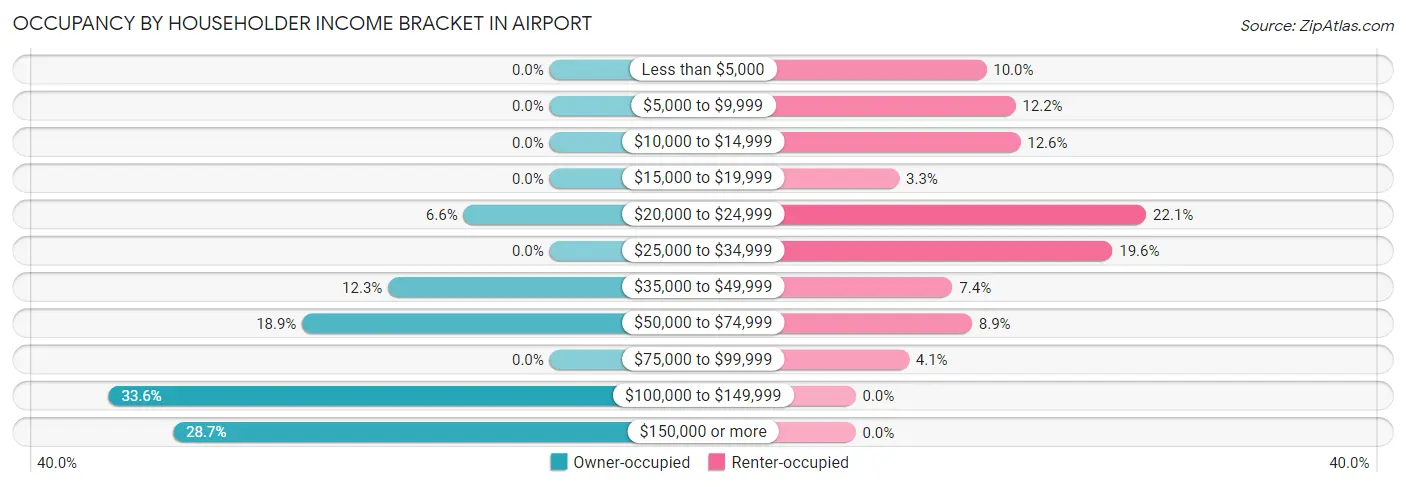
| Income Bracket | Owner-occupied | Renter-occupied |
| Less than $5,000 | 0 (0.0%) | 27 (10.0%) |
| $5,000 to $9,999 | 0 (0.0%) | 33 (12.2%) |
| $10,000 to $14,999 | 0 (0.0%) | 34 (12.6%) |
| $15,000 to $19,999 | 0 (0.0%) | 9 (3.3%) |
| $20,000 to $24,999 | 8 (6.6%) | 60 (22.1%) |
| $25,000 to $34,999 | 0 (0.0%) | 53 (19.6%) |
| $35,000 to $49,999 | 15 (12.3%) | 20 (7.4%) |
| $50,000 to $74,999 | 23 (18.9%) | 24 (8.9%) |
| $75,000 to $99,999 | 0 (0.0%) | 11 (4.1%) |
| $100,000 to $149,999 | 41 (33.6%) | 0 (0.0%) |
| $150,000 or more | 35 (28.7%) | 0 (0.0%) |
| Total | 122 (100.0%) | 271 (100.0%) |
Monthly Housing Cost Tiers in Airport
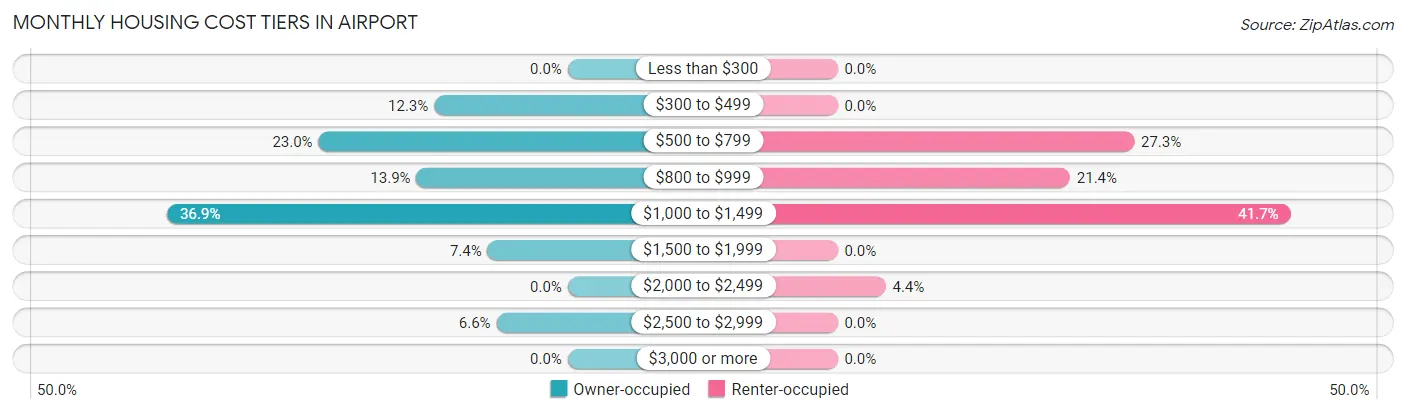
| Monthly Cost | Owner-occupied | Renter-occupied |
| Less than $300 | 0 (0.0%) | 0 (0.0%) |
| $300 to $499 | 15 (12.3%) | 0 (0.0%) |
| $500 to $799 | 28 (23.0%) | 74 (27.3%) |
| $800 to $999 | 17 (13.9%) | 58 (21.4%) |
| $1,000 to $1,499 | 45 (36.9%) | 113 (41.7%) |
| $1,500 to $1,999 | 9 (7.4%) | 0 (0.0%) |
| $2,000 to $2,499 | 0 (0.0%) | 12 (4.4%) |
| $2,500 to $2,999 | 8 (6.6%) | 0 (0.0%) |
| $3,000 or more | 0 (0.0%) | 0 (0.0%) |
| Total | 122 (100.0%) | 271 (100.0%) |
Physical Housing Characteristics in Airport
Housing Structures in Airport
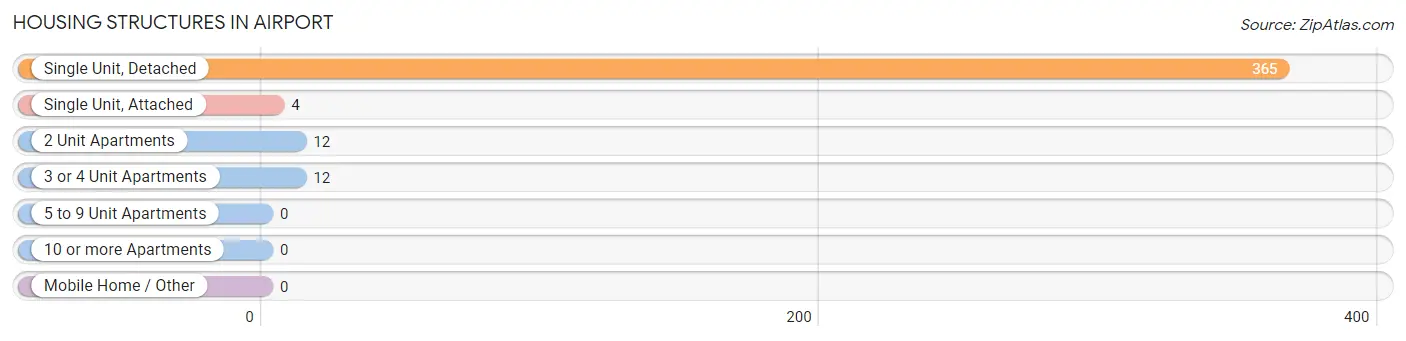
| Structure Type | # Housing Units | % Housing Units |
| Single Unit, Detached | 365 | 92.9% |
| Single Unit, Attached | 4 | 1.0% |
| 2 Unit Apartments | 12 | 3.0% |
| 3 or 4 Unit Apartments | 12 | 3.0% |
| 5 to 9 Unit Apartments | 0 | 0.0% |
| 10 or more Apartments | 0 | 0.0% |
| Mobile Home / Other | 0 | 0.0% |
| Total | 393 | 100.0% |
Housing Structures by Occupancy in Airport
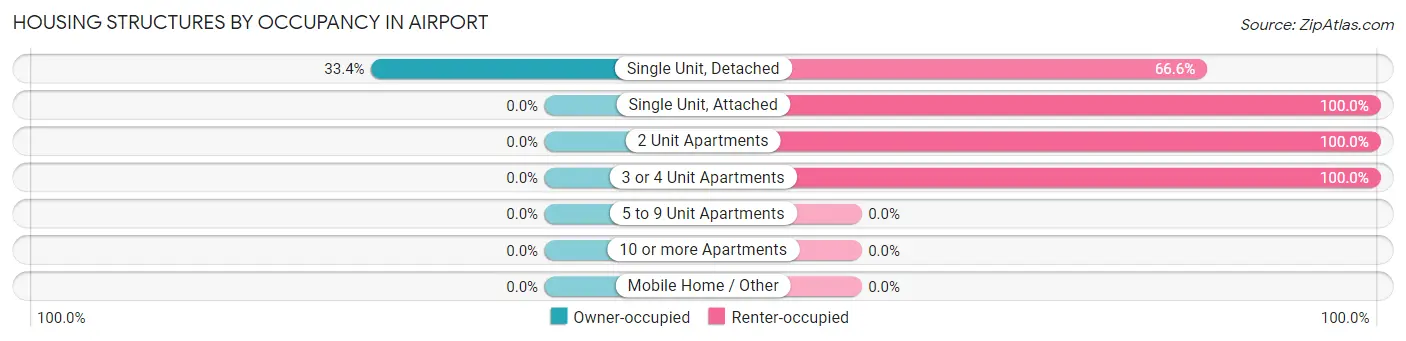
| Structure Type | Owner-occupied | Renter-occupied |
| Single Unit, Detached | 122 (33.4%) | 243 (66.6%) |
| Single Unit, Attached | 0 (0.0%) | 4 (100.0%) |
| 2 Unit Apartments | 0 (0.0%) | 12 (100.0%) |
| 3 or 4 Unit Apartments | 0 (0.0%) | 12 (100.0%) |
| 5 to 9 Unit Apartments | 0 (0.0%) | 0 (0.0%) |
| 10 or more Apartments | 0 (0.0%) | 0 (0.0%) |
| Mobile Home / Other | 0 (0.0%) | 0 (0.0%) |
| Total | 122 (31.0%) | 271 (69.0%) |
Housing Structures by Number of Rooms in Airport
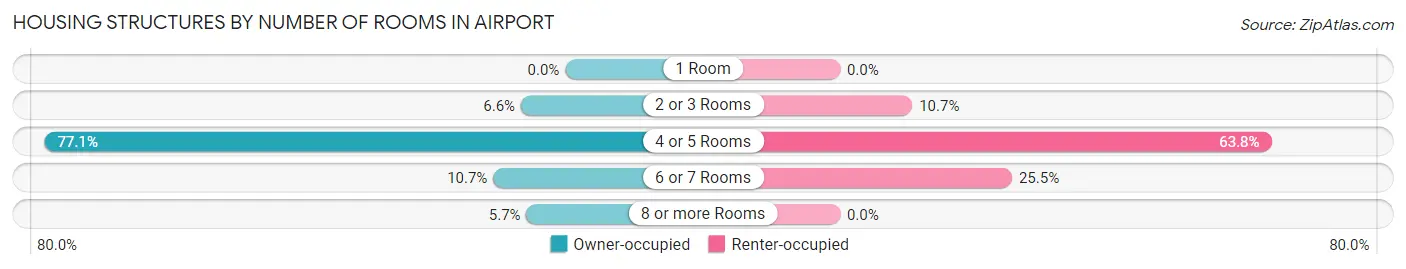
| Number of Rooms | Owner-occupied | Renter-occupied |
| 1 Room | 0 (0.0%) | 0 (0.0%) |
| 2 or 3 Rooms | 8 (6.6%) | 29 (10.7%) |
| 4 or 5 Rooms | 94 (77.0%) | 173 (63.8%) |
| 6 or 7 Rooms | 13 (10.7%) | 69 (25.5%) |
| 8 or more Rooms | 7 (5.7%) | 0 (0.0%) |
| Total | 122 (100.0%) | 271 (100.0%) |
Housing Structure by Heating Type in Airport
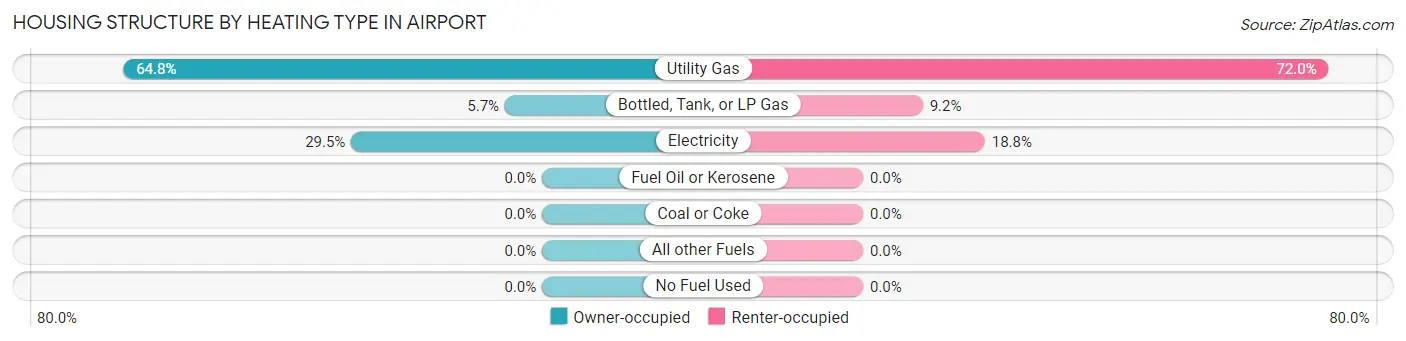
| Heating Type | Owner-occupied | Renter-occupied |
| Utility Gas | 79 (64.7%) | 195 (72.0%) |
| Bottled, Tank, or LP Gas | 7 (5.7%) | 25 (9.2%) |
| Electricity | 36 (29.5%) | 51 (18.8%) |
| Fuel Oil or Kerosene | 0 (0.0%) | 0 (0.0%) |
| Coal or Coke | 0 (0.0%) | 0 (0.0%) |
| All other Fuels | 0 (0.0%) | 0 (0.0%) |
| No Fuel Used | 0 (0.0%) | 0 (0.0%) |
| Total | 122 (100.0%) | 271 (100.0%) |
Household Vehicle Usage in Airport
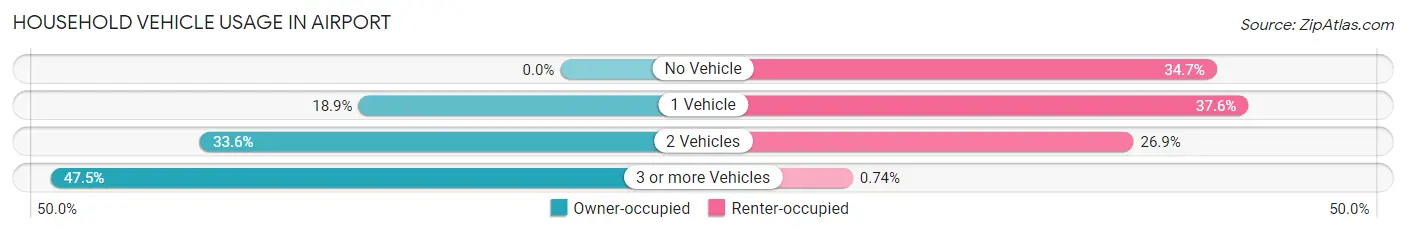
| Vehicles per Household | Owner-occupied | Renter-occupied |
| No Vehicle | 0 (0.0%) | 94 (34.7%) |
| 1 Vehicle | 23 (18.9%) | 102 (37.6%) |
| 2 Vehicles | 41 (33.6%) | 73 (26.9%) |
| 3 or more Vehicles | 58 (47.5%) | 2 (0.7%) |
| Total | 122 (100.0%) | 271 (100.0%) |
Real Estate & Mortgages in Airport
Real Estate and Mortgage Overview in Airport
| Characteristic | Without Mortgage | With Mortgage |
| Housing Units | 50 | 72 |
| Median Property Value | $589,300 | $329,400 |
| Median Household Income | $250,001 | $0 |
| Monthly Housing Costs | $536 | $0 |
| Real Estate Taxes | $1,679 | $0 |
Property Value by Mortgage Status in Airport
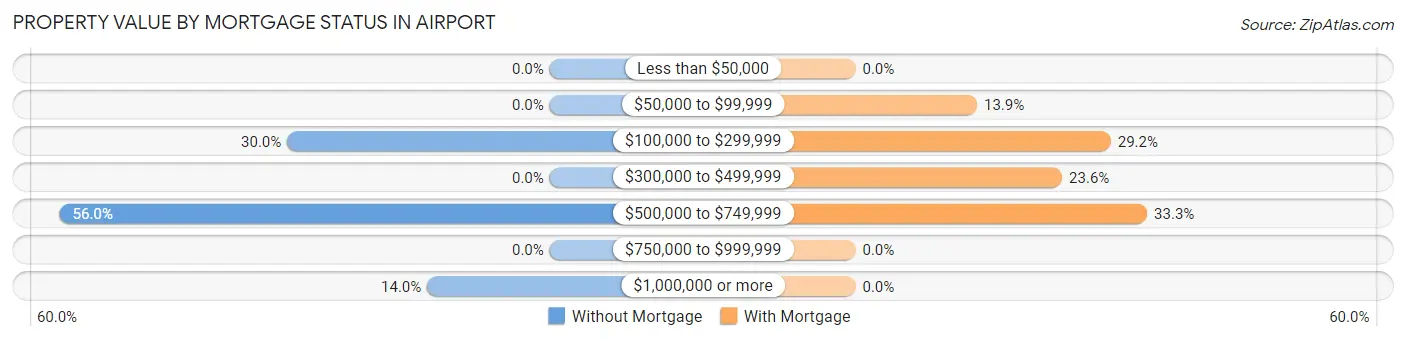
| Property Value | Without Mortgage | With Mortgage |
| Less than $50,000 | 0 (0.0%) | 0 (0.0%) |
| $50,000 to $99,999 | 0 (0.0%) | 10 (13.9%) |
| $100,000 to $299,999 | 15 (30.0%) | 21 (29.2%) |
| $300,000 to $499,999 | 0 (0.0%) | 17 (23.6%) |
| $500,000 to $749,999 | 28 (56.0%) | 24 (33.3%) |
| $750,000 to $999,999 | 0 (0.0%) | 0 (0.0%) |
| $1,000,000 or more | 7 (14.0%) | 0 (0.0%) |
| Total | 50 (100.0%) | 72 (100.0%) |
Household Income by Mortgage Status in Airport
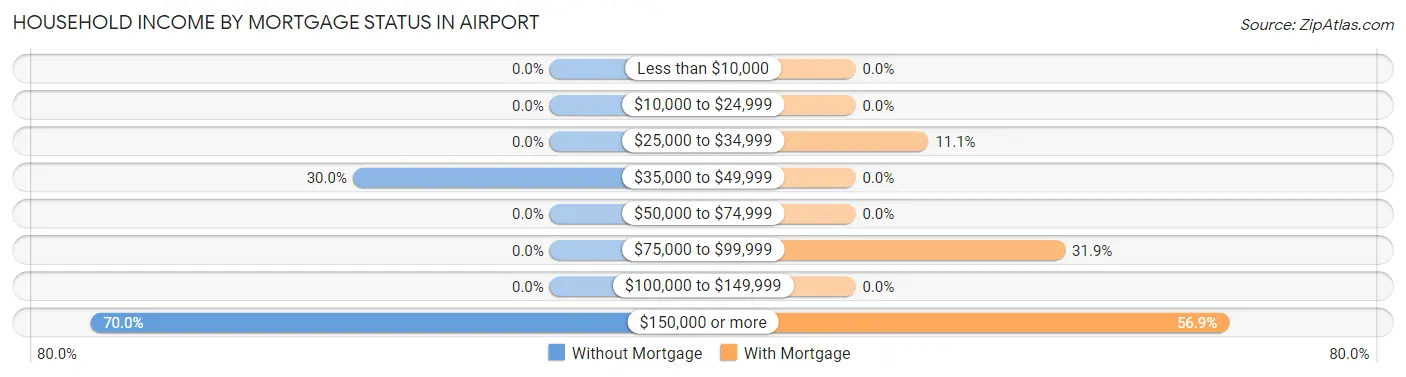
| Household Income | Without Mortgage | With Mortgage |
| Less than $10,000 | 0 (0.0%) | 0 (0.0%) |
| $10,000 to $24,999 | 0 (0.0%) | 0 (0.0%) |
| $25,000 to $34,999 | 0 (0.0%) | 8 (11.1%) |
| $35,000 to $49,999 | 15 (30.0%) | 0 (0.0%) |
| $50,000 to $74,999 | 0 (0.0%) | 0 (0.0%) |
| $75,000 to $99,999 | 0 (0.0%) | 23 (31.9%) |
| $100,000 to $149,999 | 0 (0.0%) | 0 (0.0%) |
| $150,000 or more | 35 (70.0%) | 41 (56.9%) |
| Total | 50 (100.0%) | 72 (100.0%) |
Property Value to Household Income Ratio in Airport
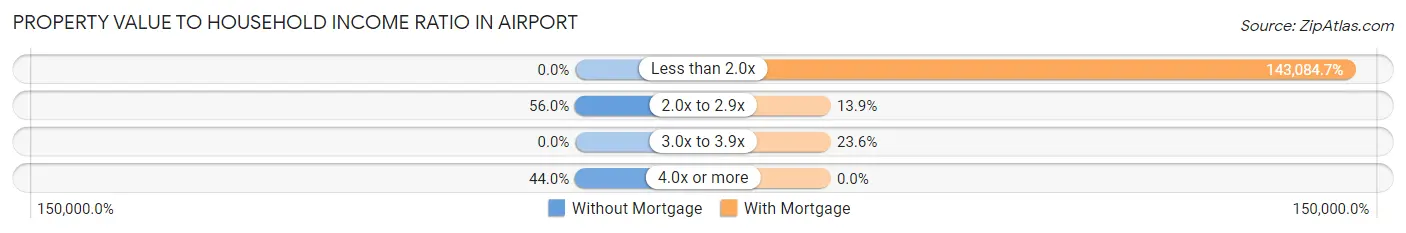
| Value-to-Income Ratio | Without Mortgage | With Mortgage |
| Less than 2.0x | 0 (0.0%) | 103,021 (143,084.7%) |
| 2.0x to 2.9x | 28 (56.0%) | 10 (13.9%) |
| 3.0x to 3.9x | 0 (0.0%) | 17 (23.6%) |
| 4.0x or more | 22 (44.0%) | 0 (0.0%) |
| Total | 50 (100.0%) | 72 (100.0%) |
Real Estate Taxes by Mortgage Status in Airport
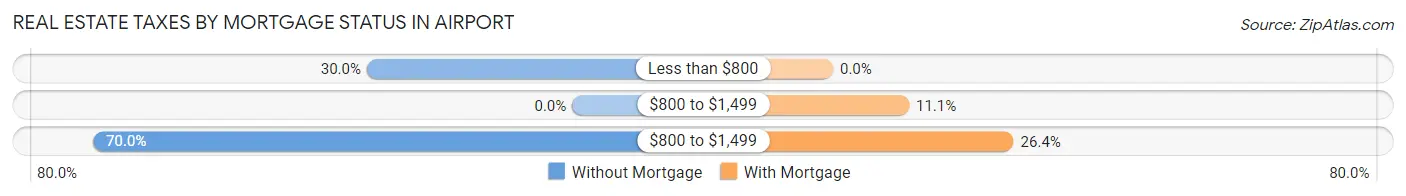
| Property Taxes | Without Mortgage | With Mortgage |
| Less than $800 | 15 (30.0%) | 0 (0.0%) |
| $800 to $1,499 | 0 (0.0%) | 8 (11.1%) |
| $800 to $1,499 | 35 (70.0%) | 19 (26.4%) |
| Total | 50 (100.0%) | 72 (100.0%) |
Health & Disability in Airport
Health Insurance Coverage by Age in Airport
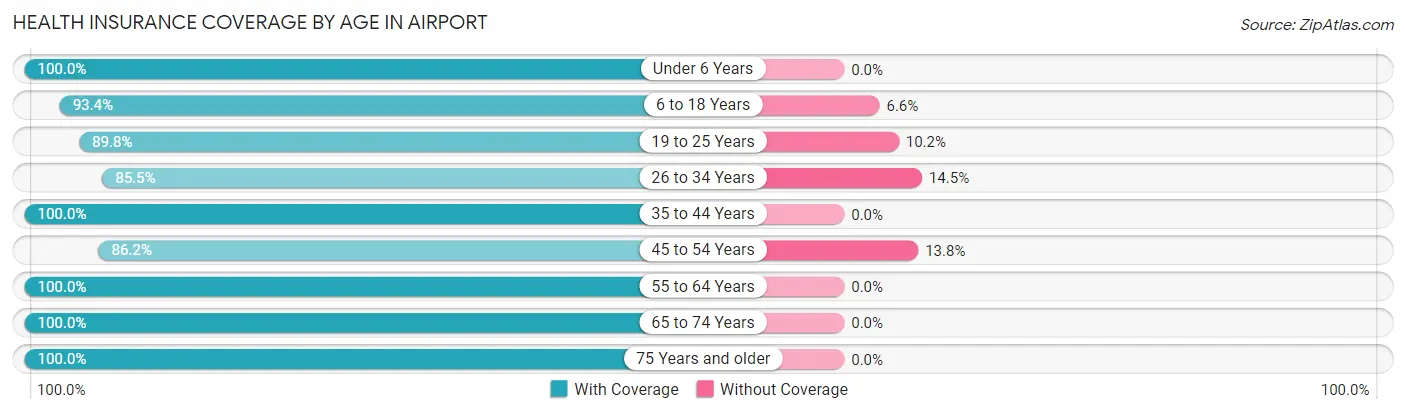
| Age Bracket | With Coverage | Without Coverage |
| Under 6 Years | 70 (100.0%) | 0 (0.0%) |
| 6 to 18 Years | 228 (93.4%) | 16 (6.6%) |
| 19 to 25 Years | 115 (89.8%) | 13 (10.2%) |
| 26 to 34 Years | 242 (85.5%) | 41 (14.5%) |
| 35 to 44 Years | 260 (100.0%) | 0 (0.0%) |
| 45 to 54 Years | 175 (86.2%) | 28 (13.8%) |
| 55 to 64 Years | 113 (100.0%) | 0 (0.0%) |
| 65 to 74 Years | 52 (100.0%) | 0 (0.0%) |
| 75 Years and older | 34 (100.0%) | 0 (0.0%) |
| Total | 1,289 (92.9%) | 98 (7.1%) |
Health Insurance Coverage by Citizenship Status in Airport
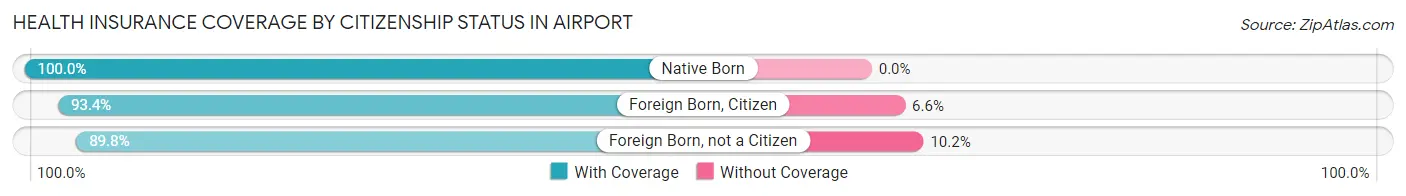
| Citizenship Status | With Coverage | Without Coverage |
| Native Born | 70 (100.0%) | 0 (0.0%) |
| Foreign Born, Citizen | 228 (93.4%) | 16 (6.6%) |
| Foreign Born, not a Citizen | 115 (89.8%) | 13 (10.2%) |
Health Insurance Coverage by Household Income in Airport
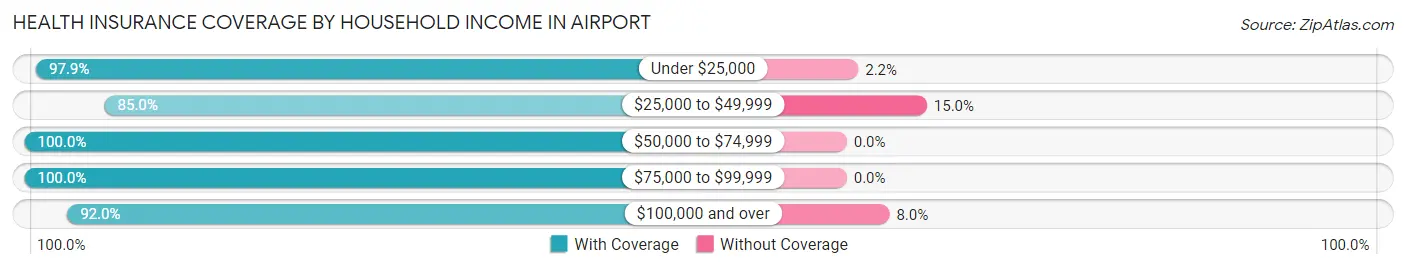
| Household Income | With Coverage | Without Coverage |
| Under $25,000 | 456 (97.9%) | 10 (2.1%) |
| $25,000 to $49,999 | 323 (85.0%) | 57 (15.0%) |
| $50,000 to $74,999 | 126 (100.0%) | 0 (0.0%) |
| $75,000 to $99,999 | 27 (100.0%) | 0 (0.0%) |
| $100,000 and over | 357 (92.0%) | 31 (8.0%) |
Public vs Private Health Insurance Coverage by Age in Airport
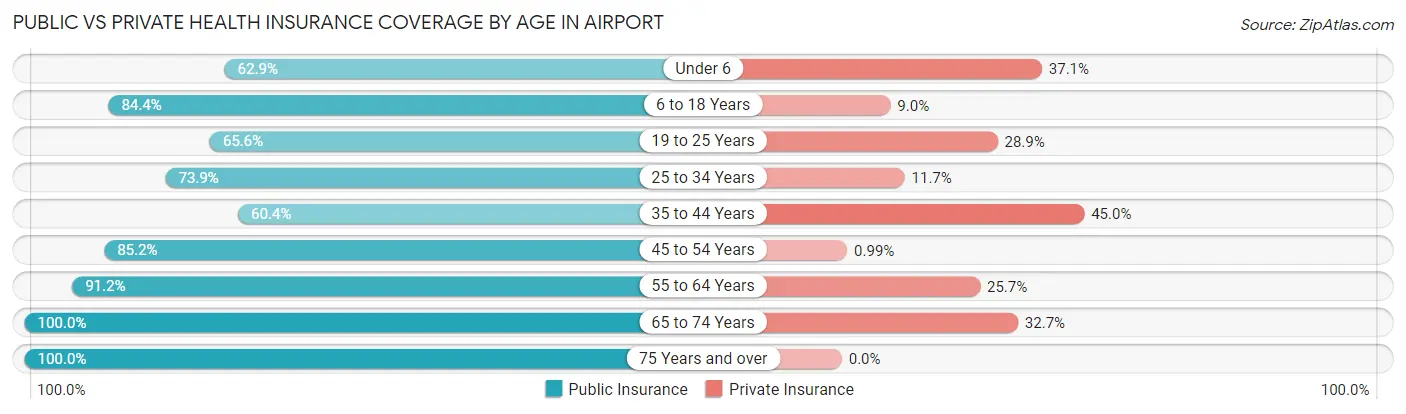
| Age Bracket | Public Insurance | Private Insurance |
| Under 6 | 44 (62.9%) | 26 (37.1%) |
| 6 to 18 Years | 206 (84.4%) | 22 (9.0%) |
| 19 to 25 Years | 84 (65.6%) | 37 (28.9%) |
| 25 to 34 Years | 209 (73.9%) | 33 (11.7%) |
| 35 to 44 Years | 157 (60.4%) | 117 (45.0%) |
| 45 to 54 Years | 173 (85.2%) | 2 (1.0%) |
| 55 to 64 Years | 103 (91.1%) | 29 (25.7%) |
| 65 to 74 Years | 52 (100.0%) | 17 (32.7%) |
| 75 Years and over | 34 (100.0%) | 0 (0.0%) |
| Total | 1,062 (76.6%) | 283 (20.4%) |
Disability Status by Sex by Age in Airport
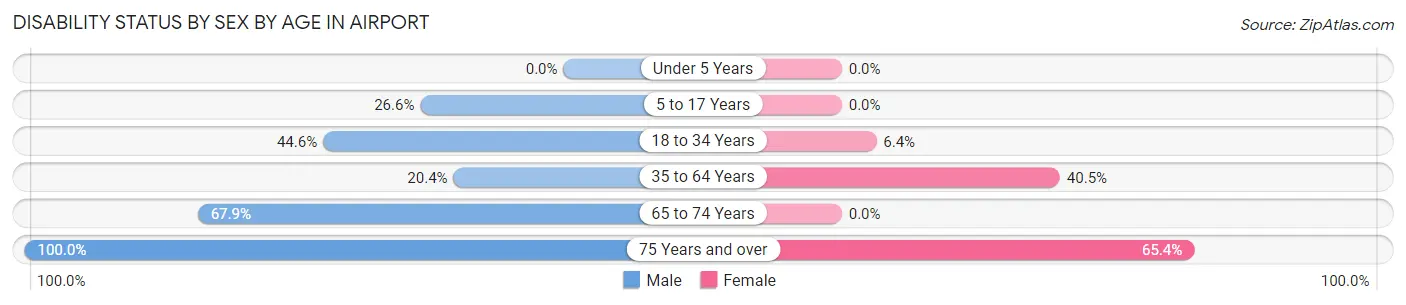
| Age Bracket | Male | Female |
| Under 5 Years | 0 (0.0%) | 0 (0.0%) |
| 5 to 17 Years | 34 (26.6%) | 0 (0.0%) |
| 18 to 34 Years | 58 (44.6%) | 20 (6.4%) |
| 35 to 64 Years | 50 (20.4%) | 134 (40.5%) |
| 65 to 74 Years | 19 (67.9%) | 0 (0.0%) |
| 75 Years and over | 8 (100.0%) | 17 (65.4%) |
Disability Class by Sex by Age in Airport
Disability Class: Hearing Difficulty
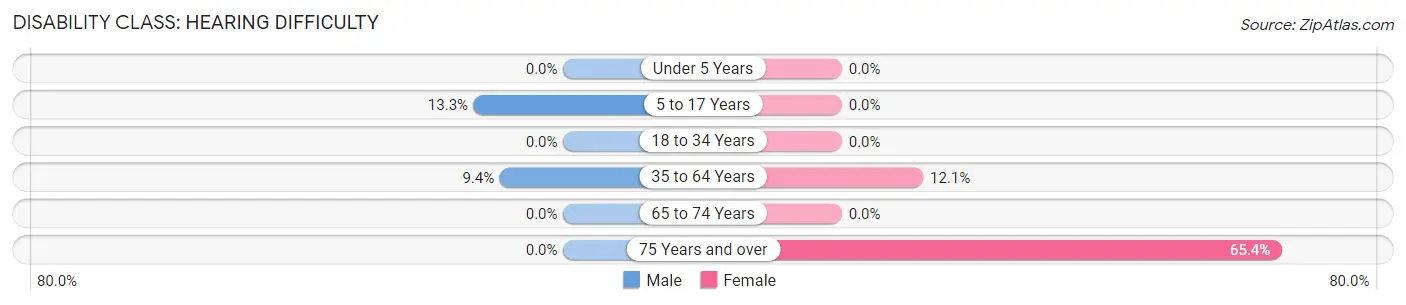
| Age Bracket | Male | Female |
| Under 5 Years | 0 (0.0%) | 0 (0.0%) |
| 5 to 17 Years | 17 (13.3%) | 0 (0.0%) |
| 18 to 34 Years | 0 (0.0%) | 0 (0.0%) |
| 35 to 64 Years | 23 (9.4%) | 40 (12.1%) |
| 65 to 74 Years | 0 (0.0%) | 0 (0.0%) |
| 75 Years and over | 0 (0.0%) | 17 (65.4%) |
Disability Class: Vision Difficulty
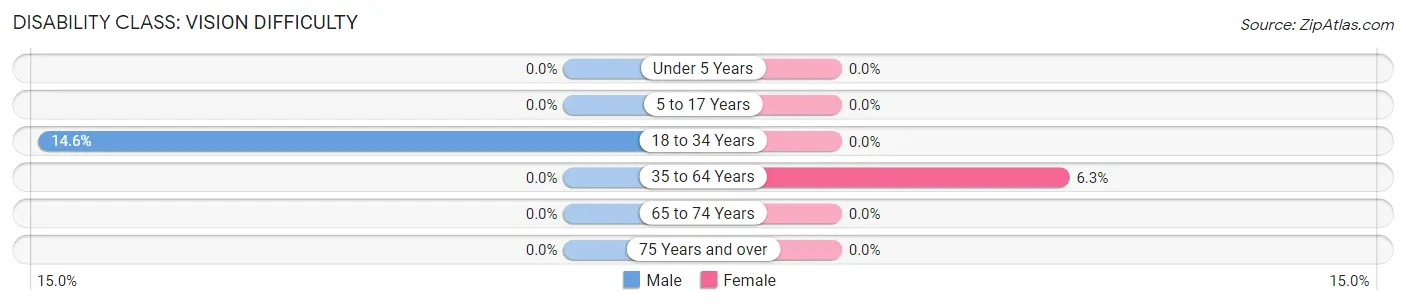
| Age Bracket | Male | Female |
| Under 5 Years | 0 (0.0%) | 0 (0.0%) |
| 5 to 17 Years | 0 (0.0%) | 0 (0.0%) |
| 18 to 34 Years | 19 (14.6%) | 0 (0.0%) |
| 35 to 64 Years | 0 (0.0%) | 21 (6.3%) |
| 65 to 74 Years | 0 (0.0%) | 0 (0.0%) |
| 75 Years and over | 0 (0.0%) | 0 (0.0%) |
Disability Class: Cognitive Difficulty
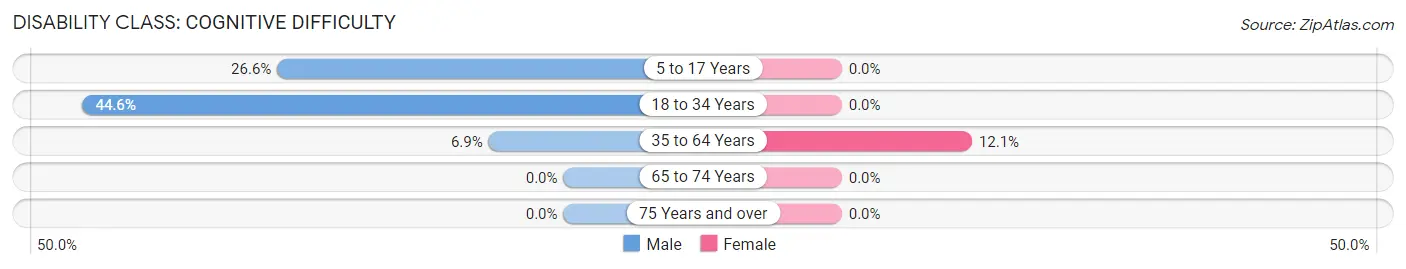
| Age Bracket | Male | Female |
| 5 to 17 Years | 34 (26.6%) | 0 (0.0%) |
| 18 to 34 Years | 58 (44.6%) | 0 (0.0%) |
| 35 to 64 Years | 17 (6.9%) | 40 (12.1%) |
| 65 to 74 Years | 0 (0.0%) | 0 (0.0%) |
| 75 Years and over | 0 (0.0%) | 0 (0.0%) |
Disability Class: Ambulatory Difficulty
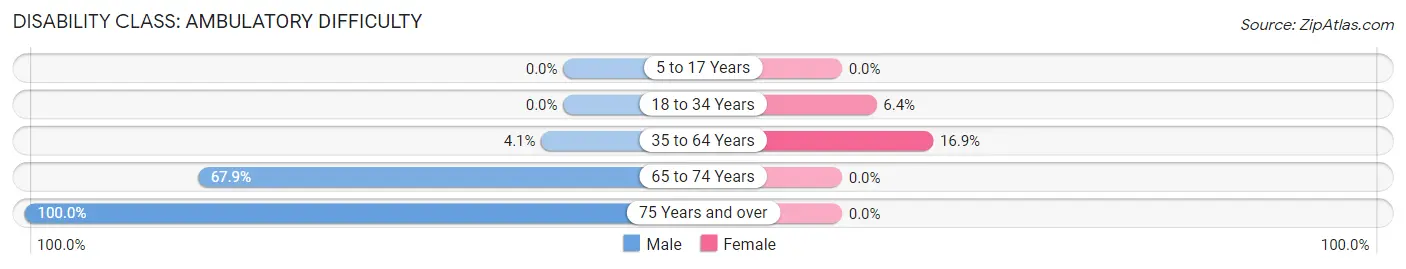
| Age Bracket | Male | Female |
| 5 to 17 Years | 0 (0.0%) | 0 (0.0%) |
| 18 to 34 Years | 0 (0.0%) | 20 (6.4%) |
| 35 to 64 Years | 10 (4.1%) | 56 (16.9%) |
| 65 to 74 Years | 19 (67.9%) | 0 (0.0%) |
| 75 Years and over | 8 (100.0%) | 0 (0.0%) |
Disability Class: Self-Care Difficulty
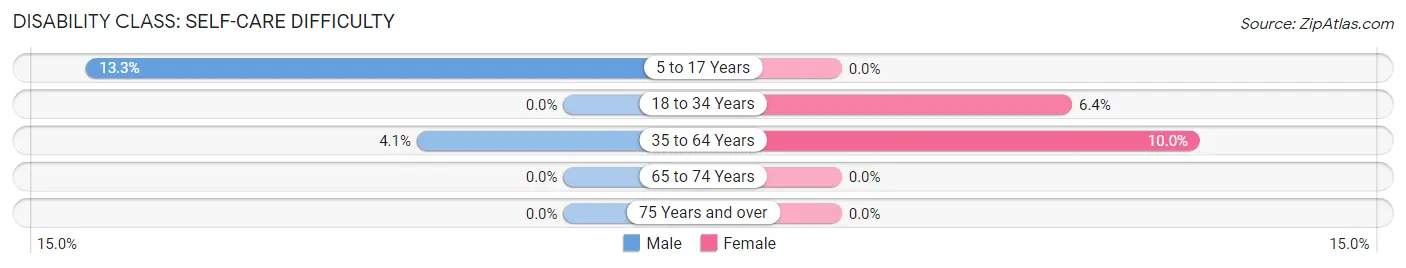
| Age Bracket | Male | Female |
| 5 to 17 Years | 17 (13.3%) | 0 (0.0%) |
| 18 to 34 Years | 0 (0.0%) | 20 (6.4%) |
| 35 to 64 Years | 10 (4.1%) | 33 (10.0%) |
| 65 to 74 Years | 0 (0.0%) | 0 (0.0%) |
| 75 Years and over | 0 (0.0%) | 0 (0.0%) |
Technology Access in Airport
Computing Device Access in Airport
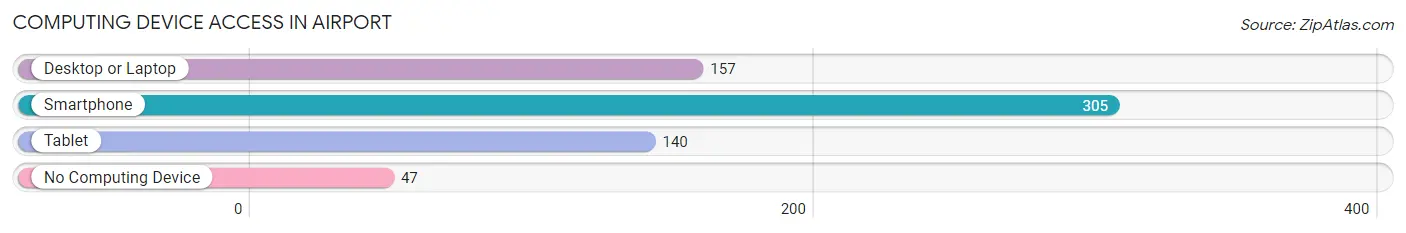
| Device Type | # Households | % Households |
| Desktop or Laptop | 157 | 40.0% |
| Smartphone | 305 | 77.6% |
| Tablet | 140 | 35.6% |
| No Computing Device | 47 | 12.0% |
| Total | 393 | 100.0% |
Internet Access in Airport
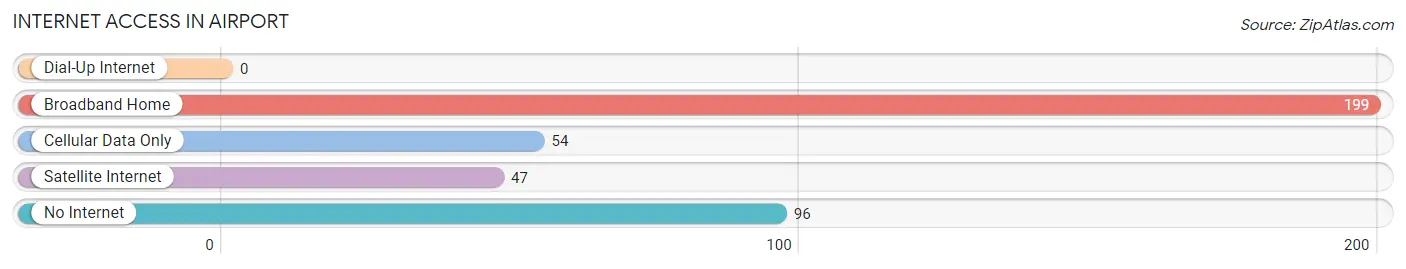
| Internet Type | # Households | % Households |
| Dial-Up Internet | 0 | 0.0% |
| Broadband Home | 199 | 50.6% |
| Cellular Data Only | 54 | 13.7% |
| Satellite Internet | 47 | 12.0% |
| No Internet | 96 | 24.4% |
| Total | 393 | 100.0% |
Airport Summary
Airport, California is a small unincorporated community located in the San Joaquin Valley of California. It is situated in Fresno County, approximately 10 miles south of the city of Fresno. The population of Airport, California is estimated to be around 1,000 people.
History
The area that is now known as Airport, California was originally inhabited by the Yokuts Native American tribe. The Yokuts were a semi-nomadic people who lived in the area for thousands of years before the arrival of Europeans. The first Europeans to settle in the area were Spanish missionaries and soldiers who arrived in the late 18th century. The area was then part of the Mexican province of Alta California.
In 1851, the area was annexed by the United States as part of the Treaty of Guadalupe Hidalgo. The area was then part of the newly formed Fresno County. In the late 19th century, the area was settled by farmers and ranchers who grew cotton, wheat, and other crops.
In the early 20th century, the area was known as Airport Station, due to the presence of a small airfield. The airfield was used by the United States Army Air Corps during World War II. After the war, the airfield was closed and the area was renamed Airport, California.
Geography
Airport, California is located in the San Joaquin Valley of California. It is situated in Fresno County, approximately 10 miles south of the city of Fresno. The area is mostly flat, with some rolling hills. The climate is semi-arid, with hot summers and mild winters.
The area is home to a variety of wildlife, including coyotes, bobcats, and various species of birds. The nearby San Joaquin River provides a habitat for fish and other aquatic life.
Economy
The economy of Airport, California is largely based on agriculture. The area is home to a variety of crops, including cotton, wheat, and other grains. The area is also home to a number of dairies and livestock operations.
In addition to agriculture, the area is home to a number of small businesses, including restaurants, convenience stores, and auto repair shops. The area is also home to a number of light industrial businesses.
Demographics
As of the 2010 census, the population of Airport, California was estimated to be around 1,000 people. The racial makeup of the area was 75.3% White, 0.7% African American, 0.3% Native American, 0.3% Asian, 0.1% Pacific Islander, and 22.6% from other races. The median household income was $37,500.
Conclusion
Airport, California is a small unincorporated community located in the San Joaquin Valley of California. It is situated in Fresno County, approximately 10 miles south of the city of Fresno. The area was originally inhabited by the Yokuts Native American tribe and was later settled by Spanish missionaries and soldiers. In the early 20th century, the area was known as Airport Station, due to the presence of a small airfield. The economy of Airport, California is largely based on agriculture, with a variety of crops grown in the area. The population of Airport, California is estimated to be around 1,000 people.
Common Questions
What is Per Capita Income in Airport?
Per Capita income in Airport is $17,701.
What is the Median Household income in Airport?
Median Household Income in Airport is $29,479.
What is Income or Wage Gap in Airport?
Income or Wage Gap in Airport is 16.5%.
Women in Airport earn 83.5 cents for every dollar earned by a man.
What is Inequality or Gini Index in Airport?
Inequality or Gini Index in Airport is 0.57.
What is the Total Population of Airport?
Total Population of Airport is 1,387.
What is the Total Male Population of Airport?
Total Male Population of Airport is 609.
What is the Total Female Population of Airport?
Total Female Population of Airport is 778.
What is the Ratio of Males per 100 Females in Airport?
There are 78.28 Males per 100 Females in Airport.
What is the Ratio of Females per 100 Males in Airport?
There are 127.75 Females per 100 Males in Airport.
What is the Median Population Age in Airport?
Median Population Age in Airport is 33.7 Years.
What is the Average Family Size in Airport
Average Family Size in Airport is 4.2 People.
What is the Average Household Size in Airport
Average Household Size in Airport is 3.5 People.
How Large is the Labor Force in Airport?
There are 535 People in the Labor Forcein in Airport.
What is the Percentage of People in the Labor Force in Airport?
46.7% of People are in the Labor Force in Airport.
What is the Unemployment Rate in Airport?
Unemployment Rate in Airport is 19.8%.