Greenville, CA Map & Demographics
Greenville Map
Greenville Overview
$71,629
PER CAPITA INCOME
$66,172
AVG HOUSEHOLD INCOME
0.67
INEQUALITY / GINI INDEX
705
TOTAL POPULATION
420
MALE POPULATION
285
FEMALE POPULATION
147.37
MALES / 100 FEMALES
67.86
FEMALES / 100 MALES
47.7
MEDIAN AGE
2.9
AVG FAMILY SIZE
2.3
AVG HOUSEHOLD SIZE
532
LABOR FORCE [ PEOPLE ]
81.7%
PERCENT IN LABOR FORCE
15.0%
UNEMPLOYMENT RATE
Greenville Zip Codes
Greenville Area Codes
Income in Greenville
Income Overview in Greenville
| Characteristic | Number | Measure |
| Per Capita Income | 705 | $71,629 |
| Median Family Income | 194 | $0 |
| Mean Family Income | 194 | $241,107 |
| Median Household Income | 302 | $66,172 |
| Mean Household Income | 302 | $169,307 |
| Income Deficit | 194 | $0 |
| Wage / Income Gap (%) | 705 | 0.00% |
| Wage / Income Gap ($) | 705 | 100.00¢ per $1 |
| Gini / Inequality Index | 705 | 0.67 |
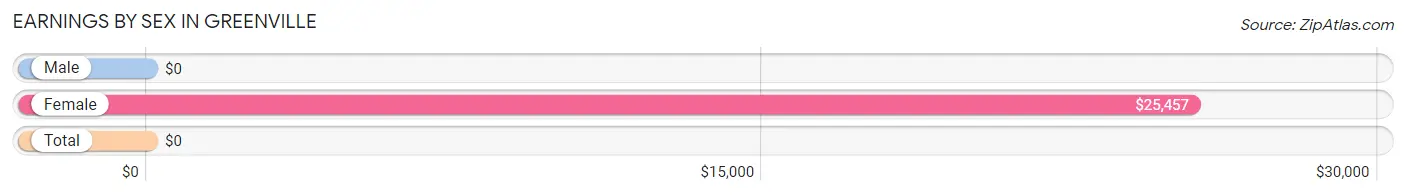
Earnings by Sex in Greenville
| Sex | Number | Average Earnings |
| Male | 311 (58.2%) | $0 |
| Female | 223 (41.8%) | $25,457 |
| Total | 534 (100.0%) | $0 |
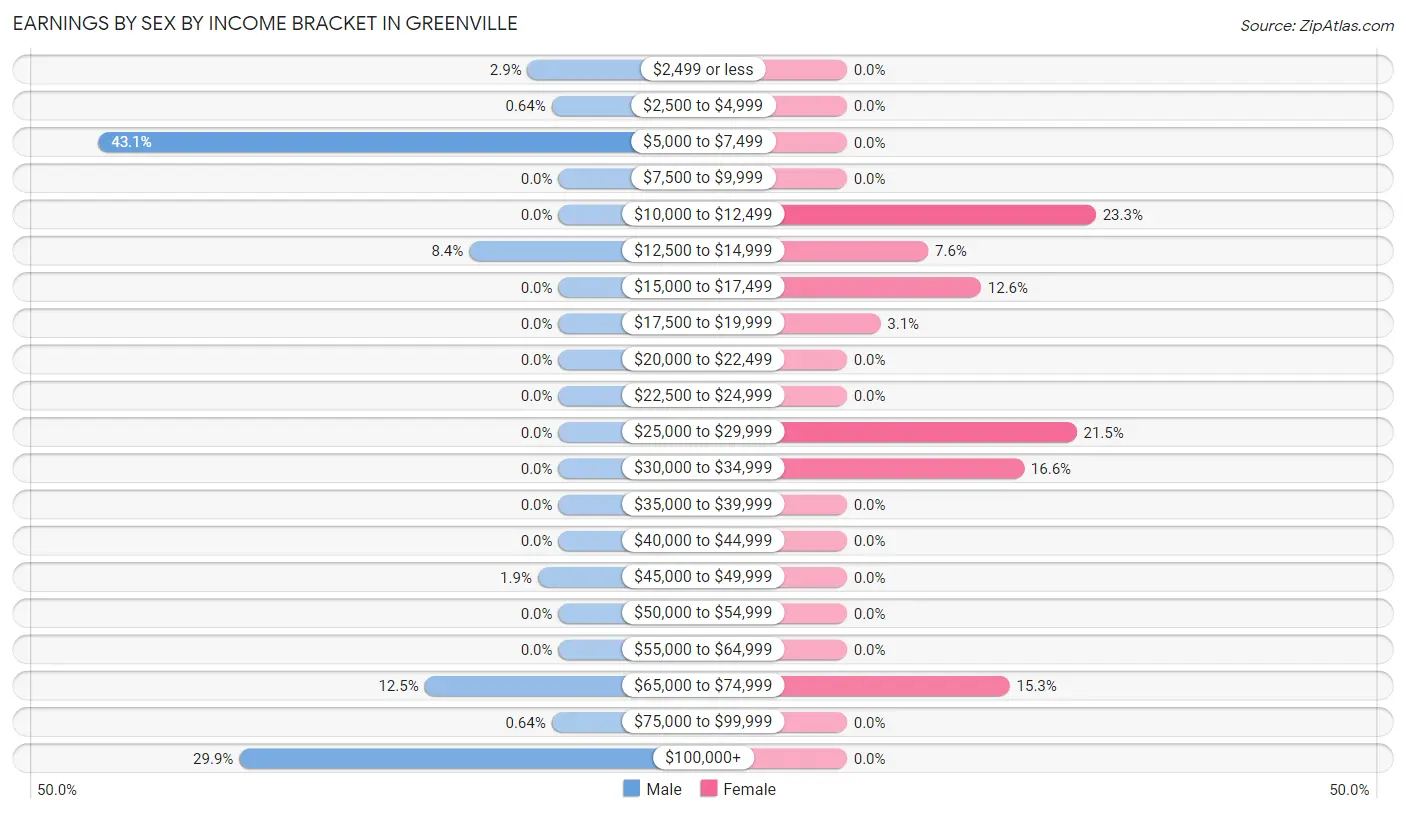
Earnings by Sex by Income Bracket in Greenville
The most common earnings brackets in Greenville are $5,000 to $7,499 for men (134 | 43.1%) and $10,000 to $12,499 for women (52 | 23.3%).
| Income | Male | Female |
| $2,499 or less | 9 (2.9%) | 0 (0.0%) |
| $2,500 to $4,999 | 2 (0.6%) | 0 (0.0%) |
| $5,000 to $7,499 | 134 (43.1%) | 0 (0.0%) |
| $7,500 to $9,999 | 0 (0.0%) | 0 (0.0%) |
| $10,000 to $12,499 | 0 (0.0%) | 52 (23.3%) |
| $12,500 to $14,999 | 26 (8.4%) | 17 (7.6%) |
| $15,000 to $17,499 | 0 (0.0%) | 28 (12.6%) |
| $17,500 to $19,999 | 0 (0.0%) | 7 (3.1%) |
| $20,000 to $22,499 | 0 (0.0%) | 0 (0.0%) |
| $22,500 to $24,999 | 0 (0.0%) | 0 (0.0%) |
| $25,000 to $29,999 | 0 (0.0%) | 48 (21.5%) |
| $30,000 to $34,999 | 0 (0.0%) | 37 (16.6%) |
| $35,000 to $39,999 | 0 (0.0%) | 0 (0.0%) |
| $40,000 to $44,999 | 0 (0.0%) | 0 (0.0%) |
| $45,000 to $49,999 | 6 (1.9%) | 0 (0.0%) |
| $50,000 to $54,999 | 0 (0.0%) | 0 (0.0%) |
| $55,000 to $64,999 | 0 (0.0%) | 0 (0.0%) |
| $65,000 to $74,999 | 39 (12.5%) | 34 (15.2%) |
| $75,000 to $99,999 | 2 (0.6%) | 0 (0.0%) |
| $100,000+ | 93 (29.9%) | 0 (0.0%) |
| Total | 311 (100.0%) | 223 (100.0%) |
Earnings by Sex by Educational Attainment in Greenville
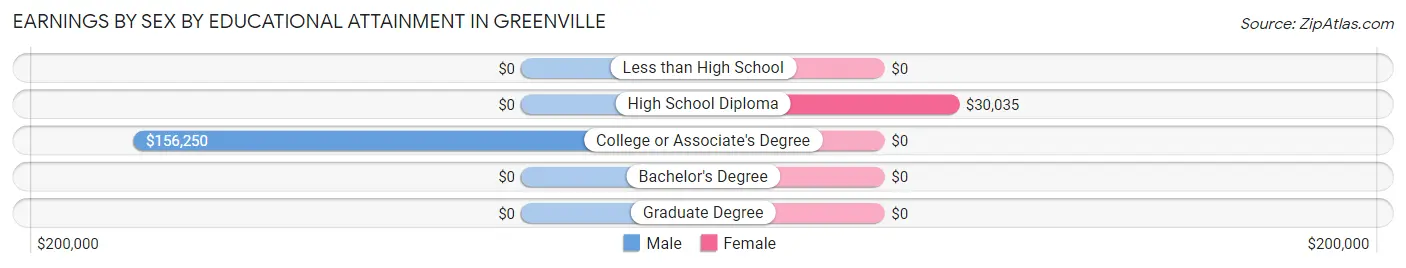
| Educational Attainment | Male Income | Female Income |
| Less than High School | - | - |
| High School Diploma | - | - |
| College or Associate's Degree | $156,250 | $0 |
| Bachelor's Degree | - | - |
| Graduate Degree | - | - |
| Total | - | - |
Family Income in Greenville
Family Income Brackets in Greenville
According to the Greenville family income data, there are 56 families falling into the $200,000+ income range, which is the most common income bracket and makes up 28.9% of all families.
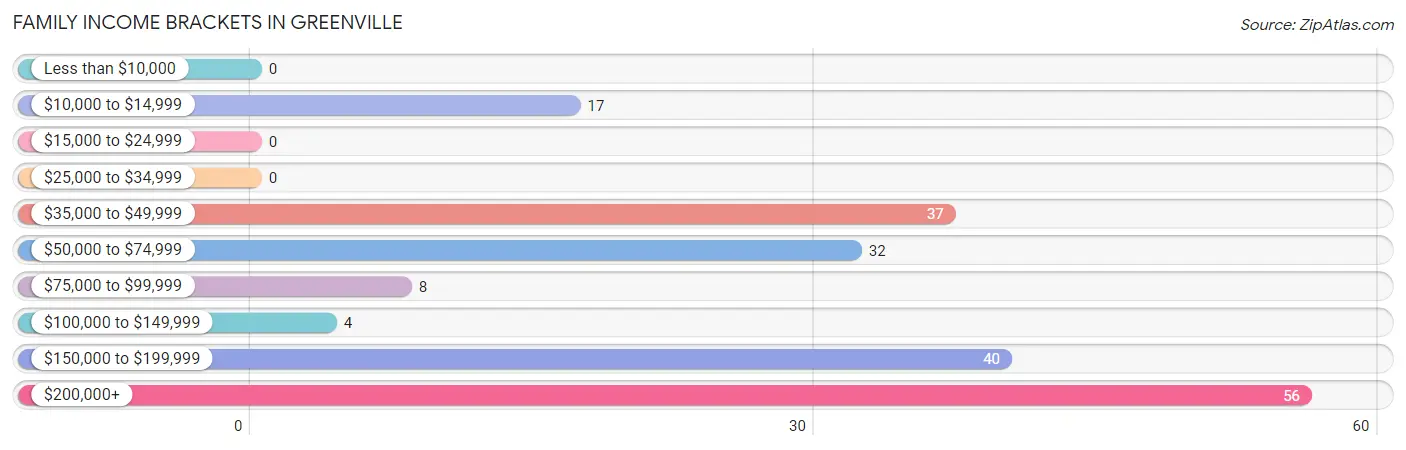
| Income Bracket | # Families | % Families |
| Less than $10,000 | 0 | 0.0% |
| $10,000 to $14,999 | 17 | 8.8% |
| $15,000 to $24,999 | 0 | 0.0% |
| $25,000 to $34,999 | 0 | 0.0% |
| $35,000 to $49,999 | 37 | 19.1% |
| $50,000 to $74,999 | 32 | 16.5% |
| $75,000 to $99,999 | 8 | 4.1% |
| $100,000 to $149,999 | 4 | 2.1% |
| $150,000 to $199,999 | 40 | 20.6% |
| $200,000+ | 56 | 28.9% |
Family Income by Famaliy Size in Greenville
2-person families (162 | 83.5%) account for the highest median family income in Greenville with $188,438 per family, while 2-person families (162 | 83.5%) have the highest median income of $94,219 per family member.
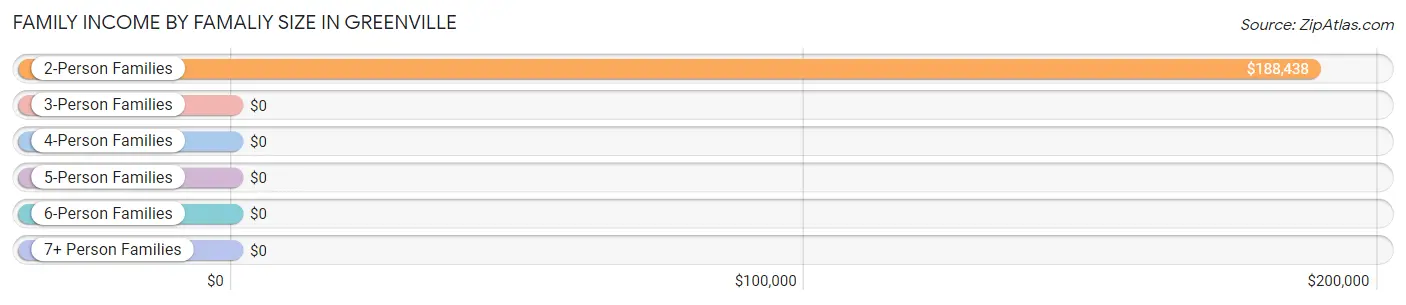
| Income Bracket | # Families | Median Income |
| 2-Person Families | 162 (83.5%) | $188,438 |
| 3-Person Families | 31 (16.0%) | $0 |
| 4-Person Families | 1 (0.5%) | $0 |
| 5-Person Families | 0 (0.0%) | $0 |
| 6-Person Families | 0 (0.0%) | $0 |
| 7+ Person Families | 0 (0.0%) | $0 |
| Total | 194 (100.0%) | $0 |
Family Income by Number of Earners in Greenville
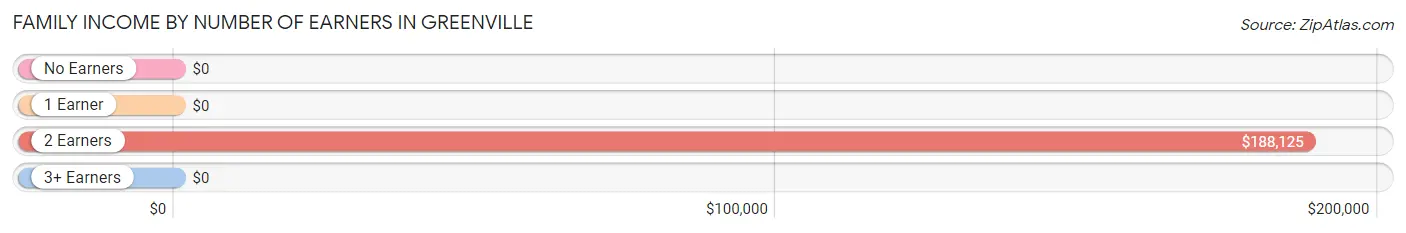
| Number of Earners | # Families | Median Income |
| No Earners | 15 (7.7%) | $0 |
| 1 Earner | 30 (15.5%) | $0 |
| 2 Earners | 148 (76.3%) | $188,125 |
| 3+ Earners | 1 (0.5%) | $0 |
| Total | 194 (100.0%) | $0 |
Household Income in Greenville
Household Income Brackets in Greenville
With 56 households falling in the category, the $200,000+ income range is the most frequent in Greenville, accounting for 18.5% of all households. In contrast, only 4 households (1.3%) fall into the $100,000 to $149,999 income bracket, making it the least populous group.
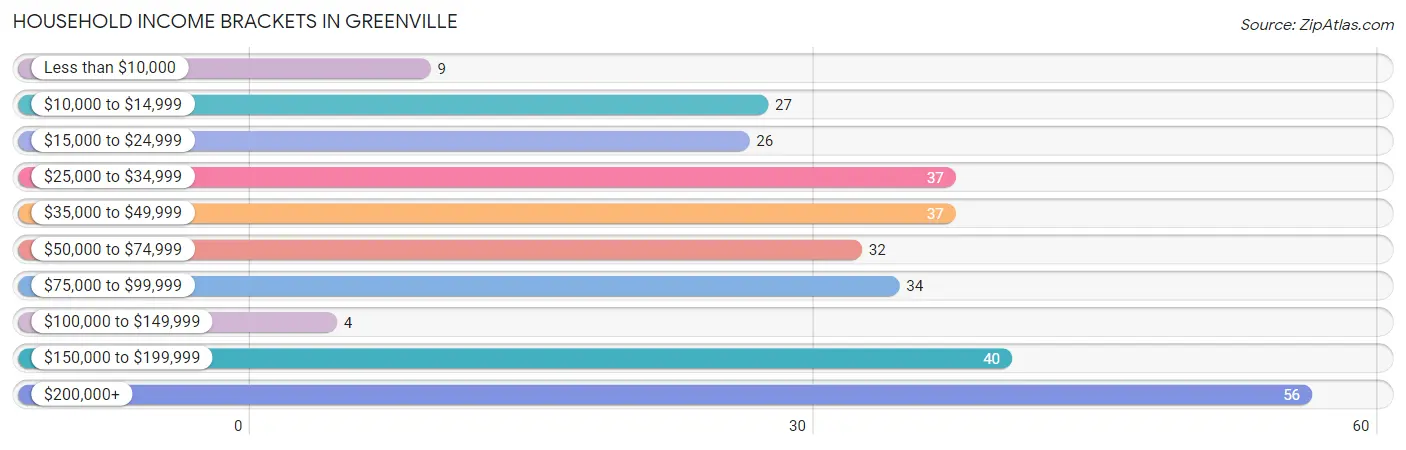
| Income Bracket | # Households | % Households |
| Less than $10,000 | 9 | 3.0% |
| $10,000 to $14,999 | 27 | 8.9% |
| $15,000 to $24,999 | 26 | 8.6% |
| $25,000 to $34,999 | 37 | 12.3% |
| $35,000 to $49,999 | 37 | 12.3% |
| $50,000 to $74,999 | 32 | 10.6% |
| $75,000 to $99,999 | 34 | 11.3% |
| $100,000 to $149,999 | 4 | 1.3% |
| $150,000 to $199,999 | 40 | 13.2% |
| $200,000+ | 56 | 18.5% |
Household Income by Householder Age in Greenville
The median household income in Greenville is $66,172, with the highest median household income of $187,969 found in the 45 to 64 years age bracket for the primary householder. A total of 153 households (50.7%) fall into this category.
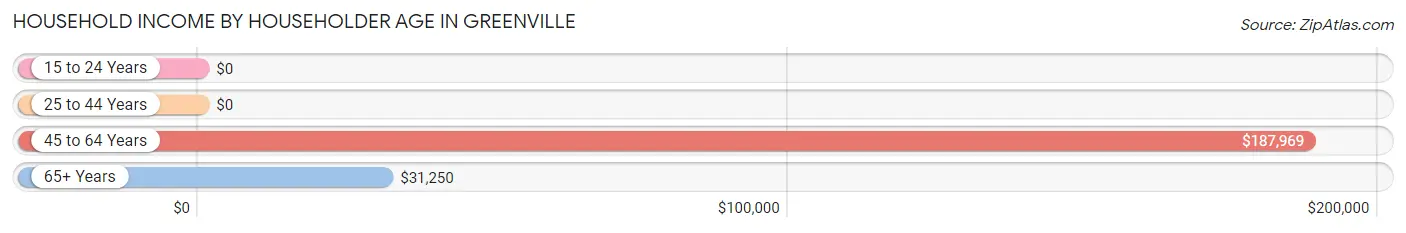
| Income Bracket | # Households | Median Income |
| 15 to 24 Years | 0 (0.0%) | $0 |
| 25 to 44 Years | 31 (10.3%) | $0 |
| 45 to 64 Years | 153 (50.7%) | $187,969 |
| 65+ Years | 118 (39.1%) | $31,250 |
| Total | 302 (100.0%) | $66,172 |
Poverty in Greenville
Income Below Poverty by Sex and Age in Greenville
With 8.8% poverty level for males and 18.6% for females among the residents of Greenville, 25 to 34 year old males and 45 to 54 year old females are the most vulnerable to poverty, with 26 males (100.0%) and 43 females (97.7%) in their respective age groups living below the poverty level.
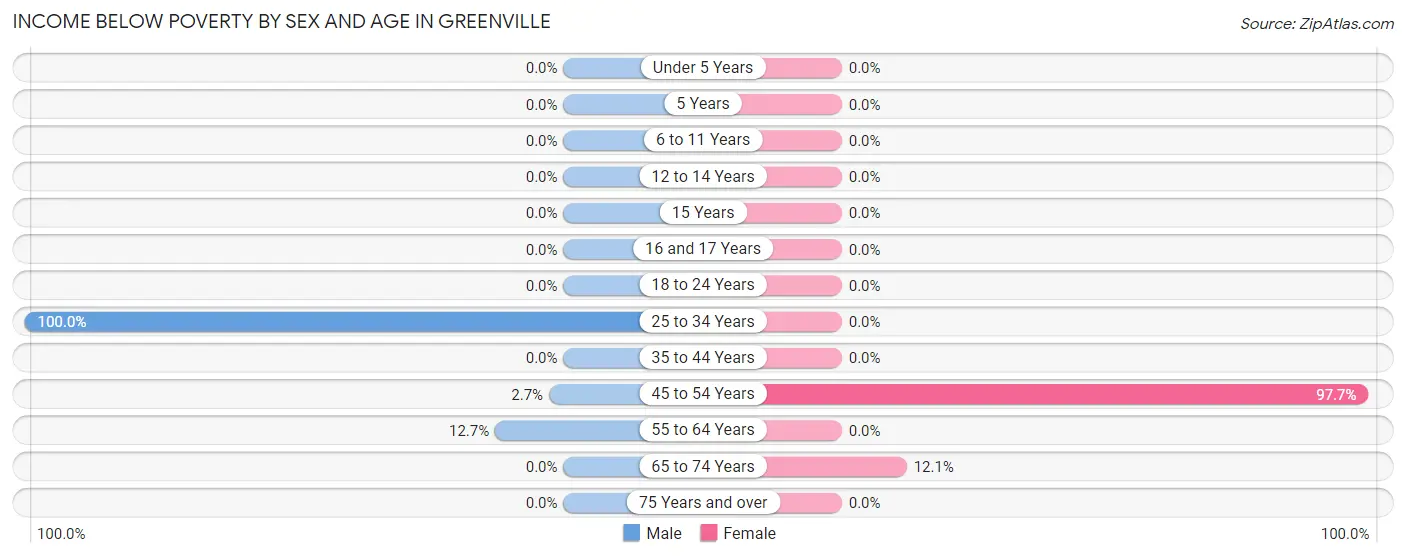
| Age Bracket | Male | Female |
| Under 5 Years | 0 (0.0%) | 0 (0.0%) |
| 5 Years | 0 (0.0%) | 0 (0.0%) |
| 6 to 11 Years | 0 (0.0%) | 0 (0.0%) |
| 12 to 14 Years | 0 (0.0%) | 0 (0.0%) |
| 15 Years | 0 (0.0%) | 0 (0.0%) |
| 16 and 17 Years | 0 (0.0%) | 0 (0.0%) |
| 18 to 24 Years | 0 (0.0%) | 0 (0.0%) |
| 25 to 34 Years | 26 (100.0%) | 0 (0.0%) |
| 35 to 44 Years | 0 (0.0%) | 0 (0.0%) |
| 45 to 54 Years | 2 (2.7%) | 43 (97.7%) |
| 55 to 64 Years | 9 (12.7%) | 0 (0.0%) |
| 65 to 74 Years | 0 (0.0%) | 10 (12.0%) |
| 75 Years and over | 0 (0.0%) | 0 (0.0%) |
| Total | 37 (8.8%) | 53 (18.6%) |
Income Above Poverty by Sex and Age in Greenville
According to the poverty statistics in Greenville, males aged 6 to 11 years and females aged 18 to 24 years are the age groups that are most secure financially, with 100.0% of males and 100.0% of females in these age groups living above the poverty line.
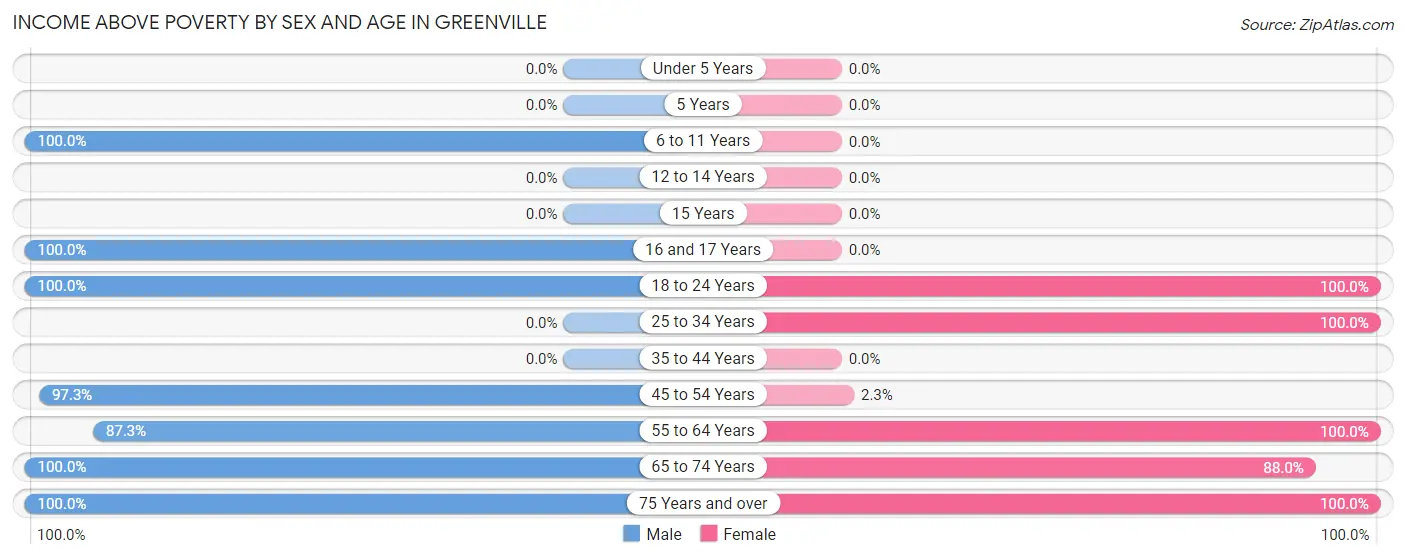
| Age Bracket | Male | Female |
| Under 5 Years | 0 (0.0%) | 0 (0.0%) |
| 5 Years | 0 (0.0%) | 0 (0.0%) |
| 6 to 11 Years | 54 (100.0%) | 0 (0.0%) |
| 12 to 14 Years | 0 (0.0%) | 0 (0.0%) |
| 15 Years | 0 (0.0%) | 0 (0.0%) |
| 16 and 17 Years | 109 (100.0%) | 0 (0.0%) |
| 18 to 24 Years | 2 (100.0%) | 3 (100.0%) |
| 25 to 34 Years | 0 (0.0%) | 80 (100.0%) |
| 35 to 44 Years | 0 (0.0%) | 0 (0.0%) |
| 45 to 54 Years | 73 (97.3%) | 1 (2.3%) |
| 55 to 64 Years | 62 (87.3%) | 67 (100.0%) |
| 65 to 74 Years | 71 (100.0%) | 73 (87.9%) |
| 75 Years and over | 12 (100.0%) | 8 (100.0%) |
| Total | 383 (91.2%) | 232 (81.4%) |
Income Below Poverty Among Married-Couple Families in Greenville
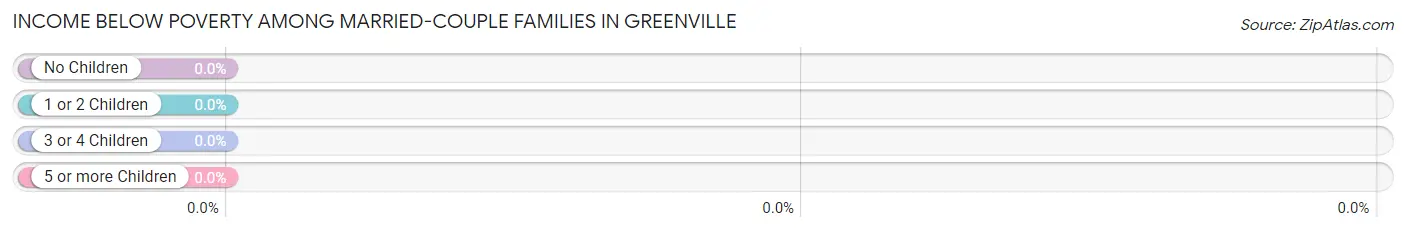
| Children | Above Poverty | Below Poverty |
| No Children | 106 (100.0%) | 0 (0.0%) |
| 1 or 2 Children | 0 (0.0%) | 0 (0.0%) |
| 3 or 4 Children | 0 (0.0%) | 0 (0.0%) |
| 5 or more Children | 0 (0.0%) | 0 (0.0%) |
| Total | 106 (100.0%) | 0 (0.0%) |
Income Below Poverty Among Single-Parent Households in Greenville
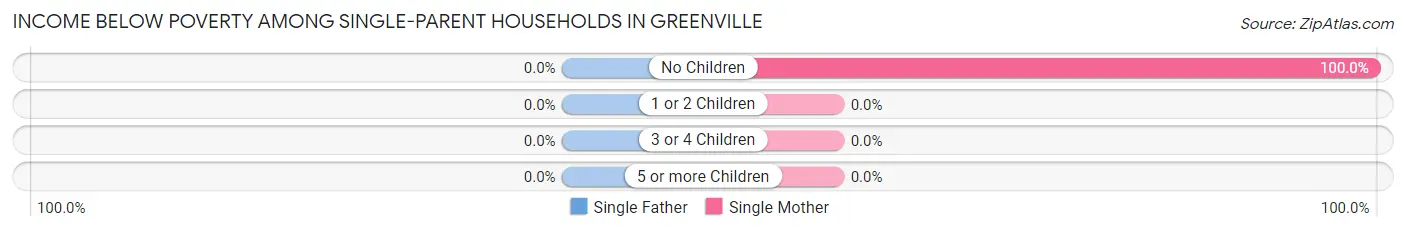
| Children | Single Father | Single Mother |
| No Children | 0 (0.0%) | 17 (100.0%) |
| 1 or 2 Children | 0 (0.0%) | 0 (0.0%) |
| 3 or 4 Children | 0 (0.0%) | 0 (0.0%) |
| 5 or more Children | 0 (0.0%) | 0 (0.0%) |
| Total | 0 (0.0%) | 17 (35.4%) |
Income Below Poverty Among Married-Couple vs Single-Parent Households in Greenville
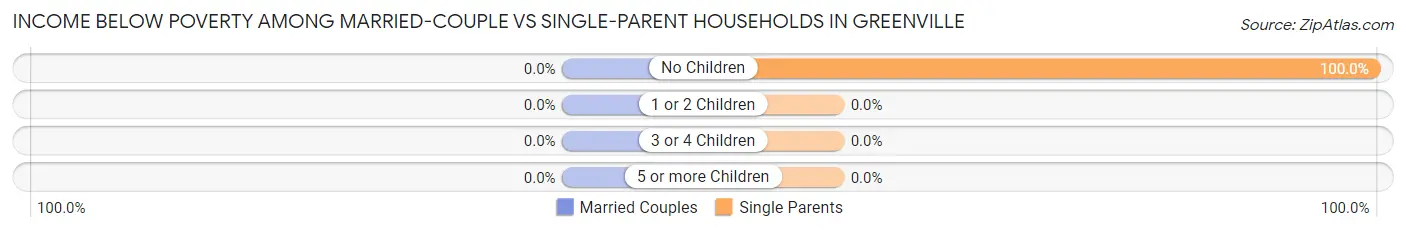
| Children | Married-Couple Families | Single-Parent Households |
| No Children | 0 (0.0%) | 17 (100.0%) |
| 1 or 2 Children | 0 (0.0%) | 0 (0.0%) |
| 3 or 4 Children | 0 (0.0%) | 0 (0.0%) |
| 5 or more Children | 0 (0.0%) | 0 (0.0%) |
| Total | 0 (0.0%) | 17 (19.3%) |
Race in Greenville
The most populous races in Greenville are White / Caucasian (600 | 85.1%), Two or more Races (60 | 8.5%), and Asian (43 | 6.1%).
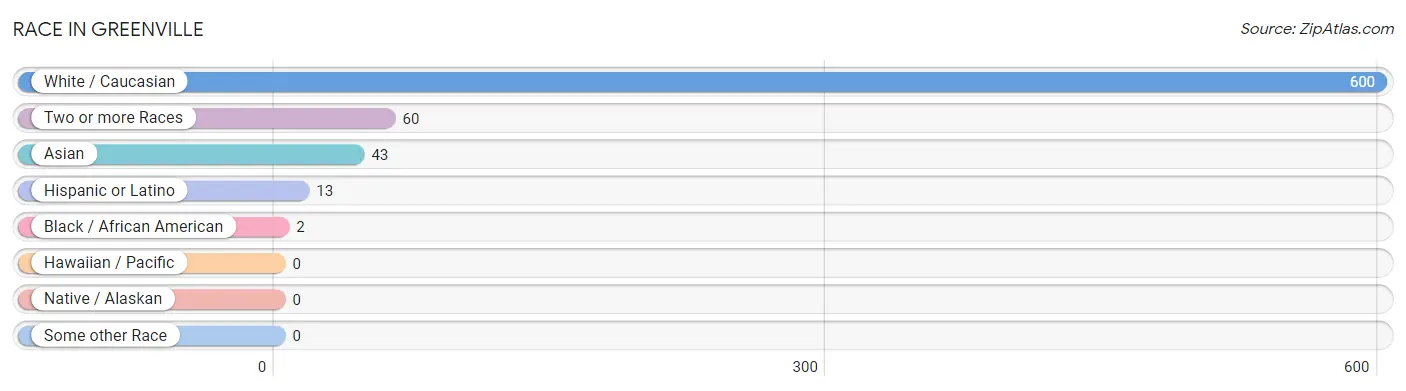
| Race | # Population | % Population |
| Asian | 43 | 6.1% |
| Black / African American | 2 | 0.3% |
| Hawaiian / Pacific | 0 | 0.0% |
| Hispanic or Latino | 13 | 1.8% |
| Native / Alaskan | 0 | 0.0% |
| White / Caucasian | 600 | 85.1% |
| Two or more Races | 60 | 8.5% |
| Some other Race | 0 | 0.0% |
| Total | 705 | 100.0% |
Ancestry in Greenville
The most populous ancestries reported in Greenville are Scottish (134 | 19.0%), German (111 | 15.7%), English (48 | 6.8%), Indian (Asian) (43 | 6.1%), and Irish (42 | 6.0%), together accounting for 53.6% of all Greenville residents.
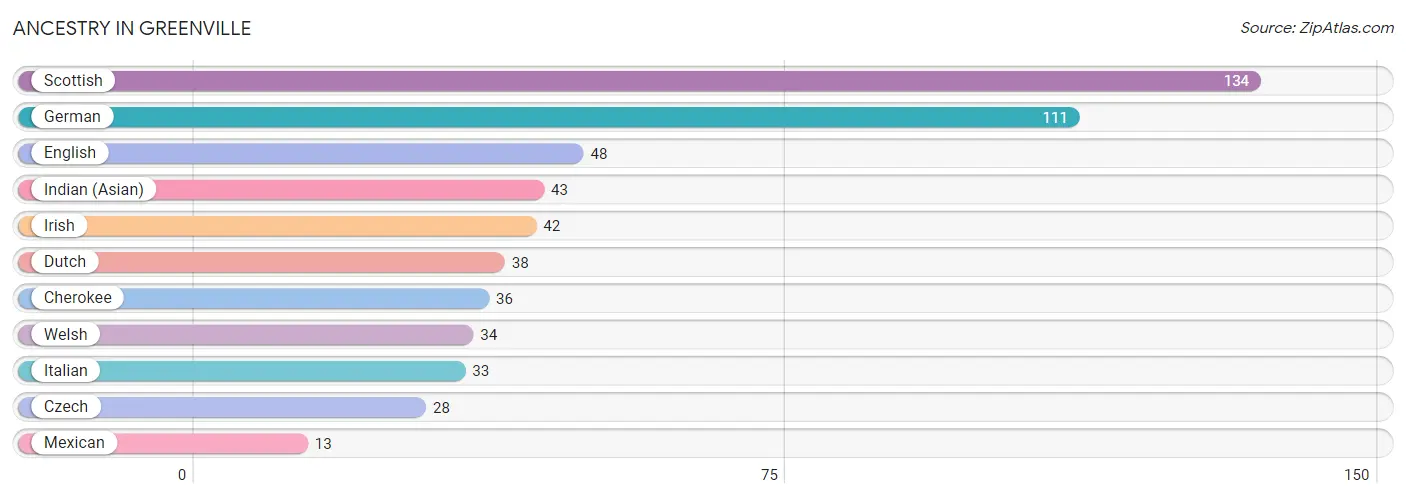
| Ancestry | # Population | % Population |
| Cherokee | 36 | 5.1% |
| Czech | 28 | 4.0% |
| Dutch | 38 | 5.4% |
| English | 48 | 6.8% |
| German | 111 | 15.7% |
| Indian (Asian) | 43 | 6.1% |
| Irish | 42 | 6.0% |
| Italian | 33 | 4.7% |
| Mexican | 13 | 1.8% |
| Scottish | 134 | 19.0% |
| Welsh | 34 | 4.8% | View All 11 Rows |
Immigrants in Greenville
The most numerous immigrant groups reported in Greenville came from Asia (43 | 6.1%), China (43 | 6.1%), Eastern Asia (43 | 6.1%), Central America (13 | 1.8%), and Latin America (13 | 1.8%), together accounting for 22.0% of all Greenville residents.
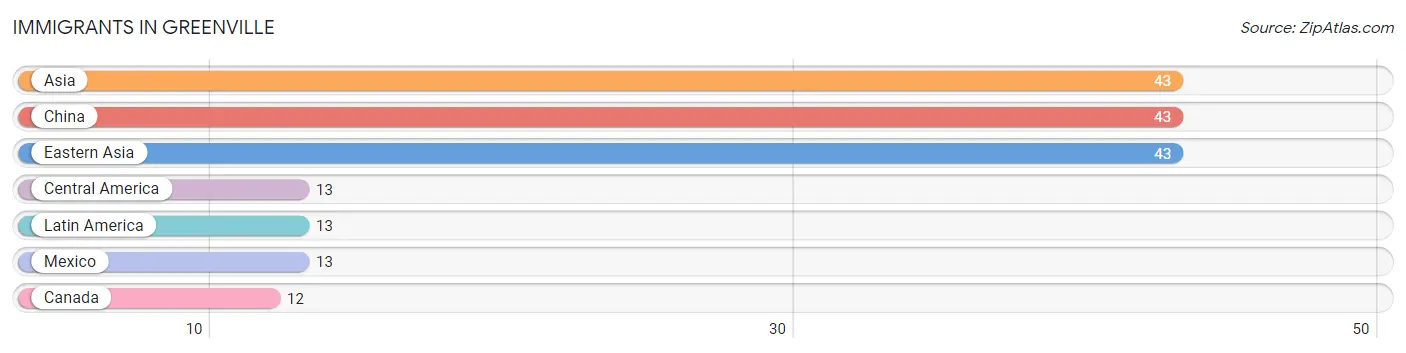
| Immigration Origin | # Population | % Population |
| Asia | 43 | 6.1% |
| Canada | 12 | 1.7% |
| Central America | 13 | 1.8% |
| China | 43 | 6.1% |
| Eastern Asia | 43 | 6.1% |
| Latin America | 13 | 1.8% |
| Mexico | 13 | 1.8% | View All 7 Rows |
Sex and Age in Greenville
Sex and Age in Greenville
The most populous age groups in Greenville are 15 to 19 Years (109 | 26.0%) for men and 65 to 69 Years (81 | 28.4%) for women.
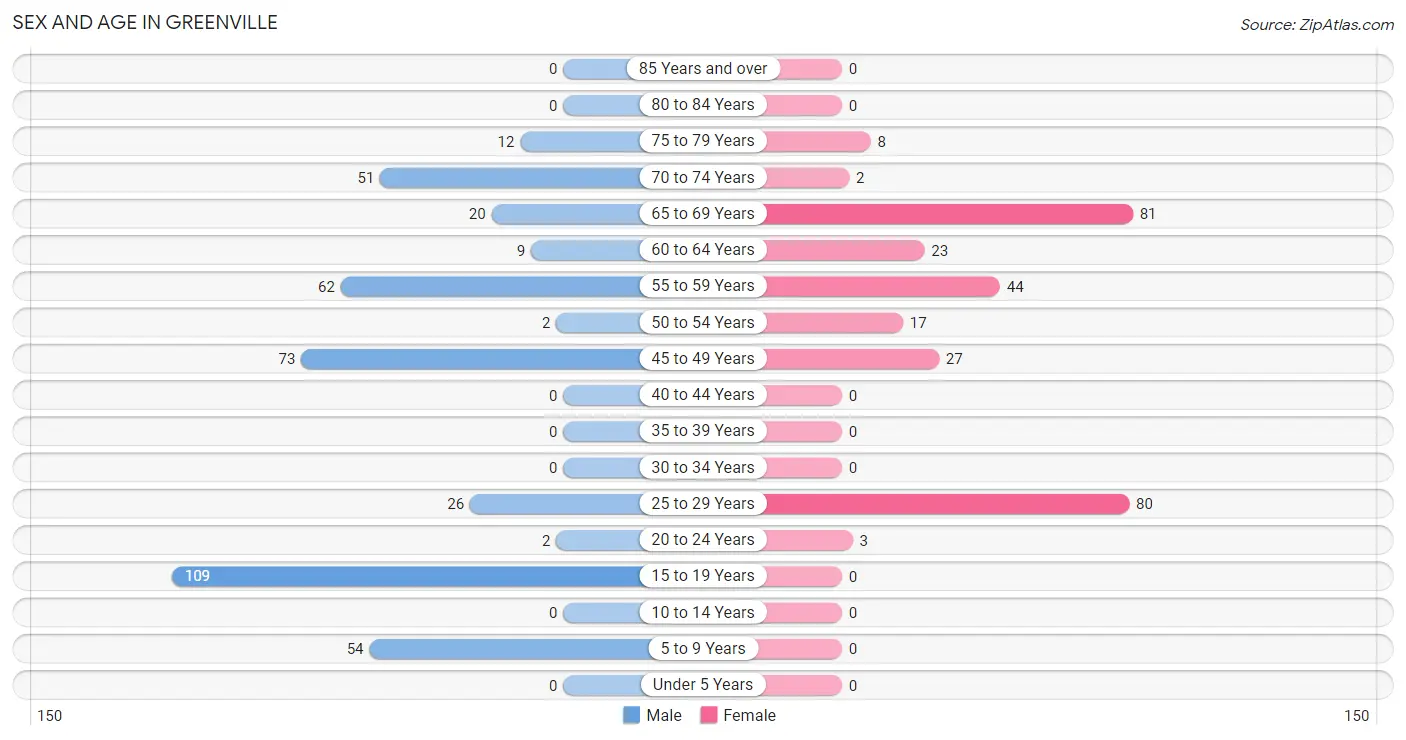
| Age Bracket | Male | Female |
| Under 5 Years | 0 (0.0%) | 0 (0.0%) |
| 5 to 9 Years | 54 (12.9%) | 0 (0.0%) |
| 10 to 14 Years | 0 (0.0%) | 0 (0.0%) |
| 15 to 19 Years | 109 (26.0%) | 0 (0.0%) |
| 20 to 24 Years | 2 (0.5%) | 3 (1.1%) |
| 25 to 29 Years | 26 (6.2%) | 80 (28.1%) |
| 30 to 34 Years | 0 (0.0%) | 0 (0.0%) |
| 35 to 39 Years | 0 (0.0%) | 0 (0.0%) |
| 40 to 44 Years | 0 (0.0%) | 0 (0.0%) |
| 45 to 49 Years | 73 (17.4%) | 27 (9.5%) |
| 50 to 54 Years | 2 (0.5%) | 17 (6.0%) |
| 55 to 59 Years | 62 (14.8%) | 44 (15.4%) |
| 60 to 64 Years | 9 (2.1%) | 23 (8.1%) |
| 65 to 69 Years | 20 (4.8%) | 81 (28.4%) |
| 70 to 74 Years | 51 (12.1%) | 2 (0.7%) |
| 75 to 79 Years | 12 (2.9%) | 8 (2.8%) |
| 80 to 84 Years | 0 (0.0%) | 0 (0.0%) |
| 85 Years and over | 0 (0.0%) | 0 (0.0%) |
| Total | 420 (100.0%) | 285 (100.0%) |
Families and Households in Greenville
Median Family Size in Greenville
The median family size in Greenville is 2.91 persons per family, with single male/father families (40 | 20.6%) accounting for the largest median family size of 3.73 persons per family. On the other hand, married-couple families (106 | 54.6%) represent the smallest median family size with 2.25 persons per family.
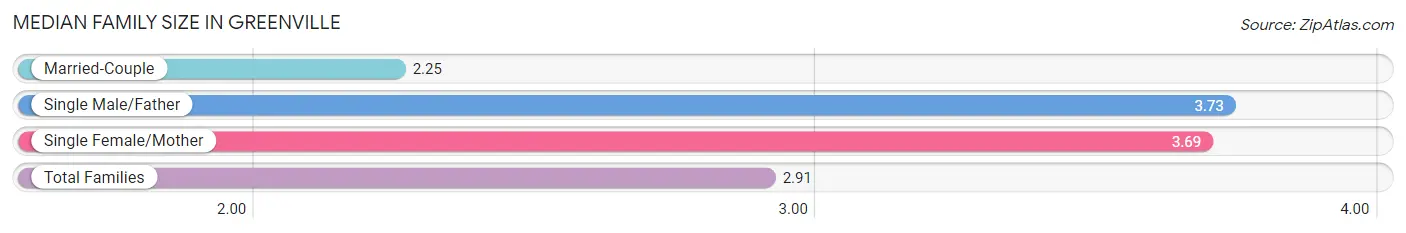
| Family Type | # Families | Family Size |
| Married-Couple | 106 (54.6%) | 2.25 |
| Single Male/Father | 40 (20.6%) | 3.73 |
| Single Female/Mother | 48 (24.7%) | 3.69 |
| Total Families | 194 (100.0%) | 2.91 |
Median Household Size in Greenville
The median household size in Greenville is 2.33 persons per household, with single male/father households (40 | 13.3%) accounting for the largest median household size of 3.73 persons per household. non-family households (108 | 35.8%) represent the smallest median household size with 1.29 persons per household.
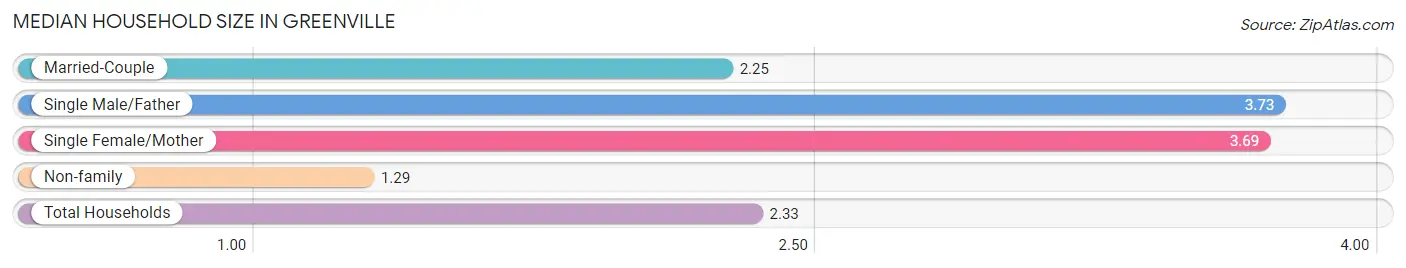
| Household Type | # Households | Household Size |
| Married-Couple | 106 (35.1%) | 2.25 |
| Single Male/Father | 40 (13.3%) | 3.73 |
| Single Female/Mother | 48 (15.9%) | 3.69 |
| Non-family | 108 (35.8%) | 1.29 |
| Total Households | 302 (100.0%) | 2.33 |
Household Size by Marriage Status in Greenville
Out of a total of 302 households in Greenville, 194 (64.2%) are family households, while 108 (35.8%) are nonfamily households. The most numerous type of family households are 2-person households, comprising 162, and the most common type of nonfamily households are 1-person households, comprising 82.
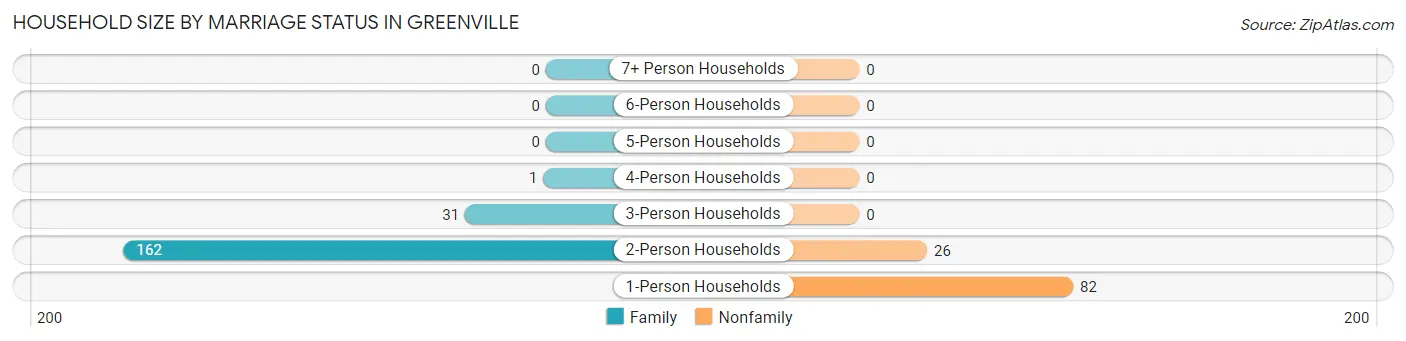
| Household Size | Family Households | Nonfamily Households |
| 1-Person Households | - | 82 (27.2%) |
| 2-Person Households | 162 (53.6%) | 26 (8.6%) |
| 3-Person Households | 31 (10.3%) | 0 (0.0%) |
| 4-Person Households | 1 (0.3%) | 0 (0.0%) |
| 5-Person Households | 0 (0.0%) | 0 (0.0%) |
| 6-Person Households | 0 (0.0%) | 0 (0.0%) |
| 7+ Person Households | 0 (0.0%) | 0 (0.0%) |
| Total | 194 (64.2%) | 108 (35.8%) |
Female Fertility in Greenville
Fertility by Age in Greenville
| Age Bracket | Women with Births | Births / 1,000 Women |
| 15 to 19 years | 0 (0.0%) | 0.0 |
| 20 to 34 years | 0 (0.0%) | 0.0 |
| 35 to 50 years | 0 (0.0%) | 0.0 |
| Total | 0 (0.0%) | 0.0 |
Fertility by Age by Marriage Status in Greenville
| Age Bracket | Married | Unmarried |
| 15 to 19 years | 0 (0.0%) | 0 (0.0%) |
| 20 to 34 years | 0 (0.0%) | 0 (0.0%) |
| 35 to 50 years | 0 (0.0%) | 0 (0.0%) |
| Total | 0 (0.0%) | 0 (0.0%) |
Fertility by Education in Greenville
| Educational Attainment | Women with Births | Births / 1,000 Women |
| Less than High School | 0 (0.0%) | 0.0 |
| High School Diploma | 0 (0.0%) | 0.0 |
| College or Associate's Degree | 0 (0.0%) | 0.0 |
| Bachelor's Degree | 0 (0.0%) | 0.0 |
| Graduate Degree | 0 (0.0%) | 0.0 |
| Total | 0 (0.0%) | 0.0 |
Fertility by Education by Marriage Status in Greenville
| Educational Attainment | Married | Unmarried |
| Less than High School | 0 (0.0%) | 0 (0.0%) |
| High School Diploma | 0 (0.0%) | 0 (0.0%) |
| College or Associate's Degree | 0 (0.0%) | 0 (0.0%) |
| Bachelor's Degree | 0 (0.0%) | 0 (0.0%) |
| Graduate Degree | 0 (0.0%) | 0 (0.0%) |
| Total | 0 (0.0%) | 0 (0.0%) |
Employment Characteristics in Greenville
Employment by Class of Employer in Greenville
Among the 452 employed individuals in Greenville, private company employees (240 | 53.1%), local government employees (133 | 29.4%), and self-employed (not incorporated) (75 | 16.6%) make up the most common classes of employment.
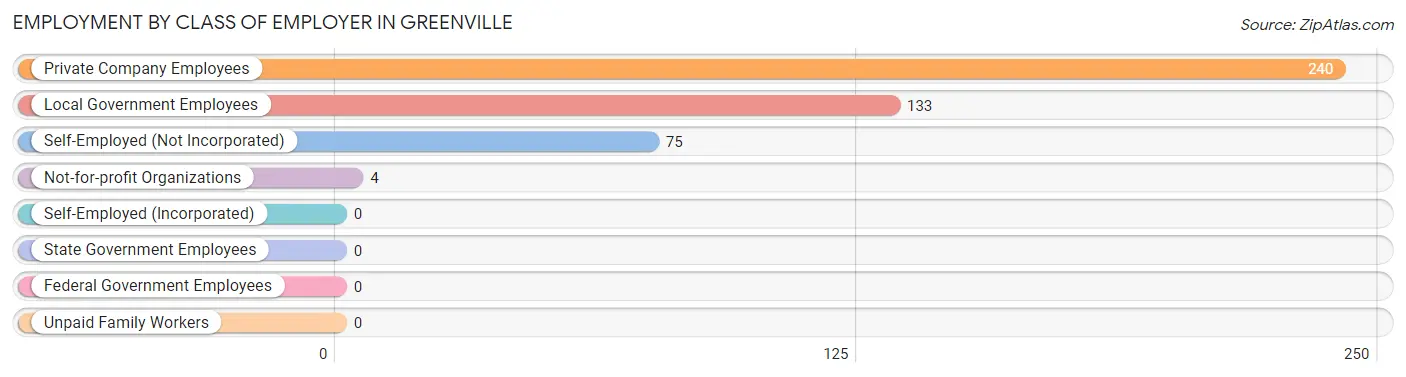
| Employer Class | # Employees | % Employees |
| Private Company Employees | 240 | 53.1% |
| Self-Employed (Incorporated) | 0 | 0.0% |
| Self-Employed (Not Incorporated) | 75 | 16.6% |
| Not-for-profit Organizations | 4 | 0.9% |
| Local Government Employees | 133 | 29.4% |
| State Government Employees | 0 | 0.0% |
| Federal Government Employees | 0 | 0.0% |
| Unpaid Family Workers | 0 | 0.0% |
| Total | 452 | 100.0% |
Employment Status by Age in Greenville
According to the labor force statistics for Greenville, out of the total population over 16 years of age (651), 81.7% or 532 individuals are in the labor force, with 15.0% or 80 of them unemployed. The age group with the highest labor force participation rate is 16 to 19 years, with 100.0% or 109 individuals in the labor force. Within the labor force, the 25 to 29 years age range has the highest percentage of unemployed individuals, with 100.0% or 80 of them being unemployed.
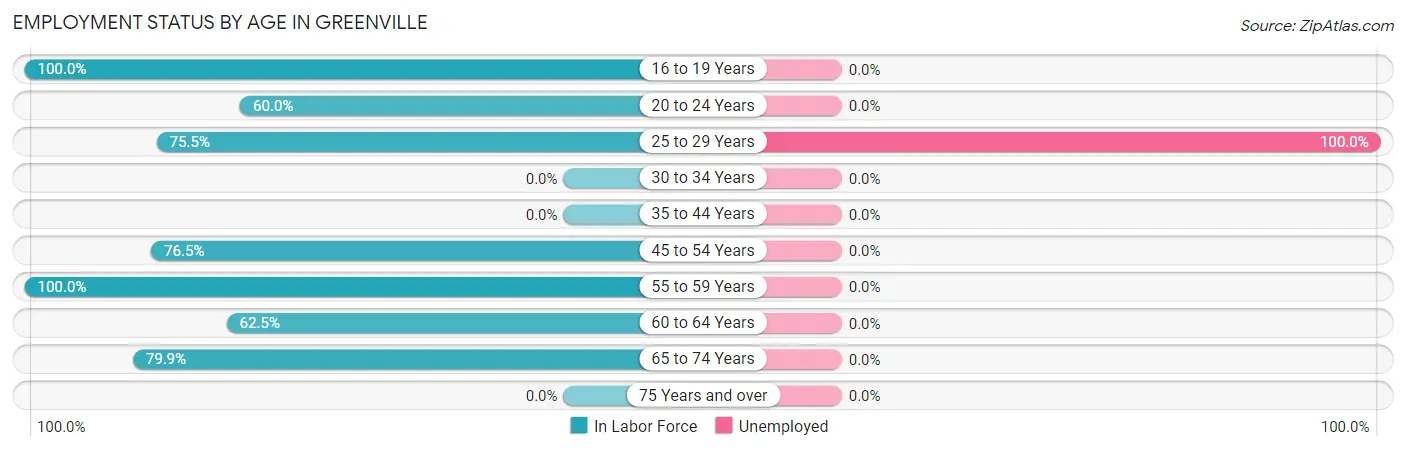
| Age Bracket | In Labor Force | Unemployed |
| 16 to 19 Years | 109 (100.0%) | 0 (0.0%) |
| 20 to 24 Years | 3 (60.0%) | 0 (0.0%) |
| 25 to 29 Years | 80 (75.5%) | 80 (100.0%) |
| 30 to 34 Years | 0 (0.0%) | 0 (0.0%) |
| 35 to 44 Years | 0 (0.0%) | 0 (0.0%) |
| 45 to 54 Years | 91 (76.5%) | 0 (0.0%) |
| 55 to 59 Years | 106 (100.0%) | 0 (0.0%) |
| 60 to 64 Years | 20 (62.5%) | 0 (0.0%) |
| 65 to 74 Years | 123 (79.9%) | 0 (0.0%) |
| 75 Years and over | 0 (0.0%) | 0 (0.0%) |
| Total | 532 (81.7%) | 80 (15.0%) |
Employment Status by Educational Attainment in Greenville
According to labor force statistics for Greenville, 81.8% of individuals (297) out of the total population between 25 and 64 years of age (363) are in the labor force, with 26.9% or 80 of them being unemployed. The group with the highest labor force participation rate are those with the educational attainment of bachelor's degree or higher, with 100.0% or 42 individuals in the labor force. Within the labor force, individuals with college / associate degree education have the highest percentage of unemployment, with 39.6% or 80 of them being unemployed.
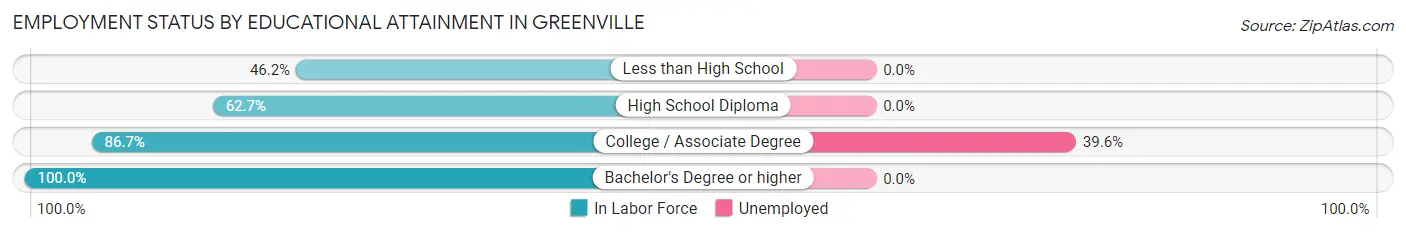
| Educational Attainment | In Labor Force | Unemployed |
| Less than High School | 6 (46.2%) | 0 (0.0%) |
| High School Diploma | 47 (62.7%) | 0 (0.0%) |
| College / Associate Degree | 202 (86.7%) | 92 (39.6%) |
| Bachelor's Degree or higher | 42 (100.0%) | 0 (0.0%) |
| Total | 297 (81.8%) | 98 (26.9%) |
Employment Occupations by Sex in Greenville
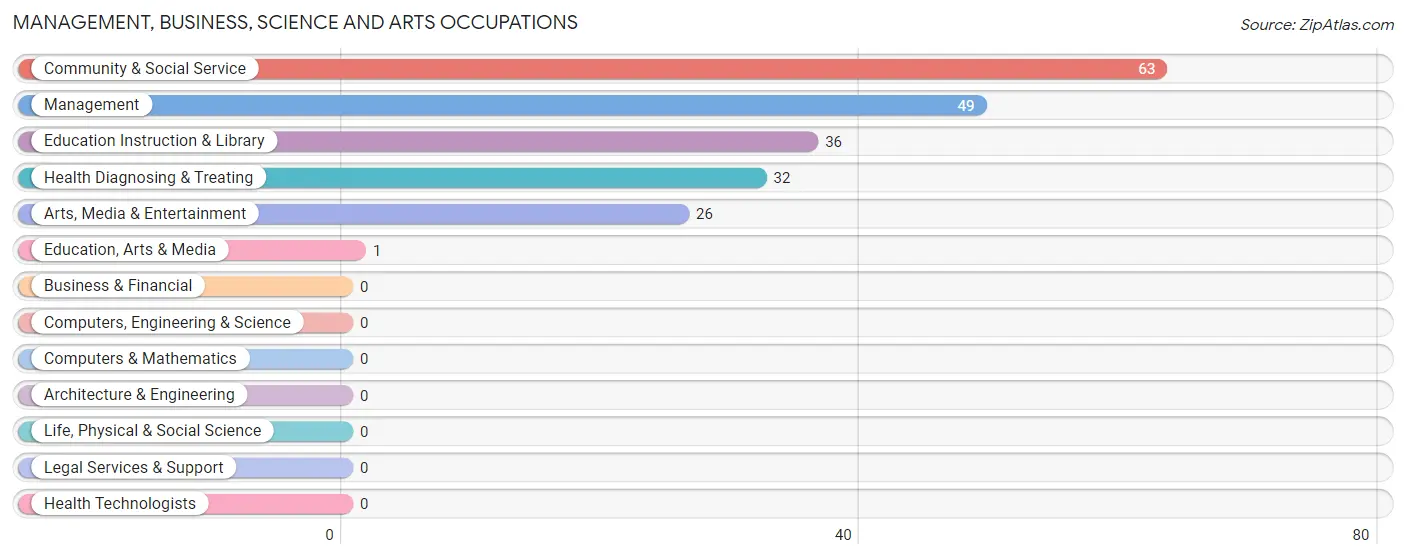
Management, Business, Science and Arts Occupations
The most common Management, Business, Science and Arts occupations in Greenville are Community & Social Service (63 | 13.9%), Management (49 | 10.8%), Education Instruction & Library (36 | 8.0%), Health Diagnosing & Treating (32 | 7.1%), and Arts, Media & Entertainment (26 | 5.8%).
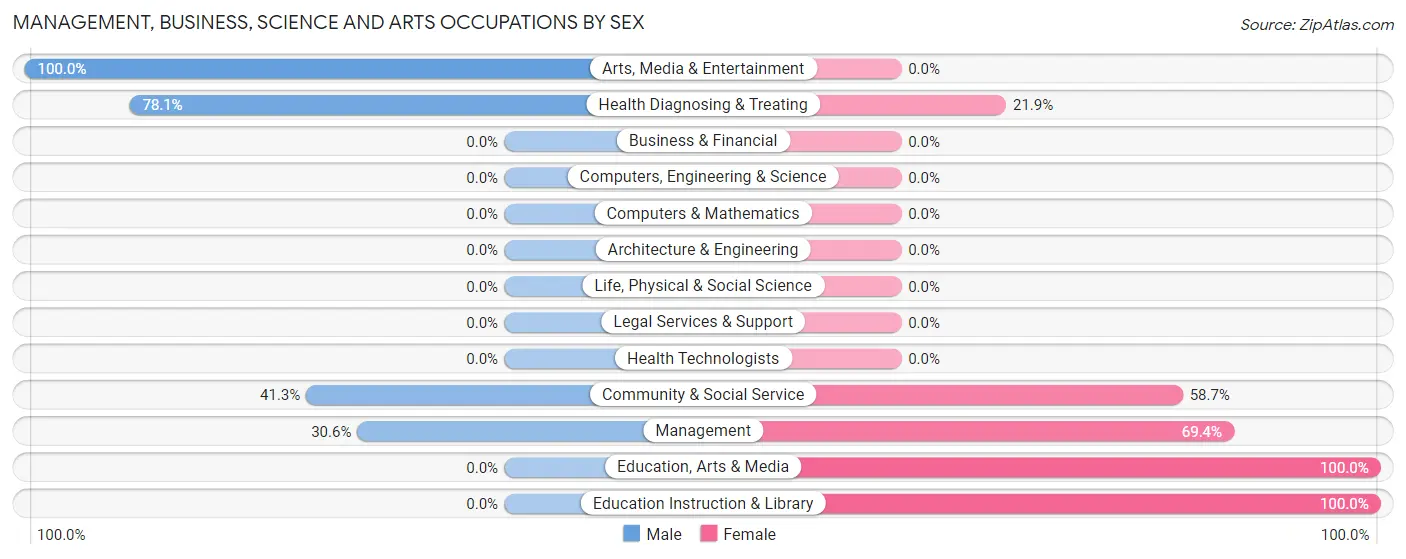
Management, Business, Science and Arts Occupations by Sex
Within the Management, Business, Science and Arts occupations in Greenville, the most male-oriented occupations are Arts, Media & Entertainment (100.0%), Health Diagnosing & Treating (78.1%), and Community & Social Service (41.3%), while the most female-oriented occupations are Education, Arts & Media (100.0%), Education Instruction & Library (100.0%), and Management (69.4%).
| Occupation | Male | Female |
| Management | 15 (30.6%) | 34 (69.4%) |
| Business & Financial | 0 (0.0%) | 0 (0.0%) |
| Computers, Engineering & Science | 0 (0.0%) | 0 (0.0%) |
| Computers & Mathematics | 0 (0.0%) | 0 (0.0%) |
| Architecture & Engineering | 0 (0.0%) | 0 (0.0%) |
| Life, Physical & Social Science | 0 (0.0%) | 0 (0.0%) |
| Community & Social Service | 26 (41.3%) | 37 (58.7%) |
| Education, Arts & Media | 0 (0.0%) | 1 (100.0%) |
| Legal Services & Support | 0 (0.0%) | 0 (0.0%) |
| Education Instruction & Library | 0 (0.0%) | 36 (100.0%) |
| Arts, Media & Entertainment | 26 (100.0%) | 0 (0.0%) |
| Health Diagnosing & Treating | 25 (78.1%) | 7 (21.9%) |
| Health Technologists | 0 (0.0%) | 0 (0.0%) |
| Total (Category) | 66 (45.8%) | 78 (54.2%) |
| Total (Overall) | 309 (68.4%) | 143 (31.6%) |
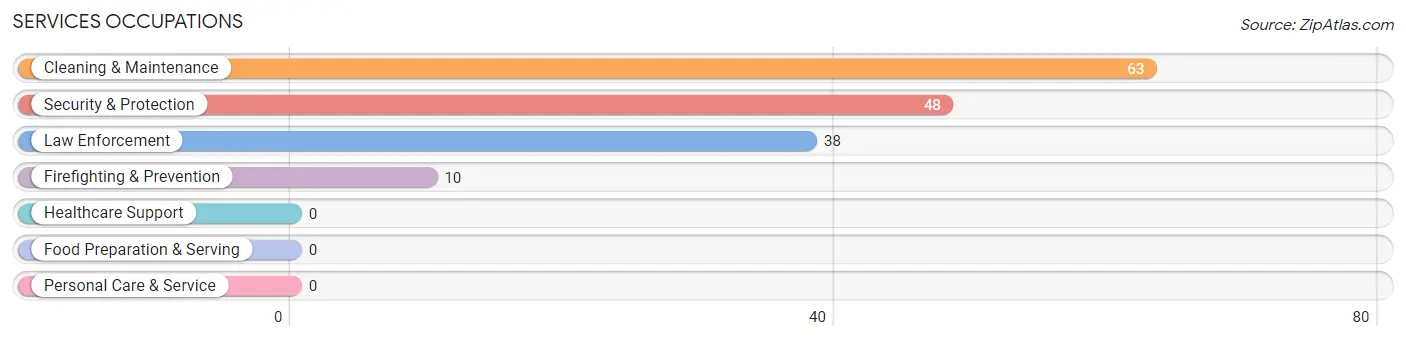
Services Occupations
The most common Services occupations in Greenville are Cleaning & Maintenance (63 | 13.9%), Security & Protection (48 | 10.6%), Law Enforcement (38 | 8.4%), and Firefighting & Prevention (10 | 2.2%).
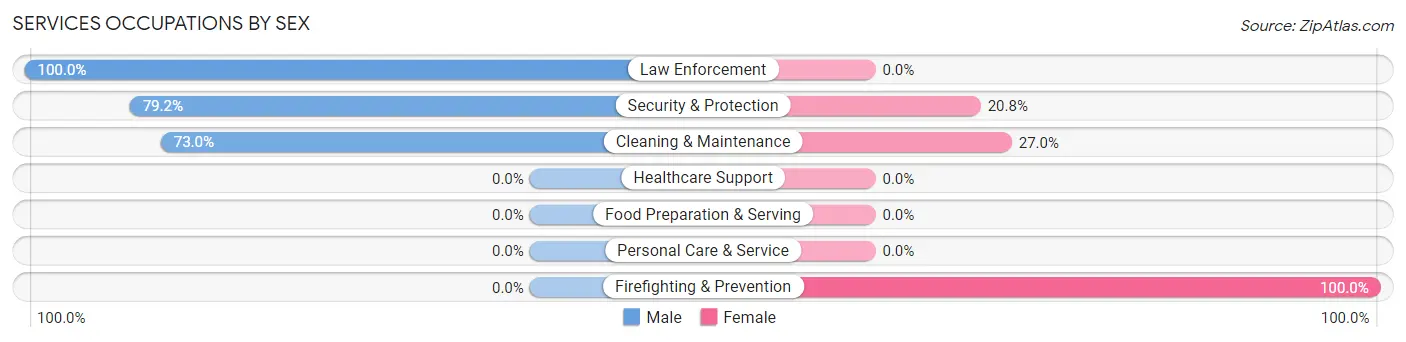
Services Occupations by Sex
Within the Services occupations in Greenville, the most male-oriented occupations are Law Enforcement (100.0%), Security & Protection (79.2%), and Cleaning & Maintenance (73.0%), while the most female-oriented occupations are Firefighting & Prevention (100.0%), Cleaning & Maintenance (27.0%), and Security & Protection (20.8%).
| Occupation | Male | Female |
| Healthcare Support | 0 (0.0%) | 0 (0.0%) |
| Security & Protection | 38 (79.2%) | 10 (20.8%) |
| Firefighting & Prevention | 0 (0.0%) | 10 (100.0%) |
| Law Enforcement | 38 (100.0%) | 0 (0.0%) |
| Food Preparation & Serving | 0 (0.0%) | 0 (0.0%) |
| Cleaning & Maintenance | 46 (73.0%) | 17 (27.0%) |
| Personal Care & Service | 0 (0.0%) | 0 (0.0%) |
| Total (Category) | 84 (75.7%) | 27 (24.3%) |
| Total (Overall) | 309 (68.4%) | 143 (31.6%) |
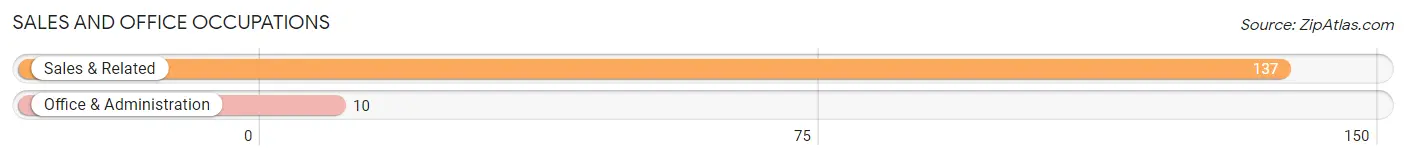
Sales and Office Occupations
The most common Sales and Office occupations in Greenville are Sales & Related (137 | 30.3%), and Office & Administration (10 | 2.2%).
Sales and Office Occupations by Sex
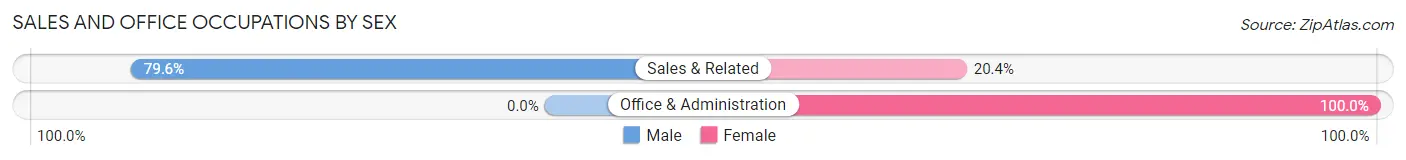
| Occupation | Male | Female |
| Sales & Related | 109 (79.6%) | 28 (20.4%) |
| Office & Administration | 0 (0.0%) | 10 (100.0%) |
| Total (Category) | 109 (74.2%) | 38 (25.9%) |
| Total (Overall) | 309 (68.4%) | 143 (31.6%) |
Natural Resources, Construction and Maintenance Occupations
The most common Natural Resources, Construction and Maintenance occupations in Greenville are Construction & Extraction (31 | 6.9%), and Installation, Maintenance & Repair (9 | 2.0%).

Natural Resources, Construction and Maintenance Occupations by Sex
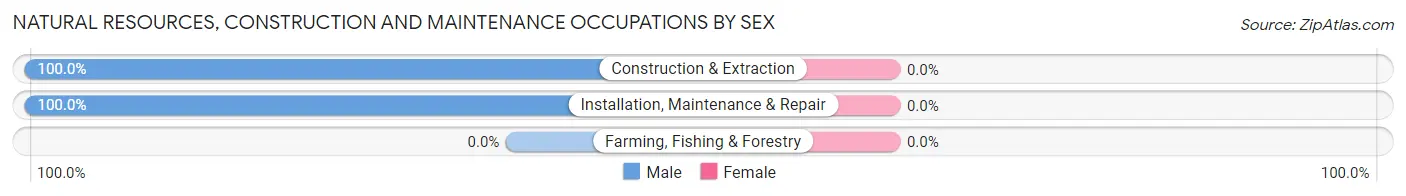
| Occupation | Male | Female |
| Farming, Fishing & Forestry | 0 (0.0%) | 0 (0.0%) |
| Construction & Extraction | 31 (100.0%) | 0 (0.0%) |
| Installation, Maintenance & Repair | 9 (100.0%) | 0 (0.0%) |
| Total (Category) | 40 (100.0%) | 0 (0.0%) |
| Total (Overall) | 309 (68.4%) | 143 (31.6%) |
Production, Transportation and Moving Occupations
The most common Production, Transportation and Moving occupations in Greenville are , and Production (10 | 2.2%).
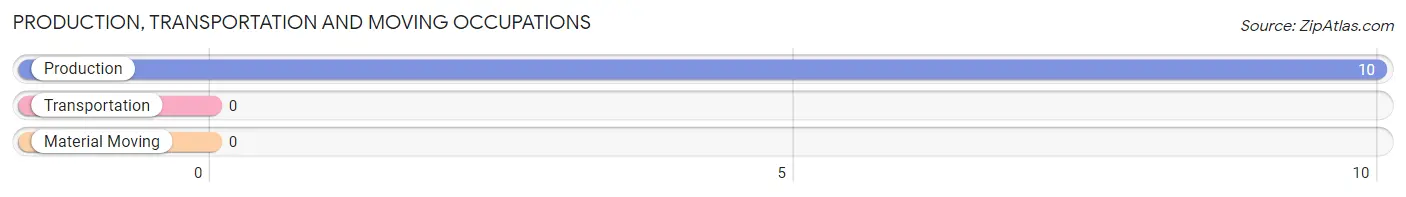
Production, Transportation and Moving Occupations by Sex
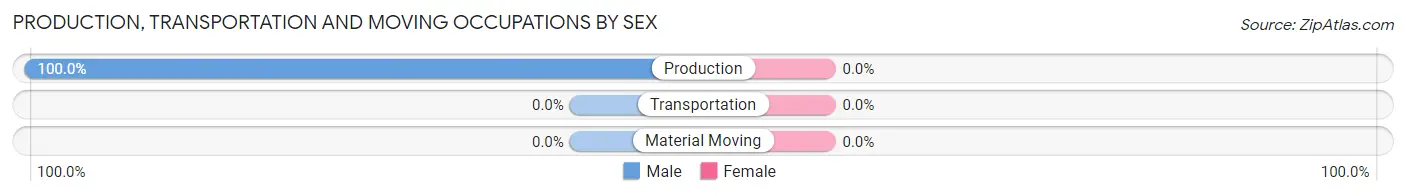
| Occupation | Male | Female |
| Production | 10 (100.0%) | 0 (0.0%) |
| Transportation | 0 (0.0%) | 0 (0.0%) |
| Material Moving | 0 (0.0%) | 0 (0.0%) |
| Total (Category) | 10 (100.0%) | 0 (0.0%) |
| Total (Overall) | 309 (68.4%) | 143 (31.6%) |
Employment Industries by Sex in Greenville
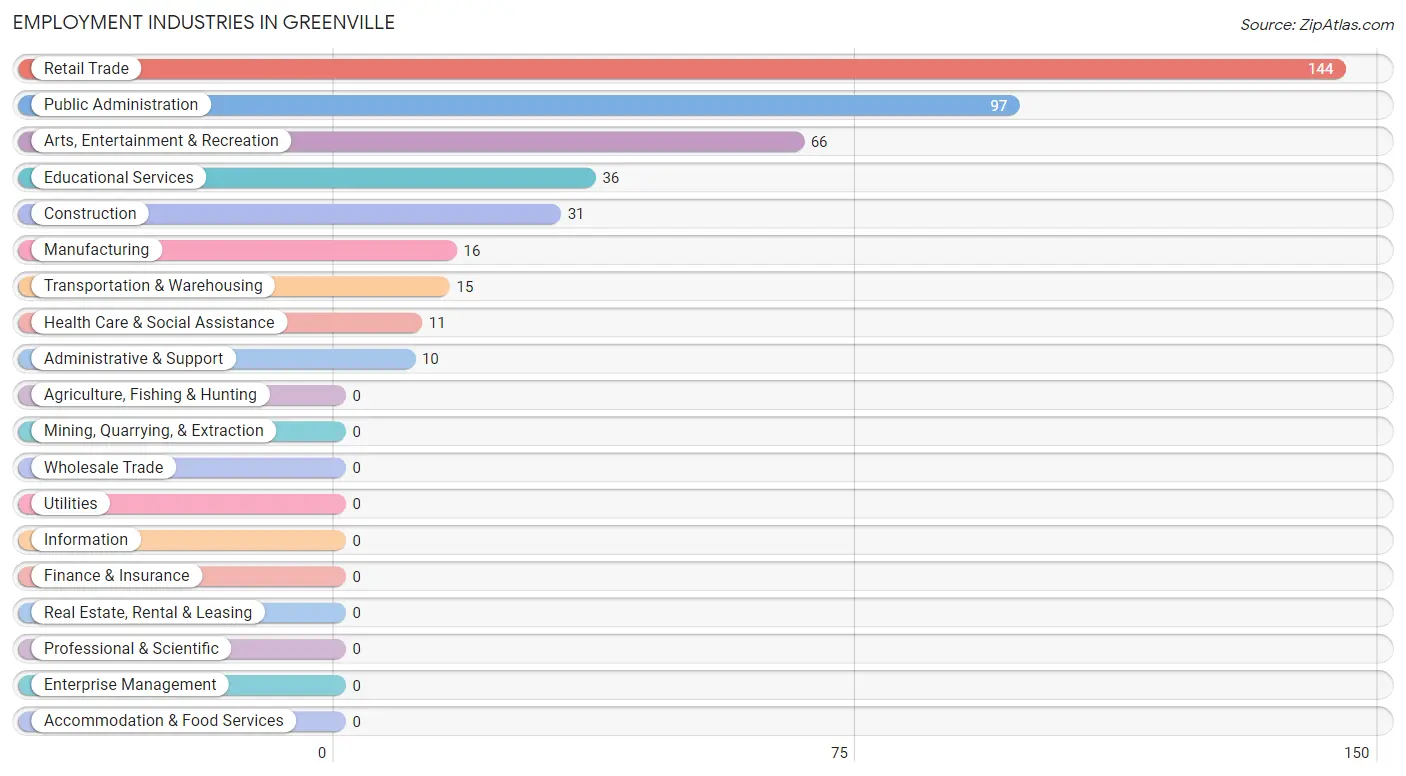
Employment Industries in Greenville
The major employment industries in Greenville include Retail Trade (144 | 31.9%), Public Administration (97 | 21.5%), Arts, Entertainment & Recreation (66 | 14.6%), Educational Services (36 | 8.0%), and Construction (31 | 6.9%).
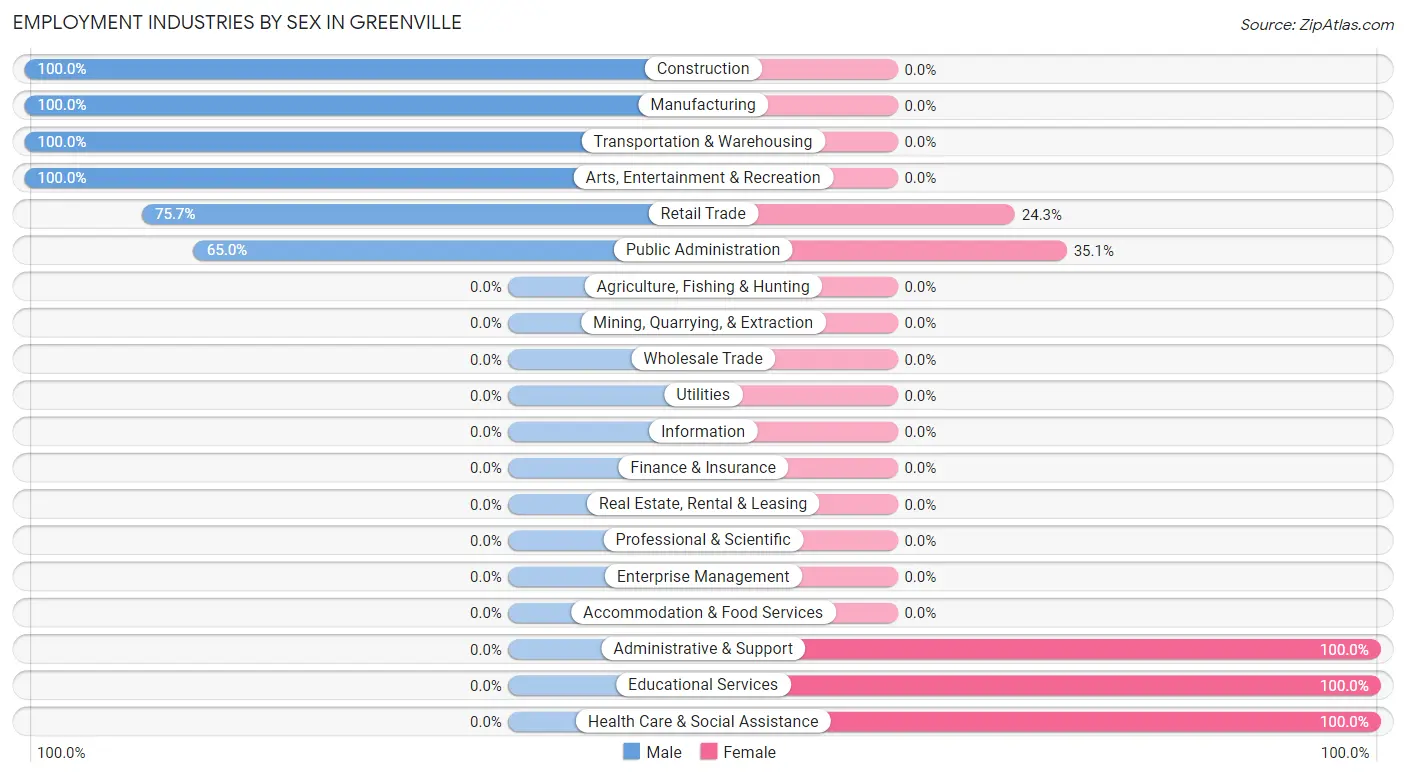
Employment Industries by Sex in Greenville
The Greenville industries that see more men than women are Construction (100.0%), Manufacturing (100.0%), and Transportation & Warehousing (100.0%), whereas the industries that tend to have a higher number of women are Administrative & Support (100.0%), Educational Services (100.0%), and Health Care & Social Assistance (100.0%).
| Industry | Male | Female |
| Agriculture, Fishing & Hunting | 0 (0.0%) | 0 (0.0%) |
| Mining, Quarrying, & Extraction | 0 (0.0%) | 0 (0.0%) |
| Construction | 31 (100.0%) | 0 (0.0%) |
| Manufacturing | 16 (100.0%) | 0 (0.0%) |
| Wholesale Trade | 0 (0.0%) | 0 (0.0%) |
| Retail Trade | 109 (75.7%) | 35 (24.3%) |
| Transportation & Warehousing | 15 (100.0%) | 0 (0.0%) |
| Utilities | 0 (0.0%) | 0 (0.0%) |
| Information | 0 (0.0%) | 0 (0.0%) |
| Finance & Insurance | 0 (0.0%) | 0 (0.0%) |
| Real Estate, Rental & Leasing | 0 (0.0%) | 0 (0.0%) |
| Professional & Scientific | 0 (0.0%) | 0 (0.0%) |
| Enterprise Management | 0 (0.0%) | 0 (0.0%) |
| Administrative & Support | 0 (0.0%) | 10 (100.0%) |
| Educational Services | 0 (0.0%) | 36 (100.0%) |
| Health Care & Social Assistance | 0 (0.0%) | 11 (100.0%) |
| Arts, Entertainment & Recreation | 66 (100.0%) | 0 (0.0%) |
| Accommodation & Food Services | 0 (0.0%) | 0 (0.0%) |
| Public Administration | 63 (64.9%) | 34 (35.0%) |
| Total | 309 (68.4%) | 143 (31.6%) |
Education in Greenville
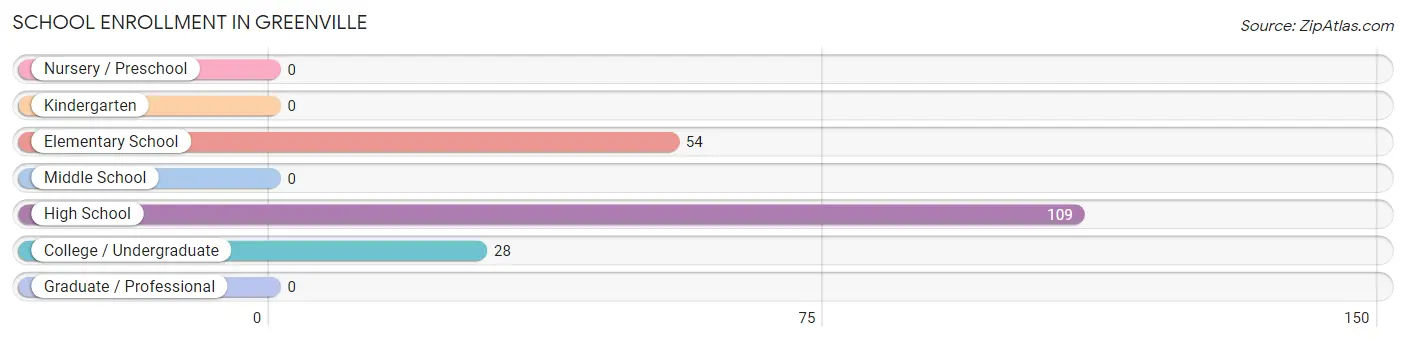
School Enrollment in Greenville
The most common levels of schooling among the 191 students in Greenville are high school (109 | 57.1%), elementary school (54 | 28.3%), and college / undergraduate (28 | 14.7%).
| School Level | # Students | % Students |
| Nursery / Preschool | 0 | 0.0% |
| Kindergarten | 0 | 0.0% |
| Elementary School | 54 | 28.3% |
| Middle School | 0 | 0.0% |
| High School | 109 | 57.1% |
| College / Undergraduate | 28 | 14.7% |
| Graduate / Professional | 0 | 0.0% |
| Total | 191 | 100.0% |
School Enrollment by Age by Funding Source in Greenville
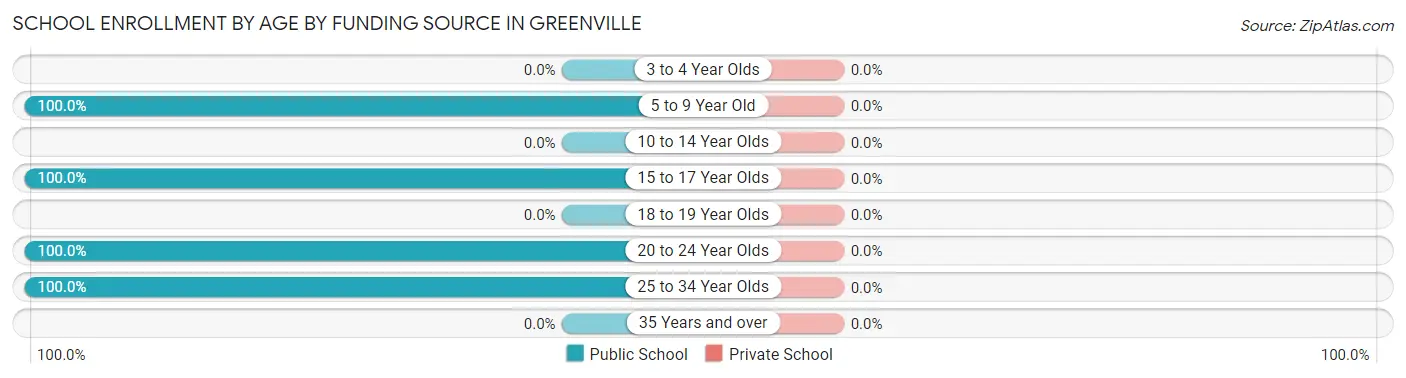
| Age Bracket | Public School | Private School |
| 3 to 4 Year Olds | 0 (0.0%) | 0 (0.0%) |
| 5 to 9 Year Old | 54 (100.0%) | 0 (0.0%) |
| 10 to 14 Year Olds | 0 (0.0%) | 0 (0.0%) |
| 15 to 17 Year Olds | 109 (100.0%) | 0 (0.0%) |
| 18 to 19 Year Olds | 0 (0.0%) | 0 (0.0%) |
| 20 to 24 Year Olds | 2 (100.0%) | 0 (0.0%) |
| 25 to 34 Year Olds | 26 (100.0%) | 0 (0.0%) |
| 35 Years and over | 0 (0.0%) | 0 (0.0%) |
| Total | 191 (100.0%) | 0 (0.0%) |
Educational Attainment by Field of Study in Greenville
Literature & languages (17 | 38.6%), business (15 | 34.1%), and psychology (12 | 27.3%) are the most common fields of study among 44 individuals in Greenville who have obtained a bachelor's degree or higher.
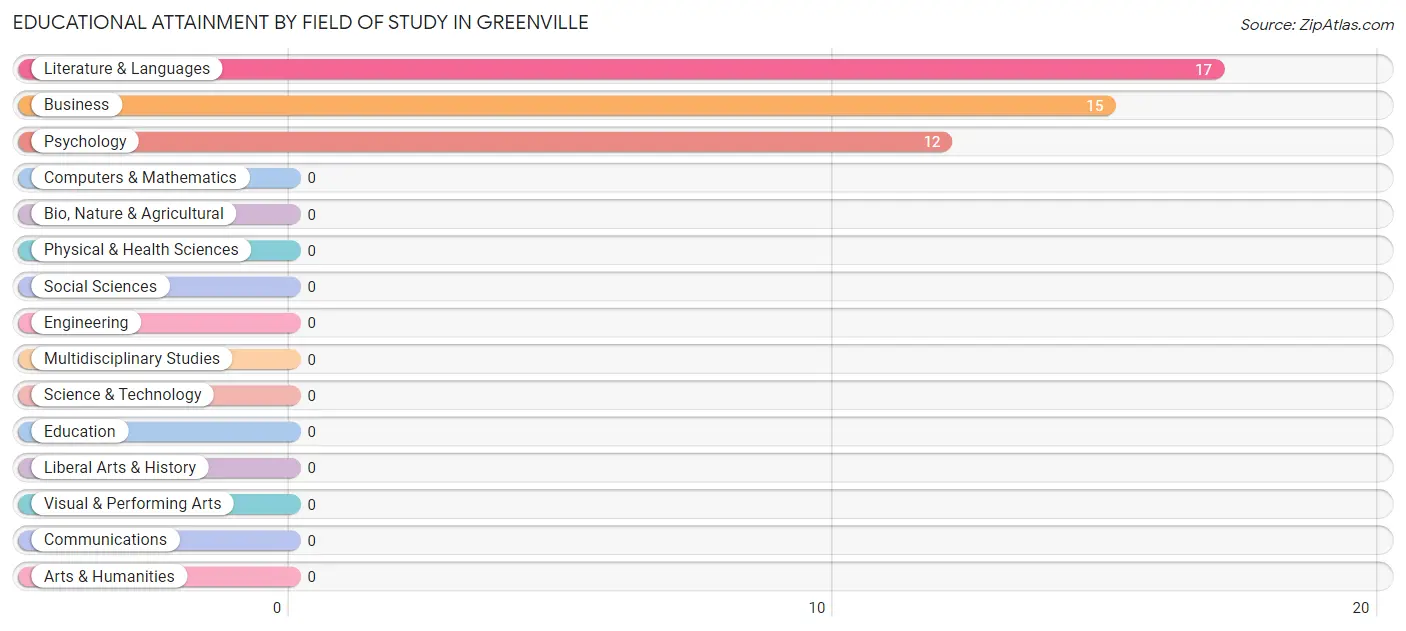
| Field of Study | # Graduates | % Graduates |
| Computers & Mathematics | 0 | 0.0% |
| Bio, Nature & Agricultural | 0 | 0.0% |
| Physical & Health Sciences | 0 | 0.0% |
| Psychology | 12 | 27.3% |
| Social Sciences | 0 | 0.0% |
| Engineering | 0 | 0.0% |
| Multidisciplinary Studies | 0 | 0.0% |
| Science & Technology | 0 | 0.0% |
| Business | 15 | 34.1% |
| Education | 0 | 0.0% |
| Literature & Languages | 17 | 38.6% |
| Liberal Arts & History | 0 | 0.0% |
| Visual & Performing Arts | 0 | 0.0% |
| Communications | 0 | 0.0% |
| Arts & Humanities | 0 | 0.0% |
| Total | 44 | 100.0% |
Transportation & Commute in Greenville
Vehicle Availability by Sex in Greenville
The most prevalent vehicle ownership categories in Greenville are males with 4 vehicles (151, accounting for 48.9%) and females with 4 vehicles (4, making up 105.6%).
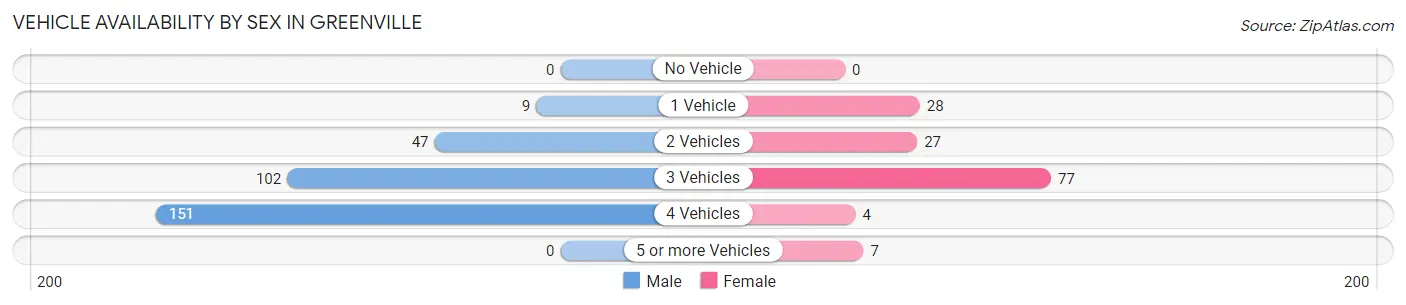
| Vehicles Available | Male | Female |
| No Vehicle | 0 (0.0%) | 0 (0.0%) |
| 1 Vehicle | 9 (2.9%) | 28 (19.6%) |
| 2 Vehicles | 47 (15.2%) | 27 (18.9%) |
| 3 Vehicles | 102 (33.0%) | 77 (53.8%) |
| 4 Vehicles | 151 (48.9%) | 4 (2.8%) |
| 5 or more Vehicles | 0 (0.0%) | 7 (4.9%) |
| Total | 309 (100.0%) | 143 (100.0%) |
Commute Time in Greenville
The most frequently occuring commute durations in Greenville are 60 to 89 minutes (135 commuters, 29.9%), 35 to 39 minutes (129 commuters, 28.5%), and 5 to 9 minutes (81 commuters, 17.9%).
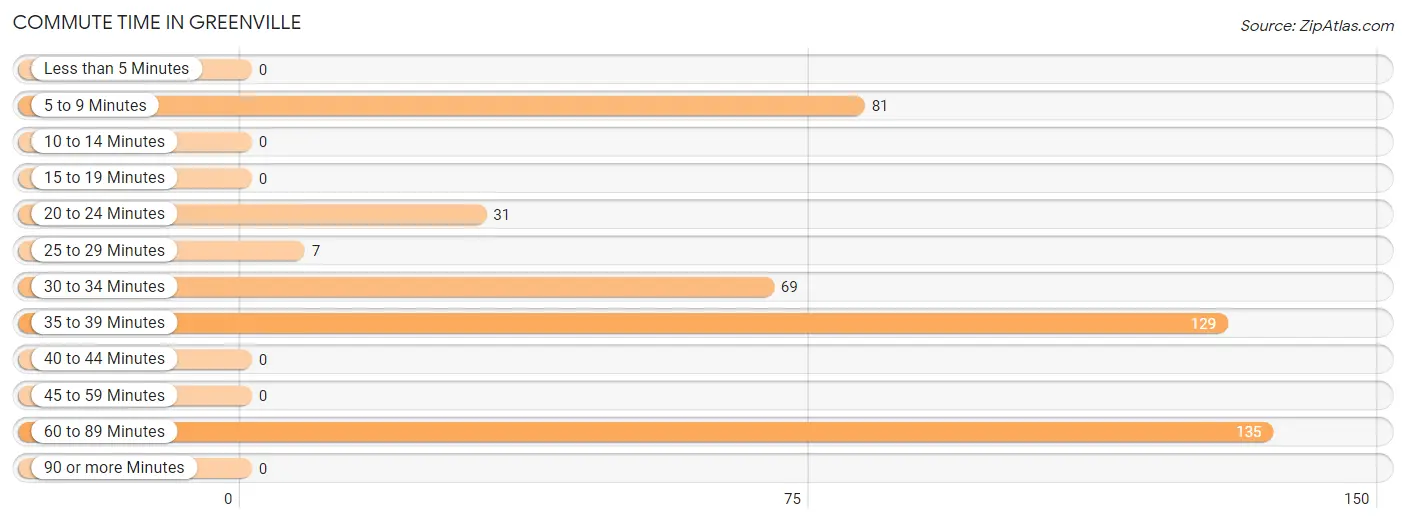
| Commute Time | # Commuters | % Commuters |
| Less than 5 Minutes | 0 | 0.0% |
| 5 to 9 Minutes | 81 | 17.9% |
| 10 to 14 Minutes | 0 | 0.0% |
| 15 to 19 Minutes | 0 | 0.0% |
| 20 to 24 Minutes | 31 | 6.9% |
| 25 to 29 Minutes | 7 | 1.5% |
| 30 to 34 Minutes | 69 | 15.3% |
| 35 to 39 Minutes | 129 | 28.5% |
| 40 to 44 Minutes | 0 | 0.0% |
| 45 to 59 Minutes | 0 | 0.0% |
| 60 to 89 Minutes | 135 | 29.9% |
| 90 or more Minutes | 0 | 0.0% |
Commute Time by Sex in Greenville
The most common commute times in Greenville are 60 to 89 minutes (135 commuters, 43.7%) for males and 5 to 9 minutes (72 commuters, 50.3%) for females.
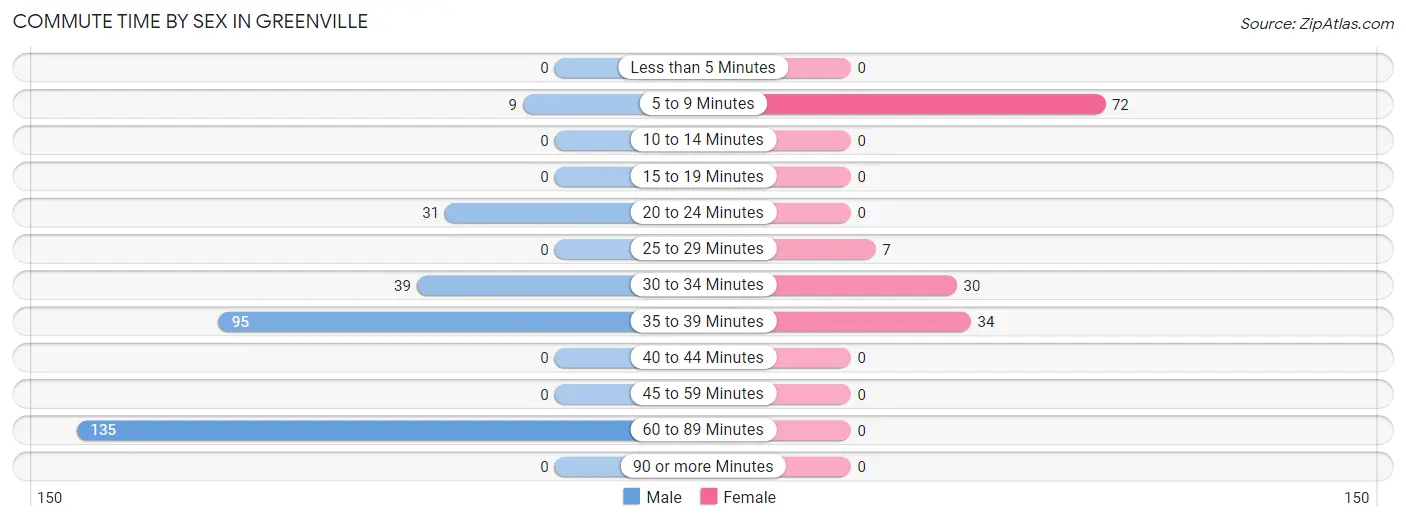
| Commute Time | Male | Female |
| Less than 5 Minutes | 0 (0.0%) | 0 (0.0%) |
| 5 to 9 Minutes | 9 (2.9%) | 72 (50.3%) |
| 10 to 14 Minutes | 0 (0.0%) | 0 (0.0%) |
| 15 to 19 Minutes | 0 (0.0%) | 0 (0.0%) |
| 20 to 24 Minutes | 31 (10.0%) | 0 (0.0%) |
| 25 to 29 Minutes | 0 (0.0%) | 7 (4.9%) |
| 30 to 34 Minutes | 39 (12.6%) | 30 (21.0%) |
| 35 to 39 Minutes | 95 (30.7%) | 34 (23.8%) |
| 40 to 44 Minutes | 0 (0.0%) | 0 (0.0%) |
| 45 to 59 Minutes | 0 (0.0%) | 0 (0.0%) |
| 60 to 89 Minutes | 135 (43.7%) | 0 (0.0%) |
| 90 or more Minutes | 0 (0.0%) | 0 (0.0%) |
Time of Departure to Work by Sex in Greenville
The most frequent times of departure to work in Greenville are 6:30 AM to 6:59 AM (135, 43.7%) for males and 7:30 AM to 7:59 AM (56, 39.2%) for females.
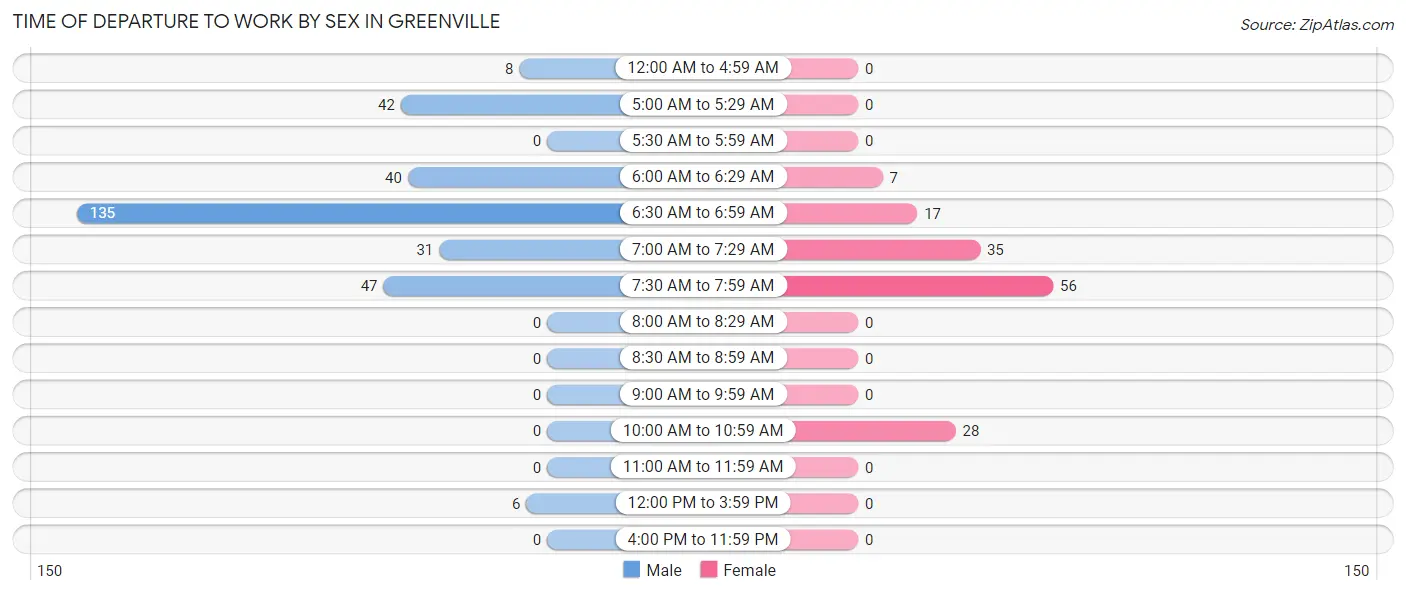
| Time of Departure | Male | Female |
| 12:00 AM to 4:59 AM | 8 (2.6%) | 0 (0.0%) |
| 5:00 AM to 5:29 AM | 42 (13.6%) | 0 (0.0%) |
| 5:30 AM to 5:59 AM | 0 (0.0%) | 0 (0.0%) |
| 6:00 AM to 6:29 AM | 40 (12.9%) | 7 (4.9%) |
| 6:30 AM to 6:59 AM | 135 (43.7%) | 17 (11.9%) |
| 7:00 AM to 7:29 AM | 31 (10.0%) | 35 (24.5%) |
| 7:30 AM to 7:59 AM | 47 (15.2%) | 56 (39.2%) |
| 8:00 AM to 8:29 AM | 0 (0.0%) | 0 (0.0%) |
| 8:30 AM to 8:59 AM | 0 (0.0%) | 0 (0.0%) |
| 9:00 AM to 9:59 AM | 0 (0.0%) | 0 (0.0%) |
| 10:00 AM to 10:59 AM | 0 (0.0%) | 28 (19.6%) |
| 11:00 AM to 11:59 AM | 0 (0.0%) | 0 (0.0%) |
| 12:00 PM to 3:59 PM | 6 (1.9%) | 0 (0.0%) |
| 4:00 PM to 11:59 PM | 0 (0.0%) | 0 (0.0%) |
| Total | 309 (100.0%) | 143 (100.0%) |
Housing Occupancy in Greenville
Occupancy by Ownership in Greenville
Of the total 302 dwellings in Greenville, owner-occupied units account for 231 (76.5%), while renter-occupied units make up 71 (23.5%).
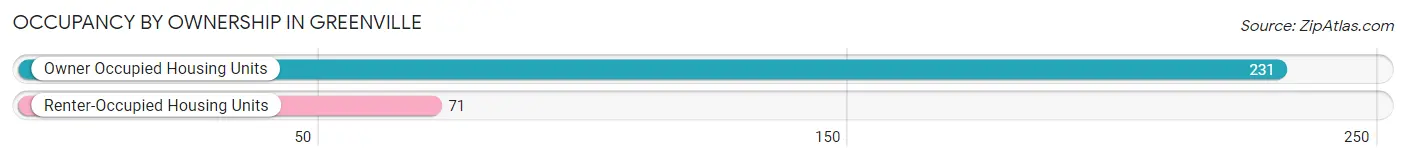
| Occupancy | # Housing Units | % Housing Units |
| Owner Occupied Housing Units | 231 | 76.5% |
| Renter-Occupied Housing Units | 71 | 23.5% |
| Total Occupied Housing Units | 302 | 100.0% |
Occupancy by Household Size in Greenville
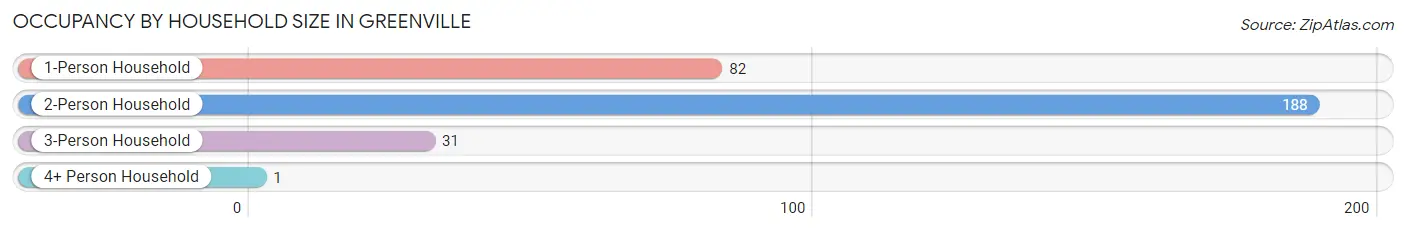
| Household Size | # Housing Units | % Housing Units |
| 1-Person Household | 82 | 27.2% |
| 2-Person Household | 188 | 62.3% |
| 3-Person Household | 31 | 10.3% |
| 4+ Person Household | 1 | 0.3% |
| Total Housing Units | 302 | 100.0% |
Occupancy by Ownership by Household Size in Greenville
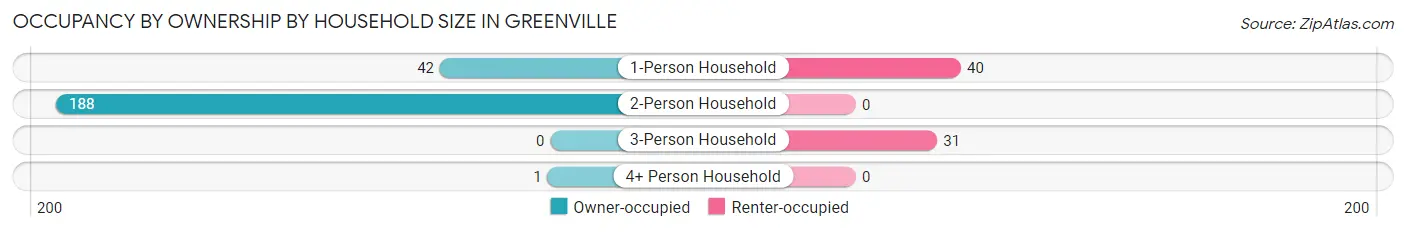
| Household Size | Owner-occupied | Renter-occupied |
| 1-Person Household | 42 (51.2%) | 40 (48.8%) |
| 2-Person Household | 188 (100.0%) | 0 (0.0%) |
| 3-Person Household | 0 (0.0%) | 31 (100.0%) |
| 4+ Person Household | 1 (100.0%) | 0 (0.0%) |
| Total Housing Units | 231 (76.5%) | 71 (23.5%) |
Occupancy by Educational Attainment in Greenville
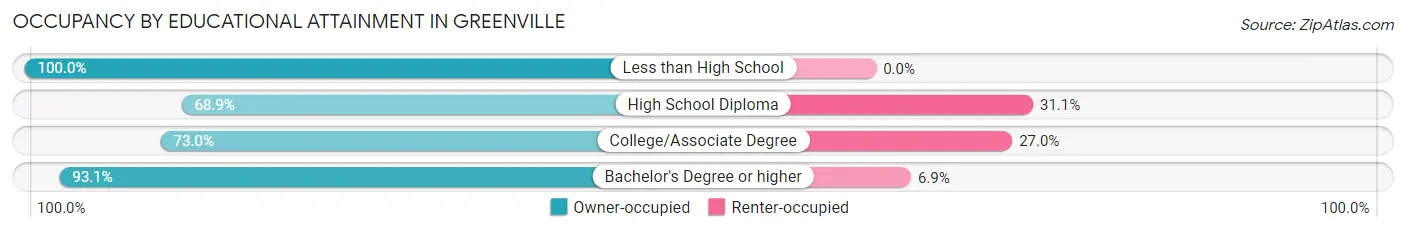
| Household Size | Owner-occupied | Renter-occupied |
| Less than High School | 31 (100.0%) | 0 (0.0%) |
| High School Diploma | 62 (68.9%) | 28 (31.1%) |
| College/Associate Degree | 111 (73.0%) | 41 (27.0%) |
| Bachelor's Degree or higher | 27 (93.1%) | 2 (6.9%) |
Occupancy by Age of Householder in Greenville
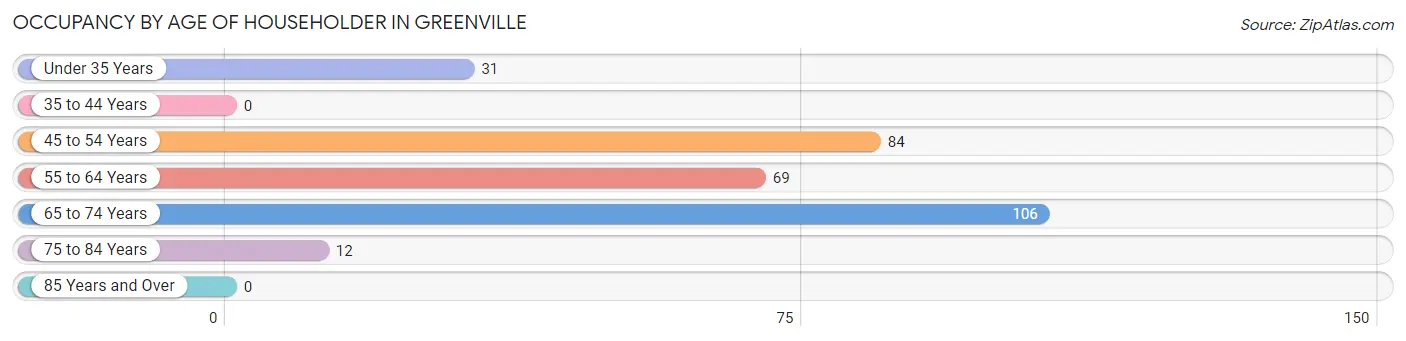
| Age Bracket | # Households | % Households |
| Under 35 Years | 31 | 10.3% |
| 35 to 44 Years | 0 | 0.0% |
| 45 to 54 Years | 84 | 27.8% |
| 55 to 64 Years | 69 | 22.9% |
| 65 to 74 Years | 106 | 35.1% |
| 75 to 84 Years | 12 | 4.0% |
| 85 Years and Over | 0 | 0.0% |
| Total | 302 | 100.0% |
Housing Finances in Greenville
Median Income by Occupancy in Greenville
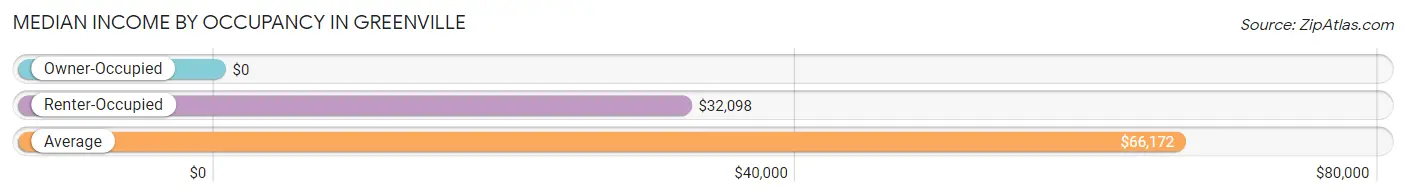
| Occupancy Type | # Households | Median Income |
| Owner-Occupied | 231 (76.5%) | $0 |
| Renter-Occupied | 71 (23.5%) | $32,098 |
| Average | 302 (100.0%) | $66,172 |
Occupancy by Householder Income Bracket in Greenville
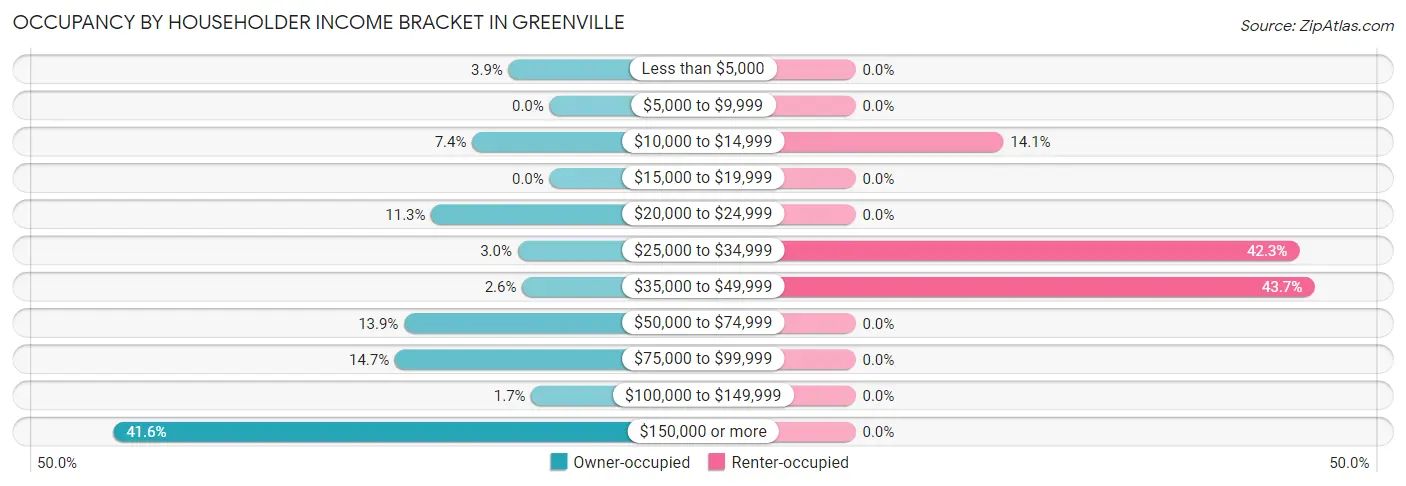
| Income Bracket | Owner-occupied | Renter-occupied |
| Less than $5,000 | 9 (3.9%) | 0 (0.0%) |
| $5,000 to $9,999 | 0 (0.0%) | 0 (0.0%) |
| $10,000 to $14,999 | 17 (7.4%) | 10 (14.1%) |
| $15,000 to $19,999 | 0 (0.0%) | 0 (0.0%) |
| $20,000 to $24,999 | 26 (11.3%) | 0 (0.0%) |
| $25,000 to $34,999 | 7 (3.0%) | 30 (42.2%) |
| $35,000 to $49,999 | 6 (2.6%) | 31 (43.7%) |
| $50,000 to $74,999 | 32 (13.9%) | 0 (0.0%) |
| $75,000 to $99,999 | 34 (14.7%) | 0 (0.0%) |
| $100,000 to $149,999 | 4 (1.7%) | 0 (0.0%) |
| $150,000 or more | 96 (41.6%) | 0 (0.0%) |
| Total | 231 (100.0%) | 71 (100.0%) |
Monthly Housing Cost Tiers in Greenville
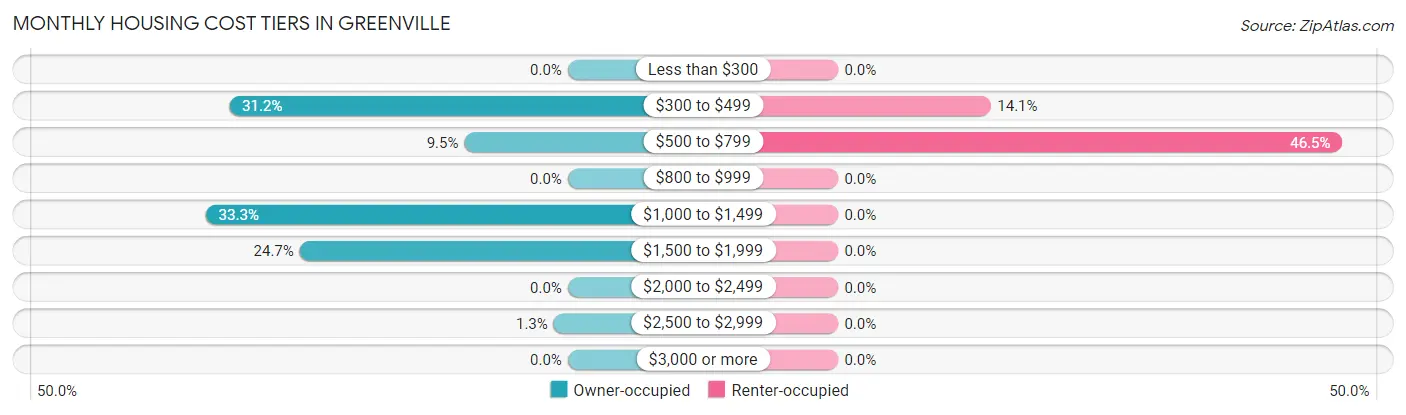
| Monthly Cost | Owner-occupied | Renter-occupied |
| Less than $300 | 0 (0.0%) | 0 (0.0%) |
| $300 to $499 | 72 (31.2%) | 10 (14.1%) |
| $500 to $799 | 22 (9.5%) | 33 (46.5%) |
| $800 to $999 | 0 (0.0%) | 0 (0.0%) |
| $1,000 to $1,499 | 77 (33.3%) | 0 (0.0%) |
| $1,500 to $1,999 | 57 (24.7%) | 0 (0.0%) |
| $2,000 to $2,499 | 0 (0.0%) | 0 (0.0%) |
| $2,500 to $2,999 | 3 (1.3%) | 0 (0.0%) |
| $3,000 or more | 0 (0.0%) | 0 (0.0%) |
| Total | 231 (100.0%) | 71 (100.0%) |
Physical Housing Characteristics in Greenville
Housing Structures in Greenville
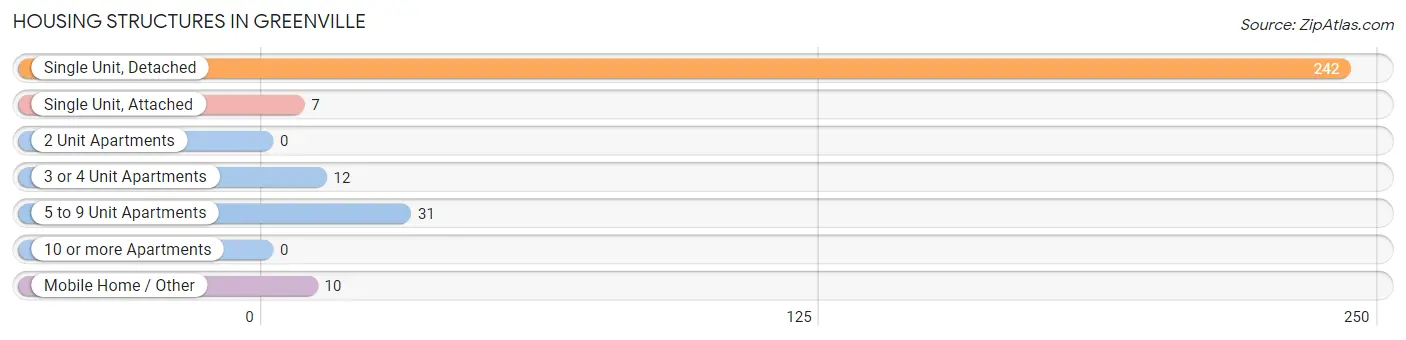
| Structure Type | # Housing Units | % Housing Units |
| Single Unit, Detached | 242 | 80.1% |
| Single Unit, Attached | 7 | 2.3% |
| 2 Unit Apartments | 0 | 0.0% |
| 3 or 4 Unit Apartments | 12 | 4.0% |
| 5 to 9 Unit Apartments | 31 | 10.3% |
| 10 or more Apartments | 0 | 0.0% |
| Mobile Home / Other | 10 | 3.3% |
| Total | 302 | 100.0% |
Housing Structures by Occupancy in Greenville
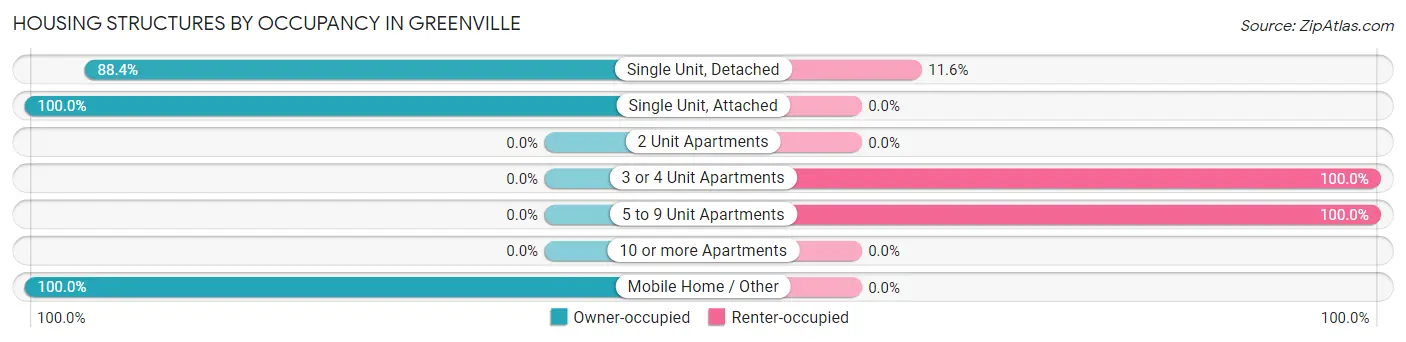
| Structure Type | Owner-occupied | Renter-occupied |
| Single Unit, Detached | 214 (88.4%) | 28 (11.6%) |
| Single Unit, Attached | 7 (100.0%) | 0 (0.0%) |
| 2 Unit Apartments | 0 (0.0%) | 0 (0.0%) |
| 3 or 4 Unit Apartments | 0 (0.0%) | 12 (100.0%) |
| 5 to 9 Unit Apartments | 0 (0.0%) | 31 (100.0%) |
| 10 or more Apartments | 0 (0.0%) | 0 (0.0%) |
| Mobile Home / Other | 10 (100.0%) | 0 (0.0%) |
| Total | 231 (76.5%) | 71 (23.5%) |
Housing Structures by Number of Rooms in Greenville
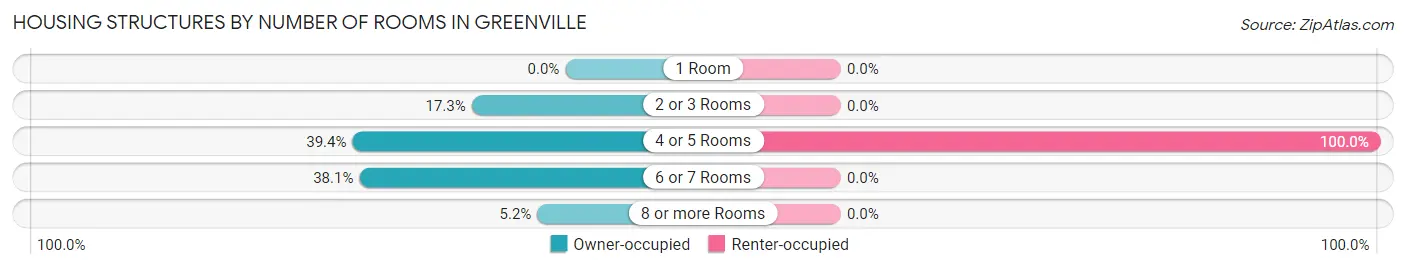
| Number of Rooms | Owner-occupied | Renter-occupied |
| 1 Room | 0 (0.0%) | 0 (0.0%) |
| 2 or 3 Rooms | 40 (17.3%) | 0 (0.0%) |
| 4 or 5 Rooms | 91 (39.4%) | 71 (100.0%) |
| 6 or 7 Rooms | 88 (38.1%) | 0 (0.0%) |
| 8 or more Rooms | 12 (5.2%) | 0 (0.0%) |
| Total | 231 (100.0%) | 71 (100.0%) |
Housing Structure by Heating Type in Greenville
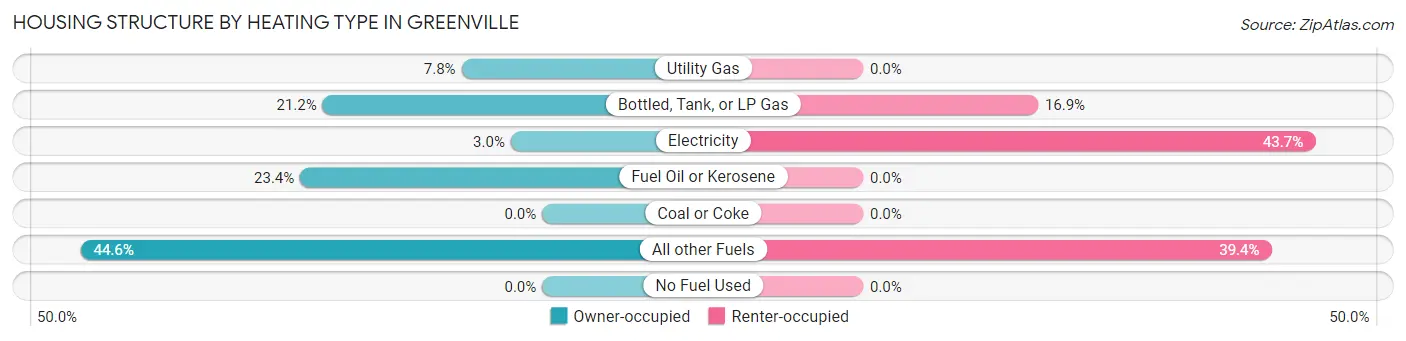
| Heating Type | Owner-occupied | Renter-occupied |
| Utility Gas | 18 (7.8%) | 0 (0.0%) |
| Bottled, Tank, or LP Gas | 49 (21.2%) | 12 (16.9%) |
| Electricity | 7 (3.0%) | 31 (43.7%) |
| Fuel Oil or Kerosene | 54 (23.4%) | 0 (0.0%) |
| Coal or Coke | 0 (0.0%) | 0 (0.0%) |
| All other Fuels | 103 (44.6%) | 28 (39.4%) |
| No Fuel Used | 0 (0.0%) | 0 (0.0%) |
| Total | 231 (100.0%) | 71 (100.0%) |
Household Vehicle Usage in Greenville
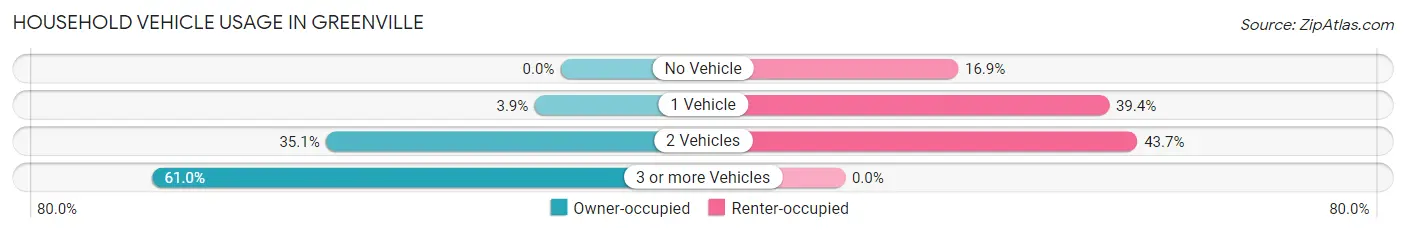
| Vehicles per Household | Owner-occupied | Renter-occupied |
| No Vehicle | 0 (0.0%) | 12 (16.9%) |
| 1 Vehicle | 9 (3.9%) | 28 (39.4%) |
| 2 Vehicles | 81 (35.1%) | 31 (43.7%) |
| 3 or more Vehicles | 141 (61.0%) | 0 (0.0%) |
| Total | 231 (100.0%) | 71 (100.0%) |
Real Estate & Mortgages in Greenville
Real Estate and Mortgage Overview in Greenville
| Characteristic | Without Mortgage | With Mortgage |
| Housing Units | 93 | 138 |
| Median Property Value | $201,100 | $319,800 |
| Median Household Income | - | - |
| Monthly Housing Costs | $499 | $0 |
| Real Estate Taxes | - | - |
Property Value by Mortgage Status in Greenville
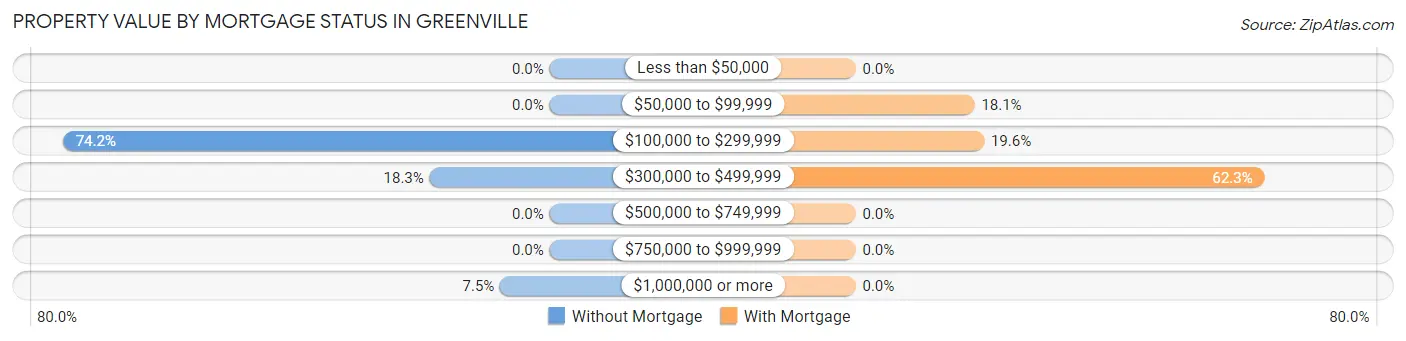
| Property Value | Without Mortgage | With Mortgage |
| Less than $50,000 | 0 (0.0%) | 0 (0.0%) |
| $50,000 to $99,999 | 0 (0.0%) | 25 (18.1%) |
| $100,000 to $299,999 | 69 (74.2%) | 27 (19.6%) |
| $300,000 to $499,999 | 17 (18.3%) | 86 (62.3%) |
| $500,000 to $749,999 | 0 (0.0%) | 0 (0.0%) |
| $750,000 to $999,999 | 0 (0.0%) | 0 (0.0%) |
| $1,000,000 or more | 7 (7.5%) | 0 (0.0%) |
| Total | 93 (100.0%) | 138 (100.0%) |
Household Income by Mortgage Status in Greenville
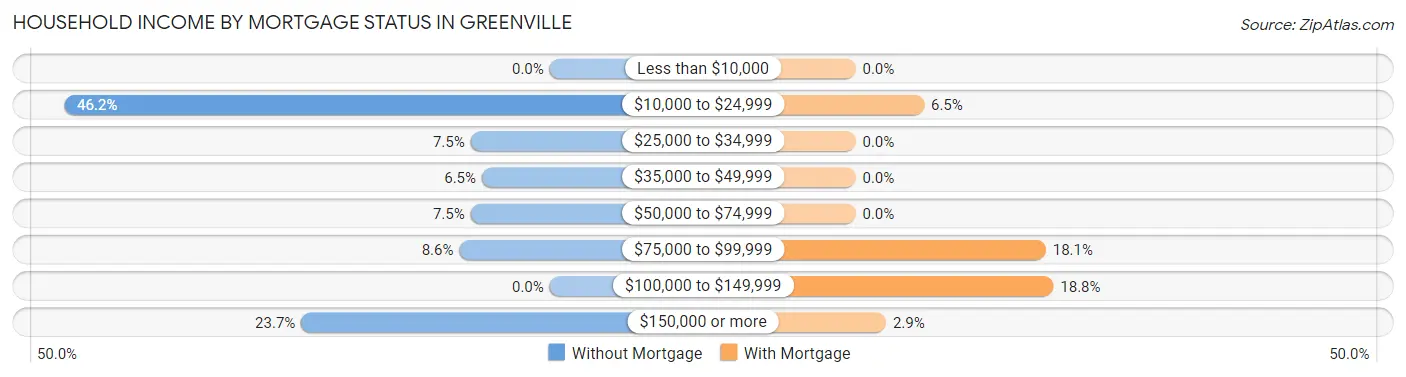
| Household Income | Without Mortgage | With Mortgage |
| Less than $10,000 | 0 (0.0%) | 0 (0.0%) |
| $10,000 to $24,999 | 43 (46.2%) | 9 (6.5%) |
| $25,000 to $34,999 | 7 (7.5%) | 0 (0.0%) |
| $35,000 to $49,999 | 6 (6.5%) | 0 (0.0%) |
| $50,000 to $74,999 | 7 (7.5%) | 0 (0.0%) |
| $75,000 to $99,999 | 8 (8.6%) | 25 (18.1%) |
| $100,000 to $149,999 | 0 (0.0%) | 26 (18.8%) |
| $150,000 or more | 22 (23.7%) | 4 (2.9%) |
| Total | 93 (100.0%) | 138 (100.0%) |
Property Value to Household Income Ratio in Greenville
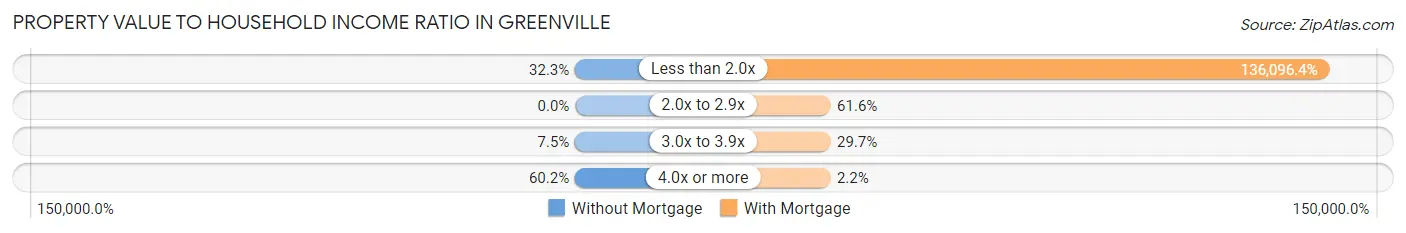
| Value-to-Income Ratio | Without Mortgage | With Mortgage |
| Less than 2.0x | 30 (32.3%) | 187,813 (136,096.4%) |
| 2.0x to 2.9x | 0 (0.0%) | 85 (61.6%) |
| 3.0x to 3.9x | 7 (7.5%) | 41 (29.7%) |
| 4.0x or more | 56 (60.2%) | 3 (2.2%) |
| Total | 93 (100.0%) | 138 (100.0%) |
Real Estate Taxes by Mortgage Status in Greenville
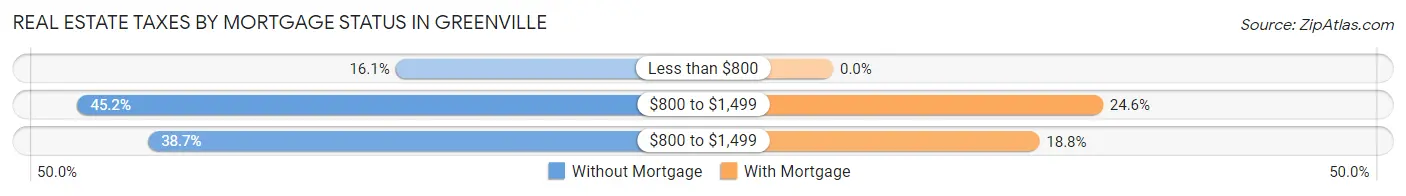
| Property Taxes | Without Mortgage | With Mortgage |
| Less than $800 | 15 (16.1%) | 0 (0.0%) |
| $800 to $1,499 | 42 (45.2%) | 34 (24.6%) |
| $800 to $1,499 | 36 (38.7%) | 26 (18.8%) |
| Total | 93 (100.0%) | 138 (100.0%) |
Health & Disability in Greenville
Health Insurance Coverage by Age in Greenville
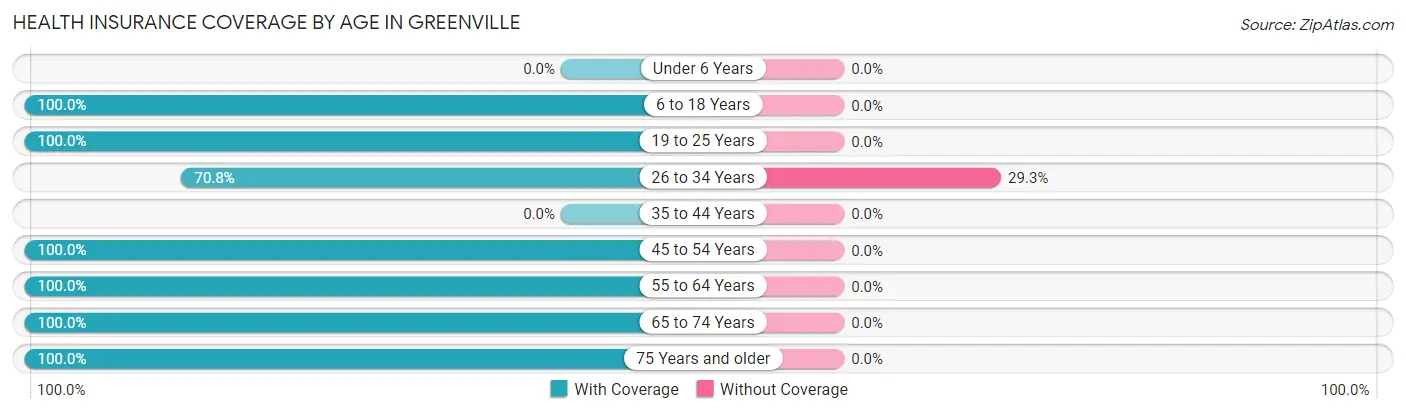
| Age Bracket | With Coverage | Without Coverage |
| Under 6 Years | 0 (0.0%) | 0 (0.0%) |
| 6 to 18 Years | 163 (100.0%) | 0 (0.0%) |
| 19 to 25 Years | 5 (100.0%) | 0 (0.0%) |
| 26 to 34 Years | 75 (70.8%) | 31 (29.2%) |
| 35 to 44 Years | 0 (0.0%) | 0 (0.0%) |
| 45 to 54 Years | 119 (100.0%) | 0 (0.0%) |
| 55 to 64 Years | 138 (100.0%) | 0 (0.0%) |
| 65 to 74 Years | 154 (100.0%) | 0 (0.0%) |
| 75 Years and older | 20 (100.0%) | 0 (0.0%) |
| Total | 674 (95.6%) | 31 (4.4%) |
Health Insurance Coverage by Citizenship Status in Greenville
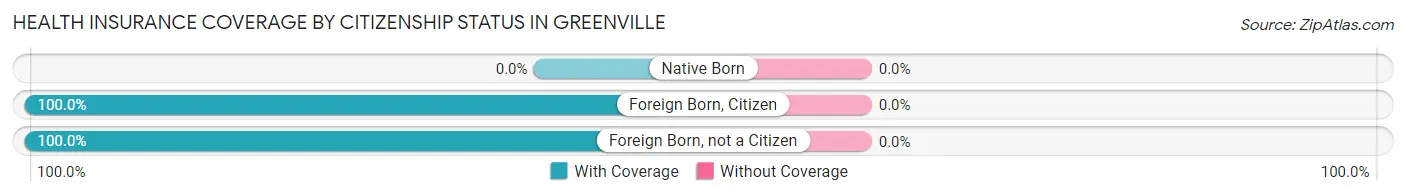
| Citizenship Status | With Coverage | Without Coverage |
| Native Born | 0 (0.0%) | 0 (0.0%) |
| Foreign Born, Citizen | 163 (100.0%) | 0 (0.0%) |
| Foreign Born, not a Citizen | 5 (100.0%) | 0 (0.0%) |
Health Insurance Coverage by Household Income in Greenville
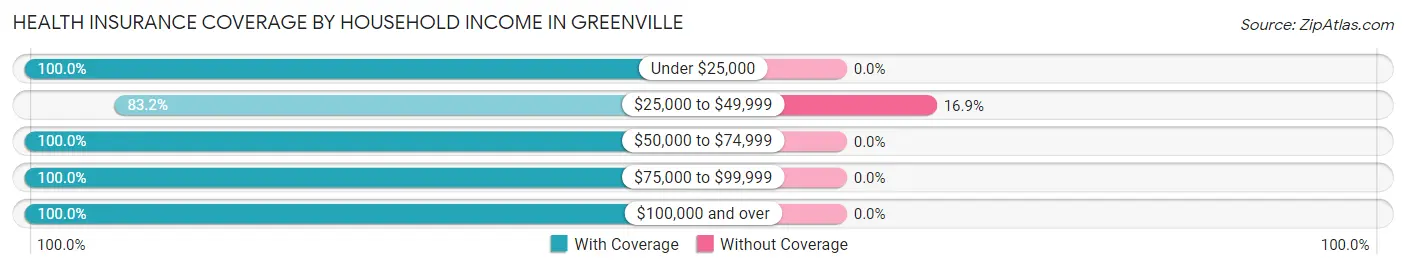
| Household Income | With Coverage | Without Coverage |
| Under $25,000 | 88 (100.0%) | 0 (0.0%) |
| $25,000 to $49,999 | 153 (83.2%) | 31 (16.9%) |
| $50,000 to $74,999 | 80 (100.0%) | 0 (0.0%) |
| $75,000 to $99,999 | 72 (100.0%) | 0 (0.0%) |
| $100,000 and over | 279 (100.0%) | 0 (0.0%) |
Public vs Private Health Insurance Coverage by Age in Greenville
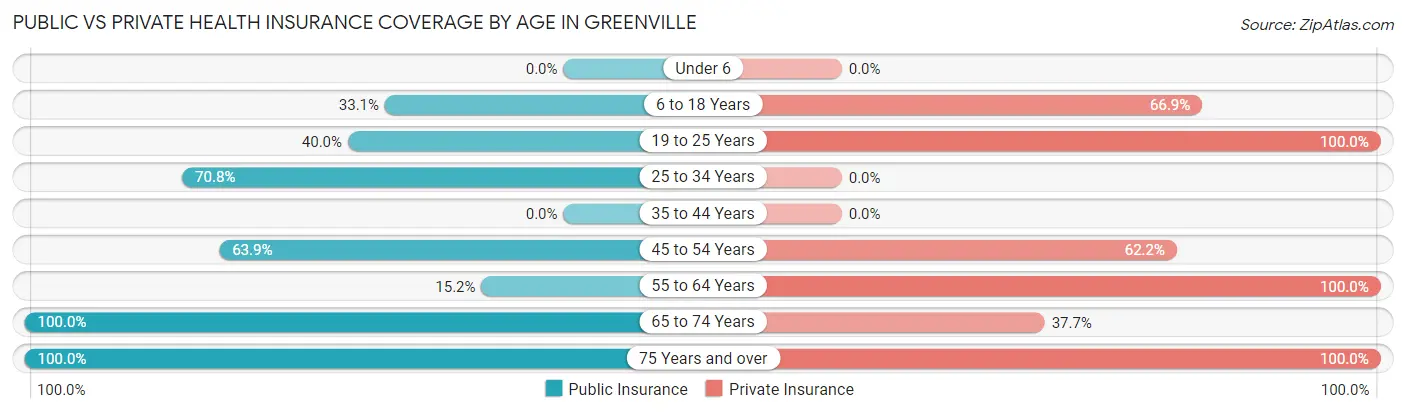
| Age Bracket | Public Insurance | Private Insurance |
| Under 6 | 0 (0.0%) | 0 (0.0%) |
| 6 to 18 Years | 54 (33.1%) | 109 (66.9%) |
| 19 to 25 Years | 2 (40.0%) | 5 (100.0%) |
| 25 to 34 Years | 75 (70.8%) | 0 (0.0%) |
| 35 to 44 Years | 0 (0.0%) | 0 (0.0%) |
| 45 to 54 Years | 76 (63.9%) | 74 (62.2%) |
| 55 to 64 Years | 21 (15.2%) | 138 (100.0%) |
| 65 to 74 Years | 154 (100.0%) | 58 (37.7%) |
| 75 Years and over | 20 (100.0%) | 20 (100.0%) |
| Total | 402 (57.0%) | 404 (57.3%) |
Disability Status by Sex by Age in Greenville
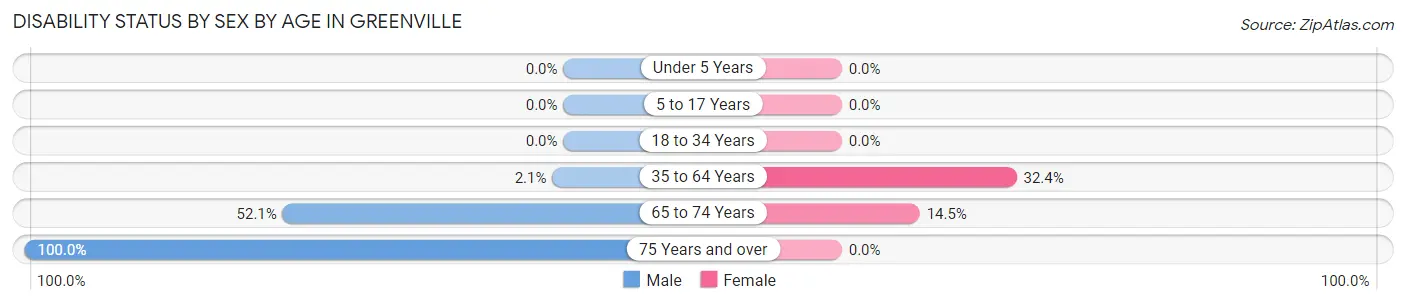
| Age Bracket | Male | Female |
| Under 5 Years | 0 (0.0%) | 0 (0.0%) |
| 5 to 17 Years | 0 (0.0%) | 0 (0.0%) |
| 18 to 34 Years | 0 (0.0%) | 0 (0.0%) |
| 35 to 64 Years | 3 (2.1%) | 36 (32.4%) |
| 65 to 74 Years | 37 (52.1%) | 12 (14.5%) |
| 75 Years and over | 12 (100.0%) | 0 (0.0%) |
Disability Class by Sex by Age in Greenville
Disability Class: Hearing Difficulty
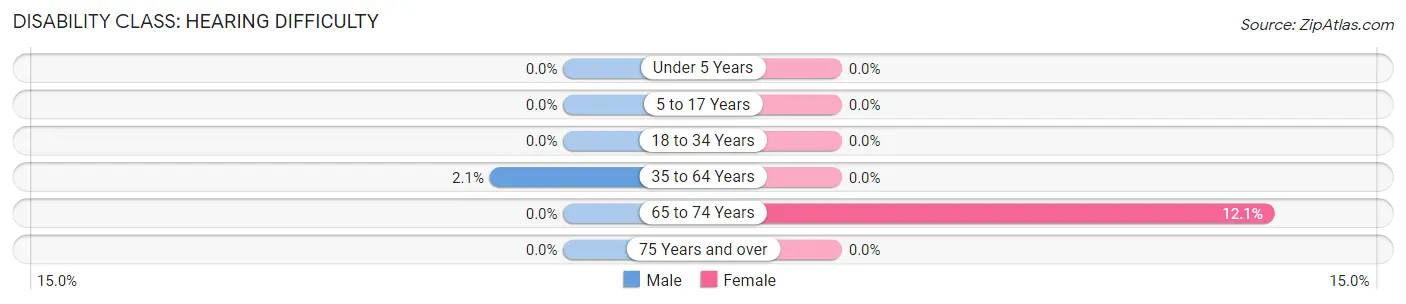
| Age Bracket | Male | Female |
| Under 5 Years | 0 (0.0%) | 0 (0.0%) |
| 5 to 17 Years | 0 (0.0%) | 0 (0.0%) |
| 18 to 34 Years | 0 (0.0%) | 0 (0.0%) |
| 35 to 64 Years | 3 (2.1%) | 0 (0.0%) |
| 65 to 74 Years | 0 (0.0%) | 10 (12.0%) |
| 75 Years and over | 0 (0.0%) | 0 (0.0%) |
Disability Class: Vision Difficulty
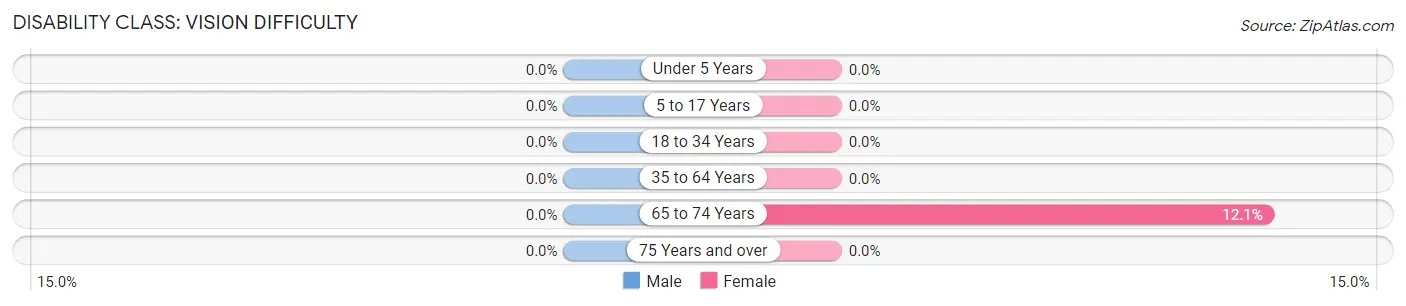
| Age Bracket | Male | Female |
| Under 5 Years | 0 (0.0%) | 0 (0.0%) |
| 5 to 17 Years | 0 (0.0%) | 0 (0.0%) |
| 18 to 34 Years | 0 (0.0%) | 0 (0.0%) |
| 35 to 64 Years | 0 (0.0%) | 0 (0.0%) |
| 65 to 74 Years | 0 (0.0%) | 10 (12.0%) |
| 75 Years and over | 0 (0.0%) | 0 (0.0%) |
Disability Class: Cognitive Difficulty
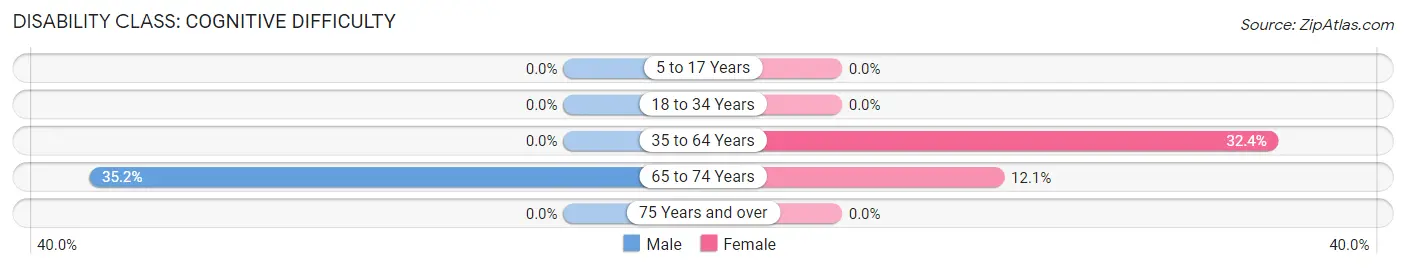
| Age Bracket | Male | Female |
| 5 to 17 Years | 0 (0.0%) | 0 (0.0%) |
| 18 to 34 Years | 0 (0.0%) | 0 (0.0%) |
| 35 to 64 Years | 0 (0.0%) | 36 (32.4%) |
| 65 to 74 Years | 25 (35.2%) | 10 (12.0%) |
| 75 Years and over | 0 (0.0%) | 0 (0.0%) |
Disability Class: Ambulatory Difficulty
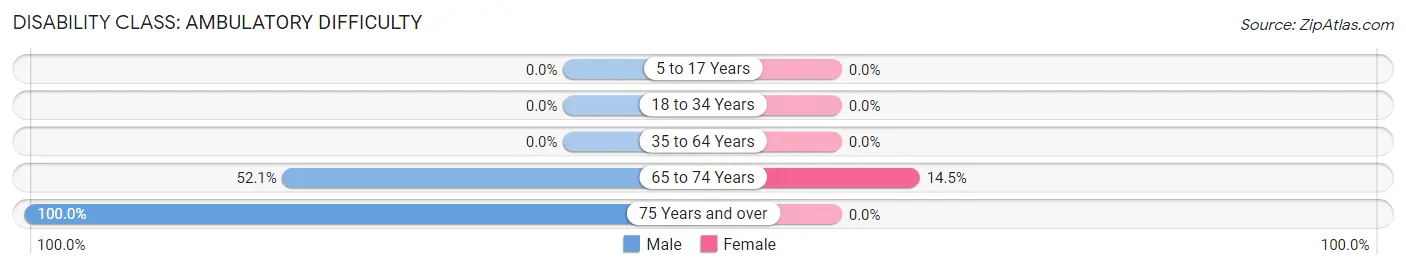
| Age Bracket | Male | Female |
| 5 to 17 Years | 0 (0.0%) | 0 (0.0%) |
| 18 to 34 Years | 0 (0.0%) | 0 (0.0%) |
| 35 to 64 Years | 0 (0.0%) | 0 (0.0%) |
| 65 to 74 Years | 37 (52.1%) | 12 (14.5%) |
| 75 Years and over | 12 (100.0%) | 0 (0.0%) |
Disability Class: Self-Care Difficulty
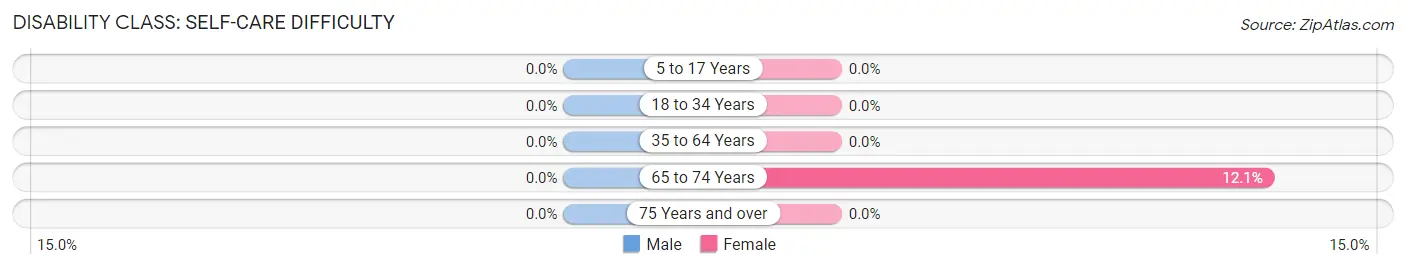
| Age Bracket | Male | Female |
| 5 to 17 Years | 0 (0.0%) | 0 (0.0%) |
| 18 to 34 Years | 0 (0.0%) | 0 (0.0%) |
| 35 to 64 Years | 0 (0.0%) | 0 (0.0%) |
| 65 to 74 Years | 0 (0.0%) | 10 (12.0%) |
| 75 Years and over | 0 (0.0%) | 0 (0.0%) |
Technology Access in Greenville
Computing Device Access in Greenville
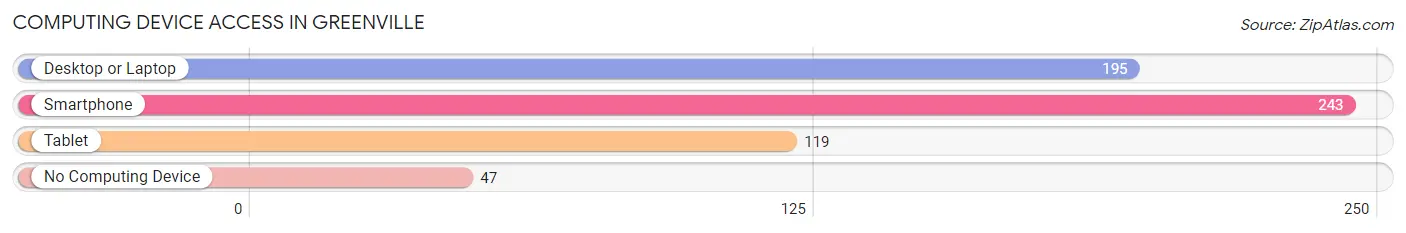
| Device Type | # Households | % Households |
| Desktop or Laptop | 195 | 64.6% |
| Smartphone | 243 | 80.5% |
| Tablet | 119 | 39.4% |
| No Computing Device | 47 | 15.6% |
| Total | 302 | 100.0% |
Internet Access in Greenville
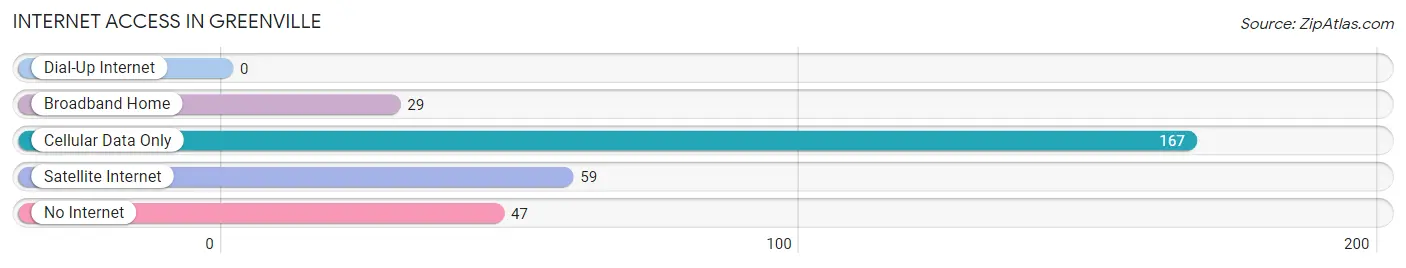
| Internet Type | # Households | % Households |
| Dial-Up Internet | 0 | 0.0% |
| Broadband Home | 29 | 9.6% |
| Cellular Data Only | 167 | 55.3% |
| Satellite Internet | 59 | 19.5% |
| No Internet | 47 | 15.6% |
| Total | 302 | 100.0% |
Greenville Summary
Greenville is a small town located in Plumas County, California. It is situated in the Sierra Nevada foothills, about 20 miles east of Quincy. The town has a population of about 1,000 people and is known for its rural charm and outdoor recreation opportunities.
Geography
Greenville is located in the Sierra Nevada foothills, about 20 miles east of Quincy. The town is situated at an elevation of 3,400 feet and is surrounded by the Plumas National Forest. The town is located in a valley surrounded by the Sierra Nevada Mountains to the east and the Cascade Range to the west. The climate in Greenville is mild and temperate, with hot summers and cold winters.
Economy
Greenville’s economy is largely based on tourism and outdoor recreation. The town is home to several resorts and campgrounds, as well as a number of restaurants and shops. The town is also home to a number of small businesses, including a lumber mill, a sawmill, and a few small farms.
Demographics
As of the 2010 census, Greenville had a population of 1,000 people. The racial makeup of the town was 94.2% White, 0.7% African American, 0.7% Native American, 0.7% Asian, 0.7% Pacific Islander, and 2.7% from two or more races. The median household income in Greenville was $37,500, and the median family income was $45,000.
History
Greenville was founded in 1854 by a group of miners who were searching for gold in the area. The town was originally called “Green Valley”, but the name was changed to Greenville in 1856. The town grew rapidly during the gold rush, and by 1860 it had a population of over 1,000 people.
In the late 19th century, Greenville became a popular destination for tourists and outdoor enthusiasts. The town was home to several resorts and campgrounds, and it became known for its rural charm and outdoor recreation opportunities.
In the early 20th century, Greenville’s economy shifted from mining to logging and lumber production. The town was home to several lumber mills, and it became a major supplier of lumber to the San Francisco Bay Area.
In the late 20th century, Greenville’s economy shifted again, this time to tourism and outdoor recreation. The town is now home to several resorts and campgrounds, as well as a number of restaurants and shops. The town is also home to a number of small businesses, including a lumber mill, a sawmill, and a few small farms.
Conclusion
Greenville is a small town located in Plumas County, California. It is situated in the Sierra Nevada foothills, about 20 miles east of Quincy. The town has a population of about 1,000 people and is known for its rural charm and outdoor recreation opportunities. The town’s economy is largely based on tourism and outdoor recreation, and it is home to several resorts and campgrounds, as well as a number of restaurants and shops. Greenville’s history dates back to the gold rush of the mid-19th century, and it has since become a popular destination for tourists and outdoor enthusiasts.
Common Questions
What is Per Capita Income in Greenville?
Per Capita income in Greenville is $71,629.
What is the Median Household income in Greenville?
Median Household Income in Greenville is $66,172.
What is Inequality or Gini Index in Greenville?
Inequality or Gini Index in Greenville is 0.67.
What is the Total Population of Greenville?
Total Population of Greenville is 705.
What is the Total Male Population of Greenville?
Total Male Population of Greenville is 420.
What is the Total Female Population of Greenville?
Total Female Population of Greenville is 285.
What is the Ratio of Males per 100 Females in Greenville?
There are 147.37 Males per 100 Females in Greenville.
What is the Ratio of Females per 100 Males in Greenville?
There are 67.86 Females per 100 Males in Greenville.
What is the Median Population Age in Greenville?
Median Population Age in Greenville is 47.7 Years.
What is the Average Family Size in Greenville
Average Family Size in Greenville is 2.9 People.
What is the Average Household Size in Greenville
Average Household Size in Greenville is 2.3 People.
How Large is the Labor Force in Greenville?
There are 532 People in the Labor Forcein in Greenville.
What is the Percentage of People in the Labor Force in Greenville?
81.7% of People are in the Labor Force in Greenville.
What is the Unemployment Rate in Greenville?
Unemployment Rate in Greenville is 15.0%.