Zip Codes with the Highest Percentage of Population Employed in Security & Protection in San Jose, CA
RELATED REPORTS & OPTIONS
Security & Protection
San Jose
Compare Zip Codes
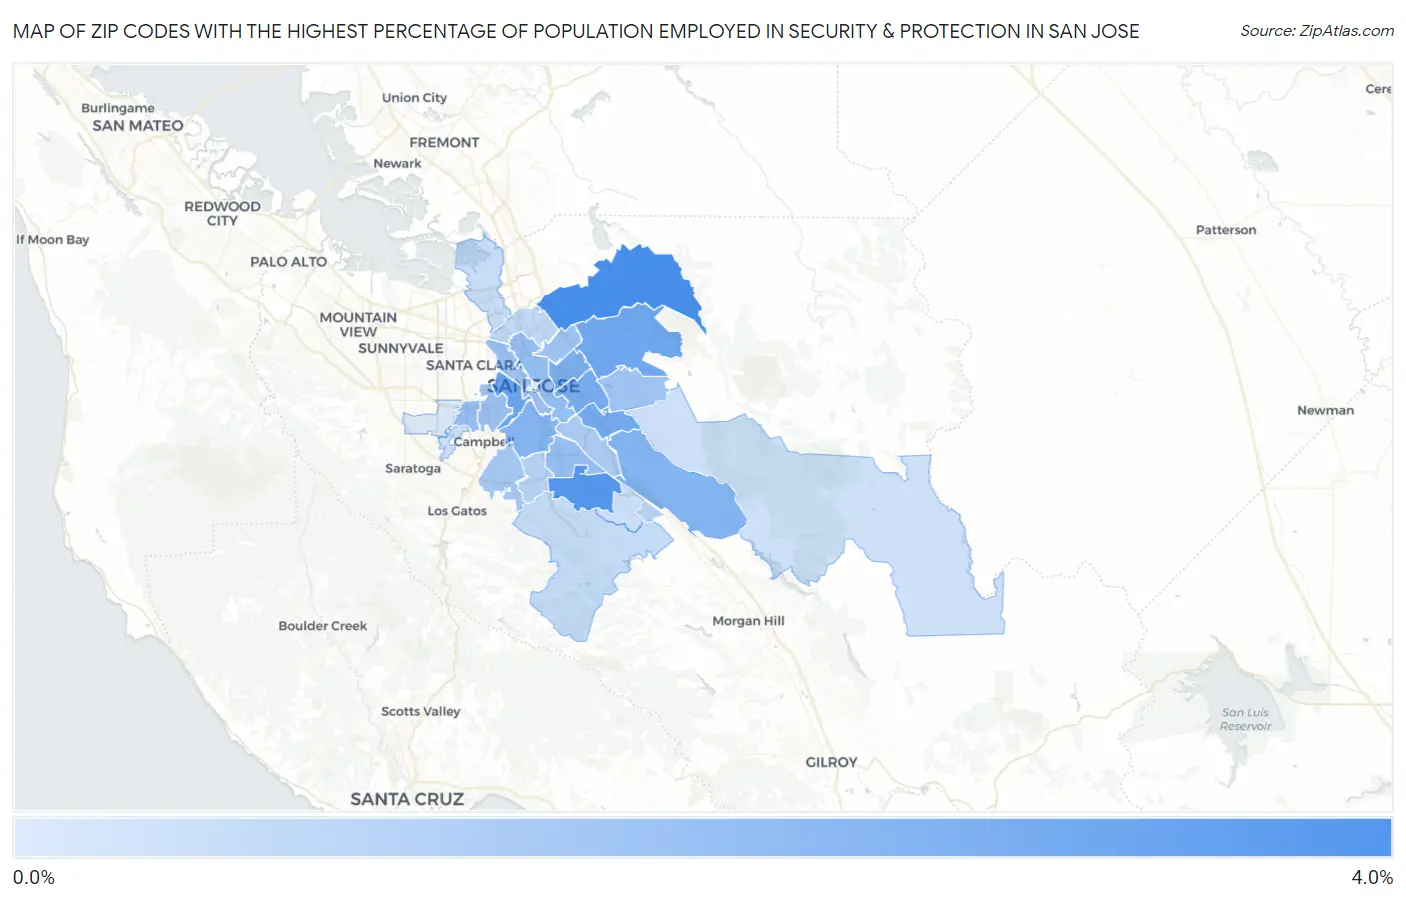
Map of Zip Codes with the Highest Percentage of Population Employed in Security & Protection in San Jose
0.19%
3.1%
Zip Codes with the Highest Percentage of Population Employed in Security & Protection in San Jose, CA
| Zip Code | % Employed | vs State | vs National | |
| 1. | 95132 | 3.1% | 2.1%(+1.05)#345 | 2.1%(+0.980)#6,783 |
| 2. | 95123 | 2.8% | 2.1%(+0.768)#420 | 2.1%(+0.700)#7,877 |
| 3. | 95126 | 2.4% | 2.1%(+0.329)#552 | 2.1%(+0.261)#10,015 |
| 4. | 95127 | 2.3% | 2.1%(+0.224)#581 | 2.1%(+0.156)#10,624 |
| 5. | 95121 | 2.2% | 2.1%(+0.133)#616 | 2.1%(+0.065)#11,176 |
| 6. | 95122 | 2.2% | 2.1%(+0.107)#628 | 2.1%(+0.039)#11,332 |
| 7. | 95116 | 2.1% | 2.1%(-0.001)#674 | 2.1%(-0.069)#12,058 |
| 8. | 95138 | 1.9% | 2.1%(-0.134)#741 | 2.1%(-0.202)#12,903 |
| 9. | 95125 | 1.9% | 2.1%(-0.184)#757 | 2.1%(-0.252)#13,242 |
| 10. | 95112 | 1.6% | 2.1%(-0.511)#915 | 2.1%(-0.578)#15,642 |
| 11. | 95117 | 1.5% | 2.1%(-0.561)#937 | 2.1%(-0.629)#16,037 |
| 12. | 95136 | 1.5% | 2.1%(-0.562)#938 | 2.1%(-0.630)#16,047 |
| 13. | 95128 | 1.5% | 2.1%(-0.623)#966 | 2.1%(-0.691)#16,516 |
| 14. | 95110 | 1.4% | 2.1%(-0.692)#1,005 | 2.1%(-0.759)#17,034 |
| 15. | 95148 | 1.3% | 2.1%(-0.747)#1,029 | 2.1%(-0.815)#17,464 |
| 16. | 95133 | 1.3% | 2.1%(-0.747)#1,031 | 2.1%(-0.815)#17,466 |
| 17. | 95124 | 1.3% | 2.1%(-0.795)#1,057 | 2.1%(-0.863)#17,870 |
| 18. | 95111 | 1.1% | 2.1%(-0.936)#1,123 | 2.1%(-1.00)#18,942 |
| 19. | 95118 | 0.91% | 2.1%(-1.17)#1,209 | 2.1%(-1.24)#20,700 |
| 20. | 95139 | 0.91% | 2.1%(-1.17)#1,217 | 2.1%(-1.24)#20,754 |
| 21. | 95131 | 0.74% | 2.1%(-1.34)#1,271 | 2.1%(-1.41)#21,807 |
| 22. | 95120 | 0.66% | 2.1%(-1.42)#1,307 | 2.1%(-1.49)#22,330 |
| 23. | 95134 | 0.60% | 2.1%(-1.48)#1,321 | 2.1%(-1.55)#22,661 |
| 24. | 95119 | 0.57% | 2.1%(-1.51)#1,332 | 2.1%(-1.58)#22,838 |
| 25. | 95135 | 0.45% | 2.1%(-1.63)#1,356 | 2.1%(-1.70)#23,495 |
| 26. | 95130 | 0.40% | 2.1%(-1.69)#1,368 | 2.1%(-1.75)#23,746 |
| 27. | 95129 | 0.19% | 2.1%(-1.89)#1,411 | 2.1%(-1.96)#24,550 |
1
Common Questions
What are the Top 10 Zip Codes with the Highest Percentage of Population Employed in Security & Protection in San Jose, CA?
Top 10 Zip Codes with the Highest Percentage of Population Employed in Security & Protection in San Jose, CA are:
What zip code has the Highest Percentage of Population Employed in Security & Protection in San Jose, CA?
95132 has the Highest Percentage of Population Employed in Security & Protection in San Jose, CA with 3.1%.
What is the Percentage of Population Employed in Security & Protection in San Jose, CA?
Percentage of Population Employed in Security & Protection in San Jose is 1.6%.
What is the Percentage of Population Employed in Security & Protection in California?
Percentage of Population Employed in Security & Protection in California is 2.1%.
What is the Percentage of Population Employed in Security & Protection in the United States?
Percentage of Population Employed in Security & Protection in the United States is 2.1%.