Cities with the Highest Percentage of Population Employed in Security & Protection in Michigan
RELATED REPORTS & OPTIONS
Security & Protection
Michigan
Compare Cities
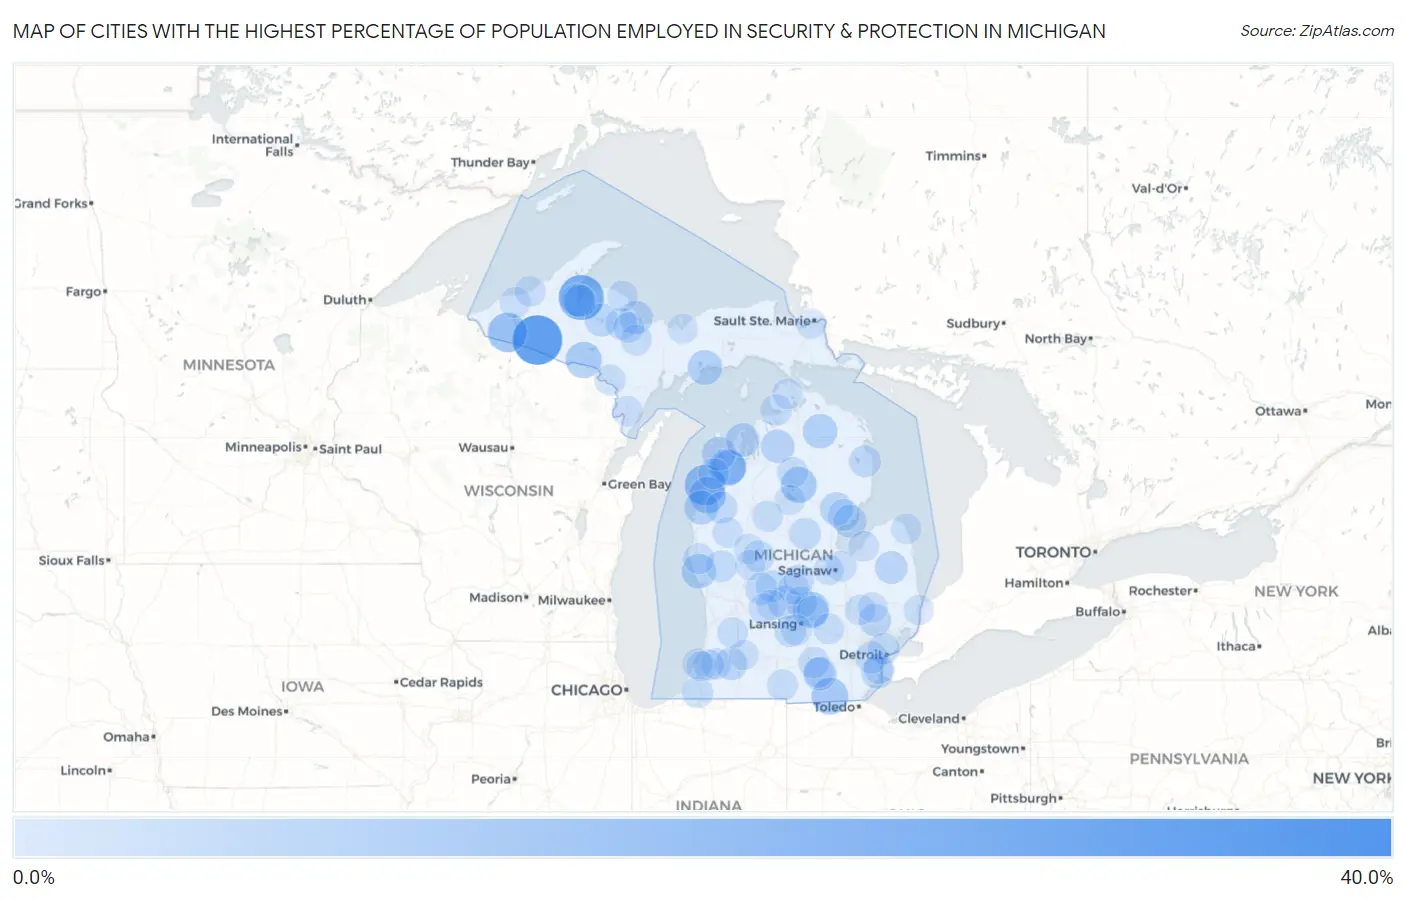
Map of Cities with the Highest Percentage of Population Employed in Security & Protection in Michigan
0.0%
40.0%
Cities with the Highest Percentage of Population Employed in Security & Protection in Michigan
| City | % Employed | vs State | vs National | |
| 1. | Pelkie | 31.6% | 1.6%(+29.9)#1 | 2.1%(+29.4)#106 |
| 2. | Watersmeet | 26.9% | 1.6%(+25.2)#2 | 2.1%(+24.7)#151 |
| 3. | Bruce Crossing | 25.0% | 1.6%(+23.4)#3 | 2.1%(+22.9)#178 |
| 4. | Zeba | 21.4% | 1.6%(+19.8)#4 | 2.1%(+19.3)#245 |
| 5. | Arcadia | 15.9% | 1.6%(+14.3)#5 | 2.1%(+13.8)#440 |
| 6. | Marenisco | 14.3% | 1.6%(+12.6)#6 | 2.1%(+12.1)#540 |
| 7. | Maple Grove | 11.7% | 1.6%(+10.0)#7 | 2.1%(+9.53)#812 |
| 8. | Jasper | 11.2% | 1.6%(+9.59)#8 | 2.1%(+9.08)#877 |
| 9. | Onekama | 10.8% | 1.6%(+9.20)#9 | 2.1%(+8.69)#945 |
| 10. | Lake Victoria | 10.7% | 1.6%(+9.03)#10 | 2.1%(+8.52)#976 |
| 11. | Alpha | 10.6% | 1.6%(+9.00)#11 | 2.1%(+8.49)#987 |
| 12. | Roscommon | 10.4% | 1.6%(+8.72)#12 | 2.1%(+8.22)#1,036 |
| 13. | Eureka | 9.8% | 1.6%(+8.19)#13 | 2.1%(+7.69)#1,126 |
| 14. | Tower | 9.6% | 1.6%(+7.96)#14 | 2.1%(+7.45)#1,180 |
| 15. | Kincheloe | 9.3% | 1.6%(+7.64)#15 | 2.1%(+7.13)#1,248 |
| 16. | Brimley | 8.9% | 1.6%(+7.26)#16 | 2.1%(+6.76)#1,366 |
| 17. | Manistique | 8.9% | 1.6%(+7.23)#17 | 2.1%(+6.72)#1,378 |
| 18. | Cannonsburg | 8.7% | 1.6%(+7.10)#18 | 2.1%(+6.59)#1,418 |
| 19. | Canada Creek Ranch | 8.5% | 1.6%(+6.90)#19 | 2.1%(+6.39)#1,475 |
| 20. | Hardwood Acres | 8.5% | 1.6%(+6.87)#20 | 2.1%(+6.36)#1,487 |
| 21. | Whitehall | 8.5% | 1.6%(+6.83)#21 | 2.1%(+6.32)#1,498 |
| 22. | Oak Hill | 8.1% | 1.6%(+6.46)#22 | 2.1%(+5.95)#1,624 |
| 23. | Glen Arbor | 8.0% | 1.6%(+6.32)#23 | 2.1%(+5.82)#1,671 |
| 24. | Omena | 7.7% | 1.6%(+6.05)#24 | 2.1%(+5.54)#1,761 |
| 25. | Alba | 7.5% | 1.6%(+5.81)#25 | 2.1%(+5.30)#1,879 |
| 26. | Trowbridge Park | 7.3% | 1.6%(+5.65)#26 | 2.1%(+5.15)#1,948 |
| 27. | Vineyard Lake | 7.1% | 1.6%(+5.50)#27 | 2.1%(+4.99)#1,996 |
| 28. | Pewamo | 7.1% | 1.6%(+5.50)#28 | 2.1%(+4.99)#2,002 |
| 29. | Michigamme | 7.0% | 1.6%(+5.40)#29 | 2.1%(+4.89)#2,054 |
| 30. | Prescott | 6.9% | 1.6%(+5.26)#30 | 2.1%(+4.75)#2,136 |
| 31. | Au Gres | 6.8% | 1.6%(+5.21)#31 | 2.1%(+4.70)#2,160 |
| 32. | Rock | 6.7% | 1.6%(+5.10)#32 | 2.1%(+4.59)#2,217 |
| 33. | Baraga | 6.7% | 1.6%(+5.09)#33 | 2.1%(+4.58)#2,227 |
| 34. | L Anse | 6.5% | 1.6%(+4.86)#34 | 2.1%(+4.36)#2,356 |
| 35. | Snover | 6.5% | 1.6%(+4.81)#35 | 2.1%(+4.30)#2,390 |
| 36. | Mattawan | 6.3% | 1.6%(+4.69)#36 | 2.1%(+4.18)#2,481 |
| 37. | Lake Orion | 6.2% | 1.6%(+4.54)#37 | 2.1%(+4.03)#2,572 |
| 38. | Gibraltar | 6.0% | 1.6%(+4.38)#38 | 2.1%(+3.87)#2,693 |
| 39. | Greenville | 6.0% | 1.6%(+4.33)#39 | 2.1%(+3.83)#2,727 |
| 40. | Dodgeville | 5.7% | 1.6%(+4.09)#40 | 2.1%(+3.58)#2,941 |
| 41. | Lost Lake Woods | 5.7% | 1.6%(+4.07)#41 | 2.1%(+3.57)#2,951 |
| 42. | Mass | 5.7% | 1.6%(+4.07)#42 | 2.1%(+3.57)#2,956 |
| 43. | Inkster | 5.6% | 1.6%(+3.92)#43 | 2.1%(+3.41)#3,096 |
| 44. | Beaverton | 5.5% | 1.6%(+3.85)#44 | 2.1%(+3.34)#3,171 |
| 45. | Twining | 5.5% | 1.6%(+3.84)#45 | 2.1%(+3.33)#3,187 |
| 46. | West Ishpeming | 5.5% | 1.6%(+3.83)#46 | 2.1%(+3.32)#3,194 |
| 47. | Highland Park | 5.4% | 1.6%(+3.72)#47 | 2.1%(+3.21)#3,299 |
| 48. | Fremont | 5.3% | 1.6%(+3.70)#48 | 2.1%(+3.19)#3,319 |
| 49. | Wellston | 5.3% | 1.6%(+3.69)#49 | 2.1%(+3.18)#3,326 |
| 50. | Sheridan | 5.2% | 1.6%(+3.61)#50 | 2.1%(+3.10)#3,431 |
| 51. | Canadian Lakes | 5.2% | 1.6%(+3.59)#51 | 2.1%(+3.09)#3,444 |
| 52. | St Johns | 5.2% | 1.6%(+3.55)#52 | 2.1%(+3.04)#3,489 |
| 53. | Perrinton | 5.2% | 1.6%(+3.54)#53 | 2.1%(+3.03)#3,494 |
| 54. | Potterville | 5.1% | 1.6%(+3.50)#54 | 2.1%(+3.00)#3,536 |
| 55. | Harbor Springs | 5.0% | 1.6%(+3.37)#55 | 2.1%(+2.86)#3,675 |
| 56. | Laingsburg | 4.9% | 1.6%(+3.29)#56 | 2.1%(+2.78)#3,769 |
| 57. | Buchanan | 4.8% | 1.6%(+3.11)#57 | 2.1%(+2.60)#3,974 |
| 58. | Michigan Center | 4.7% | 1.6%(+3.09)#58 | 2.1%(+2.58)#3,993 |
| 59. | Dimondale | 4.7% | 1.6%(+3.06)#59 | 2.1%(+2.56)#4,029 |
| 60. | New Era | 4.7% | 1.6%(+3.02)#60 | 2.1%(+2.51)#4,095 |
| 61. | Ramsay | 4.5% | 1.6%(+2.90)#61 | 2.1%(+2.40)#4,248 |
| 62. | Gwinn | 4.5% | 1.6%(+2.89)#62 | 2.1%(+2.39)#4,274 |
| 63. | Marion | 4.5% | 1.6%(+2.88)#63 | 2.1%(+2.37)#4,286 |
| 64. | Grayling | 4.5% | 1.6%(+2.87)#64 | 2.1%(+2.36)#4,300 |
| 65. | Fowlerville | 4.5% | 1.6%(+2.86)#65 | 2.1%(+2.36)#4,312 |
| 66. | Norway | 4.5% | 1.6%(+2.86)#66 | 2.1%(+2.35)#4,318 |
| 67. | Ithaca | 4.5% | 1.6%(+2.84)#67 | 2.1%(+2.34)#4,336 |
| 68. | Lawrence | 4.5% | 1.6%(+2.83)#68 | 2.1%(+2.32)#4,363 |
| 69. | Quincy | 4.5% | 1.6%(+2.83)#69 | 2.1%(+2.32)#4,364 |
| 70. | Hopkins | 4.4% | 1.6%(+2.73)#70 | 2.1%(+2.22)#4,505 |
| 71. | Big Bay | 4.3% | 1.6%(+2.71)#71 | 2.1%(+2.20)#4,538 |
| 72. | Hartford | 4.3% | 1.6%(+2.67)#72 | 2.1%(+2.17)#4,593 |
| 73. | White Pine | 4.2% | 1.6%(+2.60)#73 | 2.1%(+2.09)#4,702 |
| 74. | Palmer | 4.2% | 1.6%(+2.59)#74 | 2.1%(+2.08)#4,708 |
| 75. | Levering | 4.2% | 1.6%(+2.53)#75 | 2.1%(+2.02)#4,809 |
| 76. | Robin Glen Indiantown | 4.2% | 1.6%(+2.51)#76 | 2.1%(+2.00)#4,835 |
| 77. | Lake Michigan Beach | 4.1% | 1.6%(+2.46)#77 | 2.1%(+1.95)#4,938 |
| 78. | Stephenson | 4.1% | 1.6%(+2.44)#78 | 2.1%(+1.93)#4,963 |
| 79. | Beulah | 4.1% | 1.6%(+2.44)#79 | 2.1%(+1.93)#4,970 |
| 80. | Ontonagon | 4.1% | 1.6%(+2.42)#80 | 2.1%(+1.91)#4,996 |
| 81. | Goodrich | 4.0% | 1.6%(+2.41)#81 | 2.1%(+1.90)#5,009 |
| 82. | Sebewaing | 4.0% | 1.6%(+2.38)#82 | 2.1%(+1.88)#5,047 |
| 83. | Saranac | 4.0% | 1.6%(+2.37)#83 | 2.1%(+1.86)#5,072 |
| 84. | Baldwin | 4.0% | 1.6%(+2.36)#84 | 2.1%(+1.85)#5,088 |
| 85. | Trenton | 4.0% | 1.6%(+2.35)#85 | 2.1%(+1.84)#5,125 |
| 86. | Brooklyn | 3.9% | 1.6%(+2.27)#86 | 2.1%(+1.76)#5,270 |
| 87. | Port Hope | 3.8% | 1.6%(+2.20)#87 | 2.1%(+1.70)#5,410 |
| 88. | Shields | 3.8% | 1.6%(+2.19)#88 | 2.1%(+1.69)#5,440 |
| 89. | Houghton Lake | 3.8% | 1.6%(+2.13)#89 | 2.1%(+1.63)#5,538 |
| 90. | Big Rapids | 3.7% | 1.6%(+2.06)#90 | 2.1%(+1.56)#5,688 |
| 91. | Morley | 3.7% | 1.6%(+2.06)#91 | 2.1%(+1.56)#5,694 |
| 92. | Metamora | 3.7% | 1.6%(+2.06)#92 | 2.1%(+1.56)#5,696 |
| 93. | Fulton | 3.7% | 1.6%(+2.06)#93 | 2.1%(+1.56)#5,703 |
| 94. | Marysville | 3.7% | 1.6%(+2.04)#94 | 2.1%(+1.53)#5,756 |
| 95. | Coloma | 3.7% | 1.6%(+2.03)#95 | 2.1%(+1.52)#5,771 |
| 96. | Parchment | 3.7% | 1.6%(+2.01)#96 | 2.1%(+1.51)#5,810 |
| 97. | Ionia | 3.7% | 1.6%(+2.01)#97 | 2.1%(+1.51)#5,811 |
| 98. | Ruby | 3.6% | 1.6%(+1.99)#98 | 2.1%(+1.48)#5,857 |
| 99. | Sault Ste Marie | 3.6% | 1.6%(+1.92)#99 | 2.1%(+1.42)#5,989 |
| 100. | Munising | 3.5% | 1.6%(+1.91)#100 | 2.1%(+1.40)#6,008 |
Common Questions
What are the Top 10 Cities with the Highest Percentage of Population Employed in Security & Protection in Michigan?
Top 10 Cities with the Highest Percentage of Population Employed in Security & Protection in Michigan are:
#1
26.9%
#2
21.4%
#3
15.9%
#4
14.3%
#5
11.7%
#6
11.2%
#7
10.8%
#8
10.7%
#9
10.6%
#10
10.4%
What city has the Highest Percentage of Population Employed in Security & Protection in Michigan?
Watersmeet has the Highest Percentage of Population Employed in Security & Protection in Michigan with 26.9%.
What is the Percentage of Population Employed in Security & Protection in the State of Michigan?
Percentage of Population Employed in Security & Protection in Michigan is 1.6%.
What is the Percentage of Population Employed in Security & Protection in the United States?
Percentage of Population Employed in Security & Protection in the United States is 2.1%.