Cities with the Highest Percentage of Population Employed in Security & Protection in Tennessee
RELATED REPORTS & OPTIONS
Security & Protection
Tennessee
Compare Cities
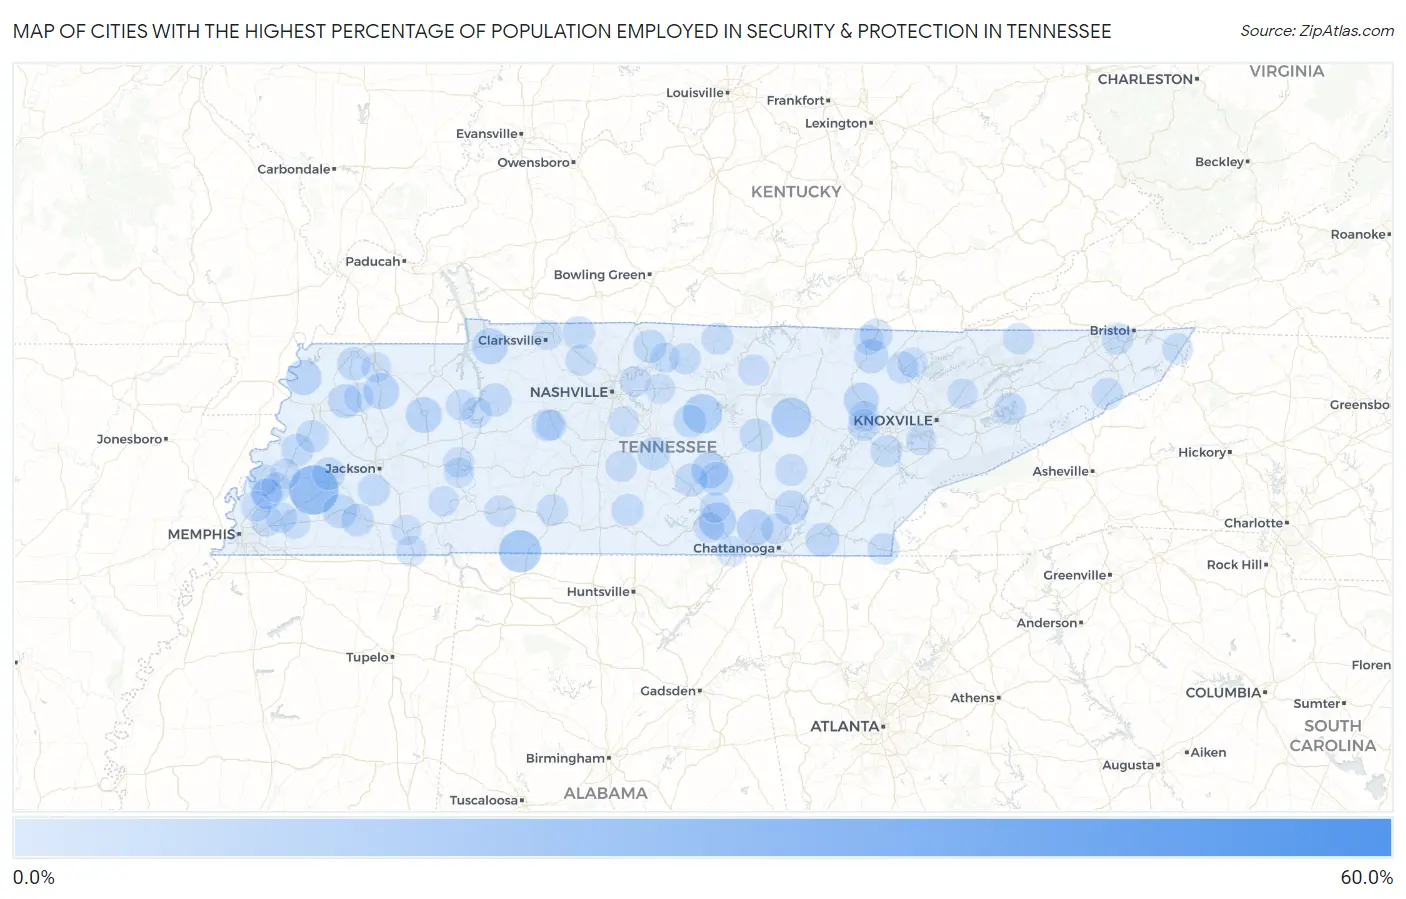
Map of Cities with the Highest Percentage of Population Employed in Security & Protection in Tennessee
0.0%
60.0%
Cities with the Highest Percentage of Population Employed in Security & Protection in Tennessee
| City | % Employed | vs State | vs National | |
| 1. | Pocahontas | 57.7% | 2.1%(+55.6)#1 | 2.1%(+55.5)#19 |
| 2. | Farner | 57.5% | 2.1%(+55.4)#2 | 2.1%(+55.4)#20 |
| 3. | Luray | 47.3% | 2.1%(+45.2)#3 | 2.1%(+45.2)#38 |
| 4. | Essary Springs | 25.0% | 2.1%(+22.9)#4 | 2.1%(+22.9)#182 |
| 5. | Stanton | 24.8% | 2.1%(+22.7)#5 | 2.1%(+22.6)#191 |
| 6. | Palmersville | 20.0% | 2.1%(+17.9)#6 | 2.1%(+17.9)#278 |
| 7. | Rarity Bay | 19.2% | 2.1%(+17.1)#7 | 2.1%(+17.1)#300 |
| 8. | Oak Grove Cdp Sumner County | 17.6% | 2.1%(+15.5)#8 | 2.1%(+15.4)#353 |
| 9. | Iron City | 16.7% | 2.1%(+14.6)#9 | 2.1%(+14.5)#397 |
| 10. | Chewalla | 16.3% | 2.1%(+14.2)#10 | 2.1%(+14.2)#416 |
| 11. | Pleasant Hill | 14.2% | 2.1%(+12.1)#11 | 2.1%(+12.1)#554 |
| 12. | Liberty | 13.5% | 2.1%(+11.4)#12 | 2.1%(+11.4)#613 |
| 13. | Monteagle | 11.6% | 2.1%(+9.49)#13 | 2.1%(+9.44)#827 |
| 14. | Whitwell | 10.3% | 2.1%(+8.22)#14 | 2.1%(+8.17)#1,040 |
| 15. | Morrison | 10.2% | 2.1%(+8.15)#15 | 2.1%(+8.10)#1,050 |
| 16. | Greenfield | 10.0% | 2.1%(+7.86)#16 | 2.1%(+7.80)#1,102 |
| 17. | Dover | 9.8% | 2.1%(+7.74)#17 | 2.1%(+7.69)#1,125 |
| 18. | Huntingdon | 9.8% | 2.1%(+7.69)#18 | 2.1%(+7.64)#1,143 |
| 19. | Beech Bluff | 9.6% | 2.1%(+7.55)#19 | 2.1%(+7.50)#1,168 |
| 20. | Walnut Grove Cdp Sumner County | 9.4% | 2.1%(+7.28)#20 | 2.1%(+7.23)#1,226 |
| 21. | Ridgely | 9.3% | 2.1%(+7.21)#21 | 2.1%(+7.16)#1,240 |
| 22. | Wartburg | 8.8% | 2.1%(+6.70)#22 | 2.1%(+6.64)#1,396 |
| 23. | Huntsville | 8.2% | 2.1%(+6.06)#23 | 2.1%(+6.00)#1,603 |
| 24. | Whiteville | 8.0% | 2.1%(+5.95)#24 | 2.1%(+5.89)#1,644 |
| 25. | Yorkville | 7.9% | 2.1%(+5.83)#25 | 2.1%(+5.78)#1,677 |
| 26. | South Cleveland | 7.8% | 2.1%(+5.69)#26 | 2.1%(+5.64)#1,731 |
| 27. | Flat Top Mountain | 7.7% | 2.1%(+5.63)#27 | 2.1%(+5.58)#1,751 |
| 28. | Viola | 7.4% | 2.1%(+5.31)#28 | 2.1%(+5.26)#1,904 |
| 29. | Waverly | 7.3% | 2.1%(+5.23)#29 | 2.1%(+5.18)#1,934 |
| 30. | Rives | 7.1% | 2.1%(+4.96)#30 | 2.1%(+4.91)#2,043 |
| 31. | Graball | 7.0% | 2.1%(+4.95)#31 | 2.1%(+4.89)#2,055 |
| 32. | Doyle | 7.0% | 2.1%(+4.94)#32 | 2.1%(+4.89)#2,057 |
| 33. | New Union | 6.9% | 2.1%(+4.84)#33 | 2.1%(+4.79)#2,110 |
| 34. | Butler | 6.9% | 2.1%(+4.84)#34 | 2.1%(+4.78)#2,117 |
| 35. | Auburntown | 6.7% | 2.1%(+4.65)#35 | 2.1%(+4.59)#2,214 |
| 36. | Christiana | 6.7% | 2.1%(+4.59)#36 | 2.1%(+4.53)#2,250 |
| 37. | Bolivar | 6.6% | 2.1%(+4.51)#37 | 2.1%(+4.45)#2,303 |
| 38. | Brownsville | 6.6% | 2.1%(+4.46)#38 | 2.1%(+4.40)#2,330 |
| 39. | Ripley | 6.3% | 2.1%(+4.21)#39 | 2.1%(+4.16)#2,492 |
| 40. | Gates | 6.3% | 2.1%(+4.18)#40 | 2.1%(+4.13)#2,511 |
| 41. | Adams | 6.2% | 2.1%(+4.07)#41 | 2.1%(+4.02)#2,578 |
| 42. | Petersburg | 6.0% | 2.1%(+3.91)#42 | 2.1%(+3.86)#2,700 |
| 43. | Lyles | 6.0% | 2.1%(+3.88)#43 | 2.1%(+3.83)#2,723 |
| 44. | Medon | 5.9% | 2.1%(+3.79)#44 | 2.1%(+3.73)#2,819 |
| 45. | Winfield | 5.9% | 2.1%(+3.77)#45 | 2.1%(+3.71)#2,840 |
| 46. | Baneberry | 5.8% | 2.1%(+3.70)#46 | 2.1%(+3.65)#2,884 |
| 47. | Randolph | 5.8% | 2.1%(+3.68)#47 | 2.1%(+3.62)#2,913 |
| 48. | Pikeville | 5.7% | 2.1%(+3.63)#48 | 2.1%(+3.57)#2,943 |
| 49. | Red Boiling Springs | 5.7% | 2.1%(+3.63)#49 | 2.1%(+3.57)#2,944 |
| 50. | Caryville | 5.6% | 2.1%(+3.51)#50 | 2.1%(+3.45)#3,057 |
| 51. | Harriman | 5.6% | 2.1%(+3.47)#51 | 2.1%(+3.42)#3,090 |
| 52. | Erwin | 5.5% | 2.1%(+3.43)#52 | 2.1%(+3.37)#3,133 |
| 53. | Blountville | 5.5% | 2.1%(+3.43)#53 | 2.1%(+3.37)#3,134 |
| 54. | Loudon | 5.5% | 2.1%(+3.36)#54 | 2.1%(+3.30)#3,217 |
| 55. | Ducktown | 5.4% | 2.1%(+3.29)#55 | 2.1%(+3.24)#3,272 |
| 56. | Waynesboro | 5.1% | 2.1%(+3.04)#56 | 2.1%(+2.99)#3,546 |
| 57. | Pleasant View | 4.9% | 2.1%(+2.84)#57 | 2.1%(+2.79)#3,758 |
| 58. | Chapel Hill | 4.9% | 2.1%(+2.83)#58 | 2.1%(+2.78)#3,776 |
| 59. | Gilt Edge | 4.9% | 2.1%(+2.83)#59 | 2.1%(+2.78)#3,777 |
| 60. | Hartsville Trousdale County | 4.9% | 2.1%(+2.77)#60 | 2.1%(+2.71)#3,854 |
| 61. | Briceville | 4.9% | 2.1%(+2.76)#61 | 2.1%(+2.71)#3,863 |
| 62. | Sneedville | 4.8% | 2.1%(+2.76)#62 | 2.1%(+2.70)#3,868 |
| 63. | Ethridge | 4.8% | 2.1%(+2.75)#63 | 2.1%(+2.70)#3,875 |
| 64. | Dodson Branch | 4.8% | 2.1%(+2.70)#64 | 2.1%(+2.64)#3,931 |
| 65. | Hampton | 4.7% | 2.1%(+2.57)#65 | 2.1%(+2.51)#4,096 |
| 66. | New Johnsonville | 4.6% | 2.1%(+2.55)#66 | 2.1%(+2.50)#4,108 |
| 67. | Atoka | 4.6% | 2.1%(+2.48)#67 | 2.1%(+2.43)#4,209 |
| 68. | Oakdale | 4.5% | 2.1%(+2.45)#68 | 2.1%(+2.40)#4,250 |
| 69. | Bartlett | 4.5% | 2.1%(+2.44)#69 | 2.1%(+2.39)#4,269 |
| 70. | Mountain City | 4.5% | 2.1%(+2.39)#70 | 2.1%(+2.33)#4,344 |
| 71. | Parsons | 4.4% | 2.1%(+2.34)#71 | 2.1%(+2.28)#4,419 |
| 72. | Munford | 4.4% | 2.1%(+2.32)#72 | 2.1%(+2.26)#4,452 |
| 73. | Arlington | 4.3% | 2.1%(+2.25)#73 | 2.1%(+2.19)#4,555 |
| 74. | Camden | 4.3% | 2.1%(+2.23)#74 | 2.1%(+2.17)#4,585 |
| 75. | Guys | 4.3% | 2.1%(+2.17)#75 | 2.1%(+2.12)#4,657 |
| 76. | Sullivan Gardens | 4.2% | 2.1%(+2.15)#76 | 2.1%(+2.09)#4,697 |
| 77. | Fairmount | 4.2% | 2.1%(+2.14)#77 | 2.1%(+2.09)#4,700 |
| 78. | Millington | 4.2% | 2.1%(+2.14)#78 | 2.1%(+2.08)#4,711 |
| 79. | Bon Aqua Junction | 4.2% | 2.1%(+2.11)#79 | 2.1%(+2.05)#4,755 |
| 80. | Covington | 4.1% | 2.1%(+2.03)#80 | 2.1%(+1.97)#4,886 |
| 81. | Sewanee | 4.1% | 2.1%(+2.00)#81 | 2.1%(+1.95)#4,941 |
| 82. | Green Hill | 4.1% | 2.1%(+2.00)#82 | 2.1%(+1.94)#4,953 |
| 83. | Pelham | 4.0% | 2.1%(+1.92)#83 | 2.1%(+1.87)#5,059 |
| 84. | Louisville | 4.0% | 2.1%(+1.92)#84 | 2.1%(+1.86)#5,076 |
| 85. | Saltillo | 4.0% | 2.1%(+1.91)#85 | 2.1%(+1.85)#5,091 |
| 86. | Blaine | 3.9% | 2.1%(+1.85)#86 | 2.1%(+1.79)#5,212 |
| 87. | Lebanon | 3.9% | 2.1%(+1.78)#87 | 2.1%(+1.73)#5,346 |
| 88. | South Pittsburg | 3.8% | 2.1%(+1.73)#88 | 2.1%(+1.67)#5,466 |
| 89. | Decaturville | 3.8% | 2.1%(+1.68)#89 | 2.1%(+1.63)#5,547 |
| 90. | Castalian Springs | 3.8% | 2.1%(+1.66)#90 | 2.1%(+1.61)#5,579 |
| 91. | Martin | 3.8% | 2.1%(+1.66)#91 | 2.1%(+1.61)#5,588 |
| 92. | La Follette | 3.8% | 2.1%(+1.66)#92 | 2.1%(+1.60)#5,595 |
| 93. | Oakland | 3.7% | 2.1%(+1.65)#93 | 2.1%(+1.60)#5,614 |
| 94. | Brighton | 3.7% | 2.1%(+1.62)#94 | 2.1%(+1.56)#5,684 |
| 95. | Strawberry Plains | 3.7% | 2.1%(+1.59)#95 | 2.1%(+1.53)#5,755 |
| 96. | Oneida | 3.7% | 2.1%(+1.57)#96 | 2.1%(+1.51)#5,794 |
| 97. | Selmer | 3.6% | 2.1%(+1.54)#97 | 2.1%(+1.49)#5,847 |
| 98. | Clarksville | 3.6% | 2.1%(+1.49)#98 | 2.1%(+1.44)#5,935 |
| 99. | Nolensville | 3.5% | 2.1%(+1.44)#99 | 2.1%(+1.39)#6,041 |
| 100. | Rutherford | 3.5% | 2.1%(+1.38)#100 | 2.1%(+1.32)#6,205 |
Common Questions
What are the Top 10 Cities with the Highest Percentage of Population Employed in Security & Protection in Tennessee?
Top 10 Cities with the Highest Percentage of Population Employed in Security & Protection in Tennessee are:
#1
24.8%
#2
16.7%
#3
14.2%
#4
13.5%
#5
11.6%
#6
10.3%
#7
10.2%
#8
10.0%
#9
9.8%
#10
9.8%
What city has the Highest Percentage of Population Employed in Security & Protection in Tennessee?
Stanton has the Highest Percentage of Population Employed in Security & Protection in Tennessee with 24.8%.
What is the Percentage of Population Employed in Security & Protection in the State of Tennessee?
Percentage of Population Employed in Security & Protection in Tennessee is 2.1%.
What is the Percentage of Population Employed in Security & Protection in the United States?
Percentage of Population Employed in Security & Protection in the United States is 2.1%.