Cities with the Highest Percentage of Population Employed in Security & Protection in Nevada
RELATED REPORTS & OPTIONS
Security & Protection
Nevada
Compare Cities
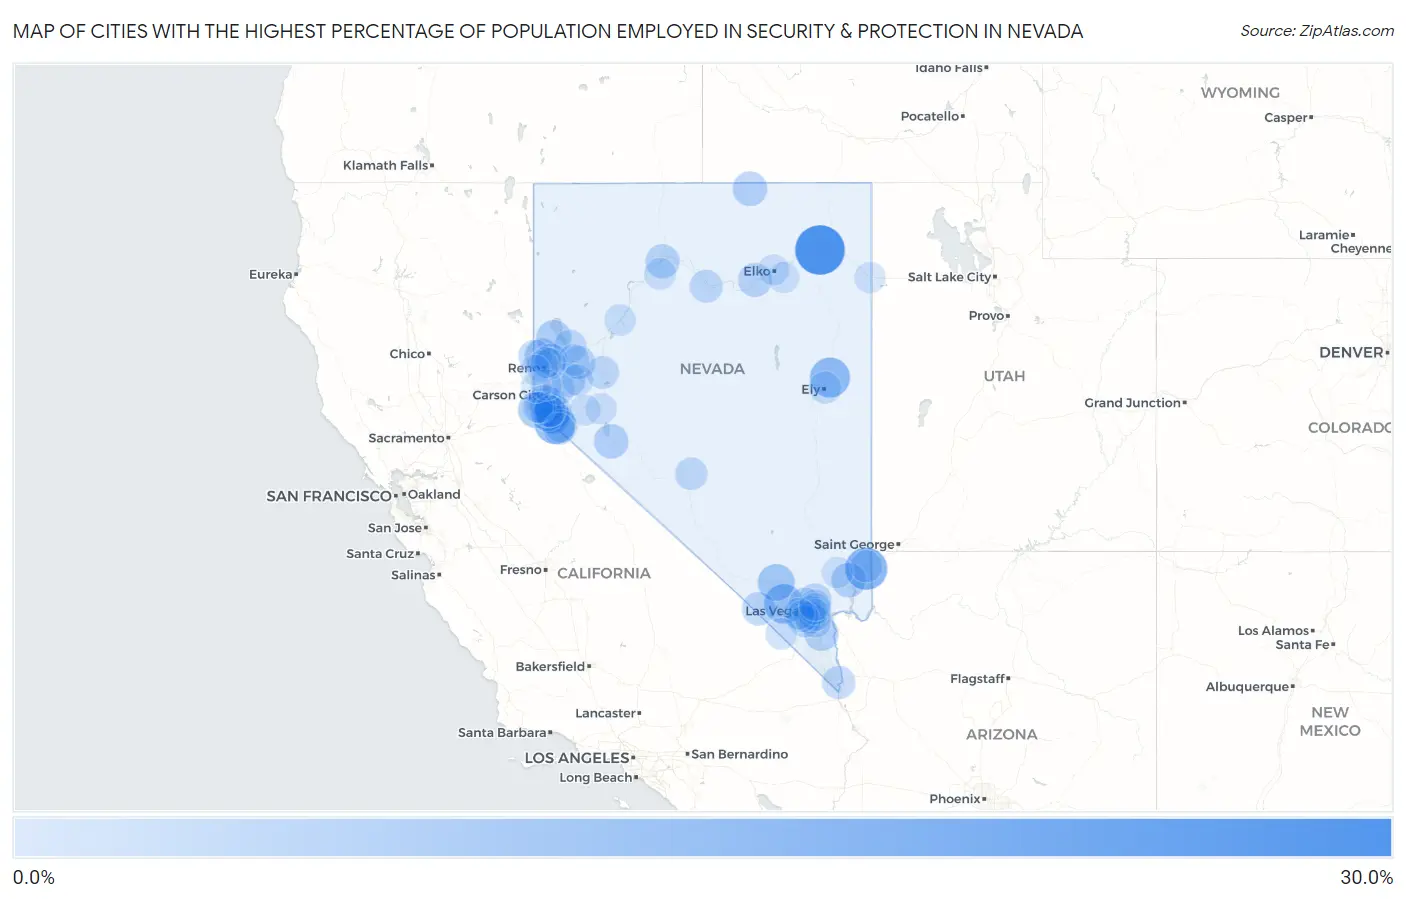
Map of Cities with the Highest Percentage of Population Employed in Security & Protection in Nevada
0.0%
30.0%
Cities with the Highest Percentage of Population Employed in Security & Protection in Nevada
| City | % Employed | vs State | vs National | |
| 1. | Wells | 28.1% | 3.0%(+25.0)#1 | 2.1%(+25.9)#135 |
| 2. | Bunkerville | 16.9% | 3.0%(+13.8)#2 | 2.1%(+14.7)#389 |
| 3. | Double Spring | 14.7% | 3.0%(+11.6)#3 | 2.1%(+12.5)#505 |
| 4. | Mcgill | 14.0% | 3.0%(+11.0)#4 | 2.1%(+11.9)#561 |
| 5. | Mount Charleston | 13.0% | 3.0%(+9.94)#5 | 2.1%(+10.8)#666 |
| 6. | Indian Springs | 9.4% | 3.0%(+6.40)#6 | 2.1%(+7.29)#1,213 |
| 7. | Ruhenstroth | 9.1% | 3.0%(+6.12)#7 | 2.1%(+7.00)#1,273 |
| 8. | Stateline | 8.5% | 3.0%(+5.50)#8 | 2.1%(+6.39)#1,476 |
| 9. | Lemmon Valley | 7.4% | 3.0%(+4.42)#9 | 2.1%(+5.30)#1,882 |
| 10. | Sutcliffe | 6.7% | 3.0%(+3.64)#10 | 2.1%(+4.52)#2,264 |
| 11. | Fish Springs | 6.6% | 3.0%(+3.57)#11 | 2.1%(+4.46)#2,302 |
| 12. | Moapa Valley | 6.5% | 3.0%(+3.42)#12 | 2.1%(+4.30)#2,383 |
| 13. | Owyhee | 6.1% | 3.0%(+3.08)#13 | 2.1%(+3.96)#2,620 |
| 14. | Hawthorne | 6.1% | 3.0%(+3.06)#14 | 2.1%(+3.94)#2,634 |
| 15. | Carter Springs | 6.0% | 3.0%(+2.96)#15 | 2.1%(+3.84)#2,715 |
| 16. | Boulder City | 5.8% | 3.0%(+2.77)#16 | 2.1%(+3.65)#2,879 |
| 17. | Johnson Lane | 5.5% | 3.0%(+2.45)#17 | 2.1%(+3.33)#3,190 |
| 18. | Winnemucca | 5.4% | 3.0%(+2.34)#18 | 2.1%(+3.22)#3,287 |
| 19. | Carlin | 5.1% | 3.0%(+2.12)#19 | 2.1%(+3.00)#3,532 |
| 20. | Stagecoach | 4.9% | 3.0%(+1.91)#20 | 2.1%(+2.79)#3,757 |
| 21. | Pahrump | 4.9% | 3.0%(+1.85)#21 | 2.1%(+2.73)#3,827 |
| 22. | Fernley | 4.6% | 3.0%(+1.53)#22 | 2.1%(+2.42)#4,226 |
| 23. | Laughlin | 4.3% | 3.0%(+1.28)#23 | 2.1%(+2.16)#4,595 |
| 24. | Indian Hills | 4.3% | 3.0%(+1.22)#24 | 2.1%(+2.11)#4,677 |
| 25. | Cold Springs | 4.2% | 3.0%(+1.12)#25 | 2.1%(+2.01)#4,829 |
| 26. | North Las Vegas | 4.1% | 3.0%(+1.08)#26 | 2.1%(+1.96)#4,919 |
| 27. | Battle Mountain | 3.9% | 3.0%(+0.896)#27 | 2.1%(+1.78)#5,233 |
| 28. | Nixon | 3.9% | 3.0%(+0.865)#28 | 2.1%(+1.75)#5,289 |
| 29. | Winchester | 3.9% | 3.0%(+0.860)#29 | 2.1%(+1.74)#5,298 |
| 30. | Minden | 3.8% | 3.0%(+0.813)#30 | 2.1%(+1.70)#5,427 |
| 31. | Spanish Springs | 3.8% | 3.0%(+0.733)#31 | 2.1%(+1.62)#5,562 |
| 32. | Fallon | 3.7% | 3.0%(+0.677)#32 | 2.1%(+1.56)#5,685 |
| 33. | Topaz Ranch Estates | 3.7% | 3.0%(+0.656)#33 | 2.1%(+1.54)#5,740 |
| 34. | Gardnerville | 3.3% | 3.0%(+0.292)#34 | 2.1%(+1.17)#6,580 |
| 35. | Tonopah | 3.2% | 3.0%(+0.212)#35 | 2.1%(+1.09)#6,762 |
| 36. | Henderson | 3.2% | 3.0%(+0.179)#36 | 2.1%(+1.06)#6,851 |
| 37. | Las Vegas | 3.2% | 3.0%(+0.148)#37 | 2.1%(+1.03)#6,926 |
| 38. | Paradise | 3.1% | 3.0%(+0.114)#38 | 2.1%(+0.997)#7,025 |
| 39. | Carson | 3.0% | 3.0%(-0.079)#39 | 2.1%(+0.803)#7,650 |
| 40. | Mesquite | 2.9% | 3.0%(-0.087)#40 | 2.1%(+0.796)#7,668 |
| 41. | Enterprise | 2.9% | 3.0%(-0.095)#41 | 2.1%(+0.787)#7,704 |
| 42. | Gardnerville Ranchos | 2.9% | 3.0%(-0.115)#42 | 2.1%(+0.767)#7,774 |
| 43. | Ely | 2.9% | 3.0%(-0.132)#43 | 2.1%(+0.750)#7,825 |
| 44. | Topaz Lake | 2.9% | 3.0%(-0.174)#44 | 2.1%(+0.709)#7,960 |
| 45. | Whitney | 2.8% | 3.0%(-0.242)#45 | 2.1%(+0.641)#8,188 |
| 46. | Dayton | 2.8% | 3.0%(-0.278)#46 | 2.1%(+0.604)#8,302 |
| 47. | Reno | 2.6% | 3.0%(-0.439)#47 | 2.1%(+0.444)#8,850 |
| 48. | Sunrise Manor | 2.5% | 3.0%(-0.526)#48 | 2.1%(+0.357)#9,190 |
| 49. | Spring Valley | 2.4% | 3.0%(-0.631)#49 | 2.1%(+0.251)#9,601 |
| 50. | Wadsworth | 2.4% | 3.0%(-0.657)#50 | 2.1%(+0.225)#9,707 |
| 51. | Silver Springs | 2.2% | 3.0%(-0.857)#51 | 2.1%(+0.025)#10,555 |
| 52. | Summerlin South | 2.2% | 3.0%(-0.870)#52 | 2.1%(+0.013)#10,622 |
| 53. | Kingsbury | 2.1% | 3.0%(-0.903)#53 | 2.1%(-0.021)#10,756 |
| 54. | Sandy Valley | 2.1% | 3.0%(-0.951)#54 | 2.1%(-0.068)#10,986 |
| 55. | Grass Valley | 2.1% | 3.0%(-0.971)#55 | 2.1%(-0.088)#11,096 |
| 56. | Sparks | 2.1% | 3.0%(-0.977)#56 | 2.1%(-0.094)#11,130 |
| 57. | East Valley | 2.0% | 3.0%(-0.995)#57 | 2.1%(-0.113)#11,214 |
| 58. | Nellis Afb | 2.0% | 3.0%(-1.02)#58 | 2.1%(-0.134)#11,314 |
| 59. | Lovelock | 1.7% | 3.0%(-1.32)#59 | 2.1%(-0.436)#12,800 |
| 60. | Washoe Valley | 1.7% | 3.0%(-1.36)#60 | 2.1%(-0.474)#13,012 |
| 61. | Schurz | 1.6% | 3.0%(-1.41)#61 | 2.1%(-0.525)#13,281 |
| 62. | Yerington | 1.5% | 3.0%(-1.52)#62 | 2.1%(-0.639)#13,886 |
| 63. | West Wendover | 1.4% | 3.0%(-1.66)#63 | 2.1%(-0.782)#14,678 |
| 64. | Spring Creek | 1.4% | 3.0%(-1.67)#64 | 2.1%(-0.786)#14,701 |
| 65. | Sun Valley | 1.3% | 3.0%(-1.71)#65 | 2.1%(-0.832)#14,948 |
| 66. | Moapa Town | 1.3% | 3.0%(-1.76)#66 | 2.1%(-0.875)#15,201 |
| 67. | Elko | 1.3% | 3.0%(-1.78)#67 | 2.1%(-0.896)#15,321 |
| 68. | Round Hill Village | 1.2% | 3.0%(-1.83)#68 | 2.1%(-0.949)#15,622 |
| 69. | Incline Village | 0.56% | 3.0%(-2.47)#69 | 2.1%(-1.59)#18,824 |
| 70. | Verdi | 0.55% | 3.0%(-2.48)#70 | 2.1%(-1.59)#18,852 |
1
2Common Questions
What are the Top 10 Cities with the Highest Percentage of Population Employed in Security & Protection in Nevada?
Top 10 Cities with the Highest Percentage of Population Employed in Security & Protection in Nevada are:
#1
28.1%
#2
16.9%
#3
14.7%
#4
14.0%
#5
13.0%
#6
9.4%
#7
9.1%
#8
8.5%
#9
7.4%
#10
6.7%
What city has the Highest Percentage of Population Employed in Security & Protection in Nevada?
Wells has the Highest Percentage of Population Employed in Security & Protection in Nevada with 28.1%.
What is the Percentage of Population Employed in Security & Protection in the State of Nevada?
Percentage of Population Employed in Security & Protection in Nevada is 3.0%.
What is the Percentage of Population Employed in Security & Protection in the United States?
Percentage of Population Employed in Security & Protection in the United States is 2.1%.