Cities with the Highest Percentage of Population Employed in Security & Protection in Hawaii
RELATED REPORTS & OPTIONS
Security & Protection
Hawaii
Compare Cities
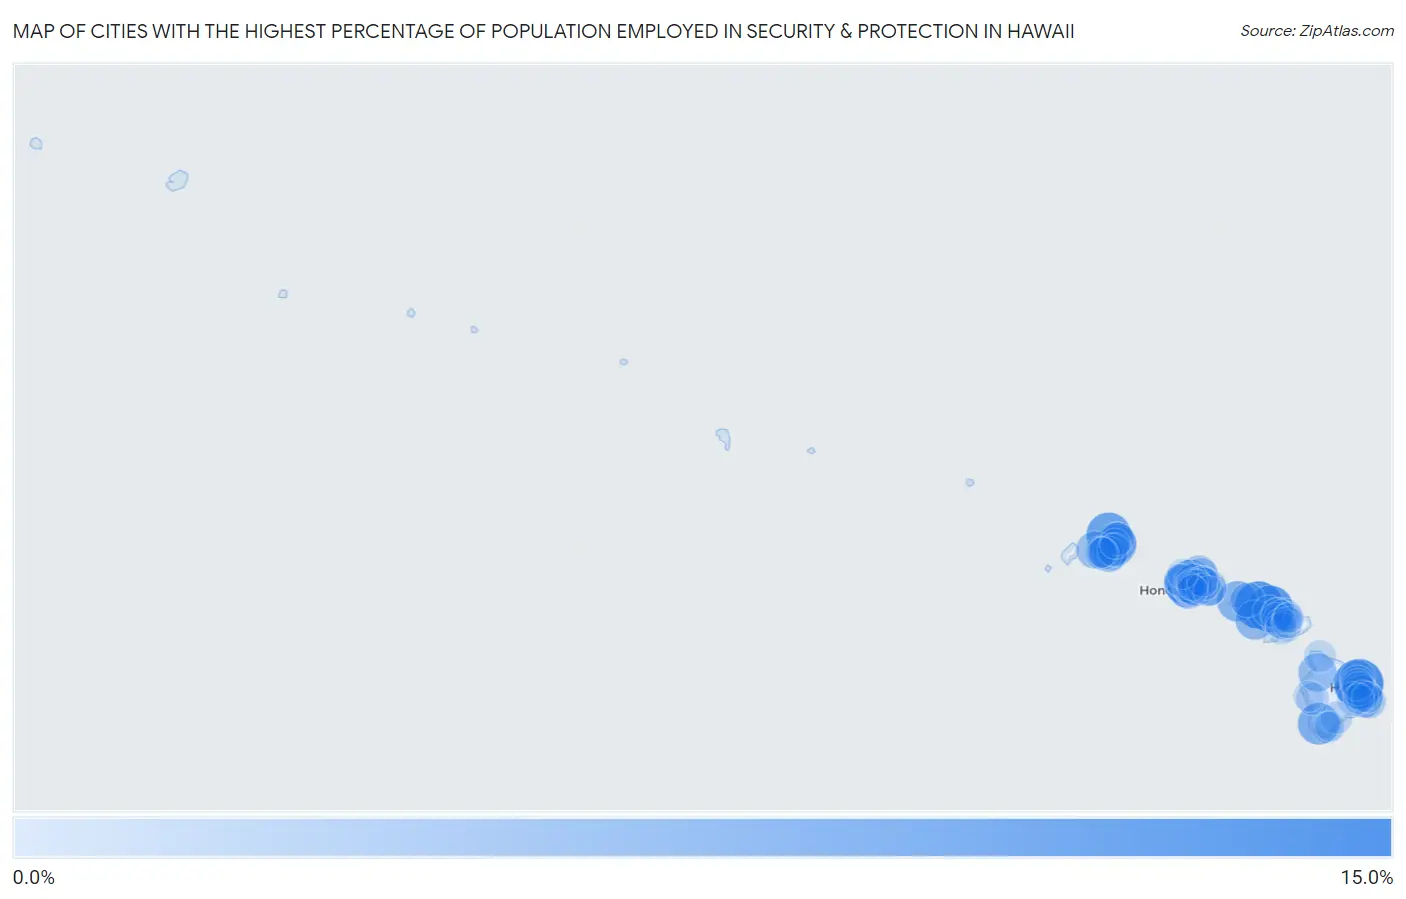
Map of Cities with the Highest Percentage of Population Employed in Security & Protection in Hawaii
0.0%
15.0%
Cities with the Highest Percentage of Population Employed in Security & Protection in Hawaii
| City | % Employed | vs State | vs National | |
| 1. | Paukaa | 14.6% | 3.4%(+11.2)#1 | 2.1%(+12.5)#511 |
| 2. | Ualapue | 13.2% | 3.4%(+9.85)#2 | 2.1%(+11.1)#639 |
| 3. | Kapalua | 12.7% | 3.4%(+9.33)#3 | 2.1%(+10.6)#691 |
| 4. | Princeville | 11.5% | 3.4%(+8.13)#4 | 2.1%(+9.35)#838 |
| 5. | Hawaiian Ocean View | 9.6% | 3.4%(+6.25)#5 | 2.1%(+7.48)#1,170 |
| 6. | Kaneohe Base | 9.0% | 3.4%(+5.66)#6 | 2.1%(+6.89)#1,325 |
| 7. | Maunaloa | 8.9% | 3.4%(+5.50)#7 | 2.1%(+6.72)#1,379 |
| 8. | Wailua | 8.7% | 3.4%(+5.30)#8 | 2.1%(+6.52)#1,441 |
| 9. | Kapaa | 8.5% | 3.4%(+5.10)#9 | 2.1%(+6.32)#1,497 |
| 10. | West Loch Estate | 8.3% | 3.4%(+4.96)#10 | 2.1%(+6.18)#1,551 |
| 11. | Lanai City | 8.1% | 3.4%(+4.72)#11 | 2.1%(+5.95)#1,625 |
| 12. | Waipio Acres | 7.6% | 3.4%(+4.26)#12 | 2.1%(+5.48)#1,785 |
| 13. | Omao | 7.6% | 3.4%(+4.25)#13 | 2.1%(+5.47)#1,788 |
| 14. | Waikoloa Village | 7.5% | 3.4%(+4.14)#14 | 2.1%(+5.37)#1,844 |
| 15. | Nanakuli | 7.4% | 3.4%(+3.98)#15 | 2.1%(+5.20)#1,924 |
| 16. | Ainaloa | 7.1% | 3.4%(+3.68)#16 | 2.1%(+4.91)#2,046 |
| 17. | Kalaeloa | 7.1% | 3.4%(+3.68)#17 | 2.1%(+4.90)#2,047 |
| 18. | Maili | 7.0% | 3.4%(+3.60)#18 | 2.1%(+4.82)#2,093 |
| 19. | Ko Olina | 6.9% | 3.4%(+3.53)#19 | 2.1%(+4.76)#2,127 |
| 20. | Kekaha | 6.9% | 3.4%(+3.52)#20 | 2.1%(+4.75)#2,130 |
| 21. | Schofield Barracks | 6.8% | 3.4%(+3.46)#21 | 2.1%(+4.69)#2,170 |
| 22. | Punaluu | 6.4% | 3.4%(+3.02)#22 | 2.1%(+4.24)#2,430 |
| 23. | Whitmore Village | 6.2% | 3.4%(+2.79)#23 | 2.1%(+4.02)#2,579 |
| 24. | Kaloko | 6.1% | 3.4%(+2.70)#24 | 2.1%(+3.93)#2,644 |
| 25. | Waimanalo | 6.0% | 3.4%(+2.60)#25 | 2.1%(+3.83)#2,722 |
| 26. | Ewa Villages | 5.9% | 3.4%(+2.53)#26 | 2.1%(+3.76)#2,786 |
| 27. | Royal Kunia | 5.6% | 3.4%(+2.26)#27 | 2.1%(+3.48)#3,032 |
| 28. | Iroquois Point | 5.6% | 3.4%(+2.22)#28 | 2.1%(+3.45)#3,059 |
| 29. | Honomu | 5.3% | 3.4%(+1.89)#29 | 2.1%(+3.11)#3,410 |
| 30. | Kualapuu | 5.1% | 3.4%(+1.77)#30 | 2.1%(+2.99)#3,540 |
| 31. | Makakilo | 5.1% | 3.4%(+1.75)#31 | 2.1%(+2.98)#3,559 |
| 32. | Waianae | 5.1% | 3.4%(+1.69)#32 | 2.1%(+2.92)#3,628 |
| 33. | Helemano | 5.0% | 3.4%(+1.63)#33 | 2.1%(+2.85)#3,682 |
| 34. | Keaau | 5.0% | 3.4%(+1.61)#34 | 2.1%(+2.83)#3,710 |
| 35. | Leilani Estates | 4.9% | 3.4%(+1.49)#35 | 2.1%(+2.72)#3,851 |
| 36. | Lihue | 4.8% | 3.4%(+1.43)#36 | 2.1%(+2.66)#3,917 |
| 37. | Hickam Housing | 4.8% | 3.4%(+1.38)#37 | 2.1%(+2.60)#3,973 |
| 38. | Kaaawa | 4.7% | 3.4%(+1.37)#38 | 2.1%(+2.60)#3,978 |
| 39. | East Kapolei | 4.7% | 3.4%(+1.32)#39 | 2.1%(+2.55)#4,043 |
| 40. | Waiahole-Waikane | 4.7% | 3.4%(+1.29)#40 | 2.1%(+2.52)#4,092 |
| 41. | Mililani Town | 4.6% | 3.4%(+1.26)#41 | 2.1%(+2.49)#4,122 |
| 42. | Papaikou | 4.6% | 3.4%(+1.25)#42 | 2.1%(+2.47)#4,151 |
| 43. | Waimea Cdp Hawaii County | 4.5% | 3.4%(+1.17)#43 | 2.1%(+2.40)#4,237 |
| 44. | Wahiawa | 4.5% | 3.4%(+1.17)#44 | 2.1%(+2.39)#4,265 |
| 45. | Wheeler Afb | 4.5% | 3.4%(+1.14)#45 | 2.1%(+2.37)#4,295 |
| 46. | Koloa | 4.5% | 3.4%(+1.11)#46 | 2.1%(+2.34)#4,337 |
| 47. | Mountain View | 4.5% | 3.4%(+1.11)#47 | 2.1%(+2.33)#4,342 |
| 48. | Hilo | 4.5% | 3.4%(+1.08)#48 | 2.1%(+2.31)#4,384 |
| 49. | Kalaheo | 4.4% | 3.4%(+0.977)#49 | 2.1%(+2.20)#4,530 |
| 50. | Ocean Pointe | 4.3% | 3.4%(+0.972)#50 | 2.1%(+2.20)#4,552 |
| 51. | Wailuku | 4.2% | 3.4%(+0.852)#51 | 2.1%(+2.08)#4,714 |
| 52. | Anahola | 4.1% | 3.4%(+0.758)#52 | 2.1%(+1.98)#4,857 |
| 53. | Waimanalo Beach | 4.1% | 3.4%(+0.741)#53 | 2.1%(+1.97)#4,895 |
| 54. | Kealakekua | 4.1% | 3.4%(+0.690)#54 | 2.1%(+1.92)#4,984 |
| 55. | Pearl City | 4.0% | 3.4%(+0.659)#55 | 2.1%(+1.89)#5,031 |
| 56. | Paia | 4.0% | 3.4%(+0.600)#56 | 2.1%(+1.83)#5,148 |
| 57. | Heeia | 3.9% | 3.4%(+0.549)#57 | 2.1%(+1.78)#5,242 |
| 58. | Maalaea | 3.9% | 3.4%(+0.521)#58 | 2.1%(+1.75)#5,291 |
| 59. | Kahului | 3.8% | 3.4%(+0.450)#59 | 2.1%(+1.68)#5,458 |
| 60. | Eleele | 3.8% | 3.4%(+0.418)#60 | 2.1%(+1.64)#5,507 |
| 61. | Ahuimanu | 3.8% | 3.4%(+0.415)#61 | 2.1%(+1.64)#5,514 |
| 62. | Puhi | 3.8% | 3.4%(+0.400)#62 | 2.1%(+1.63)#5,540 |
| 63. | Halawa | 3.7% | 3.4%(+0.286)#63 | 2.1%(+1.51)#5,795 |
| 64. | Kaneohe | 3.6% | 3.4%(+0.271)#64 | 2.1%(+1.50)#5,829 |
| 65. | Pahala | 3.6% | 3.4%(+0.268)#65 | 2.1%(+1.49)#5,841 |
| 66. | Kaumakani | 3.6% | 3.4%(+0.205)#66 | 2.1%(+1.43)#5,949 |
| 67. | Waihee Waiehu | 3.5% | 3.4%(+0.138)#67 | 2.1%(+1.36)#6,086 |
| 68. | Halaula | 3.5% | 3.4%(+0.134)#68 | 2.1%(+1.36)#6,092 |
| 69. | Makaha | 3.5% | 3.4%(+0.092)#69 | 2.1%(+1.32)#6,212 |
| 70. | Kaiminani | 3.4% | 3.4%(+0.051)#70 | 2.1%(+1.28)#6,303 |
| 71. | Wainaku | 3.4% | 3.4%(+0.042)#71 | 2.1%(+1.27)#6,335 |
| 72. | Mililani Mauka | 3.4% | 3.4%(+0.039)#72 | 2.1%(+1.27)#6,340 |
| 73. | Waikapu | 3.3% | 3.4%(-0.033)#73 | 2.1%(+1.19)#6,521 |
| 74. | Keokea | 3.3% | 3.4%(-0.062)#74 | 2.1%(+1.16)#6,604 |
| 75. | Discovery Harbour | 3.3% | 3.4%(-0.084)#75 | 2.1%(+1.14)#6,646 |
| 76. | Mahinahina | 3.2% | 3.4%(-0.134)#76 | 2.1%(+1.09)#6,768 |
| 77. | Wailea | 3.2% | 3.4%(-0.135)#77 | 2.1%(+1.09)#6,772 |
| 78. | Orchidlands Estates | 3.1% | 3.4%(-0.246)#78 | 2.1%(+0.981)#7,068 |
| 79. | Waipio | 3.1% | 3.4%(-0.249)#79 | 2.1%(+0.978)#7,072 |
| 80. | Waimalu | 3.0% | 3.4%(-0.413)#80 | 2.1%(+0.813)#7,621 |
| 81. | Kihei | 2.9% | 3.4%(-0.481)#81 | 2.1%(+0.745)#7,843 |
| 82. | Kula | 2.9% | 3.4%(-0.487)#82 | 2.1%(+0.739)#7,865 |
| 83. | Ewa Gentry | 2.9% | 3.4%(-0.489)#83 | 2.1%(+0.738)#7,872 |
| 84. | Kahaluu Keauhou | 2.9% | 3.4%(-0.490)#84 | 2.1%(+0.736)#7,881 |
| 85. | Waimea Cdp Kauai County | 2.8% | 3.4%(-0.540)#85 | 2.1%(+0.686)#8,038 |
| 86. | Kailua Cdp Honolulu County | 2.8% | 3.4%(-0.549)#86 | 2.1%(+0.677)#8,067 |
| 87. | Hawaiian Beaches | 2.8% | 3.4%(-0.564)#87 | 2.1%(+0.662)#8,118 |
| 88. | Kapolei | 2.7% | 3.4%(-0.664)#88 | 2.1%(+0.562)#8,453 |
| 89. | Waipahu | 2.7% | 3.4%(-0.718)#89 | 2.1%(+0.508)#8,623 |
| 90. | Urban Honolulu | 2.6% | 3.4%(-0.731)#90 | 2.1%(+0.496)#8,671 |
| 91. | East Honolulu | 2.6% | 3.4%(-0.772)#91 | 2.1%(+0.455)#8,817 |
| 92. | Pukalani | 2.6% | 3.4%(-0.805)#92 | 2.1%(+0.422)#8,945 |
| 93. | Kahaluu | 2.6% | 3.4%(-0.809)#93 | 2.1%(+0.418)#8,954 |
| 94. | Makawao | 2.6% | 3.4%(-0.824)#94 | 2.1%(+0.402)#9,013 |
| 95. | Mokuleia | 2.5% | 3.4%(-0.826)#95 | 2.1%(+0.401)#9,020 |
| 96. | Naalehu | 2.5% | 3.4%(-0.884)#96 | 2.1%(+0.343)#9,240 |
| 97. | Hanapepe | 2.5% | 3.4%(-0.916)#97 | 2.1%(+0.310)#9,361 |
| 98. | Fern Acres | 2.4% | 3.4%(-0.928)#98 | 2.1%(+0.299)#9,402 |
| 99. | Ewa Beach | 2.4% | 3.4%(-0.951)#99 | 2.1%(+0.275)#9,487 |
| 100. | Wailua Homesteads | 2.4% | 3.4%(-0.957)#100 | 2.1%(+0.269)#9,512 |
1
2Common Questions
What are the Top 10 Cities with the Highest Percentage of Population Employed in Security & Protection in Hawaii?
Top 10 Cities with the Highest Percentage of Population Employed in Security & Protection in Hawaii are:
#1
14.6%
#2
13.2%
#3
12.7%
#4
11.5%
#5
9.6%
#6
8.9%
#7
8.7%
#8
8.5%
#9
8.3%
#10
8.1%
What city has the Highest Percentage of Population Employed in Security & Protection in Hawaii?
Paukaa has the Highest Percentage of Population Employed in Security & Protection in Hawaii with 14.6%.
What is the Percentage of Population Employed in Security & Protection in the State of Hawaii?
Percentage of Population Employed in Security & Protection in Hawaii is 3.4%.
What is the Percentage of Population Employed in Security & Protection in the United States?
Percentage of Population Employed in Security & Protection in the United States is 2.1%.