Cities with the Highest Percentage of Population Employed in Security & Protection in Kansas
RELATED REPORTS & OPTIONS
Security & Protection
Kansas
Compare Cities
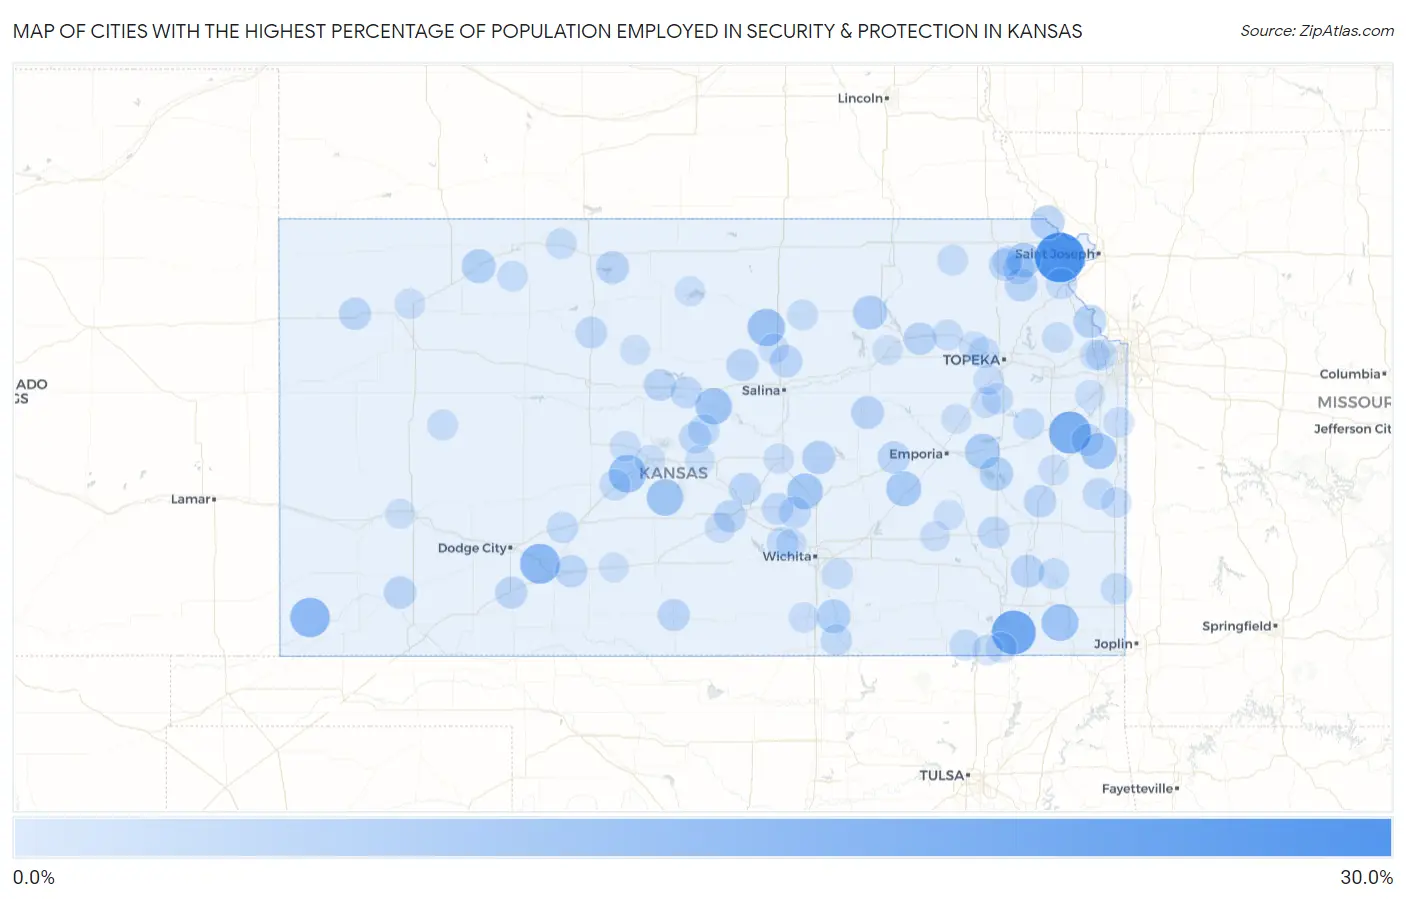
Map of Cities with the Highest Percentage of Population Employed in Security & Protection in Kansas
0.0%
30.0%
Cities with the Highest Percentage of Population Employed in Security & Protection in Kansas
| City | % Employed | vs State | vs National | |
| 1. | Bendena | 26.6% | 1.8%(+24.8)#1 | 2.1%(+24.4)#153 |
| 2. | Liberty | 19.7% | 1.8%(+17.9)#2 | 2.1%(+17.5)#284 |
| 3. | Keats | 19.5% | 1.8%(+17.7)#3 | 2.1%(+17.4)#290 |
| 4. | Yale | 18.5% | 1.8%(+16.7)#4 | 2.1%(+16.4)#315 |
| 5. | Rantoul | 17.3% | 1.8%(+15.5)#5 | 2.1%(+15.2)#368 |
| 6. | Ford | 14.8% | 1.8%(+13.0)#6 | 2.1%(+12.6)#500 |
| 7. | Richfield | 14.3% | 1.8%(+12.5)#7 | 2.1%(+12.1)#550 |
| 8. | Pawnee Rock | 11.9% | 1.8%(+10.2)#8 | 2.1%(+9.79)#768 |
| 9. | Delphos | 11.7% | 1.8%(+9.91)#9 | 2.1%(+9.54)#811 |
| 10. | Labette | 11.1% | 1.8%(+9.34)#10 | 2.1%(+8.96)#909 |
| 11. | Hudson | 10.9% | 1.8%(+9.13)#11 | 2.1%(+8.76)#939 |
| 12. | Ellsworth | 10.6% | 1.8%(+8.84)#12 | 2.1%(+8.47)#994 |
| 13. | Hesston | 9.8% | 1.8%(+8.05)#13 | 2.1%(+7.68)#1,128 |
| 14. | Fontana | 9.8% | 1.8%(+8.01)#14 | 2.1%(+7.64)#1,141 |
| 15. | Matfield Green | 9.1% | 1.8%(+7.32)#15 | 2.1%(+6.94)#1,308 |
| 16. | Lebo | 8.9% | 1.8%(+7.16)#16 | 2.1%(+6.79)#1,350 |
| 17. | Willis | 8.3% | 1.8%(+6.56)#17 | 2.1%(+6.18)#1,550 |
| 18. | Leonardville | 7.9% | 1.8%(+6.14)#18 | 2.1%(+5.77)#1,683 |
| 19. | White Cloud | 7.9% | 1.8%(+6.12)#19 | 2.1%(+5.75)#1,689 |
| 20. | Jennings | 7.7% | 1.8%(+5.92)#20 | 2.1%(+5.54)#1,766 |
| 21. | New Strawn | 7.6% | 1.8%(+5.78)#21 | 2.1%(+5.41)#1,820 |
| 22. | Oxford | 7.5% | 1.8%(+5.72)#22 | 2.1%(+5.34)#1,857 |
| 23. | Lehigh | 7.1% | 1.8%(+5.37)#23 | 2.1%(+4.99)#2,005 |
| 24. | Leavenworth | 6.8% | 1.8%(+5.02)#24 | 2.1%(+4.65)#2,182 |
| 25. | Muscotah | 6.7% | 1.8%(+4.89)#25 | 2.1%(+4.52)#2,270 |
| 26. | Kirwin | 6.7% | 1.8%(+4.89)#26 | 2.1%(+4.52)#2,272 |
| 27. | Herington | 6.6% | 1.8%(+4.79)#27 | 2.1%(+4.42)#2,320 |
| 28. | Earlton | 6.5% | 1.8%(+4.75)#28 | 2.1%(+4.37)#2,349 |
| 29. | St George | 6.3% | 1.8%(+4.54)#29 | 2.1%(+4.17)#2,486 |
| 30. | Satanta | 6.1% | 1.8%(+4.32)#30 | 2.1%(+3.95)#2,624 |
| 31. | Mullinville | 6.1% | 1.8%(+4.29)#31 | 2.1%(+3.91)#2,660 |
| 32. | Colony | 6.0% | 1.8%(+4.27)#32 | 2.1%(+3.90)#2,674 |
| 33. | Bennington | 6.0% | 1.8%(+4.23)#33 | 2.1%(+3.86)#2,701 |
| 34. | Beverly | 6.0% | 1.8%(+4.18)#34 | 2.1%(+3.80)#2,752 |
| 35. | Kickapoo Site 7 | 5.9% | 1.8%(+4.11)#35 | 2.1%(+3.73)#2,825 |
| 36. | Elmdale | 5.9% | 1.8%(+4.11)#36 | 2.1%(+3.73)#2,827 |
| 37. | Osawatomie | 5.8% | 1.8%(+4.07)#37 | 2.1%(+3.69)#2,851 |
| 38. | Brewster | 5.8% | 1.8%(+4.01)#38 | 2.1%(+3.64)#2,895 |
| 39. | The Highlands | 5.8% | 1.8%(+3.99)#39 | 2.1%(+3.61)#2,922 |
| 40. | Partridge | 5.7% | 1.8%(+3.97)#40 | 2.1%(+3.60)#2,930 |
| 41. | Bunker Hill | 5.7% | 1.8%(+3.89)#41 | 2.1%(+3.51)#3,004 |
| 42. | Minneola | 5.6% | 1.8%(+3.87)#42 | 2.1%(+3.50)#3,014 |
| 43. | Medicine Lodge | 5.6% | 1.8%(+3.84)#43 | 2.1%(+3.47)#3,044 |
| 44. | Yates Center | 5.5% | 1.8%(+3.73)#44 | 2.1%(+3.35)#3,153 |
| 45. | Bushton | 5.5% | 1.8%(+3.72)#45 | 2.1%(+3.35)#3,166 |
| 46. | Plainville | 5.5% | 1.8%(+3.71)#46 | 2.1%(+3.33)#3,182 |
| 47. | Halstead | 5.4% | 1.8%(+3.67)#47 | 2.1%(+3.30)#3,218 |
| 48. | Burrton | 5.4% | 1.8%(+3.62)#48 | 2.1%(+3.24)#3,265 |
| 49. | Wilson | 5.4% | 1.8%(+3.61)#49 | 2.1%(+3.24)#3,270 |
| 50. | Mound City | 5.3% | 1.8%(+3.50)#50 | 2.1%(+3.13)#3,392 |
| 51. | Andale | 5.1% | 1.8%(+3.33)#51 | 2.1%(+2.96)#3,577 |
| 52. | Horton | 5.1% | 1.8%(+3.31)#52 | 2.1%(+2.94)#3,605 |
| 53. | Lorraine | 5.0% | 1.8%(+3.22)#53 | 2.1%(+2.85)#3,698 |
| 54. | Frontenac | 4.9% | 1.8%(+3.11)#54 | 2.1%(+2.73)#3,831 |
| 55. | Geuda Springs | 4.9% | 1.8%(+3.08)#55 | 2.1%(+2.71)#3,864 |
| 56. | Offerle | 4.8% | 1.8%(+2.99)#56 | 2.1%(+2.61)#3,966 |
| 57. | Atchison | 4.7% | 1.8%(+2.94)#57 | 2.1%(+2.56)#4,020 |
| 58. | Larned | 4.6% | 1.8%(+2.86)#58 | 2.1%(+2.48)#4,133 |
| 59. | Scranton | 4.6% | 1.8%(+2.84)#59 | 2.1%(+2.46)#4,166 |
| 60. | Niotaze | 4.5% | 1.8%(+2.77)#60 | 2.1%(+2.40)#4,255 |
| 61. | Pomona | 4.5% | 1.8%(+2.76)#61 | 2.1%(+2.39)#4,270 |
| 62. | Silver Lake | 4.5% | 1.8%(+2.75)#62 | 2.1%(+2.38)#4,284 |
| 63. | Erie | 4.5% | 1.8%(+2.69)#63 | 2.1%(+2.31)#4,376 |
| 64. | Edwardsville | 4.3% | 1.8%(+2.56)#64 | 2.1%(+2.19)#4,561 |
| 65. | Rose Hill | 4.3% | 1.8%(+2.56)#65 | 2.1%(+2.18)#4,569 |
| 66. | Centralia | 4.3% | 1.8%(+2.53)#66 | 2.1%(+2.15)#4,612 |
| 67. | Belvue | 4.3% | 1.8%(+2.53)#67 | 2.1%(+2.15)#4,613 |
| 68. | Healy | 4.3% | 1.8%(+2.48)#68 | 2.1%(+2.11)#4,672 |
| 69. | Prairie View | 4.3% | 1.8%(+2.48)#69 | 2.1%(+2.11)#4,674 |
| 70. | Dearing | 4.2% | 1.8%(+2.44)#70 | 2.1%(+2.07)#4,731 |
| 71. | Louisburg | 4.1% | 1.8%(+2.33)#71 | 2.1%(+1.95)#4,929 |
| 72. | Albert | 4.1% | 1.8%(+2.31)#72 | 2.1%(+1.93)#4,971 |
| 73. | Miltonvale | 4.1% | 1.8%(+2.28)#73 | 2.1%(+1.91)#5,004 |
| 74. | Arlington | 4.0% | 1.8%(+2.22)#74 | 2.1%(+1.85)#5,093 |
| 75. | Lenora | 4.0% | 1.8%(+2.22)#75 | 2.1%(+1.85)#5,100 |
| 76. | Mclouth | 4.0% | 1.8%(+2.20)#76 | 2.1%(+1.83)#5,147 |
| 77. | Tyro | 3.9% | 1.8%(+2.17)#77 | 2.1%(+1.80)#5,204 |
| 78. | Burlingame | 3.9% | 1.8%(+2.16)#78 | 2.1%(+1.79)#5,217 |
| 79. | Bonner Springs | 3.9% | 1.8%(+2.16)#79 | 2.1%(+1.79)#5,221 |
| 80. | Garnett | 3.9% | 1.8%(+2.15)#80 | 2.1%(+1.77)#5,246 |
| 81. | Mcpherson | 3.9% | 1.8%(+2.13)#81 | 2.1%(+1.75)#5,280 |
| 82. | Prescott | 3.9% | 1.8%(+2.12)#82 | 2.1%(+1.75)#5,290 |
| 83. | Auburn | 3.9% | 1.8%(+2.09)#83 | 2.1%(+1.72)#5,361 |
| 84. | Wellington | 3.9% | 1.8%(+2.08)#84 | 2.1%(+1.71)#5,384 |
| 85. | Gem | 3.8% | 1.8%(+2.07)#85 | 2.1%(+1.70)#5,420 |
| 86. | Kickapoo Site 1 | 3.8% | 1.8%(+2.07)#86 | 2.1%(+1.70)#5,423 |
| 87. | Minneapolis | 3.8% | 1.8%(+2.02)#87 | 2.1%(+1.64)#5,509 |
| 88. | Eureka | 3.8% | 1.8%(+1.98)#88 | 2.1%(+1.61)#5,573 |
| 89. | Great Bend | 3.7% | 1.8%(+1.92)#89 | 2.1%(+1.55)#5,714 |
| 90. | Colwich | 3.7% | 1.8%(+1.91)#90 | 2.1%(+1.54)#5,750 |
| 91. | Ogden | 3.6% | 1.8%(+1.79)#91 | 2.1%(+1.42)#5,990 |
| 92. | Gardner | 3.5% | 1.8%(+1.77)#92 | 2.1%(+1.40)#6,013 |
| 93. | Hamilton | 3.5% | 1.8%(+1.75)#93 | 2.1%(+1.38)#6,057 |
| 94. | Cawker City | 3.5% | 1.8%(+1.72)#94 | 2.1%(+1.35)#6,117 |
| 95. | Admire | 3.5% | 1.8%(+1.70)#95 | 2.1%(+1.33)#6,185 |
| 96. | Holcomb | 3.5% | 1.8%(+1.69)#96 | 2.1%(+1.32)#6,216 |
| 97. | Chase | 3.4% | 1.8%(+1.67)#97 | 2.1%(+1.30)#6,252 |
| 98. | Paradise | 3.4% | 1.8%(+1.67)#98 | 2.1%(+1.30)#6,263 |
| 99. | Rossville | 3.4% | 1.8%(+1.67)#99 | 2.1%(+1.29)#6,271 |
| 100. | Haviland | 3.4% | 1.8%(+1.61)#100 | 2.1%(+1.24)#6,404 |
Common Questions
What are the Top 10 Cities with the Highest Percentage of Population Employed in Security & Protection in Kansas?
Top 10 Cities with the Highest Percentage of Population Employed in Security & Protection in Kansas are:
What city has the Highest Percentage of Population Employed in Security & Protection in Kansas?
Bendena has the Highest Percentage of Population Employed in Security & Protection in Kansas with 26.6%.
What is the Percentage of Population Employed in Security & Protection in the State of Kansas?
Percentage of Population Employed in Security & Protection in Kansas is 1.8%.
What is the Percentage of Population Employed in Security & Protection in the United States?
Percentage of Population Employed in Security & Protection in the United States is 2.1%.