Cities with the Highest Percentage of Population Employed in Security & Protection in West Virginia
RELATED REPORTS & OPTIONS
Security & Protection
West Virginia
Compare Cities
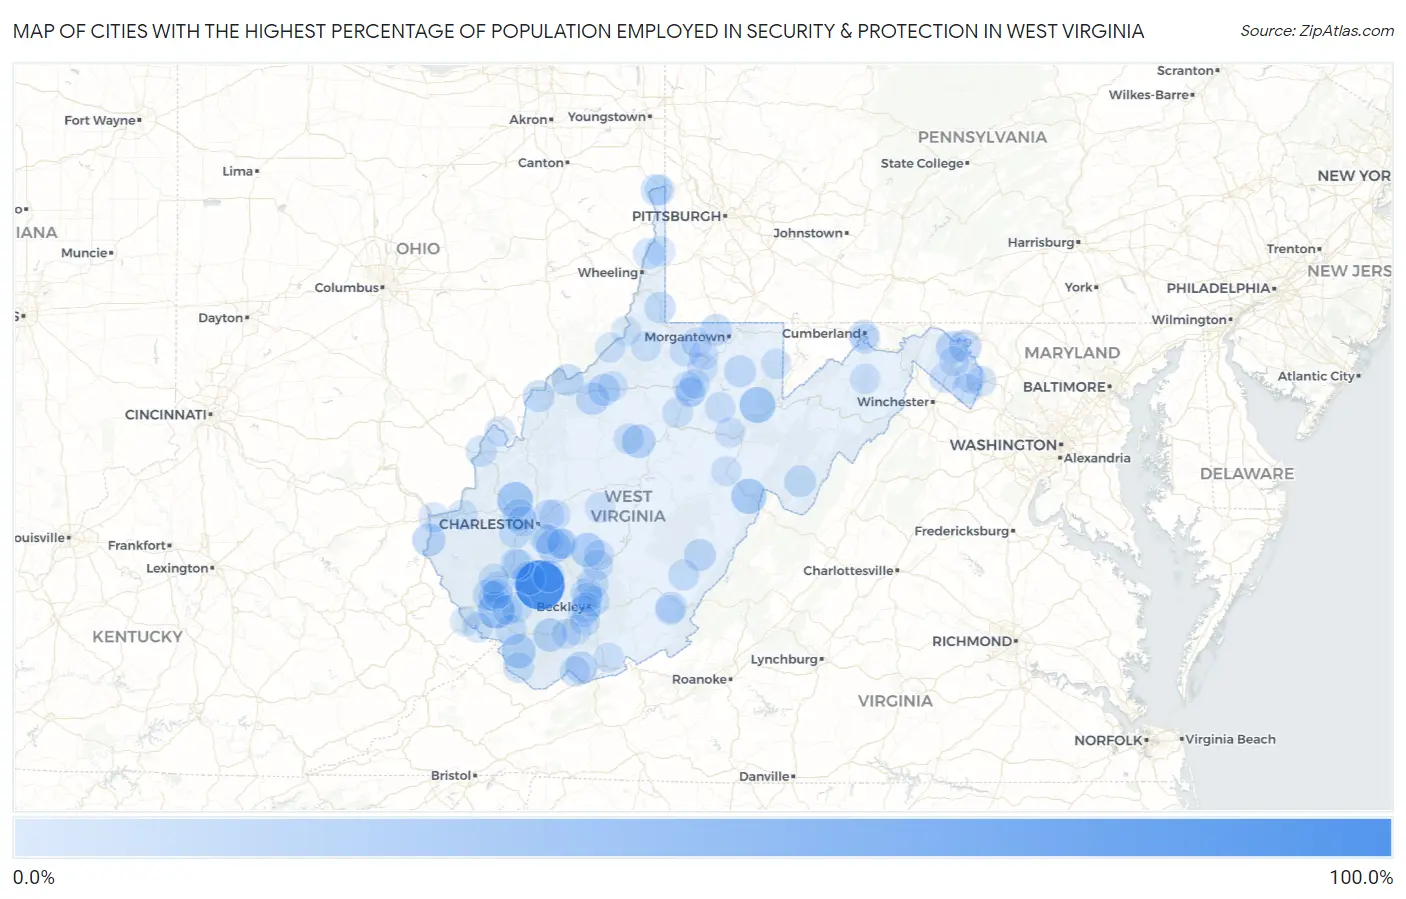
Map of Cities with the Highest Percentage of Population Employed in Security & Protection in West Virginia
0.0%
100.0%
Cities with the Highest Percentage of Population Employed in Security & Protection in West Virginia
| City | % Employed | vs State | vs National | |
| 1. | Twilight | 100.0% | 2.4%(+97.6)#1 | 2.1%(+97.9)#4 |
| 2. | Omar | 36.7% | 2.4%(+34.3)#2 | 2.1%(+34.6)#78 |
| 3. | Bancroft | 31.7% | 2.4%(+29.2)#3 | 2.1%(+29.5)#104 |
| 4. | St George | 31.4% | 2.4%(+28.9)#4 | 2.1%(+29.2)#107 |
| 5. | Bartow | 27.5% | 2.4%(+25.1)#5 | 2.1%(+25.4)#144 |
| 6. | Chelyan | 23.9% | 2.4%(+21.4)#6 | 2.1%(+21.7)#204 |
| 7. | Gauley Bridge | 23.4% | 2.4%(+21.0)#7 | 2.1%(+21.2)#213 |
| 8. | Reynoldsville | 23.0% | 2.4%(+20.5)#8 | 2.1%(+20.8)#220 |
| 9. | Iaeger | 22.9% | 2.4%(+20.4)#9 | 2.1%(+20.7)#223 |
| 10. | Sand Fork | 20.0% | 2.4%(+17.6)#10 | 2.1%(+17.9)#280 |
| 11. | Pineville | 19.6% | 2.4%(+17.2)#11 | 2.1%(+17.5)#287 |
| 12. | Van | 18.1% | 2.4%(+15.6)#12 | 2.1%(+15.9)#332 |
| 13. | Prichard | 17.6% | 2.4%(+15.2)#13 | 2.1%(+15.5)#346 |
| 14. | Hedgesville | 16.4% | 2.4%(+13.9)#14 | 2.1%(+14.2)#414 |
| 15. | Falling Waters | 16.1% | 2.4%(+13.7)#15 | 2.1%(+14.0)#427 |
| 16. | Cairo | 16.0% | 2.4%(+13.6)#16 | 2.1%(+13.9)#436 |
| 17. | Nitro | 13.8% | 2.4%(+11.3)#17 | 2.1%(+11.6)#586 |
| 18. | Ellenboro | 13.6% | 2.4%(+11.2)#18 | 2.1%(+11.5)#600 |
| 19. | Montcalm | 13.6% | 2.4%(+11.2)#19 | 2.1%(+11.5)#603 |
| 20. | Waverly | 13.2% | 2.4%(+10.7)#20 | 2.1%(+11.0)#644 |
| 21. | Hillsboro | 13.0% | 2.4%(+10.6)#21 | 2.1%(+10.9)#657 |
| 22. | Mitchell Heights | 12.6% | 2.4%(+10.1)#22 | 2.1%(+10.4)#702 |
| 23. | Bradley | 12.5% | 2.4%(+10.1)#23 | 2.1%(+10.4)#704 |
| 24. | Verdunville | 12.4% | 2.4%(+9.94)#24 | 2.1%(+10.2)#722 |
| 25. | Newburg | 12.3% | 2.4%(+9.85)#25 | 2.1%(+10.1)#729 |
| 26. | Franklin | 12.0% | 2.4%(+9.60)#26 | 2.1%(+9.88)#753 |
| 27. | Lubeck | 11.9% | 2.4%(+9.46)#27 | 2.1%(+9.74)#777 |
| 28. | Cassville | 11.8% | 2.4%(+9.40)#28 | 2.1%(+9.67)#785 |
| 29. | Hilltop | 11.5% | 2.4%(+9.07)#29 | 2.1%(+9.35)#839 |
| 30. | Whitesville | 11.3% | 2.4%(+8.82)#30 | 2.1%(+9.10)#871 |
| 31. | Crab Orchard | 11.1% | 2.4%(+8.69)#31 | 2.1%(+8.96)#891 |
| 32. | Alum Creek | 10.8% | 2.4%(+8.39)#32 | 2.1%(+8.67)#948 |
| 33. | Cameron | 10.1% | 2.4%(+7.63)#33 | 2.1%(+7.91)#1,088 |
| 34. | Newell | 9.6% | 2.4%(+7.22)#34 | 2.1%(+7.50)#1,167 |
| 35. | Accoville | 9.4% | 2.4%(+7.01)#35 | 2.1%(+7.29)#1,214 |
| 36. | Point Pleasant | 9.2% | 2.4%(+6.79)#36 | 2.1%(+7.07)#1,259 |
| 37. | Madison | 9.1% | 2.4%(+6.67)#37 | 2.1%(+6.95)#1,289 |
| 38. | Fairlea | 9.0% | 2.4%(+6.57)#38 | 2.1%(+6.85)#1,337 |
| 39. | Gilbert | 8.5% | 2.4%(+6.10)#39 | 2.1%(+6.38)#1,480 |
| 40. | Windsor Heights | 8.5% | 2.4%(+6.07)#40 | 2.1%(+6.35)#1,491 |
| 41. | Falling Spring | 8.3% | 2.4%(+5.91)#41 | 2.1%(+6.18)#1,544 |
| 42. | Shenandoah Junction | 8.2% | 2.4%(+5.78)#42 | 2.1%(+6.05)#1,590 |
| 43. | Stanaford | 8.1% | 2.4%(+5.65)#43 | 2.1%(+5.93)#1,630 |
| 44. | Pinch | 7.7% | 2.4%(+5.27)#44 | 2.1%(+5.54)#1,755 |
| 45. | Big Chimney | 7.6% | 2.4%(+5.18)#45 | 2.1%(+5.46)#1,796 |
| 46. | Inwood | 7.4% | 2.4%(+4.96)#46 | 2.1%(+5.23)#1,913 |
| 47. | Mount Gay Shamrock | 7.3% | 2.4%(+4.91)#47 | 2.1%(+5.19)#1,928 |
| 48. | Fayetteville | 7.3% | 2.4%(+4.85)#48 | 2.1%(+5.13)#1,953 |
| 49. | Glenville | 6.9% | 2.4%(+4.52)#49 | 2.1%(+4.80)#2,105 |
| 50. | Bradshaw | 6.8% | 2.4%(+4.42)#50 | 2.1%(+4.70)#2,161 |
| 51. | Philippi | 6.8% | 2.4%(+4.38)#51 | 2.1%(+4.65)#2,181 |
| 52. | Jane Lew | 6.6% | 2.4%(+4.16)#52 | 2.1%(+4.44)#2,314 |
| 53. | Bramwell | 6.5% | 2.4%(+4.10)#53 | 2.1%(+4.37)#2,348 |
| 54. | Mannington | 6.5% | 2.4%(+4.08)#54 | 2.1%(+4.36)#2,355 |
| 55. | Belle | 6.0% | 2.4%(+3.57)#55 | 2.1%(+3.85)#2,711 |
| 56. | Harpers Ferry | 5.9% | 2.4%(+3.50)#56 | 2.1%(+3.78)#2,773 |
| 57. | Mabscott | 5.9% | 2.4%(+3.47)#57 | 2.1%(+3.74)#2,803 |
| 58. | Charles Town | 5.8% | 2.4%(+3.40)#58 | 2.1%(+3.68)#2,861 |
| 59. | White Hall | 5.8% | 2.4%(+3.40)#59 | 2.1%(+3.68)#2,862 |
| 60. | Clay | 5.8% | 2.4%(+3.34)#60 | 2.1%(+3.62)#2,910 |
| 61. | Romney | 5.6% | 2.4%(+3.22)#61 | 2.1%(+3.50)#3,010 |
| 62. | Jefferson | 5.6% | 2.4%(+3.22)#62 | 2.1%(+3.50)#3,011 |
| 63. | Terra Alta | 5.6% | 2.4%(+3.18)#63 | 2.1%(+3.46)#3,051 |
| 64. | Danville | 5.5% | 2.4%(+3.07)#64 | 2.1%(+3.35)#3,164 |
| 65. | Barboursville | 5.4% | 2.4%(+2.99)#65 | 2.1%(+3.27)#3,244 |
| 66. | Fairview | 5.3% | 2.4%(+2.84)#66 | 2.1%(+3.11)#3,413 |
| 67. | Rhodell | 5.3% | 2.4%(+2.84)#67 | 2.1%(+3.11)#3,418 |
| 68. | Ansted | 5.2% | 2.4%(+2.78)#68 | 2.1%(+3.06)#3,469 |
| 69. | East Bank | 5.2% | 2.4%(+2.77)#69 | 2.1%(+3.04)#3,490 |
| 70. | Marmet | 5.1% | 2.4%(+2.70)#70 | 2.1%(+2.98)#3,562 |
| 71. | New Haven | 5.1% | 2.4%(+2.68)#71 | 2.1%(+2.96)#3,583 |
| 72. | Ceredo | 5.1% | 2.4%(+2.66)#72 | 2.1%(+2.94)#3,601 |
| 73. | Pine Grove | 5.1% | 2.4%(+2.64)#73 | 2.1%(+2.91)#3,630 |
| 74. | Matewan | 5.0% | 2.4%(+2.57)#74 | 2.1%(+2.85)#3,691 |
| 75. | Glasgow | 5.0% | 2.4%(+2.55)#75 | 2.1%(+2.83)#3,711 |
| 76. | Chapmanville | 4.9% | 2.4%(+2.51)#76 | 2.1%(+2.79)#3,761 |
| 77. | Man | 4.7% | 2.4%(+2.32)#77 | 2.1%(+2.60)#3,975 |
| 78. | Ridgeley | 4.7% | 2.4%(+2.25)#78 | 2.1%(+2.53)#4,072 |
| 79. | Wiley Ford | 4.7% | 2.4%(+2.24)#79 | 2.1%(+2.52)#4,083 |
| 80. | Junior | 4.7% | 2.4%(+2.23)#80 | 2.1%(+2.50)#4,103 |
| 81. | Anmoore | 4.6% | 2.4%(+2.18)#81 | 2.1%(+2.46)#4,172 |
| 82. | Williamson | 4.6% | 2.4%(+2.17)#82 | 2.1%(+2.45)#4,183 |
| 83. | Ronceverte | 4.4% | 2.4%(+2.01)#83 | 2.1%(+2.29)#4,407 |
| 84. | Prosperity | 4.4% | 2.4%(+2.01)#84 | 2.1%(+2.29)#4,416 |
| 85. | Huttonsville | 4.4% | 2.4%(+1.97)#85 | 2.1%(+2.25)#4,476 |
| 86. | Chester | 4.3% | 2.4%(+1.92)#86 | 2.1%(+2.20)#4,534 |
| 87. | Clarksburg | 4.3% | 2.4%(+1.89)#87 | 2.1%(+2.17)#4,589 |
| 88. | Bethany | 4.2% | 2.4%(+1.79)#88 | 2.1%(+2.06)#4,737 |
| 89. | New Martinsville | 4.2% | 2.4%(+1.76)#89 | 2.1%(+2.03)#4,778 |
| 90. | Dupont | 4.1% | 2.4%(+1.70)#90 | 2.1%(+1.98)#4,878 |
| 91. | Pennsboro | 4.1% | 2.4%(+1.64)#91 | 2.1%(+1.92)#4,985 |
| 92. | Stonewood | 4.0% | 2.4%(+1.60)#92 | 2.1%(+1.88)#5,038 |
| 93. | Barrackville | 4.0% | 2.4%(+1.59)#93 | 2.1%(+1.87)#5,053 |
| 94. | Bridgeport | 4.0% | 2.4%(+1.56)#94 | 2.1%(+1.84)#5,118 |
| 95. | Coal City | 4.0% | 2.4%(+1.56)#95 | 2.1%(+1.84)#5,120 |
| 96. | West Logan | 4.0% | 2.4%(+1.55)#96 | 2.1%(+1.83)#5,149 |
| 97. | Athens | 4.0% | 2.4%(+1.52)#97 | 2.1%(+1.80)#5,199 |
| 98. | Martinsburg | 3.9% | 2.4%(+1.45)#98 | 2.1%(+1.73)#5,347 |
| 99. | Mullens | 3.9% | 2.4%(+1.43)#99 | 2.1%(+1.71)#5,379 |
| 100. | Sistersville | 3.8% | 2.4%(+1.41)#100 | 2.1%(+1.69)#5,439 |
Common Questions
What are the Top 10 Cities with the Highest Percentage of Population Employed in Security & Protection in West Virginia?
Top 10 Cities with the Highest Percentage of Population Employed in Security & Protection in West Virginia are:
What city has the Highest Percentage of Population Employed in Security & Protection in West Virginia?
Twilight has the Highest Percentage of Population Employed in Security & Protection in West Virginia with 100.0%.
What is the Percentage of Population Employed in Security & Protection in the State of West Virginia?
Percentage of Population Employed in Security & Protection in West Virginia is 2.4%.
What is the Percentage of Population Employed in Security & Protection in the United States?
Percentage of Population Employed in Security & Protection in the United States is 2.1%.