Zip Codes with the Highest Percentage of Population Employed in Security & Protection in Trabuco Canyon, CA
RELATED REPORTS & OPTIONS
Security & Protection
Trabuco Canyon
Compare Zip Codes
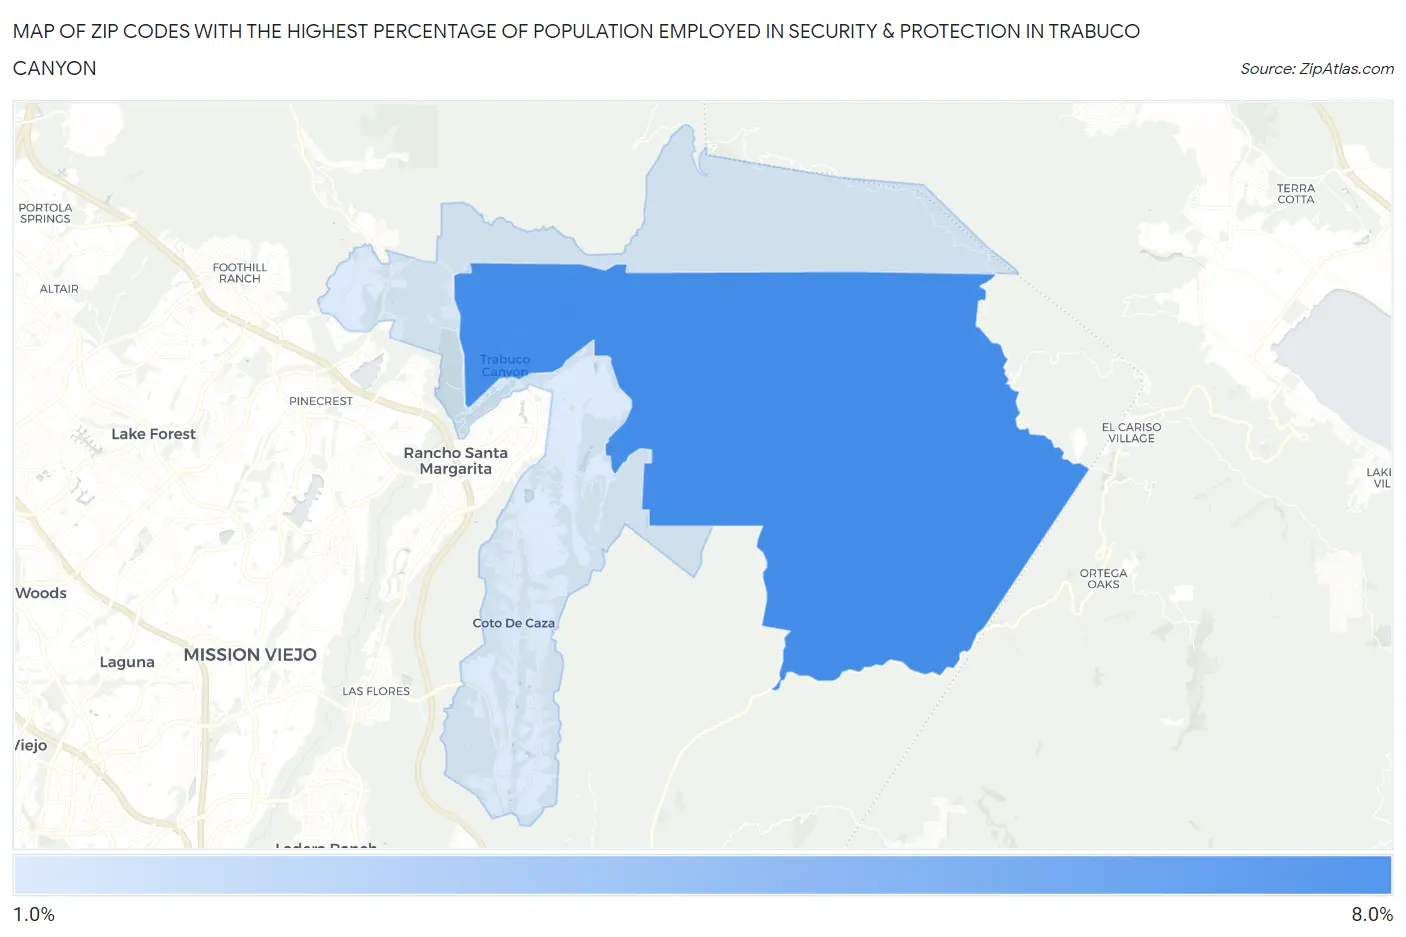
Map of Zip Codes with the Highest Percentage of Population Employed in Security & Protection in Trabuco Canyon
1.9%
6.5%
Zip Codes with the Highest Percentage of Population Employed in Security & Protection in Trabuco Canyon, CA
| Zip Code | % Employed | vs State | vs National | |
| 1. | 92678 | 6.5% | 2.1%(+4.43)#87 | 2.1%(+4.36)#1,781 |
| 2. | 92679 | 1.9% | 2.1%(-0.169)#752 | 2.1%(-0.237)#13,145 |
1
Common Questions
What are the Top Zip Codes with the Highest Percentage of Population Employed in Security & Protection in Trabuco Canyon, CA?
Top Zip Codes with the Highest Percentage of Population Employed in Security & Protection in Trabuco Canyon, CA are:
What zip code has the Highest Percentage of Population Employed in Security & Protection in Trabuco Canyon, CA?
92678 has the Highest Percentage of Population Employed in Security & Protection in Trabuco Canyon, CA with 6.5%.
What is the Percentage of Population Employed in Security & Protection in Trabuco Canyon, CA?
Percentage of Population Employed in Security & Protection in Trabuco Canyon is 3.1%.
What is the Percentage of Population Employed in Security & Protection in California?
Percentage of Population Employed in Security & Protection in California is 2.1%.
What is the Percentage of Population Employed in Security & Protection in the United States?
Percentage of Population Employed in Security & Protection in the United States is 2.1%.