Cities with the Highest Percentage of Population Employed in Security & Protection in Delaware

RELATED REPORTS & OPTIONS

Security & Protection
Population
Families and Households
Female Fertility
Female Fertility (Unmarried)
Race (Community Size)
Race (Percentage)
Ancestry (Community Size)
AfghanAfricanAlaska NativeAlaskan AthabascanAlbanianAleutAlsatianAmericanApacheArabArapahoArgentineanArmenianAssyrian / Chaldean / SyriacAustralianAustrianBahamianBangladeshiBarbadianBasqueBelgianBelizeanBermudanBhutaneseBlackfeetBolivianBrazilianBritishBritish West IndianBulgarianBurmeseCajunCambodianCanadianCape VerdeanCarpatho RusynCelticCentral AmericanCentral American IndianCherokeeCheyenneChickasawChileanChineseChippewaChoctawColombianColvilleComancheCosta RicanCreeCreekCroatianCrowCubanCypriotCzechCzechoslovakianDanishDelawareDominicanDutchDutch West IndianEastern EuropeanEcuadorianEgyptianEnglishEstonianEthiopianEuropeanFijianFilipinoFinnishFrenchFrench American IndianFrench CanadianGermanGerman RussianGhanaianGreekGuamanian / ChamorroGuatemalanGuyaneseHaitianHmongHonduranHopiHoumaHungarianIcelanderIndian (Asian)IndonesianInupiatIranianIraqiIrishIroquoisIsraeliItalianJamaicanJapaneseJordanianKenyanKiowaKoreanLaotianLatvianLebaneseLiberianLithuanianLumbeeLuxembourgerMacedonianMalaysianMalteseMarshalleseMenomineeMexicanMexican American IndianMongolianMoroccanNative HawaiianNavajoNepaleseNew ZealanderNicaraguanNigerianNorthern EuropeanNorwegianOkinawanOsageOttawaPaiutePakistaniPalestinianPanamanianParaguayanPennsylvania GermanPeruvianPimaPolishPortuguesePotawatomiPuebloPuerto RicanPuget Sound SalishRomanianRussianSalvadoranSamoanScandinavianScotch-IrishScottishSeminoleSenegaleseSerbianShoshoneSierra LeoneanSiouxSlavicSlovakSloveneSomaliSouth AfricanSouth AmericanSouth American IndianSoviet UnionSpaniardSpanishSpanish AmericanSpanish American IndianSri LankanSubsaharan AfricanSudaneseSwedishSwissSyrianTaiwaneseThaiTlingit-HaidaTohono O'OdhamTonganTrinidadian and TobagonianTsimshianTurkishU.S. Virgin IslanderUgandanUkrainianUruguayanUteVenezuelanVietnameseWelshWest IndianYakamaYaquiYugoslavianYumanYup'ikZimbabwean
Ancestry (Percentage)
AfghanAfricanAlaska NativeAlaskan AthabascanAlbanianAleutAlsatianAmericanApacheArabArapahoArgentineanArmenianAssyrian / Chaldean / SyriacAustralianAustrianBahamianBangladeshiBarbadianBasqueBelgianBelizeanBermudanBhutaneseBlackfeetBolivianBrazilianBritishBritish West IndianBulgarianBurmeseCajunCambodianCanadianCape VerdeanCarpatho RusynCelticCentral AmericanCentral American IndianCherokeeCheyenneChickasawChileanChineseChippewaChoctawColombianColvilleComancheCosta RicanCreeCreekCroatianCrowCubanCypriotCzechCzechoslovakianDanishDelawareDominicanDutchDutch West IndianEastern EuropeanEcuadorianEgyptianEnglishEstonianEthiopianEuropeanFijianFilipinoFinnishFrenchFrench American IndianFrench CanadianGermanGerman RussianGhanaianGreekGuamanian / ChamorroGuatemalanGuyaneseHaitianHmongHonduranHopiHoumaHungarianIcelanderIndian (Asian)IndonesianInupiatIranianIraqiIrishIroquoisIsraeliItalianJamaicanJapaneseJordanianKenyanKiowaKoreanLaotianLatvianLebaneseLiberianLithuanianLumbeeLuxembourgerMacedonianMalaysianMalteseMarshalleseMenomineeMexicanMexican American IndianMongolianMoroccanNative HawaiianNavajoNepaleseNew ZealanderNicaraguanNigerianNorthern EuropeanNorwegianOkinawanOsageOttawaPaiutePakistaniPalestinianPanamanianParaguayanPennsylvania GermanPeruvianPimaPolishPortuguesePotawatomiPuebloPuerto RicanPuget Sound SalishRomanianRussianSalvadoranSamoanScandinavianScotch-IrishScottishSeminoleSenegaleseSerbianShoshoneSierra LeoneanSiouxSlavicSlovakSloveneSomaliSouth AfricanSouth AmericanSouth American IndianSoviet UnionSpaniardSpanishSpanish AmericanSpanish American IndianSri LankanSubsaharan AfricanSudaneseSwedishSwissSyrianTaiwaneseThaiTlingit-HaidaTohono O'OdhamTonganTrinidadian and TobagonianTsimshianTurkishU.S. Virgin IslanderUgandanUkrainianUruguayanUteVenezuelanVietnameseWelshWest IndianYakamaYaquiYugoslavianYumanYup'ikZimbabwean
Immigrant Origin (Total)
AfghanistanAfricaAlbaniaArgentinaArmeniaAsiaAustraliaAustriaAzoresBahamasBangladeshBarbadosBelarusBelgiumBelizeBoliviaBosnia and HerzegovinaBrazilBulgariaBurma / MyanmarCabo VerdeCambodiaCameroonCanadaCaribbeanCentral AmericaChileChinaColombiaCongoCosta RicaCroatiaCubaCzechoslovakiaDenmarkDominicaDominican RepublicEastern AfricaEastern AsiaEastern EuropeEcuadorEgyptEl SalvadorEnglandEritreaEthiopiaEuropeFijiFranceGermanyGhanaGreeceGrenadaGuatemalaGuyanaHaitiHondurasHong KongHungaryIndiaIndonesiaIranIraqIrelandIsraelItalyJamaicaJapanJordanKazakhstanKenyaKoreaKuwaitLaosLatin AmericaLatviaLebanonLiberiaLithuaniaMalaysiaMexicoMicronesiaMiddle AfricaMoldovaMoroccoNepalNetherlandsNicaraguaNigeriaNorth MacedoniaNorthern AfricaNorthern EuropeNorwayOceaniaPakistanPanamaPeruPhilippinesPolandPortugalRomaniaRussiaSaudi ArabiaScotlandSenegalSerbiaSierra LeoneSingaporeSomaliaSouth AfricaSouth AmericaSouth Central AsiaSouth Eastern AsiaSouthern EuropeSpainSri LankaSt. Vincent and the GrenadinesSudanSwedenSwitzerlandSyriaTaiwanThailandTrinidad and TobagoTurkeyUgandaUkraineUruguayUzbekistanVenezuelaVietnamWest IndiesWestern AfricaWestern AsiaWestern EuropeYemenZaireZimbabwe
Immigrant Origin (Percentage)
AfghanistanAfricaAlbaniaArgentinaArmeniaAsiaAustraliaAustriaAzoresBahamasBangladeshBarbadosBelarusBelgiumBelizeBoliviaBosnia and HerzegovinaBrazilBulgariaBurma / MyanmarCabo VerdeCambodiaCameroonCanadaCaribbeanCentral AmericaChileChinaColombiaCongoCosta RicaCroatiaCubaCzechoslovakiaDenmarkDominicaDominican RepublicEastern AfricaEastern AsiaEastern EuropeEcuadorEgyptEl SalvadorEnglandEritreaEthiopiaEuropeFijiFranceGermanyGhanaGreeceGrenadaGuatemalaGuyanaHaitiHondurasHong KongHungaryIndiaIndonesiaIranIraqIrelandIsraelItalyJamaicaJapanJordanKazakhstanKenyaKoreaKuwaitLaosLatin AmericaLatviaLebanonLiberiaLithuaniaMalaysiaMexicoMicronesiaMiddle AfricaMoldovaMoroccoNepalNetherlandsNicaraguaNigeriaNorth MacedoniaNorthern AfricaNorthern EuropeNorwayOceaniaPakistanPanamaPeruPhilippinesPolandPortugalRomaniaRussiaSaudi ArabiaScotlandSenegalSerbiaSierra LeoneSingaporeSomaliaSouth AfricaSouth AmericaSouth Central AsiaSouth Eastern AsiaSouthern EuropeSpainSri LankaSt. Vincent and the GrenadinesSudanSwedenSwitzerlandSyriaTaiwanThailandTrinidad and TobagoTurkeyUgandaUkraineUruguayUzbekistanVenezuelaVietnamWest IndiesWestern AfricaWestern AsiaWestern EuropeYemenZaireZimbabwe
Income
Income (Families)
Income (Households)
Poverty
Poverty (Families)
Unemployment
Employment Occupations
Employment Industries
Employer Class
Commute Time
Commute Means
School Enrollment
Education by Degree Field
Occupancy
Finances
Physical Characteristics
Delaware
Compare Cities
Comparison Subject

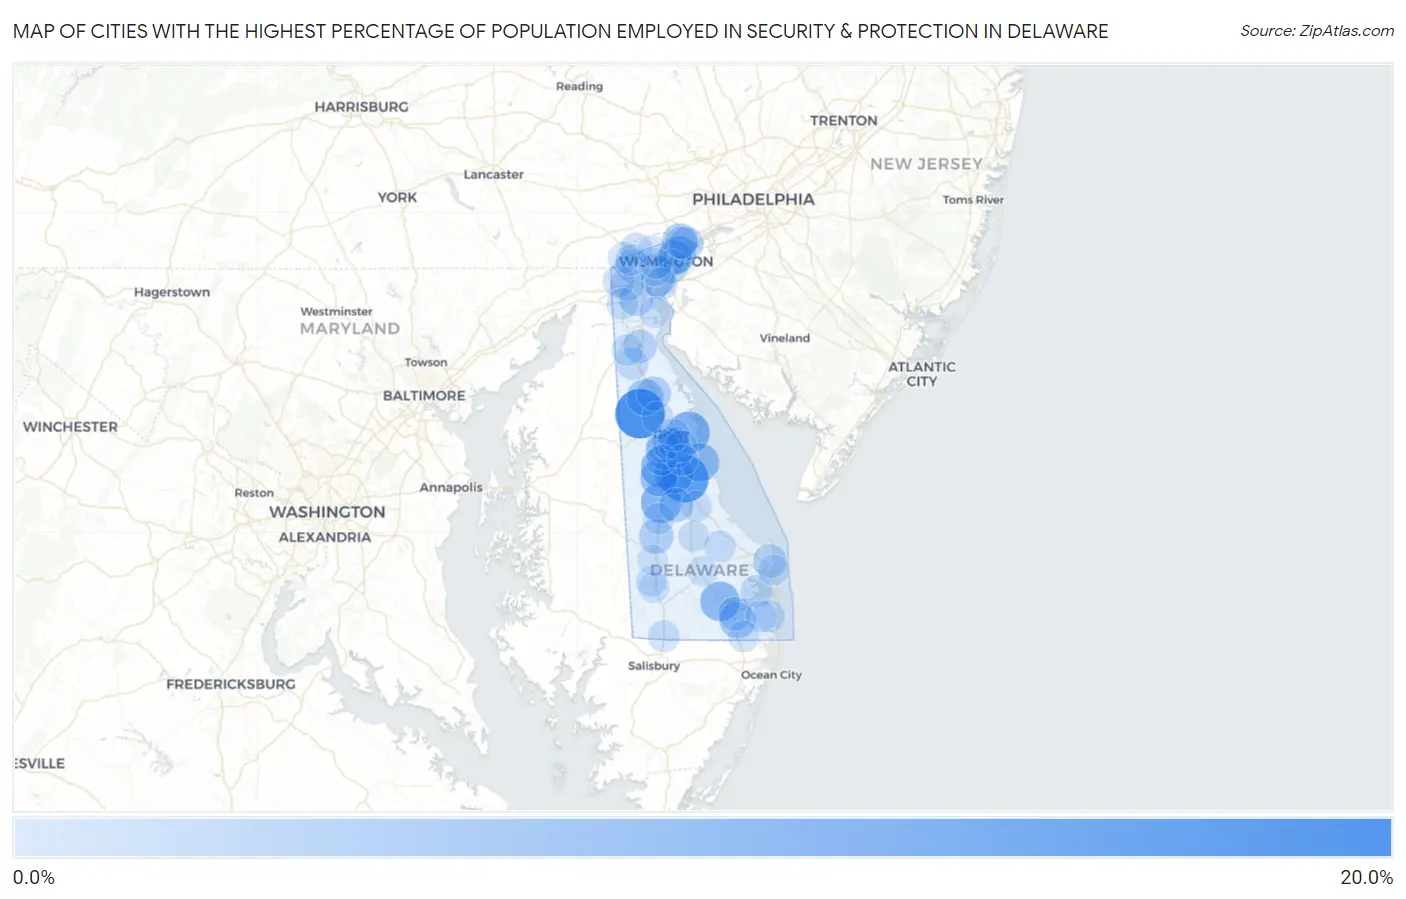
Map of Cities with the Highest Percentage of Population Employed in Security & Protection in Delaware

0.0%
20.0%
Cities with the Highest Percentage of Population Employed in Security & Protection in Delaware Map

Cities with the Highest Percentage of Population Employed in Security & Protection in Delaware

City % Employed vs State vs National
1.Kenton18.1%2.6%(+15.5)#12.1%(+15.9)#329
2.Frederica15.9%2.6%(+13.3)#22.1%(+13.8)#439
3.Little Creek11.0%2.6%(+8.43)#32.1%(+8.88)#920
4.Harrington9.8%2.6%(+7.22)#42.1%(+7.67)#1,133
5.Viola9.8%2.6%(+7.16)#52.1%(+7.61)#1,149
6.Riverview8.7%2.6%(+6.07)#62.1%(+6.52)#1,442
7.Millsboro8.6%2.6%(+6.04)#72.1%(+6.49)#1,448
8.Bowers7.8%2.6%(+5.25)#82.1%(+5.69)#1,709
9.Felton6.7%2.6%(+4.14)#92.1%(+4.59)#2,219
10.Clayton6.1%2.6%(+3.49)#102.1%(+3.94)#2,633
11.Bellefonte6.1%2.6%(+3.46)#112.1%(+3.91)#2,653
12.Camden5.9%2.6%(+3.31)#122.1%(+3.76)#2,787
13.Frankford5.7%2.6%(+3.11)#132.1%(+3.56)#2,962
14.Highland Acres5.1%2.6%(+2.49)#142.1%(+2.94)#3,603
15.Arden5.0%2.6%(+2.42)#152.1%(+2.87)#3,668
16.Greenwood4.2%2.6%(+1.62)#162.1%(+2.07)#4,728
17.Edgemoor4.2%2.6%(+1.56)#172.1%(+2.01)#4,821
18.Smyrna3.9%2.6%(+1.29)#182.1%(+1.74)#5,315
19.Claymont3.6%2.6%(+1.05)#192.1%(+1.50)#5,833
20.Houston3.6%2.6%(+0.974)#202.1%(+1.42)#5,971
21.Bear3.6%2.6%(+0.967)#212.1%(+1.42)#5,991
22.Rehoboth Beach3.4%2.6%(+0.851)#222.1%(+1.30)#6,245
23.Wilmington Manor3.4%2.6%(+0.756)#232.1%(+1.21)#6,491
24.Dagsboro3.3%2.6%(+0.736)#242.1%(+1.18)#6,542
25.Wilmington3.3%2.6%(+0.661)#252.1%(+1.11)#6,723
26.Rising Sun Lebanon3.1%2.6%(+0.551)#262.1%(+1.000)#7,022
27.Odessa3.0%2.6%(+0.415)#272.1%(+0.864)#7,454
28.Pike Creek Valley2.8%2.6%(+0.249)#282.1%(+0.698)#7,995
29.Brookside2.8%2.6%(+0.242)#292.1%(+0.691)#8,022
30.Wyoming2.3%2.6%(-0.315)#302.1%(+0.134)#10,073
31.Rodney Village2.2%2.6%(-0.404)#312.1%(+0.045)#10,470
32.Kent Acres2.1%2.6%(-0.477)#322.1%(-0.028)#10,798
33.New Castle2.1%2.6%(-0.546)#332.1%(-0.097)#11,143
34.Newport2.0%2.6%(-0.564)#342.1%(-0.115)#11,226
35.Ardentown2.0%2.6%(-0.598)#352.1%(-0.148)#11,381
36.Long Neck2.0%2.6%(-0.634)#362.1%(-0.185)#11,560
37.Townsend2.0%2.6%(-0.643)#372.1%(-0.194)#11,619
38.Dover Base Housing1.9%2.6%(-0.648)#382.1%(-0.199)#11,649
39.Dover1.9%2.6%(-0.677)#392.1%(-0.228)#11,791
40.Ocean View1.8%2.6%(-0.837)#402.1%(-0.388)#12,570
41.Newark1.7%2.6%(-0.867)#412.1%(-0.418)#12,720
42.Hockessin1.7%2.6%(-0.913)#422.1%(-0.464)#12,956
43.Cheswold1.7%2.6%(-0.938)#432.1%(-0.489)#13,094
44.Middletown1.6%2.6%(-1.03)#442.1%(-0.584)#13,603
45.Delmar1.5%2.6%(-1.08)#452.1%(-0.633)#13,842
46.Millville1.5%2.6%(-1.09)#462.1%(-0.645)#13,920
47.Glasgow1.4%2.6%(-1.20)#472.1%(-0.752)#14,513
48.North Star1.4%2.6%(-1.24)#482.1%(-0.788)#14,711
49.Selbyville1.3%2.6%(-1.32)#492.1%(-0.869)#15,163
50.Pike Creek1.3%2.6%(-1.34)#502.1%(-0.889)#15,275
51.Milford1.2%2.6%(-1.40)#512.1%(-0.955)#15,647
52.Milton1.2%2.6%(-1.41)#522.1%(-0.962)#15,683
53.Magnolia1.1%2.6%(-1.45)#532.1%(-0.999)#15,871
54.Farmington1.1%2.6%(-1.46)#542.1%(-1.01)#15,935
55.Ellendale1.1%2.6%(-1.53)#552.1%(-1.08)#16,355
56.Elsmere0.91%2.6%(-1.69)#562.1%(-1.24)#17,148
57.Woodside0.89%2.6%(-1.70)#572.1%(-1.26)#17,240
58.Blades0.88%2.6%(-1.72)#582.1%(-1.27)#17,308
59.Greenville0.88%2.6%(-1.72)#592.1%(-1.27)#17,317
60.Delaware City0.78%2.6%(-1.82)#602.1%(-1.37)#17,813
61.Seaford0.70%2.6%(-1.90)#612.1%(-1.45)#18,225
62.Dewey Beach0.58%2.6%(-2.02)#622.1%(-1.57)#18,759
63.Bridgeville0.37%2.6%(-2.23)#632.1%(-1.78)#19,543
64.Georgetown0.35%2.6%(-2.24)#642.1%(-1.79)#19,599

Common Questions

What are the Top 10 Cities with the Highest Percentage of Population Employed in Security & Protection in Delaware?
Top 10 Cities with the Highest Percentage of Population Employed in Security & Protection in Delaware are:
#1
18.1%
#2
15.9%
#3
11.0%
#4
9.8%
#5
9.8%
#6
8.7%
#7
8.6%
#8
7.8%
#9
6.7%
#10
6.1%
What city has the Highest Percentage of Population Employed in Security & Protection in Delaware?
Kenton has the Highest Percentage of Population Employed in Security & Protection in Delaware with 18.1%.
What is the Percentage of Population Employed in Security & Protection in the State of Delaware?
Percentage of Population Employed in Security & Protection in Delaware is 2.6%.
What is the Percentage of Population Employed in Security & Protection in the United States?
Percentage of Population Employed in Security & Protection in the United States is 2.1%.