Paradise Park, CA Map & Demographics
Paradise Park Map
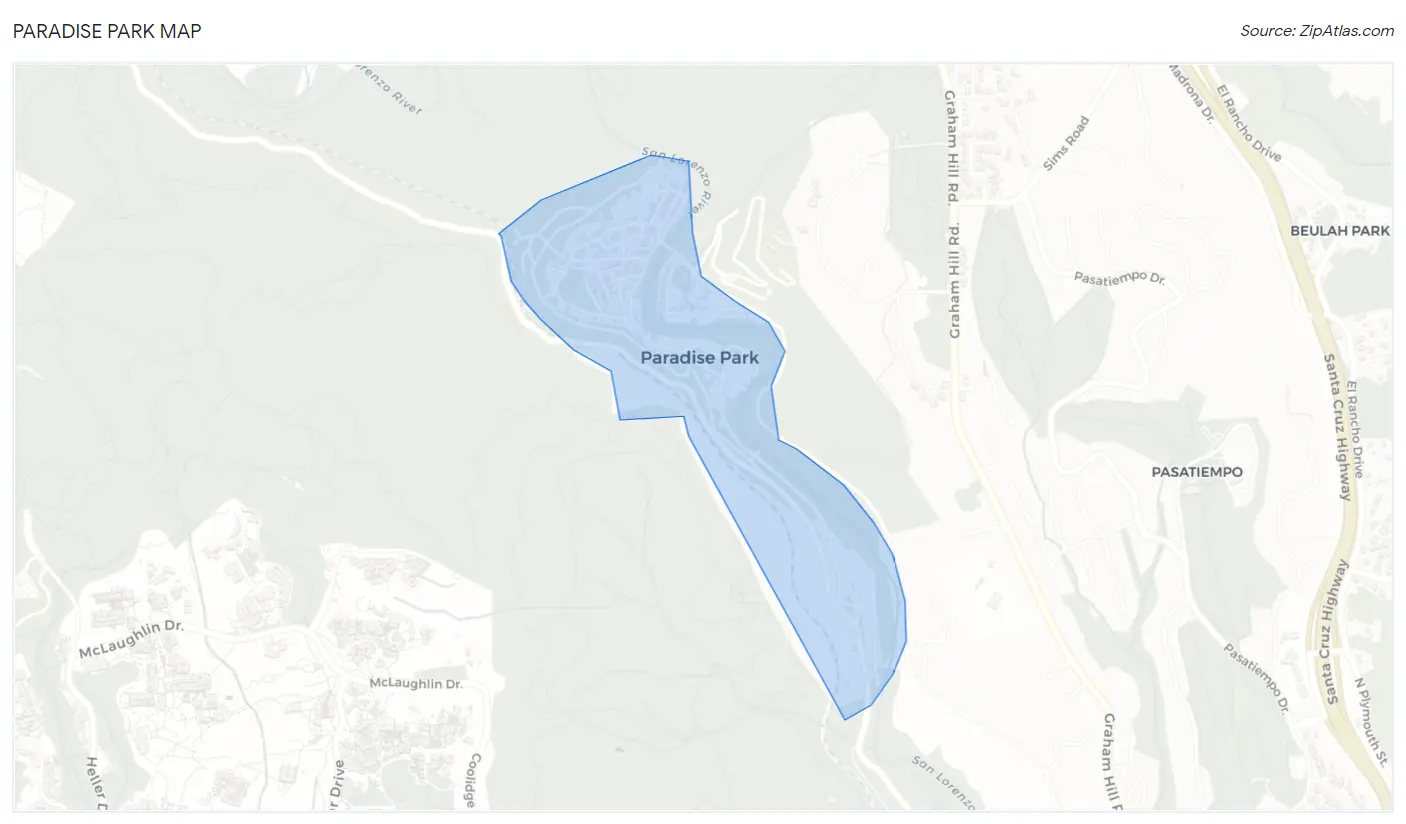
Paradise Park Overview
$38,802
PER CAPITA INCOME
$94,750
AVG HOUSEHOLD INCOME
0.34
INEQUALITY / GINI INDEX
538
TOTAL POPULATION
300
MALE POPULATION
238
FEMALE POPULATION
126.05
MALES / 100 FEMALES
79.33
FEMALES / 100 MALES
46.5
MEDIAN AGE
3.5
AVG FAMILY SIZE
2.4
AVG HOUSEHOLD SIZE
200
LABOR FORCE [ PEOPLE ]
45.6%
PERCENT IN LABOR FORCE
9.0%
UNEMPLOYMENT RATE
Income in Paradise Park
Income Overview in Paradise Park
| Characteristic | Number | Measure |
| Per Capita Income | 538 | $38,802 |
| Median Family Income | 128 | $0 |
| Mean Family Income | 128 | $127,854 |
| Median Household Income | 224 | $94,750 |
| Mean Household Income | 224 | $96,733 |
| Income Deficit | 128 | $0 |
| Wage / Income Gap (%) | 538 | 0.00% |
| Wage / Income Gap ($) | 538 | 100.00¢ per $1 |
| Gini / Inequality Index | 538 | 0.34 |
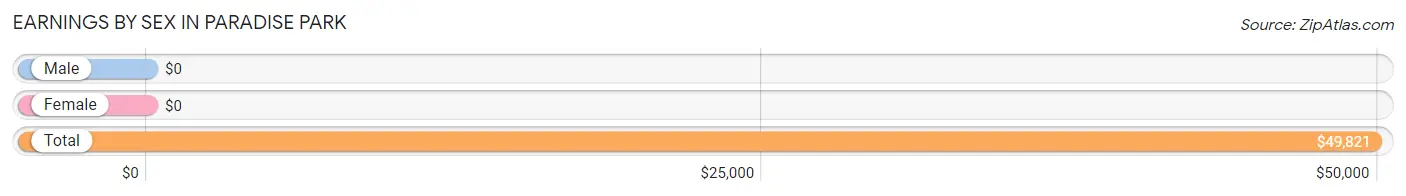
Earnings by Sex in Paradise Park
| Sex | Number | Average Earnings |
| Male | 117 (60.9%) | $0 |
| Female | 75 (39.1%) | $0 |
| Total | 192 (100.0%) | $49,821 |
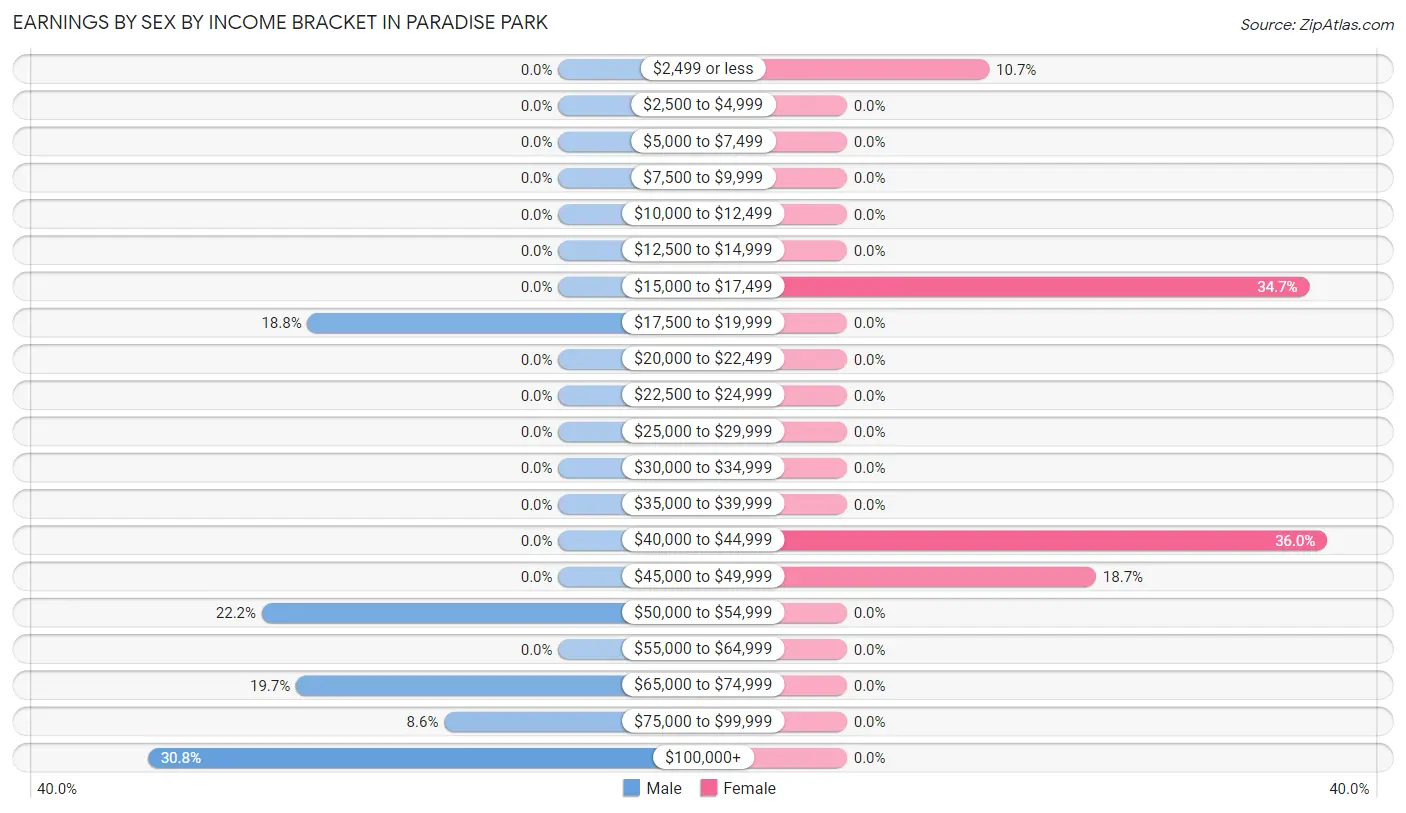
Earnings by Sex by Income Bracket in Paradise Park
The most common earnings brackets in Paradise Park are $100,000+ for men (36 | 30.8%) and $40,000 to $44,999 for women (27 | 36.0%).
| Income | Male | Female |
| $2,499 or less | 0 (0.0%) | 8 (10.7%) |
| $2,500 to $4,999 | 0 (0.0%) | 0 (0.0%) |
| $5,000 to $7,499 | 0 (0.0%) | 0 (0.0%) |
| $7,500 to $9,999 | 0 (0.0%) | 0 (0.0%) |
| $10,000 to $12,499 | 0 (0.0%) | 0 (0.0%) |
| $12,500 to $14,999 | 0 (0.0%) | 0 (0.0%) |
| $15,000 to $17,499 | 0 (0.0%) | 26 (34.7%) |
| $17,500 to $19,999 | 22 (18.8%) | 0 (0.0%) |
| $20,000 to $22,499 | 0 (0.0%) | 0 (0.0%) |
| $22,500 to $24,999 | 0 (0.0%) | 0 (0.0%) |
| $25,000 to $29,999 | 0 (0.0%) | 0 (0.0%) |
| $30,000 to $34,999 | 0 (0.0%) | 0 (0.0%) |
| $35,000 to $39,999 | 0 (0.0%) | 0 (0.0%) |
| $40,000 to $44,999 | 0 (0.0%) | 27 (36.0%) |
| $45,000 to $49,999 | 0 (0.0%) | 14 (18.7%) |
| $50,000 to $54,999 | 26 (22.2%) | 0 (0.0%) |
| $55,000 to $64,999 | 0 (0.0%) | 0 (0.0%) |
| $65,000 to $74,999 | 23 (19.7%) | 0 (0.0%) |
| $75,000 to $99,999 | 10 (8.6%) | 0 (0.0%) |
| $100,000+ | 36 (30.8%) | 0 (0.0%) |
| Total | 117 (100.0%) | 75 (100.0%) |
Earnings by Sex by Educational Attainment in Paradise Park
| Educational Attainment | Male Income | Female Income |
| Less than High School | - | - |
| High School Diploma | - | - |
| College or Associate's Degree | - | - |
| Bachelor's Degree | - | - |
| Graduate Degree | - | - |
| Total | - | - |
Family Income in Paradise Park
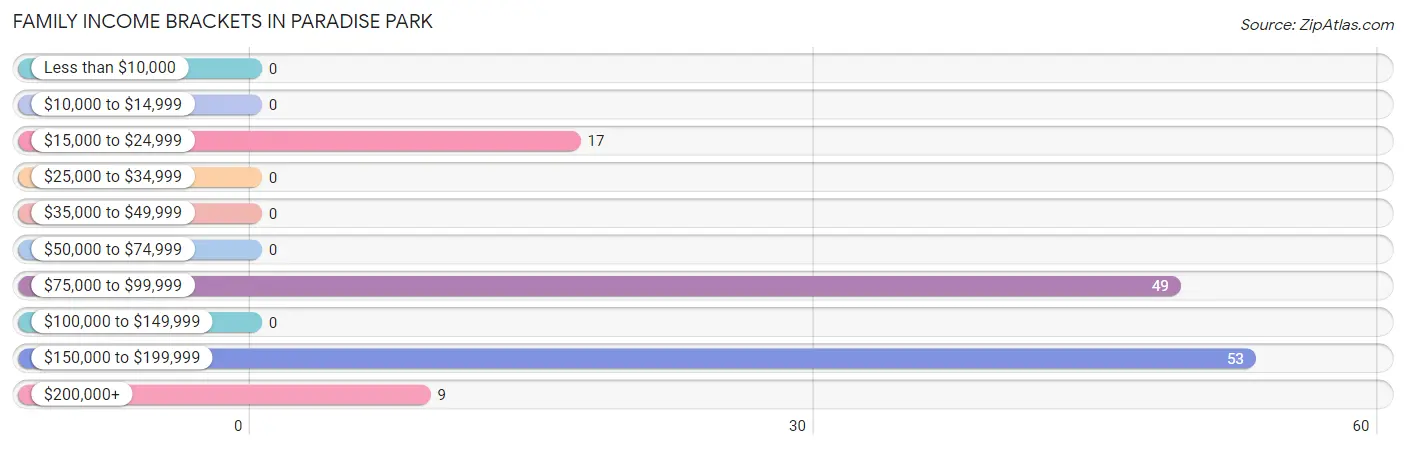
Family Income Brackets in Paradise Park
According to the Paradise Park family income data, there are 53 families falling into the $150,000 to $199,999 income range, which is the most common income bracket and makes up 41.4% of all families.
| Income Bracket | # Families | % Families |
| Less than $10,000 | 0 | 0.0% |
| $10,000 to $14,999 | 0 | 0.0% |
| $15,000 to $24,999 | 17 | 13.3% |
| $25,000 to $34,999 | 0 | 0.0% |
| $35,000 to $49,999 | 0 | 0.0% |
| $50,000 to $74,999 | 0 | 0.0% |
| $75,000 to $99,999 | 49 | 38.3% |
| $100,000 to $149,999 | 0 | 0.0% |
| $150,000 to $199,999 | 53 | 41.4% |
| $200,000+ | 9 | 7.0% |
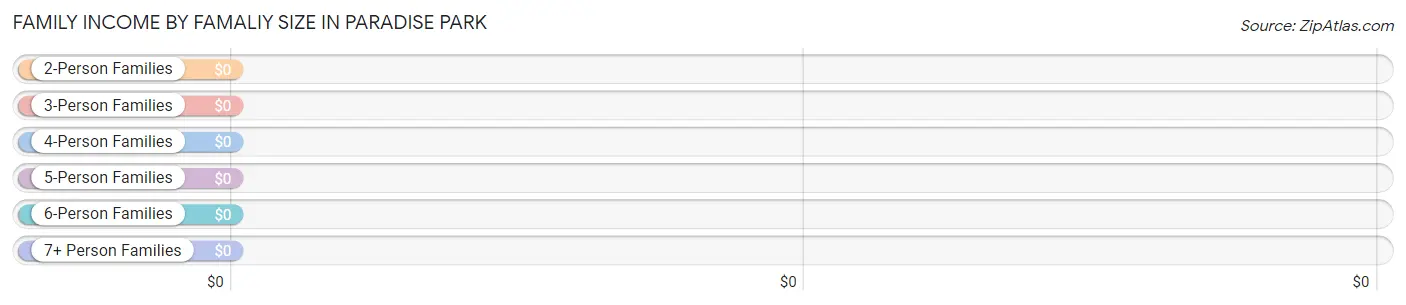
Family Income by Famaliy Size in Paradise Park
| Income Bracket | # Families | Median Income |
| 2-Person Families | 34 (26.6%) | $0 |
| 3-Person Families | 41 (32.0%) | $0 |
| 4-Person Families | 27 (21.1%) | $0 |
| 5-Person Families | 0 (0.0%) | $0 |
| 6-Person Families | 26 (20.3%) | $0 |
| 7+ Person Families | 0 (0.0%) | $0 |
| Total | 128 (100.0%) | $0 |
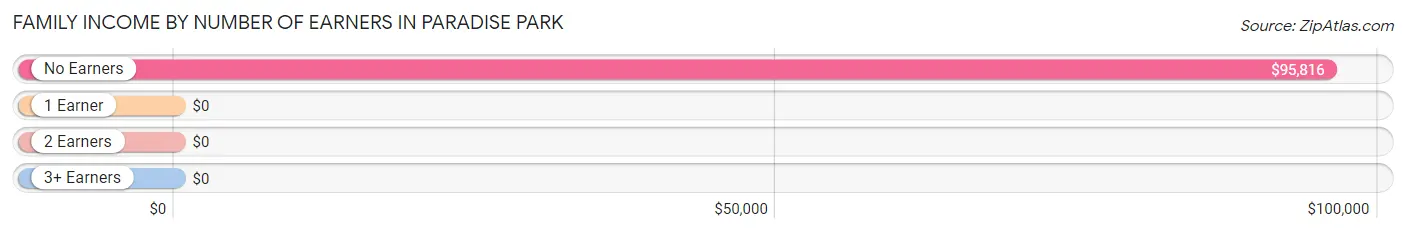
Family Income by Number of Earners in Paradise Park
| Number of Earners | # Families | Median Income |
| No Earners | 66 (51.6%) | $95,816 |
| 1 Earner | 0 (0.0%) | $0 |
| 2 Earners | 36 (28.1%) | $0 |
| 3+ Earners | 26 (20.3%) | $0 |
| Total | 128 (100.0%) | $0 |
Household Income in Paradise Park
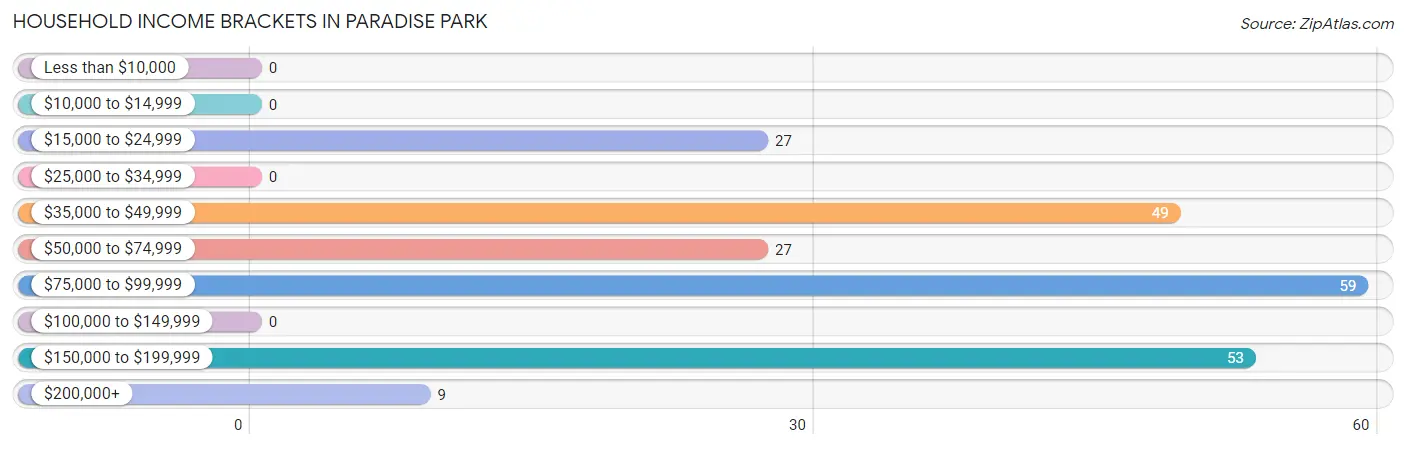
Household Income Brackets in Paradise Park
With 59 households falling in the category, the $75,000 to $99,999 income range is the most frequent in Paradise Park, accounting for 26.3% of all households.
| Income Bracket | # Households | % Households |
| Less than $10,000 | 0 | 0.0% |
| $10,000 to $14,999 | 0 | 0.0% |
| $15,000 to $24,999 | 27 | 12.1% |
| $25,000 to $34,999 | 0 | 0.0% |
| $35,000 to $49,999 | 49 | 21.9% |
| $50,000 to $74,999 | 27 | 12.1% |
| $75,000 to $99,999 | 59 | 26.3% |
| $100,000 to $149,999 | 0 | 0.0% |
| $150,000 to $199,999 | 53 | 23.7% |
| $200,000+ | 9 | 4.0% |
Household Income by Householder Age in Paradise Park
The median household income in Paradise Park is $94,750, with the highest median household income of $73,565 found in the 65+ years age bracket for the primary householder. A total of 147 households (65.6%) fall into this category.
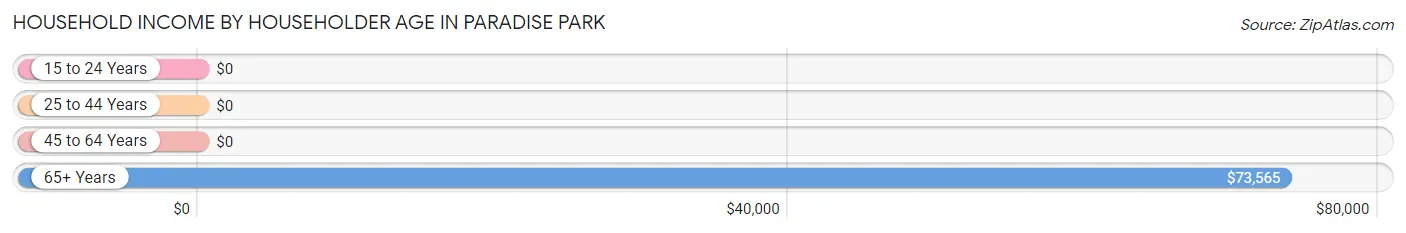
| Income Bracket | # Households | Median Income |
| 15 to 24 Years | 0 (0.0%) | $0 |
| 25 to 44 Years | 41 (18.3%) | $0 |
| 45 to 64 Years | 36 (16.1%) | $0 |
| 65+ Years | 147 (65.6%) | $73,565 |
| Total | 224 (100.0%) | $94,750 |
Poverty in Paradise Park
Income Below Poverty by Sex and Age in Paradise Park
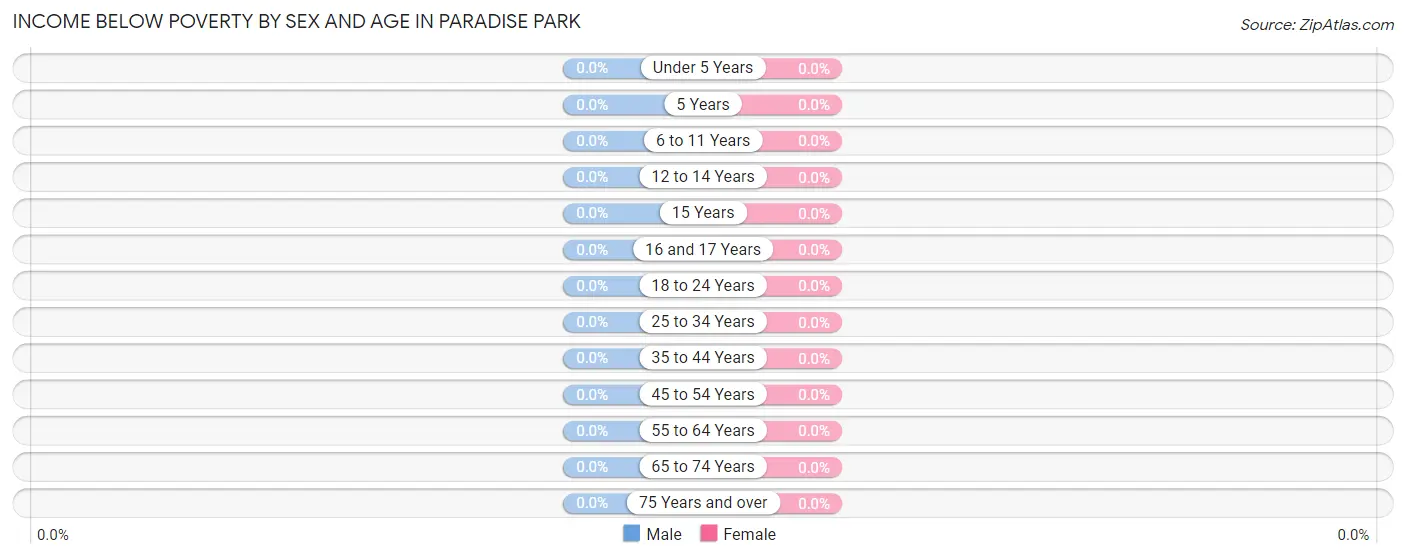
| Age Bracket | Male | Female |
| Under 5 Years | 0 (0.0%) | 0 (0.0%) |
| 5 Years | 0 (0.0%) | 0 (0.0%) |
| 6 to 11 Years | 0 (0.0%) | 0 (0.0%) |
| 12 to 14 Years | 0 (0.0%) | 0 (0.0%) |
| 15 Years | 0 (0.0%) | 0 (0.0%) |
| 16 and 17 Years | 0 (0.0%) | 0 (0.0%) |
| 18 to 24 Years | 0 (0.0%) | 0 (0.0%) |
| 25 to 34 Years | 0 (0.0%) | 0 (0.0%) |
| 35 to 44 Years | 0 (0.0%) | 0 (0.0%) |
| 45 to 54 Years | 0 (0.0%) | 0 (0.0%) |
| 55 to 64 Years | 0 (0.0%) | 0 (0.0%) |
| 65 to 74 Years | 0 (0.0%) | 0 (0.0%) |
| 75 Years and over | 0 (0.0%) | 0 (0.0%) |
| Total | 0 (0.0%) | 0 (0.0%) |
Income Above Poverty by Sex and Age in Paradise Park
According to the poverty statistics in Paradise Park, males aged under 5 years and females aged 6 to 11 years are the age groups that are most secure financially, with 100.0% of males and 100.0% of females in these age groups living above the poverty line.
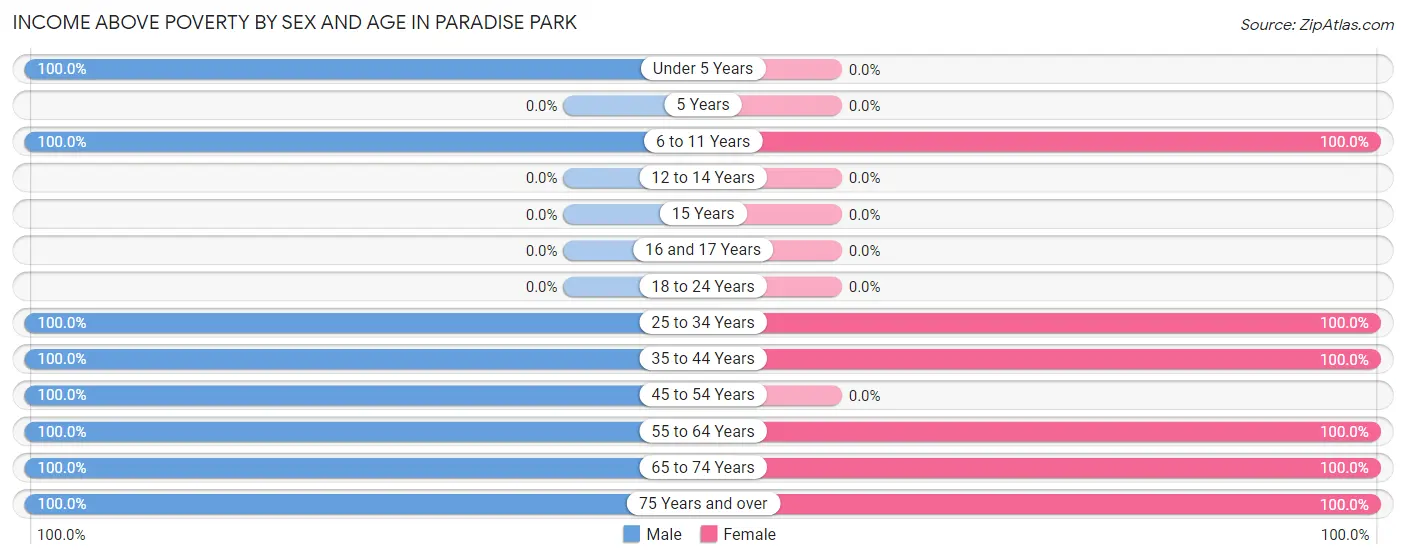
| Age Bracket | Male | Female |
| Under 5 Years | 62 (100.0%) | 0 (0.0%) |
| 5 Years | 0 (0.0%) | 0 (0.0%) |
| 6 to 11 Years | 27 (100.0%) | 10 (100.0%) |
| 12 to 14 Years | 0 (0.0%) | 0 (0.0%) |
| 15 Years | 0 (0.0%) | 0 (0.0%) |
| 16 and 17 Years | 0 (0.0%) | 0 (0.0%) |
| 18 to 24 Years | 0 (0.0%) | 0 (0.0%) |
| 25 to 34 Years | 45 (100.0%) | 41 (100.0%) |
| 35 to 44 Years | 63 (100.0%) | 21 (100.0%) |
| 45 to 54 Years | 10 (100.0%) | 0 (0.0%) |
| 55 to 64 Years | 26 (100.0%) | 26 (100.0%) |
| 65 to 74 Years | 59 (100.0%) | 95 (100.0%) |
| 75 Years and over | 8 (100.0%) | 45 (100.0%) |
| Total | 300 (100.0%) | 238 (100.0%) |
Income Below Poverty Among Married-Couple Families in Paradise Park
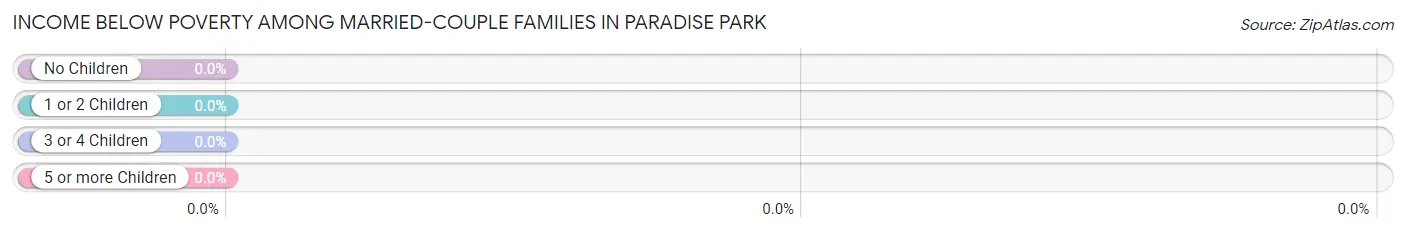
| Children | Above Poverty | Below Poverty |
| No Children | 67 (100.0%) | 0 (0.0%) |
| 1 or 2 Children | 53 (100.0%) | 0 (0.0%) |
| 3 or 4 Children | 0 (0.0%) | 0 (0.0%) |
| 5 or more Children | 0 (0.0%) | 0 (0.0%) |
| Total | 120 (100.0%) | 0 (0.0%) |
Income Below Poverty Among Single-Parent Households in Paradise Park
| Children | Single Father | Single Mother |
| No Children | 0 (0.0%) | 0 (0.0%) |
| 1 or 2 Children | 0 (0.0%) | 0 (0.0%) |
| 3 or 4 Children | 0 (0.0%) | 0 (0.0%) |
| 5 or more Children | 0 (0.0%) | 0 (0.0%) |
| Total | 0 (0.0%) | 0 (0.0%) |
Income Below Poverty Among Married-Couple vs Single-Parent Households in Paradise Park
| Children | Married-Couple Families | Single-Parent Households |
| No Children | 0 (0.0%) | 0 (0.0%) |
| 1 or 2 Children | 0 (0.0%) | 0 (0.0%) |
| 3 or 4 Children | 0 (0.0%) | 0 (0.0%) |
| 5 or more Children | 0 (0.0%) | 0 (0.0%) |
| Total | 0 (0.0%) | 0 (0.0%) |
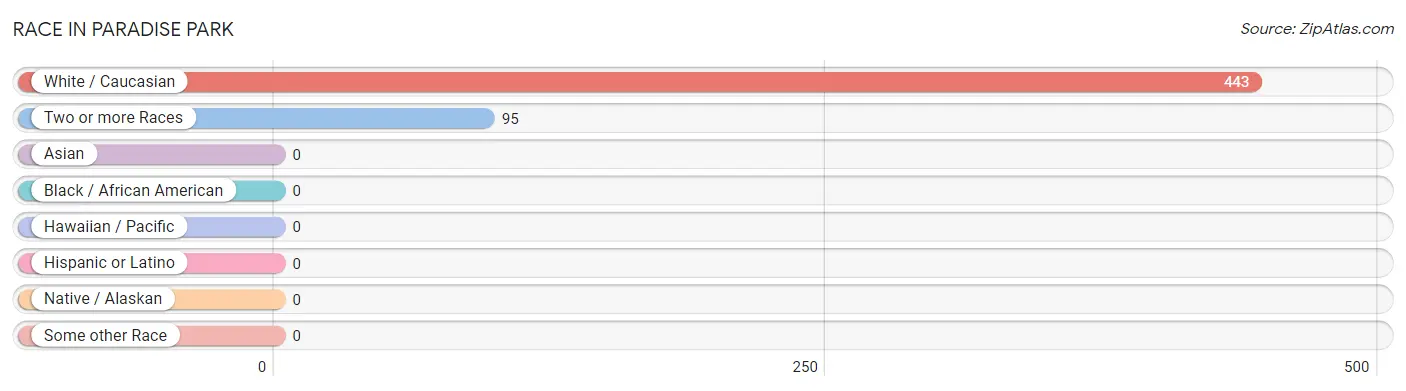
Race in Paradise Park
The most populous races in Paradise Park are White / Caucasian (443 | 82.3%), and Two or more Races (95 | 17.7%).
| Race | # Population | % Population |
| Asian | 0 | 0.0% |
| Black / African American | 0 | 0.0% |
| Hawaiian / Pacific | 0 | 0.0% |
| Hispanic or Latino | 0 | 0.0% |
| Native / Alaskan | 0 | 0.0% |
| White / Caucasian | 443 | 82.3% |
| Two or more Races | 95 | 17.7% |
| Some other Race | 0 | 0.0% |
| Total | 538 | 100.0% |
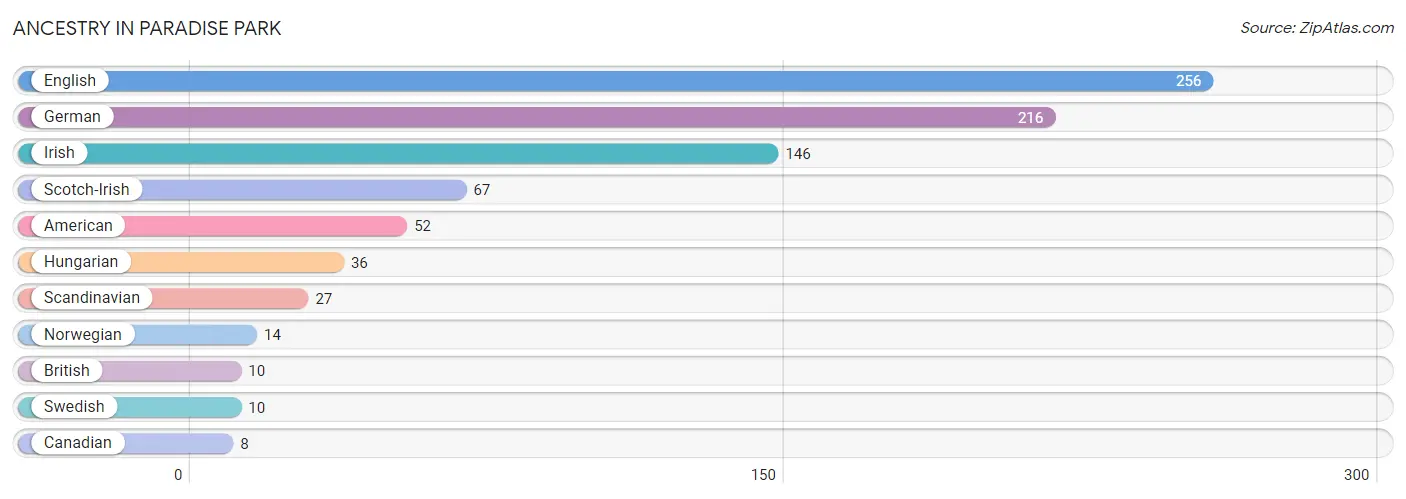
Ancestry in Paradise Park
The most populous ancestries reported in Paradise Park are English (256 | 47.6%), German (216 | 40.2%), Irish (146 | 27.1%), Scotch-Irish (67 | 12.4%), and American (52 | 9.7%), together accounting for 137.0% of all Paradise Park residents.
| Ancestry | # Population | % Population |
| American | 52 | 9.7% |
| British | 10 | 1.9% |
| Canadian | 8 | 1.5% |
| English | 256 | 47.6% |
| German | 216 | 40.2% |
| Hungarian | 36 | 6.7% |
| Irish | 146 | 27.1% |
| Norwegian | 14 | 2.6% |
| Scandinavian | 27 | 5.0% |
| Scotch-Irish | 67 | 12.4% |
| Swedish | 10 | 1.9% | View All 11 Rows |
Immigrants in Paradise Park
The most numerous immigrant groups reported in Paradise Park came from , and Canada (8 | 1.5%), together accounting for 1.5% of all Paradise Park residents.

| Immigration Origin | # Population | % Population |
| Canada | 8 | 1.5% | View All 1 Rows |
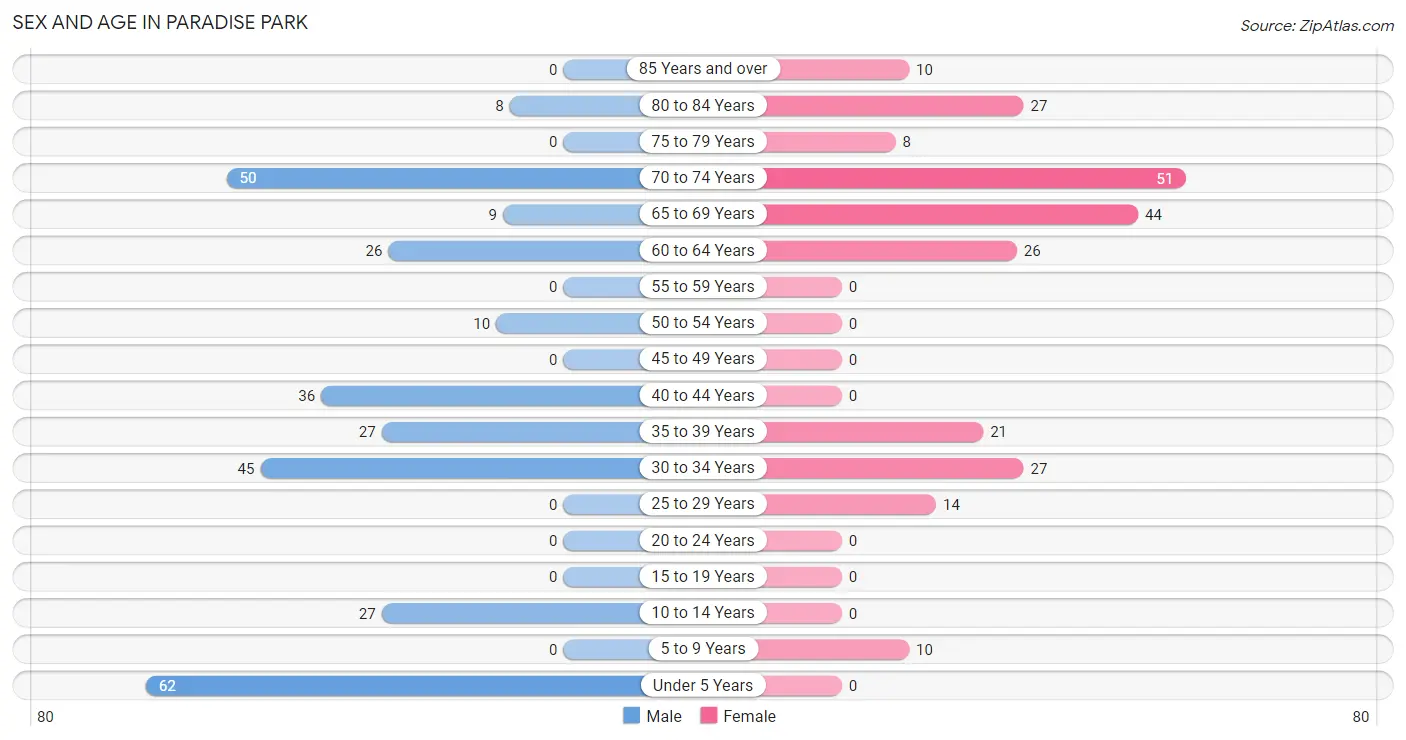
Sex and Age in Paradise Park
Sex and Age in Paradise Park
The most populous age groups in Paradise Park are Under 5 Years (62 | 20.7%) for men and 70 to 74 Years (51 | 21.4%) for women.
| Age Bracket | Male | Female |
| Under 5 Years | 62 (20.7%) | 0 (0.0%) |
| 5 to 9 Years | 0 (0.0%) | 10 (4.2%) |
| 10 to 14 Years | 27 (9.0%) | 0 (0.0%) |
| 15 to 19 Years | 0 (0.0%) | 0 (0.0%) |
| 20 to 24 Years | 0 (0.0%) | 0 (0.0%) |
| 25 to 29 Years | 0 (0.0%) | 14 (5.9%) |
| 30 to 34 Years | 45 (15.0%) | 27 (11.3%) |
| 35 to 39 Years | 27 (9.0%) | 21 (8.8%) |
| 40 to 44 Years | 36 (12.0%) | 0 (0.0%) |
| 45 to 49 Years | 0 (0.0%) | 0 (0.0%) |
| 50 to 54 Years | 10 (3.3%) | 0 (0.0%) |
| 55 to 59 Years | 0 (0.0%) | 0 (0.0%) |
| 60 to 64 Years | 26 (8.7%) | 26 (10.9%) |
| 65 to 69 Years | 9 (3.0%) | 44 (18.5%) |
| 70 to 74 Years | 50 (16.7%) | 51 (21.4%) |
| 75 to 79 Years | 0 (0.0%) | 8 (3.4%) |
| 80 to 84 Years | 8 (2.7%) | 27 (11.3%) |
| 85 Years and over | 0 (0.0%) | 10 (4.2%) |
| Total | 300 (100.0%) | 238 (100.0%) |
Families and Households in Paradise Park
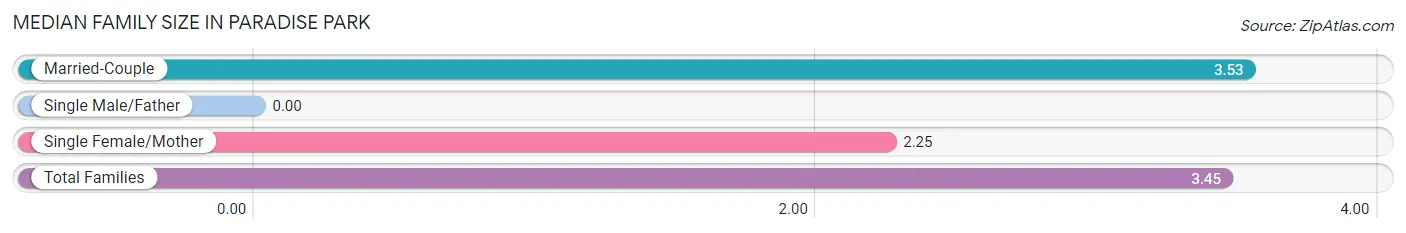
Median Family Size in Paradise Park
| Family Type | # Families | Family Size |
| Married-Couple | 120 (93.8%) | 3.53 |
| Single Male/Father | 0 (0.0%) | - |
| Single Female/Mother | 8 (6.2%) | 2.25 |
| Total Families | 128 (100.0%) | 3.45 |
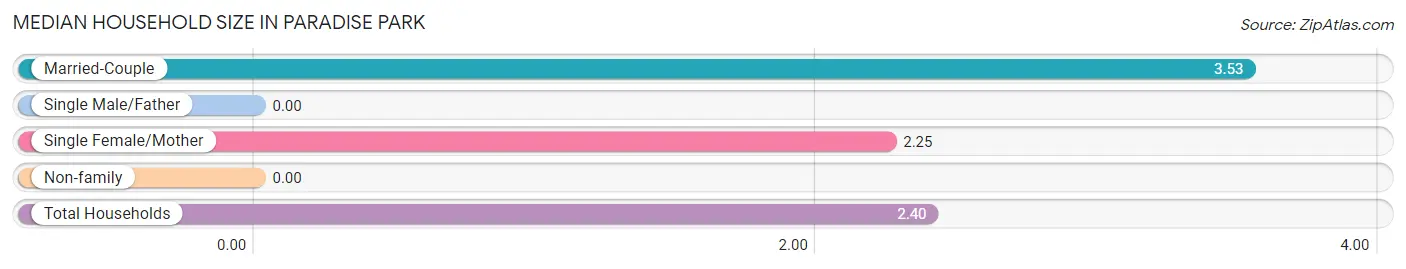
Median Household Size in Paradise Park
| Household Type | # Households | Household Size |
| Married-Couple | 120 (53.6%) | 3.53 |
| Single Male/Father | 0 (0.0%) | - |
| Single Female/Mother | 8 (3.6%) | 2.25 |
| Non-family | 96 (42.9%) | - |
| Total Households | 224 (100.0%) | 2.40 |
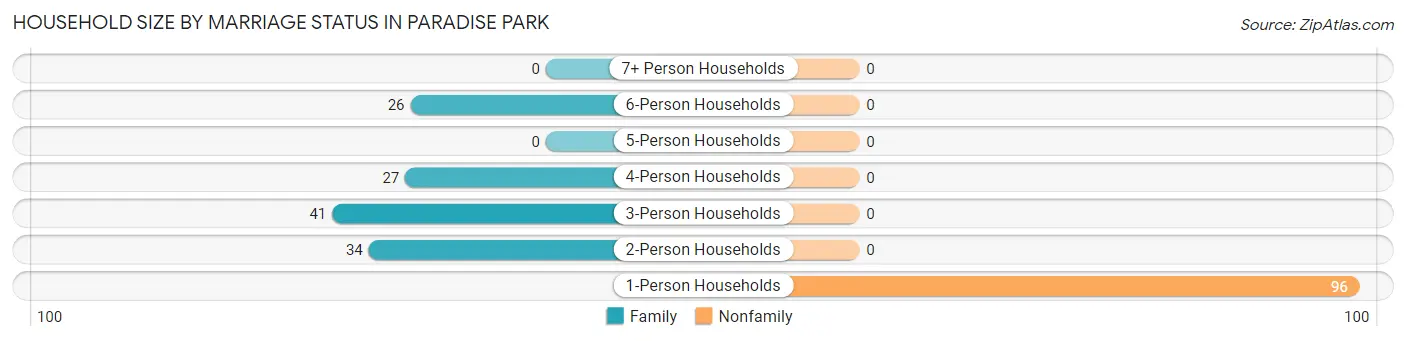
Household Size by Marriage Status in Paradise Park
Out of a total of 224 households in Paradise Park, 128 (57.1%) are family households, while 96 (42.9%) are nonfamily households. The most numerous type of family households are 3-person households, comprising 41, and the most common type of nonfamily households are 1-person households, comprising 96.
| Household Size | Family Households | Nonfamily Households |
| 1-Person Households | - | 96 (42.9%) |
| 2-Person Households | 34 (15.2%) | 0 (0.0%) |
| 3-Person Households | 41 (18.3%) | 0 (0.0%) |
| 4-Person Households | 27 (12.0%) | 0 (0.0%) |
| 5-Person Households | 0 (0.0%) | 0 (0.0%) |
| 6-Person Households | 26 (11.6%) | 0 (0.0%) |
| 7+ Person Households | 0 (0.0%) | 0 (0.0%) |
| Total | 128 (57.1%) | 96 (42.9%) |
Female Fertility in Paradise Park
Fertility by Age in Paradise Park
| Age Bracket | Women with Births | Births / 1,000 Women |
| 15 to 19 years | 0 (0.0%) | 0.0 |
| 20 to 34 years | 0 (0.0%) | 0.0 |
| 35 to 50 years | 0 (0.0%) | 0.0 |
| Total | 0 (0.0%) | 0.0 |
Fertility by Age by Marriage Status in Paradise Park
| Age Bracket | Married | Unmarried |
| 15 to 19 years | 0 (0.0%) | 0 (0.0%) |
| 20 to 34 years | 0 (0.0%) | 0 (0.0%) |
| 35 to 50 years | 0 (0.0%) | 0 (0.0%) |
| Total | 0 (0.0%) | 0 (0.0%) |
Fertility by Education in Paradise Park
| Educational Attainment | Women with Births | Births / 1,000 Women |
| Less than High School | 0 (0.0%) | 0.0 |
| High School Diploma | 0 (0.0%) | 0.0 |
| College or Associate's Degree | 0 (0.0%) | 0.0 |
| Bachelor's Degree | 0 (0.0%) | 0.0 |
| Graduate Degree | 0 (0.0%) | 0.0 |
| Total | 0 (0.0%) | 0.0 |
Fertility by Education by Marriage Status in Paradise Park
| Educational Attainment | Married | Unmarried |
| Less than High School | 0 (0.0%) | 0 (0.0%) |
| High School Diploma | 0 (0.0%) | 0 (0.0%) |
| College or Associate's Degree | 0 (0.0%) | 0 (0.0%) |
| Bachelor's Degree | 0 (0.0%) | 0 (0.0%) |
| Graduate Degree | 0 (0.0%) | 0 (0.0%) |
| Total | 0 (0.0%) | 0 (0.0%) |
Employment Characteristics in Paradise Park
Employment by Class of Employer in Paradise Park
Among the 182 employed individuals in Paradise Park, private company employees (91 | 50.0%), self-employed (not incorporated) (27 | 14.8%), and local government employees (27 | 14.8%) make up the most common classes of employment.
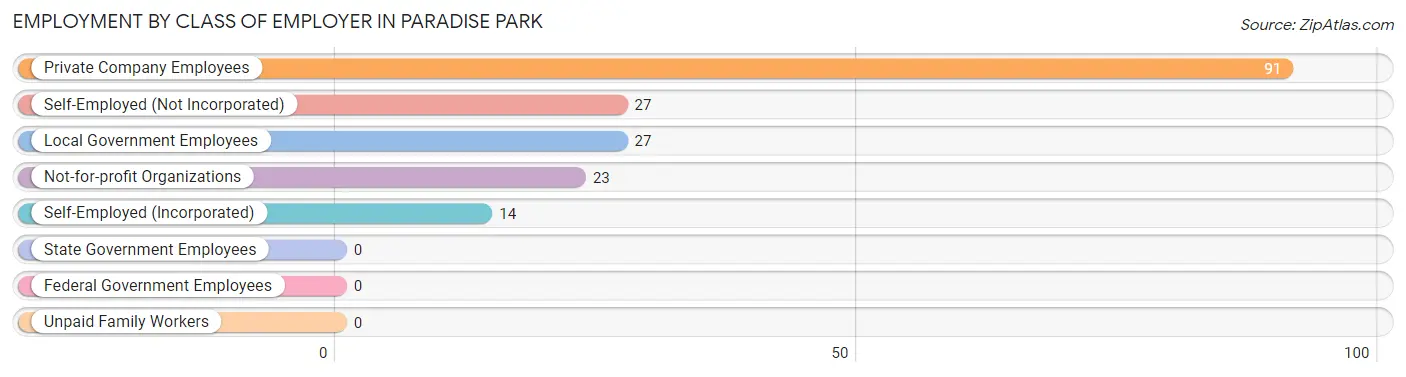
| Employer Class | # Employees | % Employees |
| Private Company Employees | 91 | 50.0% |
| Self-Employed (Incorporated) | 14 | 7.7% |
| Self-Employed (Not Incorporated) | 27 | 14.8% |
| Not-for-profit Organizations | 23 | 12.6% |
| Local Government Employees | 27 | 14.8% |
| State Government Employees | 0 | 0.0% |
| Federal Government Employees | 0 | 0.0% |
| Unpaid Family Workers | 0 | 0.0% |
| Total | 182 | 100.0% |
Employment Status by Age in Paradise Park
According to the labor force statistics for Paradise Park, out of the total population over 16 years of age (439), 45.6% or 200 individuals are in the labor force, with 9.0% or 18 of them unemployed. The age group with the highest labor force participation rate is 25 to 29 years, with 100.0% or 14 individuals in the labor force. Within the labor force, the 45 to 54 years age range has the highest percentage of unemployed individuals, with 100.0% or 10 of them being unemployed.
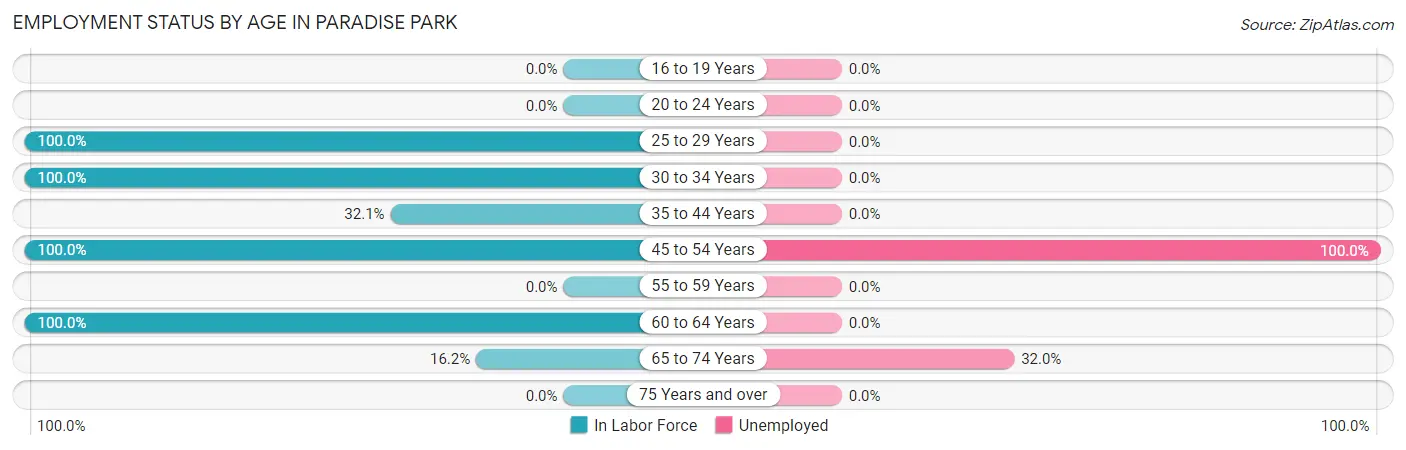
| Age Bracket | In Labor Force | Unemployed |
| 16 to 19 Years | 0 (0.0%) | 0 (0.0%) |
| 20 to 24 Years | 0 (0.0%) | 0 (0.0%) |
| 25 to 29 Years | 14 (100.0%) | 0 (0.0%) |
| 30 to 34 Years | 72 (100.0%) | 0 (0.0%) |
| 35 to 44 Years | 27 (32.1%) | 0 (0.0%) |
| 45 to 54 Years | 10 (100.0%) | 10 (100.0%) |
| 55 to 59 Years | 0 (0.0%) | 0 (0.0%) |
| 60 to 64 Years | 52 (100.0%) | 0 (0.0%) |
| 65 to 74 Years | 25 (16.2%) | 8 (32.0%) |
| 75 Years and over | 0 (0.0%) | 0 (0.0%) |
| Total | 200 (45.6%) | 18 (9.0%) |
Employment Status by Educational Attainment in Paradise Park
According to labor force statistics for Paradise Park, 75.4% of individuals (175) out of the total population between 25 and 64 years of age (232) are in the labor force, with 5.7% or 10 of them being unemployed. The group with the highest labor force participation rate are those with the educational attainment of bachelor's degree or higher, with 100.0% or 123 individuals in the labor force. Within the labor force, individuals with bachelor's degree or higher education have the highest percentage of unemployment, with 8.1% or 10 of them being unemployed.
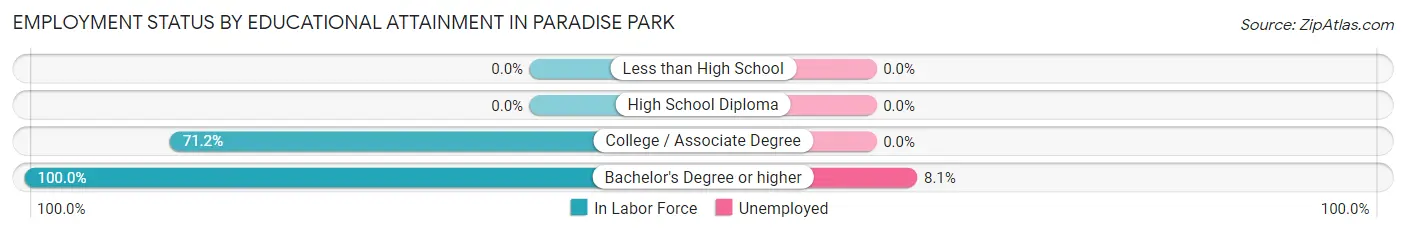
| Educational Attainment | In Labor Force | Unemployed |
| Less than High School | 0 (0.0%) | 0 (0.0%) |
| High School Diploma | 0 (0.0%) | 0 (0.0%) |
| College / Associate Degree | 52 (71.2%) | 0 (0.0%) |
| Bachelor's Degree or higher | 123 (100.0%) | 10 (8.1%) |
| Total | 175 (75.4%) | 13 (5.7%) |
Employment Occupations by Sex in Paradise Park
Management, Business, Science and Arts Occupations
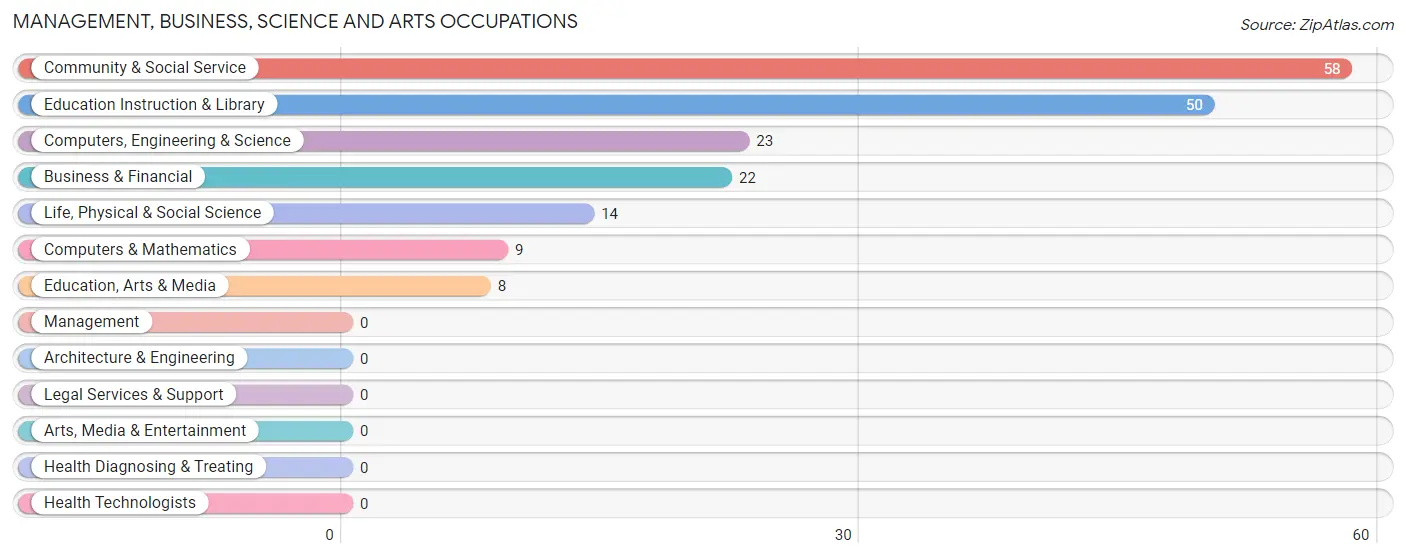
The most common Management, Business, Science and Arts occupations in Paradise Park are Community & Social Service (58 | 31.9%), Education Instruction & Library (50 | 27.5%), Computers, Engineering & Science (23 | 12.6%), Business & Financial (22 | 12.1%), and Life, Physical & Social Science (14 | 7.7%).
Management, Business, Science and Arts Occupations by Sex
Within the Management, Business, Science and Arts occupations in Paradise Park, the most male-oriented occupations are Business & Financial (100.0%), Computers & Mathematics (100.0%), and Education Instruction & Library (46.0%), while the most female-oriented occupations are Life, Physical & Social Science (100.0%), Education, Arts & Media (100.0%), and Computers, Engineering & Science (60.9%).
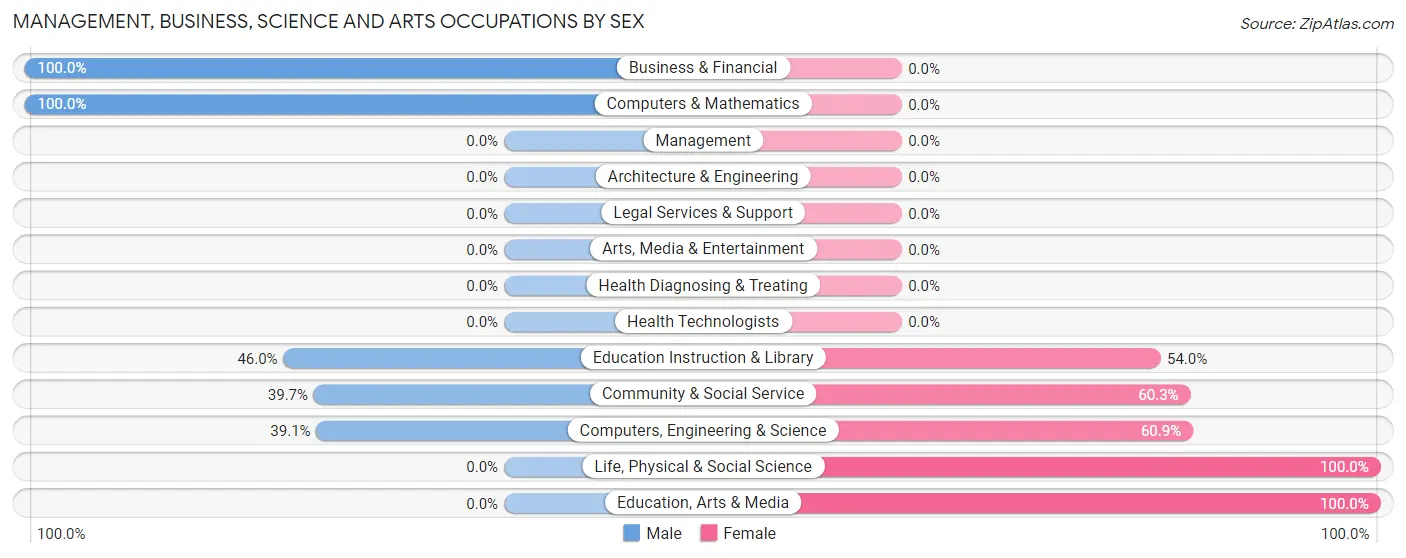
| Occupation | Male | Female |
| Management | 0 (0.0%) | 0 (0.0%) |
| Business & Financial | 22 (100.0%) | 0 (0.0%) |
| Computers, Engineering & Science | 9 (39.1%) | 14 (60.9%) |
| Computers & Mathematics | 9 (100.0%) | 0 (0.0%) |
| Architecture & Engineering | 0 (0.0%) | 0 (0.0%) |
| Life, Physical & Social Science | 0 (0.0%) | 14 (100.0%) |
| Community & Social Service | 23 (39.7%) | 35 (60.3%) |
| Education, Arts & Media | 0 (0.0%) | 8 (100.0%) |
| Legal Services & Support | 0 (0.0%) | 0 (0.0%) |
| Education Instruction & Library | 23 (46.0%) | 27 (54.0%) |
| Arts, Media & Entertainment | 0 (0.0%) | 0 (0.0%) |
| Health Diagnosing & Treating | 0 (0.0%) | 0 (0.0%) |
| Health Technologists | 0 (0.0%) | 0 (0.0%) |
| Total (Category) | 54 (52.4%) | 49 (47.6%) |
| Total (Overall) | 107 (58.8%) | 75 (41.2%) |
Services Occupations
The most common Services occupations in Paradise Park are Security & Protection (26 | 14.3%), and Firefighting & Prevention (26 | 14.3%).
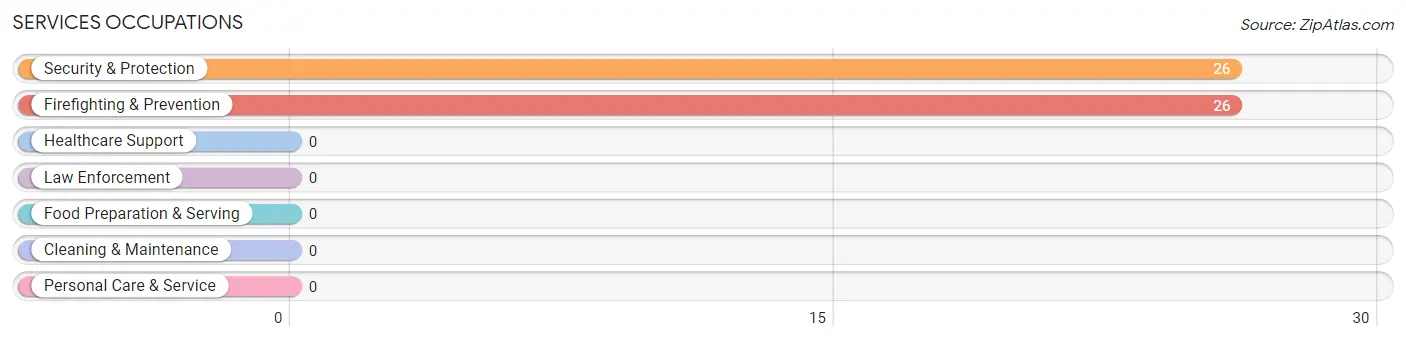
Services Occupations by Sex
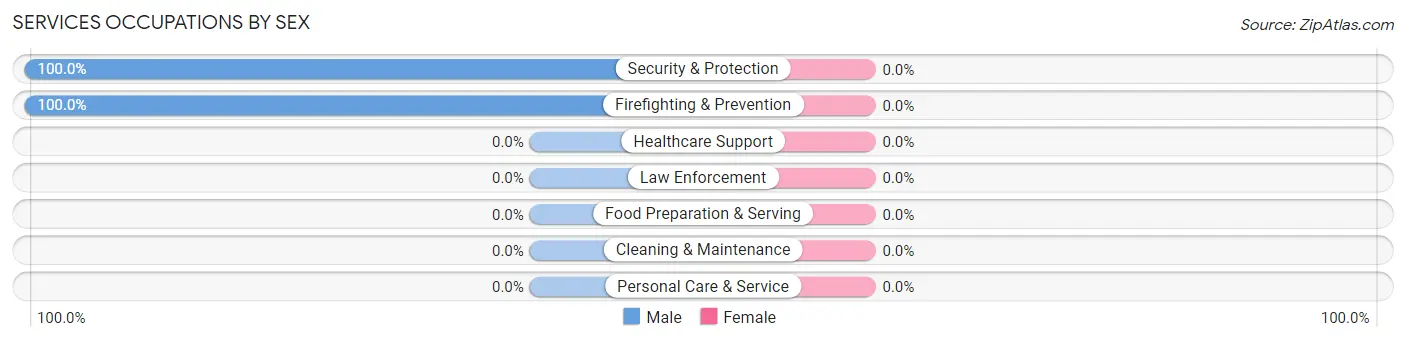
| Occupation | Male | Female |
| Healthcare Support | 0 (0.0%) | 0 (0.0%) |
| Security & Protection | 26 (100.0%) | 0 (0.0%) |
| Firefighting & Prevention | 26 (100.0%) | 0 (0.0%) |
| Law Enforcement | 0 (0.0%) | 0 (0.0%) |
| Food Preparation & Serving | 0 (0.0%) | 0 (0.0%) |
| Cleaning & Maintenance | 0 (0.0%) | 0 (0.0%) |
| Personal Care & Service | 0 (0.0%) | 0 (0.0%) |
| Total (Category) | 26 (100.0%) | 0 (0.0%) |
| Total (Overall) | 107 (58.8%) | 75 (41.2%) |
Sales and Office Occupations
The most common Sales and Office occupations in Paradise Park are , and Office & Administration (26 | 14.3%).
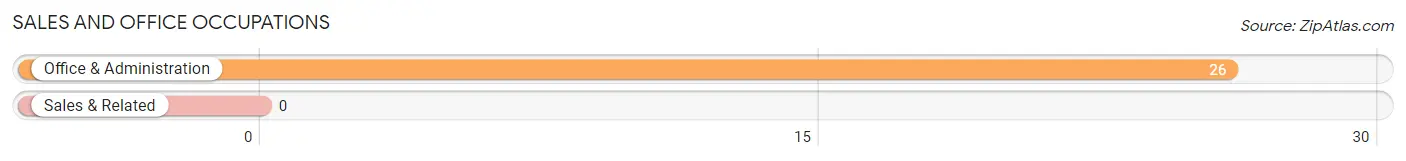
Sales and Office Occupations by Sex
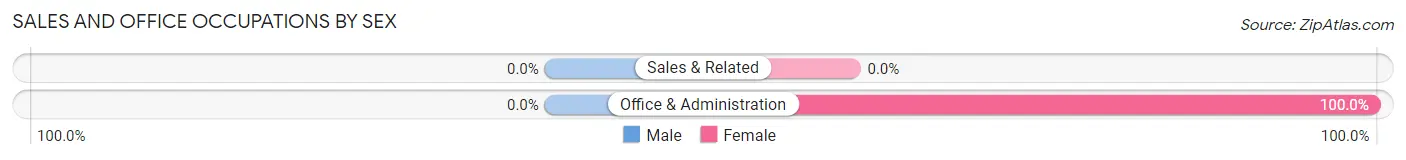
| Occupation | Male | Female |
| Sales & Related | 0 (0.0%) | 0 (0.0%) |
| Office & Administration | 0 (0.0%) | 26 (100.0%) |
| Total (Category) | 0 (0.0%) | 26 (100.0%) |
| Total (Overall) | 107 (58.8%) | 75 (41.2%) |
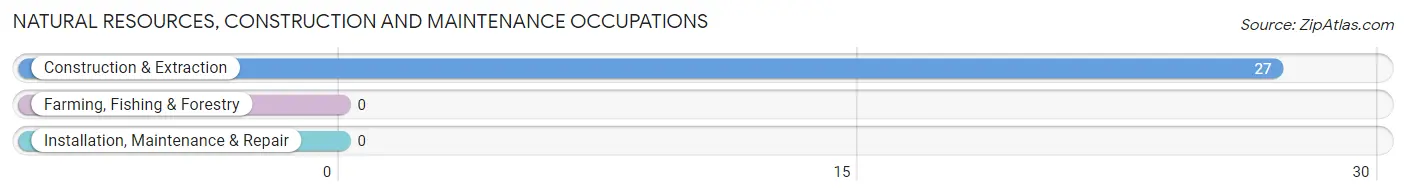
Natural Resources, Construction and Maintenance Occupations
The most common Natural Resources, Construction and Maintenance occupations in Paradise Park are , and Construction & Extraction (27 | 14.8%).
Natural Resources, Construction and Maintenance Occupations by Sex
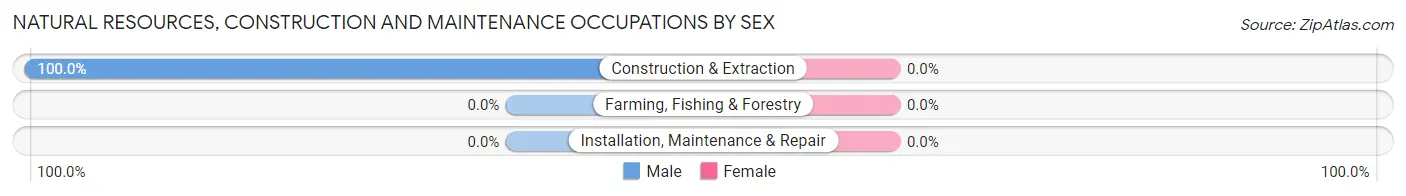
| Occupation | Male | Female |
| Farming, Fishing & Forestry | 0 (0.0%) | 0 (0.0%) |
| Construction & Extraction | 27 (100.0%) | 0 (0.0%) |
| Installation, Maintenance & Repair | 0 (0.0%) | 0 (0.0%) |
| Total (Category) | 27 (100.0%) | 0 (0.0%) |
| Total (Overall) | 107 (58.8%) | 75 (41.2%) |
Production, Transportation and Moving Occupations
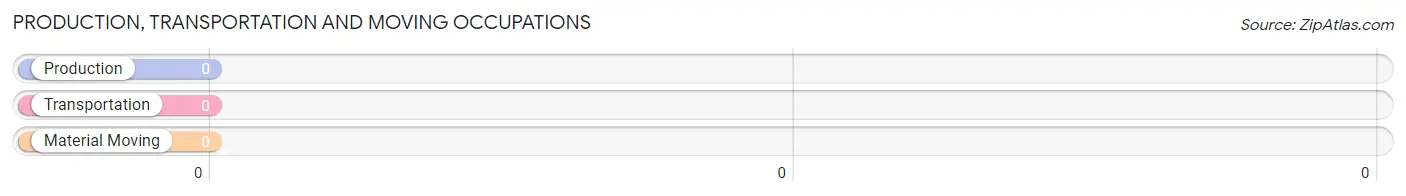
Production, Transportation and Moving Occupations by Sex
| Occupation | Male | Female |
| Production | 0 (0.0%) | 0 (0.0%) |
| Transportation | 0 (0.0%) | 0 (0.0%) |
| Material Moving | 0 (0.0%) | 0 (0.0%) |
| Total (Category) | 0 (0.0%) | 0 (0.0%) |
| Total (Overall) | 107 (58.8%) | 75 (41.2%) |
Employment Industries by Sex in Paradise Park
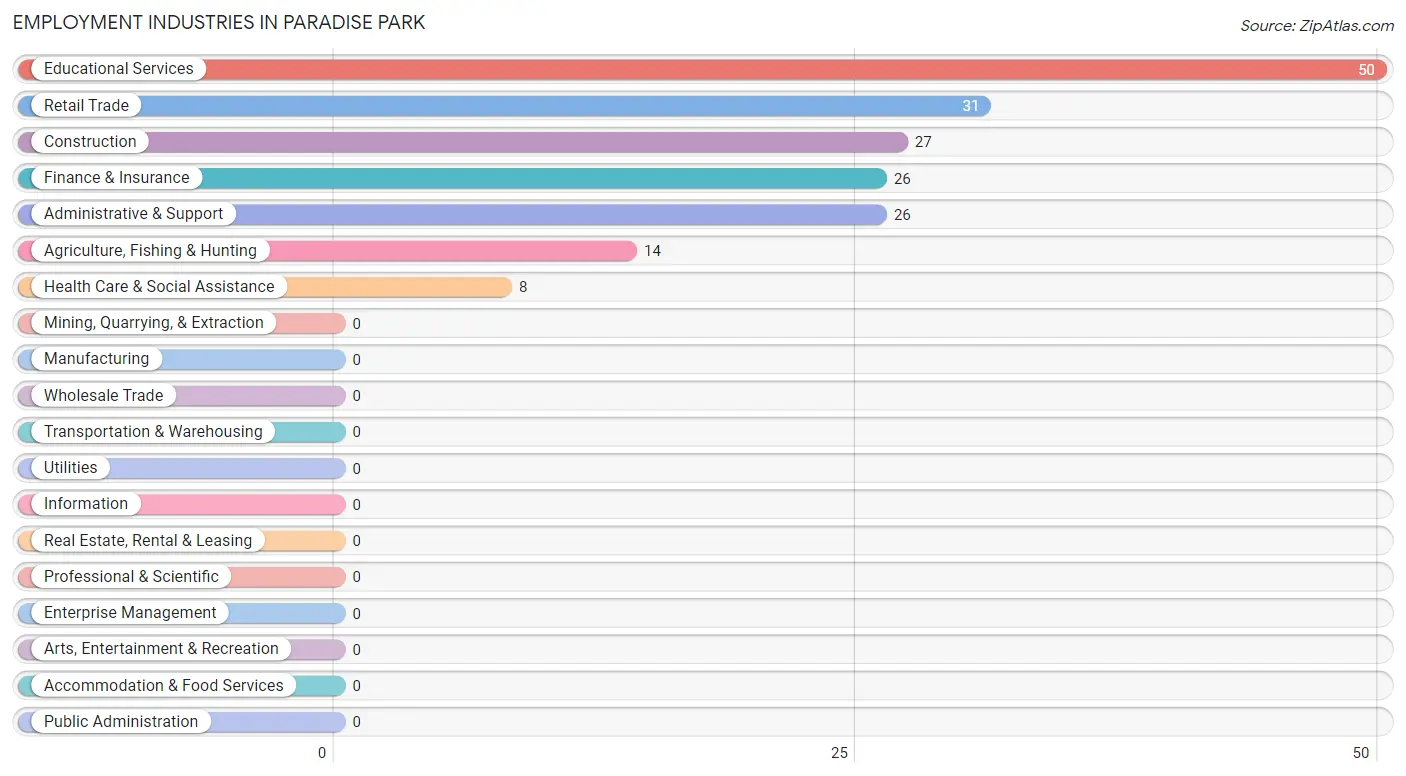
Employment Industries in Paradise Park
The major employment industries in Paradise Park include Educational Services (50 | 27.5%), Retail Trade (31 | 17.0%), Construction (27 | 14.8%), Finance & Insurance (26 | 14.3%), and Administrative & Support (26 | 14.3%).
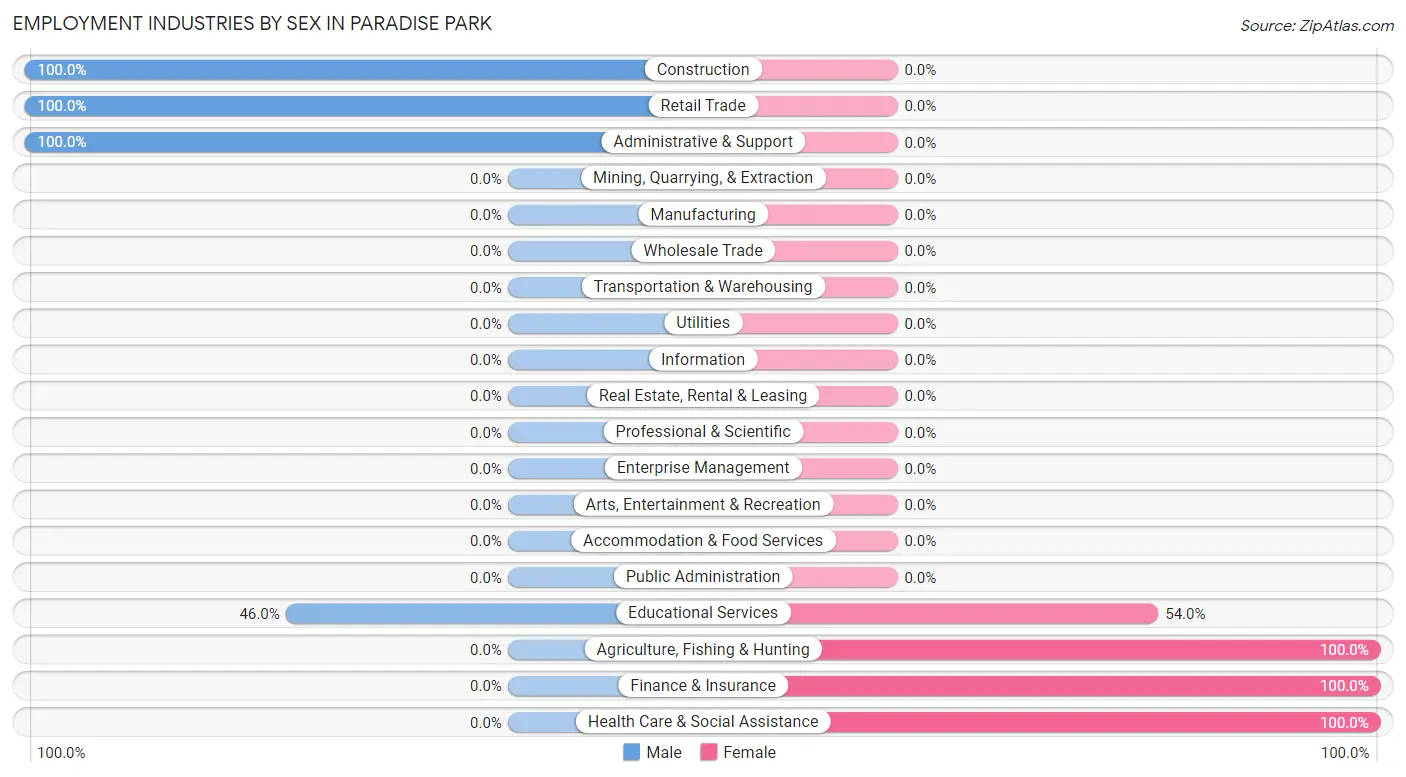
Employment Industries by Sex in Paradise Park
The Paradise Park industries that see more men than women are Construction (100.0%), Retail Trade (100.0%), and Administrative & Support (100.0%), whereas the industries that tend to have a higher number of women are Agriculture, Fishing & Hunting (100.0%), Finance & Insurance (100.0%), and Health Care & Social Assistance (100.0%).
| Industry | Male | Female |
| Agriculture, Fishing & Hunting | 0 (0.0%) | 14 (100.0%) |
| Mining, Quarrying, & Extraction | 0 (0.0%) | 0 (0.0%) |
| Construction | 27 (100.0%) | 0 (0.0%) |
| Manufacturing | 0 (0.0%) | 0 (0.0%) |
| Wholesale Trade | 0 (0.0%) | 0 (0.0%) |
| Retail Trade | 31 (100.0%) | 0 (0.0%) |
| Transportation & Warehousing | 0 (0.0%) | 0 (0.0%) |
| Utilities | 0 (0.0%) | 0 (0.0%) |
| Information | 0 (0.0%) | 0 (0.0%) |
| Finance & Insurance | 0 (0.0%) | 26 (100.0%) |
| Real Estate, Rental & Leasing | 0 (0.0%) | 0 (0.0%) |
| Professional & Scientific | 0 (0.0%) | 0 (0.0%) |
| Enterprise Management | 0 (0.0%) | 0 (0.0%) |
| Administrative & Support | 26 (100.0%) | 0 (0.0%) |
| Educational Services | 23 (46.0%) | 27 (54.0%) |
| Health Care & Social Assistance | 0 (0.0%) | 8 (100.0%) |
| Arts, Entertainment & Recreation | 0 (0.0%) | 0 (0.0%) |
| Accommodation & Food Services | 0 (0.0%) | 0 (0.0%) |
| Public Administration | 0 (0.0%) | 0 (0.0%) |
| Total | 107 (58.8%) | 75 (41.2%) |
Education in Paradise Park
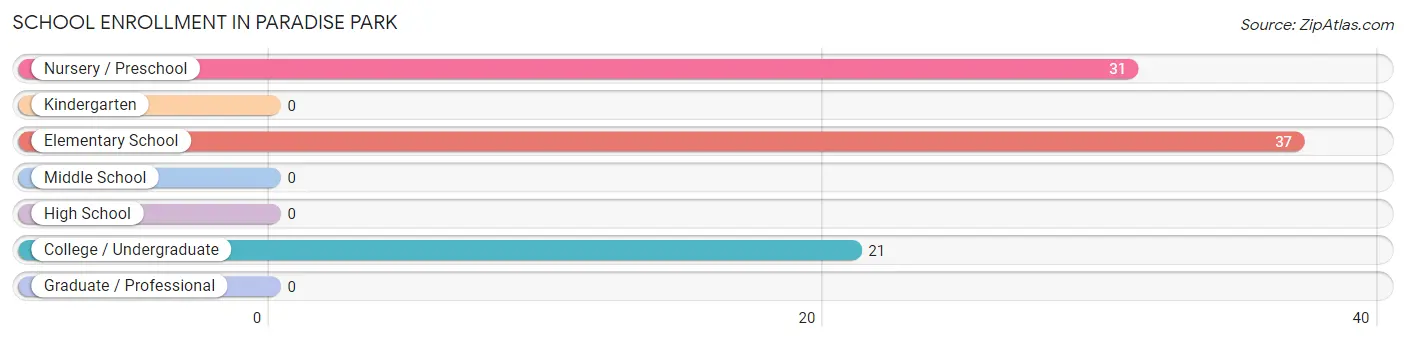
School Enrollment in Paradise Park
The most common levels of schooling among the 89 students in Paradise Park are elementary school (37 | 41.6%), nursery / preschool (31 | 34.8%), and college / undergraduate (21 | 23.6%).
| School Level | # Students | % Students |
| Nursery / Preschool | 31 | 34.8% |
| Kindergarten | 0 | 0.0% |
| Elementary School | 37 | 41.6% |
| Middle School | 0 | 0.0% |
| High School | 0 | 0.0% |
| College / Undergraduate | 21 | 23.6% |
| Graduate / Professional | 0 | 0.0% |
| Total | 89 | 100.0% |
School Enrollment by Age by Funding Source in Paradise Park
Out of a total of 89 students who are enrolled in schools in Paradise Park, 31 (34.8%) attend a private institution, while the remaining 58 (65.2%) are enrolled in public schools. The age group of 3 to 4 year olds has the highest likelihood of being enrolled in private schools, with 31 (100.0% in the age bracket) enrolled. Conversely, the age group of 5 to 9 year old has the lowest likelihood of being enrolled in a private school, with 10 (100.0% in the age bracket) attending a public institution.
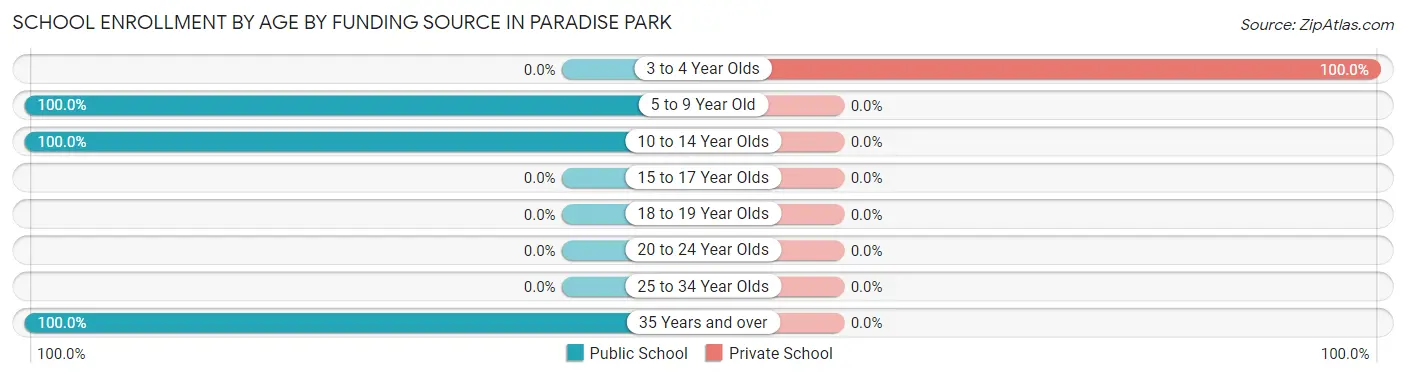
| Age Bracket | Public School | Private School |
| 3 to 4 Year Olds | 0 (0.0%) | 31 (100.0%) |
| 5 to 9 Year Old | 10 (100.0%) | 0 (0.0%) |
| 10 to 14 Year Olds | 27 (100.0%) | 0 (0.0%) |
| 15 to 17 Year Olds | 0 (0.0%) | 0 (0.0%) |
| 18 to 19 Year Olds | 0 (0.0%) | 0 (0.0%) |
| 20 to 24 Year Olds | 0 (0.0%) | 0 (0.0%) |
| 25 to 34 Year Olds | 0 (0.0%) | 0 (0.0%) |
| 35 Years and over | 21 (100.0%) | 0 (0.0%) |
| Total | 58 (65.2%) | 31 (34.8%) |
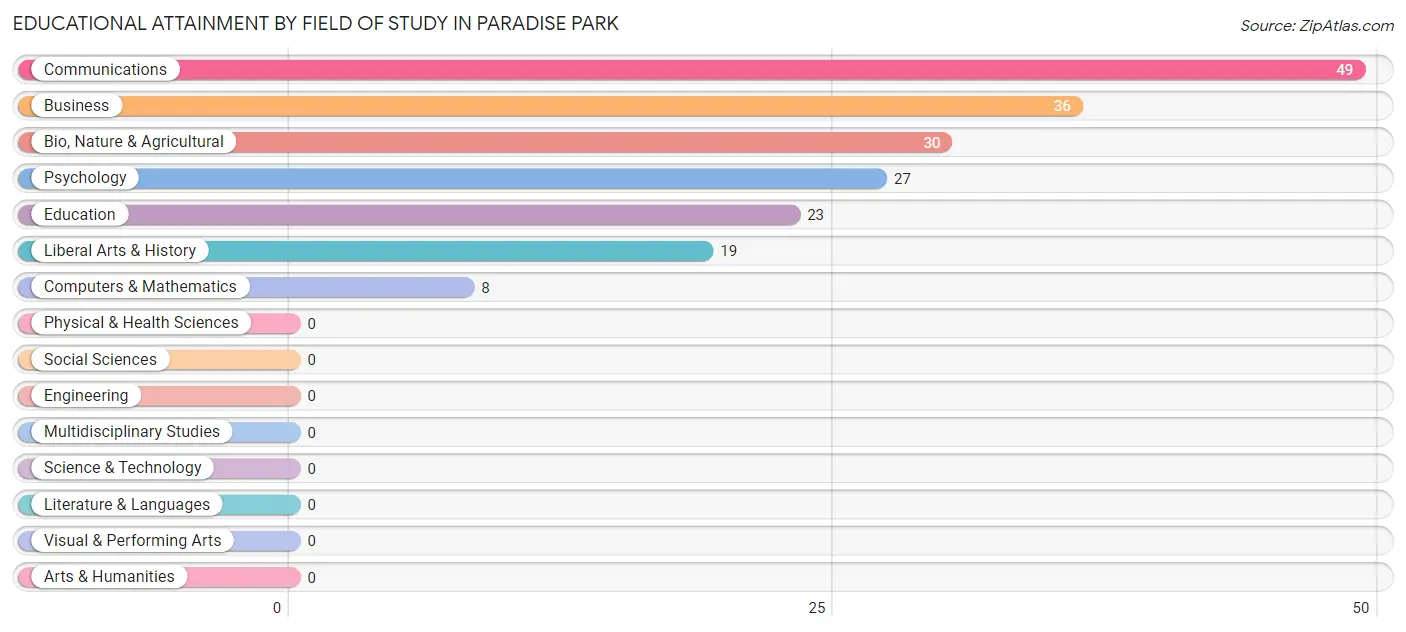
Educational Attainment by Field of Study in Paradise Park
Communications (49 | 25.5%), business (36 | 18.8%), bio, nature & agricultural (30 | 15.6%), psychology (27 | 14.1%), and education (23 | 12.0%) are the most common fields of study among 192 individuals in Paradise Park who have obtained a bachelor's degree or higher.
| Field of Study | # Graduates | % Graduates |
| Computers & Mathematics | 8 | 4.2% |
| Bio, Nature & Agricultural | 30 | 15.6% |
| Physical & Health Sciences | 0 | 0.0% |
| Psychology | 27 | 14.1% |
| Social Sciences | 0 | 0.0% |
| Engineering | 0 | 0.0% |
| Multidisciplinary Studies | 0 | 0.0% |
| Science & Technology | 0 | 0.0% |
| Business | 36 | 18.8% |
| Education | 23 | 12.0% |
| Literature & Languages | 0 | 0.0% |
| Liberal Arts & History | 19 | 9.9% |
| Visual & Performing Arts | 0 | 0.0% |
| Communications | 49 | 25.5% |
| Arts & Humanities | 0 | 0.0% |
| Total | 192 | 100.0% |
Transportation & Commute in Paradise Park
Vehicle Availability by Sex in Paradise Park
The most prevalent vehicle ownership categories in Paradise Park are males with 5 or more vehicles (71, accounting for 66.4%) and females with 5 or more vehicles (26, making up 94.7%).
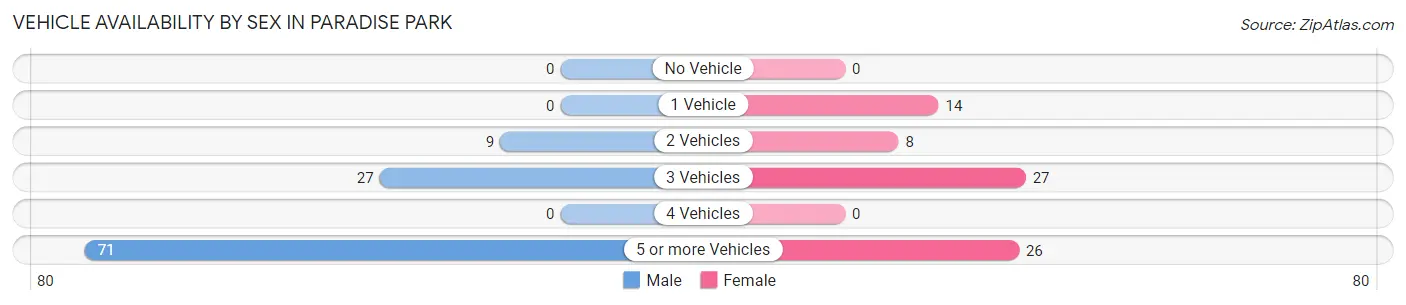
| Vehicles Available | Male | Female |
| No Vehicle | 0 (0.0%) | 0 (0.0%) |
| 1 Vehicle | 0 (0.0%) | 14 (18.7%) |
| 2 Vehicles | 9 (8.4%) | 8 (10.7%) |
| 3 Vehicles | 27 (25.2%) | 27 (36.0%) |
| 4 Vehicles | 0 (0.0%) | 0 (0.0%) |
| 5 or more Vehicles | 71 (66.4%) | 26 (34.7%) |
| Total | 107 (100.0%) | 75 (100.0%) |
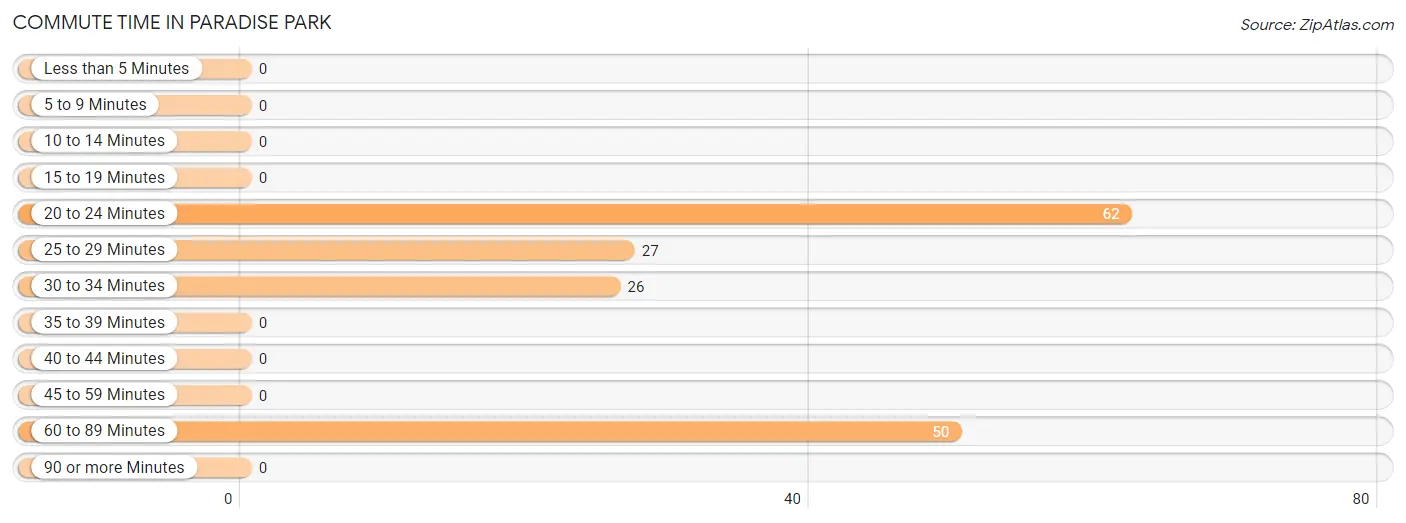
Commute Time in Paradise Park
The most frequently occuring commute durations in Paradise Park are 20 to 24 minutes (62 commuters, 37.6%), 60 to 89 minutes (50 commuters, 30.3%), and 25 to 29 minutes (27 commuters, 16.4%).
| Commute Time | # Commuters | % Commuters |
| Less than 5 Minutes | 0 | 0.0% |
| 5 to 9 Minutes | 0 | 0.0% |
| 10 to 14 Minutes | 0 | 0.0% |
| 15 to 19 Minutes | 0 | 0.0% |
| 20 to 24 Minutes | 62 | 37.6% |
| 25 to 29 Minutes | 27 | 16.4% |
| 30 to 34 Minutes | 26 | 15.8% |
| 35 to 39 Minutes | 0 | 0.0% |
| 40 to 44 Minutes | 0 | 0.0% |
| 45 to 59 Minutes | 0 | 0.0% |
| 60 to 89 Minutes | 50 | 30.3% |
| 90 or more Minutes | 0 | 0.0% |
Commute Time by Sex in Paradise Park
The most common commute times in Paradise Park are 60 to 89 minutes (50 commuters, 51.0%) for males and 25 to 29 minutes (27 commuters, 40.3%) for females.
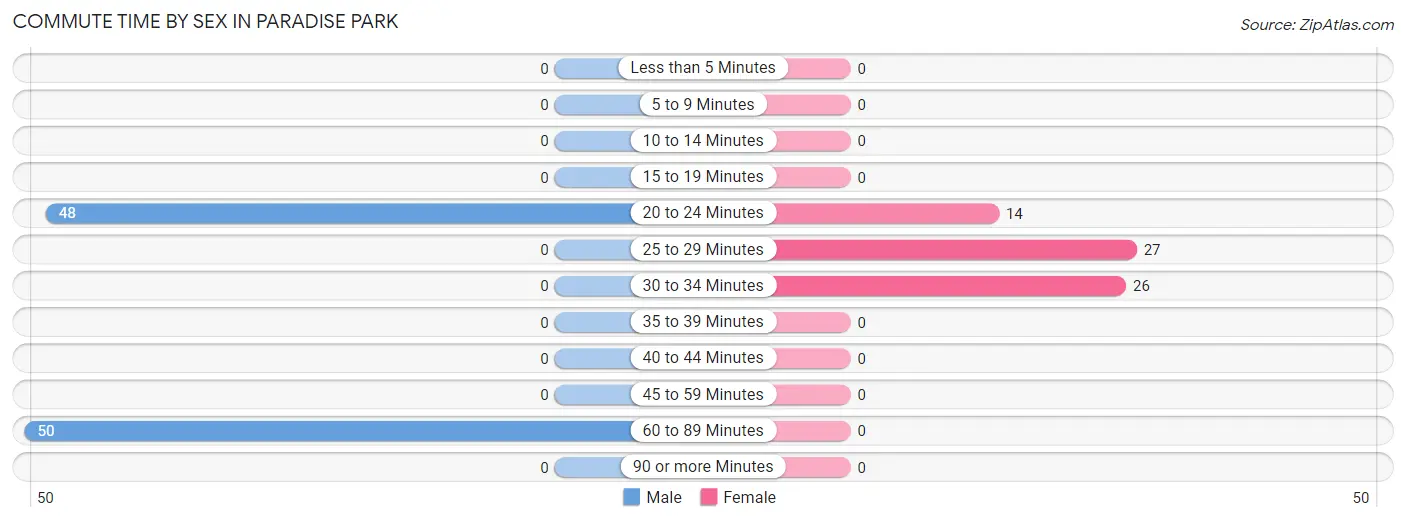
| Commute Time | Male | Female |
| Less than 5 Minutes | 0 (0.0%) | 0 (0.0%) |
| 5 to 9 Minutes | 0 (0.0%) | 0 (0.0%) |
| 10 to 14 Minutes | 0 (0.0%) | 0 (0.0%) |
| 15 to 19 Minutes | 0 (0.0%) | 0 (0.0%) |
| 20 to 24 Minutes | 48 (49.0%) | 14 (20.9%) |
| 25 to 29 Minutes | 0 (0.0%) | 27 (40.3%) |
| 30 to 34 Minutes | 0 (0.0%) | 26 (38.8%) |
| 35 to 39 Minutes | 0 (0.0%) | 0 (0.0%) |
| 40 to 44 Minutes | 0 (0.0%) | 0 (0.0%) |
| 45 to 59 Minutes | 0 (0.0%) | 0 (0.0%) |
| 60 to 89 Minutes | 50 (51.0%) | 0 (0.0%) |
| 90 or more Minutes | 0 (0.0%) | 0 (0.0%) |
Time of Departure to Work by Sex in Paradise Park
The most frequent times of departure to work in Paradise Park are 5:30 AM to 5:59 AM (50, 51.0%) for males and 9:00 AM to 9:59 AM (27, 40.3%) for females.
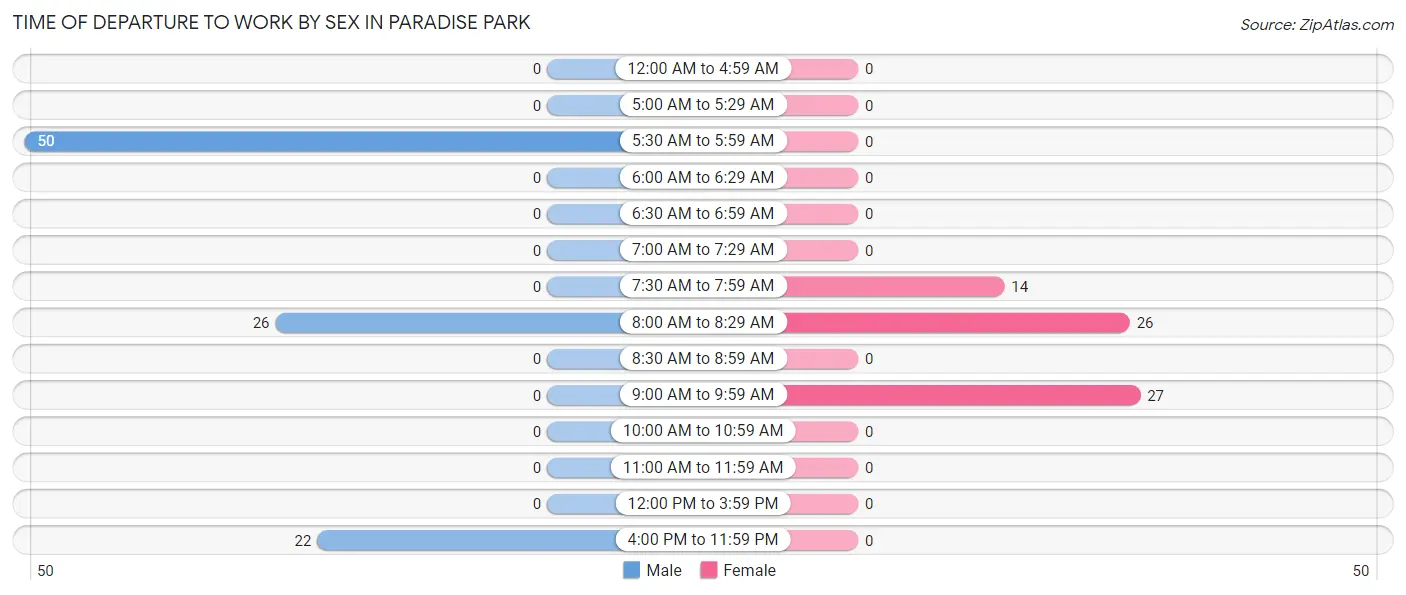
| Time of Departure | Male | Female |
| 12:00 AM to 4:59 AM | 0 (0.0%) | 0 (0.0%) |
| 5:00 AM to 5:29 AM | 0 (0.0%) | 0 (0.0%) |
| 5:30 AM to 5:59 AM | 50 (51.0%) | 0 (0.0%) |
| 6:00 AM to 6:29 AM | 0 (0.0%) | 0 (0.0%) |
| 6:30 AM to 6:59 AM | 0 (0.0%) | 0 (0.0%) |
| 7:00 AM to 7:29 AM | 0 (0.0%) | 0 (0.0%) |
| 7:30 AM to 7:59 AM | 0 (0.0%) | 14 (20.9%) |
| 8:00 AM to 8:29 AM | 26 (26.5%) | 26 (38.8%) |
| 8:30 AM to 8:59 AM | 0 (0.0%) | 0 (0.0%) |
| 9:00 AM to 9:59 AM | 0 (0.0%) | 27 (40.3%) |
| 10:00 AM to 10:59 AM | 0 (0.0%) | 0 (0.0%) |
| 11:00 AM to 11:59 AM | 0 (0.0%) | 0 (0.0%) |
| 12:00 PM to 3:59 PM | 0 (0.0%) | 0 (0.0%) |
| 4:00 PM to 11:59 PM | 22 (22.5%) | 0 (0.0%) |
| Total | 98 (100.0%) | 67 (100.0%) |
Housing Occupancy in Paradise Park
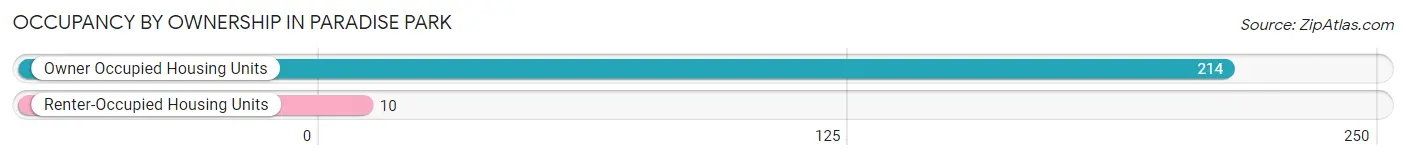
Occupancy by Ownership in Paradise Park
Of the total 224 dwellings in Paradise Park, owner-occupied units account for 214 (95.5%), while renter-occupied units make up 10 (4.5%).
| Occupancy | # Housing Units | % Housing Units |
| Owner Occupied Housing Units | 214 | 95.5% |
| Renter-Occupied Housing Units | 10 | 4.5% |
| Total Occupied Housing Units | 224 | 100.0% |
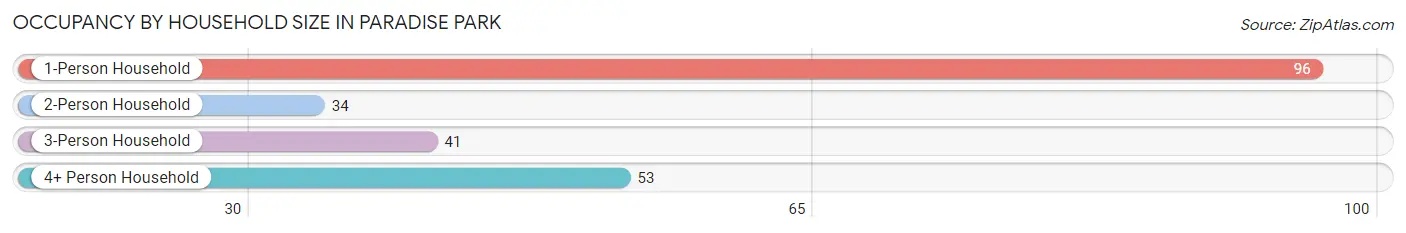
Occupancy by Household Size in Paradise Park
| Household Size | # Housing Units | % Housing Units |
| 1-Person Household | 96 | 42.9% |
| 2-Person Household | 34 | 15.2% |
| 3-Person Household | 41 | 18.3% |
| 4+ Person Household | 53 | 23.7% |
| Total Housing Units | 224 | 100.0% |
Occupancy by Ownership by Household Size in Paradise Park
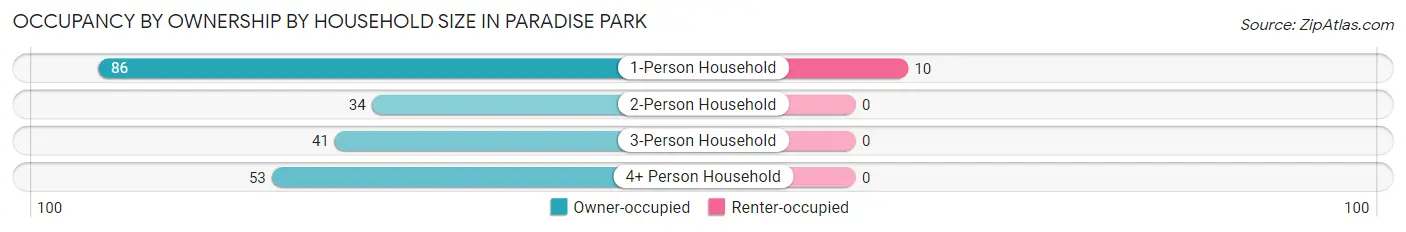
| Household Size | Owner-occupied | Renter-occupied |
| 1-Person Household | 86 (89.6%) | 10 (10.4%) |
| 2-Person Household | 34 (100.0%) | 0 (0.0%) |
| 3-Person Household | 41 (100.0%) | 0 (0.0%) |
| 4+ Person Household | 53 (100.0%) | 0 (0.0%) |
| Total Housing Units | 214 (95.5%) | 10 (4.5%) |
Occupancy by Educational Attainment in Paradise Park
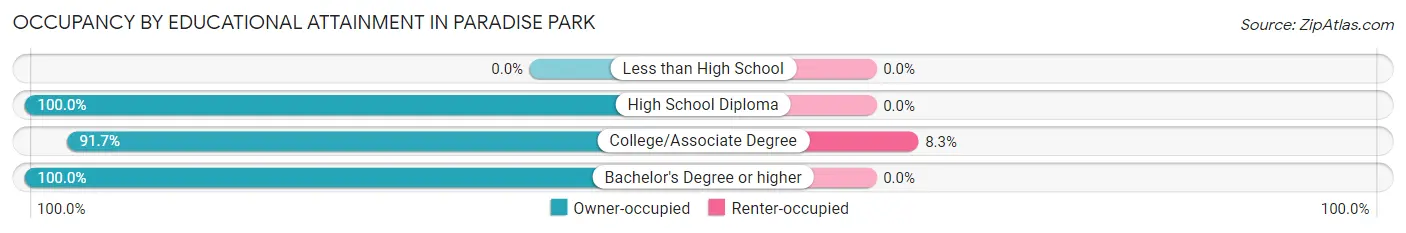
| Household Size | Owner-occupied | Renter-occupied |
| Less than High School | 0 (0.0%) | 0 (0.0%) |
| High School Diploma | 9 (100.0%) | 0 (0.0%) |
| College/Associate Degree | 110 (91.7%) | 10 (8.3%) |
| Bachelor's Degree or higher | 95 (100.0%) | 0 (0.0%) |
Occupancy by Age of Householder in Paradise Park
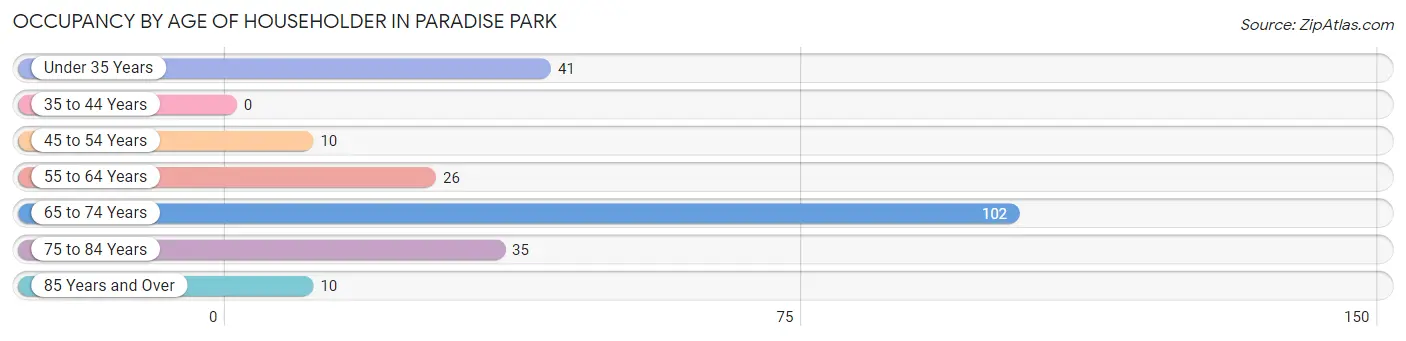
| Age Bracket | # Households | % Households |
| Under 35 Years | 41 | 18.3% |
| 35 to 44 Years | 0 | 0.0% |
| 45 to 54 Years | 10 | 4.5% |
| 55 to 64 Years | 26 | 11.6% |
| 65 to 74 Years | 102 | 45.5% |
| 75 to 84 Years | 35 | 15.6% |
| 85 Years and Over | 10 | 4.5% |
| Total | 224 | 100.0% |
Housing Finances in Paradise Park
Median Income by Occupancy in Paradise Park
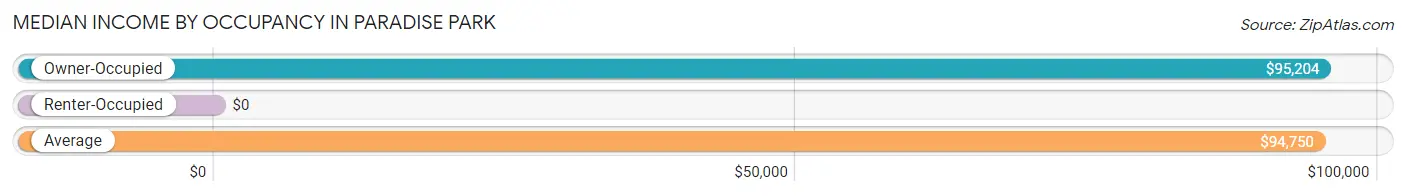
| Occupancy Type | # Households | Median Income |
| Owner-Occupied | 214 (95.5%) | $95,204 |
| Renter-Occupied | 10 (4.5%) | $0 |
| Average | 224 (100.0%) | $94,750 |
Occupancy by Householder Income Bracket in Paradise Park
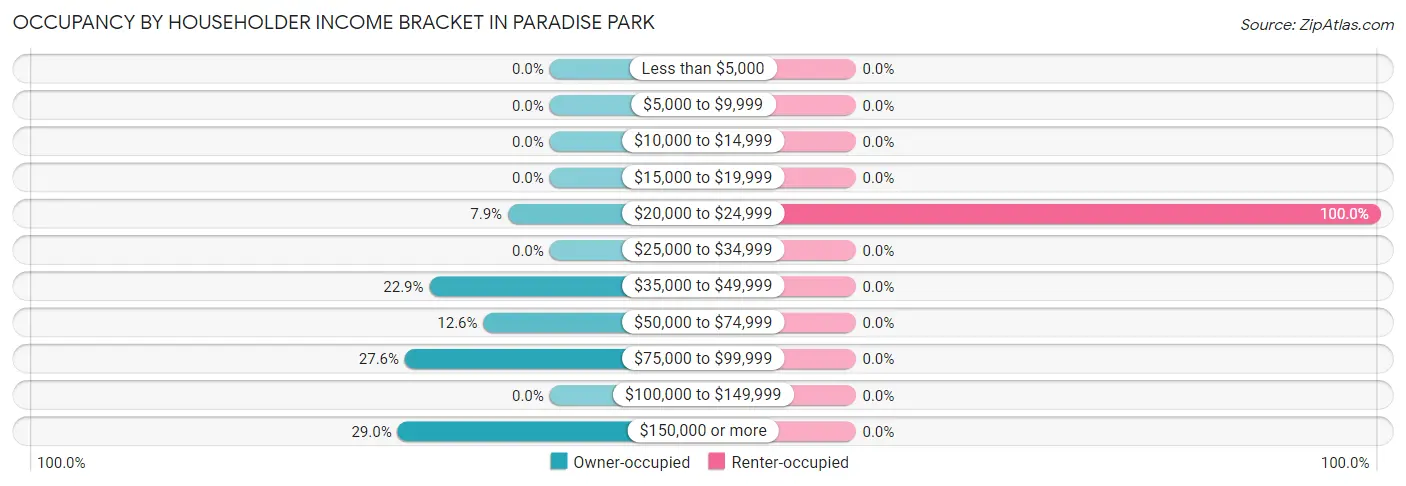
| Income Bracket | Owner-occupied | Renter-occupied |
| Less than $5,000 | 0 (0.0%) | 0 (0.0%) |
| $5,000 to $9,999 | 0 (0.0%) | 0 (0.0%) |
| $10,000 to $14,999 | 0 (0.0%) | 0 (0.0%) |
| $15,000 to $19,999 | 0 (0.0%) | 0 (0.0%) |
| $20,000 to $24,999 | 17 (7.9%) | 10 (100.0%) |
| $25,000 to $34,999 | 0 (0.0%) | 0 (0.0%) |
| $35,000 to $49,999 | 49 (22.9%) | 0 (0.0%) |
| $50,000 to $74,999 | 27 (12.6%) | 0 (0.0%) |
| $75,000 to $99,999 | 59 (27.6%) | 0 (0.0%) |
| $100,000 to $149,999 | 0 (0.0%) | 0 (0.0%) |
| $150,000 or more | 62 (29.0%) | 0 (0.0%) |
| Total | 214 (100.0%) | 10 (100.0%) |
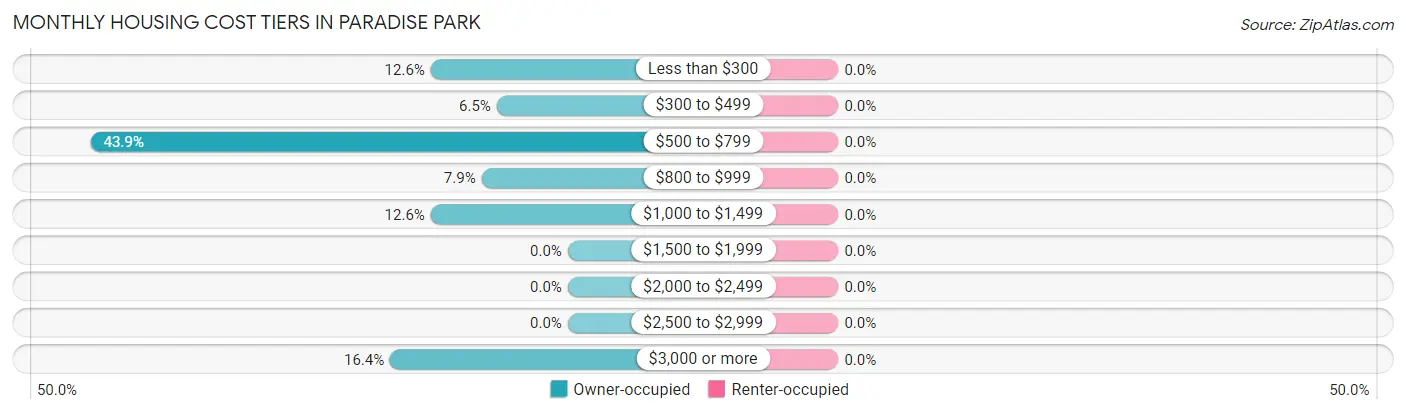
Monthly Housing Cost Tiers in Paradise Park
| Monthly Cost | Owner-occupied | Renter-occupied |
| Less than $300 | 27 (12.6%) | 0 (0.0%) |
| $300 to $499 | 14 (6.5%) | 0 (0.0%) |
| $500 to $799 | 94 (43.9%) | 0 (0.0%) |
| $800 to $999 | 17 (7.9%) | 0 (0.0%) |
| $1,000 to $1,499 | 27 (12.6%) | 0 (0.0%) |
| $1,500 to $1,999 | 0 (0.0%) | 0 (0.0%) |
| $2,000 to $2,499 | 0 (0.0%) | 0 (0.0%) |
| $2,500 to $2,999 | 0 (0.0%) | 0 (0.0%) |
| $3,000 or more | 35 (16.4%) | 0 (0.0%) |
| Total | 214 (100.0%) | 10 (100.0%) |
Physical Housing Characteristics in Paradise Park
Housing Structures in Paradise Park
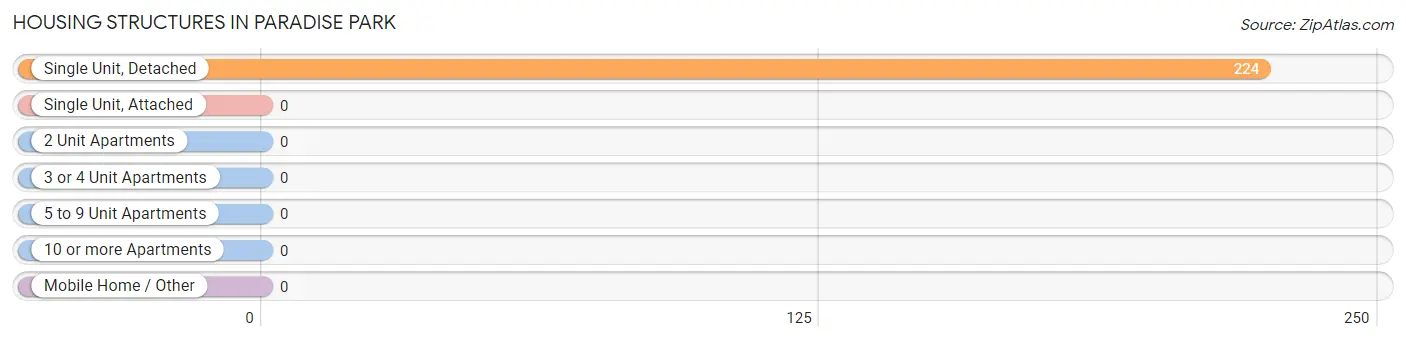
| Structure Type | # Housing Units | % Housing Units |
| Single Unit, Detached | 224 | 100.0% |
| Single Unit, Attached | 0 | 0.0% |
| 2 Unit Apartments | 0 | 0.0% |
| 3 or 4 Unit Apartments | 0 | 0.0% |
| 5 to 9 Unit Apartments | 0 | 0.0% |
| 10 or more Apartments | 0 | 0.0% |
| Mobile Home / Other | 0 | 0.0% |
| Total | 224 | 100.0% |
Housing Structures by Occupancy in Paradise Park
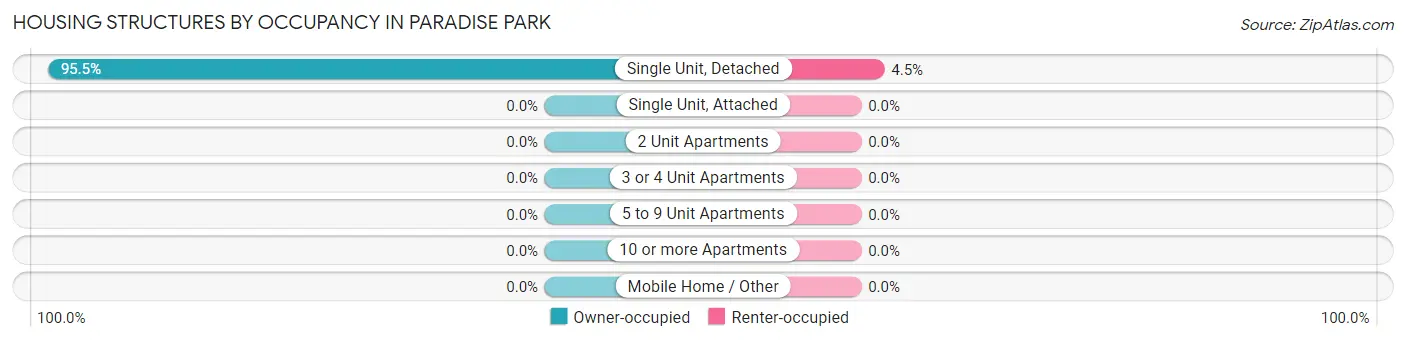
| Structure Type | Owner-occupied | Renter-occupied |
| Single Unit, Detached | 214 (95.5%) | 10 (4.5%) |
| Single Unit, Attached | 0 (0.0%) | 0 (0.0%) |
| 2 Unit Apartments | 0 (0.0%) | 0 (0.0%) |
| 3 or 4 Unit Apartments | 0 (0.0%) | 0 (0.0%) |
| 5 to 9 Unit Apartments | 0 (0.0%) | 0 (0.0%) |
| 10 or more Apartments | 0 (0.0%) | 0 (0.0%) |
| Mobile Home / Other | 0 (0.0%) | 0 (0.0%) |
| Total | 214 (95.5%) | 10 (4.5%) |
Housing Structures by Number of Rooms in Paradise Park
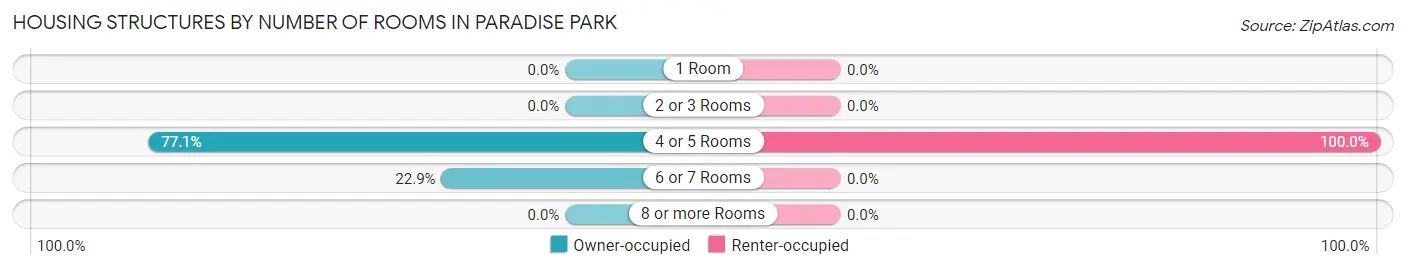
| Number of Rooms | Owner-occupied | Renter-occupied |
| 1 Room | 0 (0.0%) | 0 (0.0%) |
| 2 or 3 Rooms | 0 (0.0%) | 0 (0.0%) |
| 4 or 5 Rooms | 165 (77.1%) | 10 (100.0%) |
| 6 or 7 Rooms | 49 (22.9%) | 0 (0.0%) |
| 8 or more Rooms | 0 (0.0%) | 0 (0.0%) |
| Total | 214 (100.0%) | 10 (100.0%) |
Housing Structure by Heating Type in Paradise Park
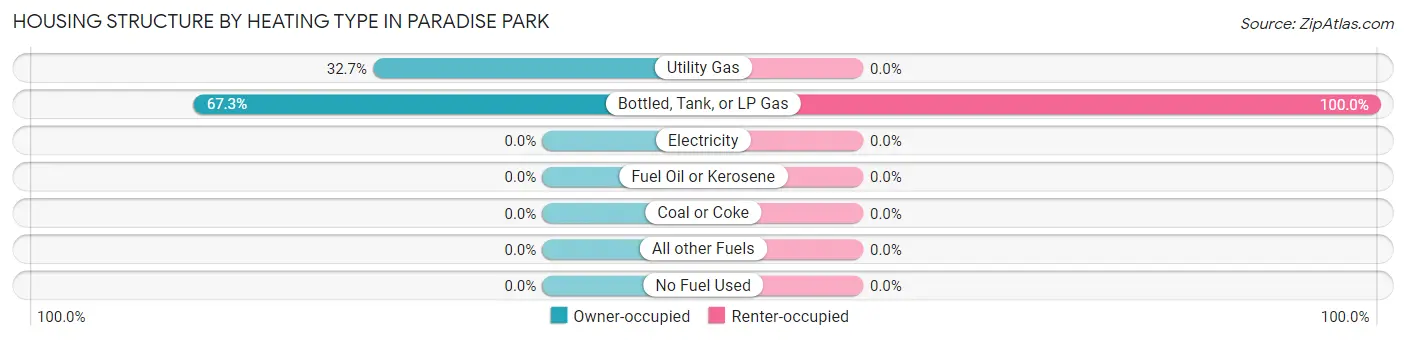
| Heating Type | Owner-occupied | Renter-occupied |
| Utility Gas | 70 (32.7%) | 0 (0.0%) |
| Bottled, Tank, or LP Gas | 144 (67.3%) | 10 (100.0%) |
| Electricity | 0 (0.0%) | 0 (0.0%) |
| Fuel Oil or Kerosene | 0 (0.0%) | 0 (0.0%) |
| Coal or Coke | 0 (0.0%) | 0 (0.0%) |
| All other Fuels | 0 (0.0%) | 0 (0.0%) |
| No Fuel Used | 0 (0.0%) | 0 (0.0%) |
| Total | 214 (100.0%) | 10 (100.0%) |
Household Vehicle Usage in Paradise Park
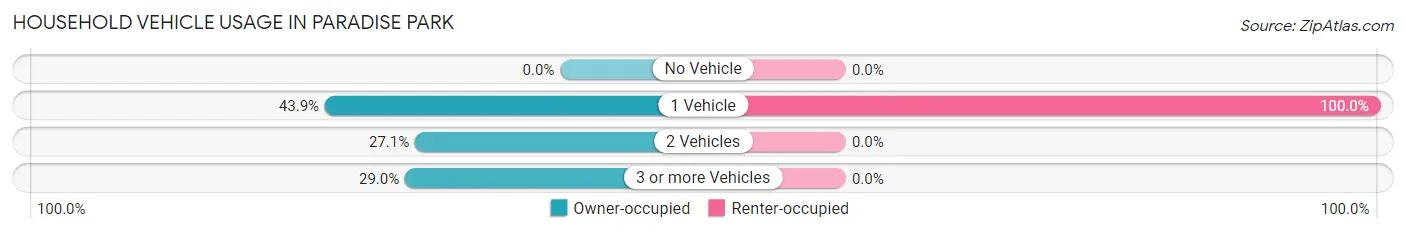
| Vehicles per Household | Owner-occupied | Renter-occupied |
| No Vehicle | 0 (0.0%) | 0 (0.0%) |
| 1 Vehicle | 94 (43.9%) | 10 (100.0%) |
| 2 Vehicles | 58 (27.1%) | 0 (0.0%) |
| 3 or more Vehicles | 62 (29.0%) | 0 (0.0%) |
| Total | 214 (100.0%) | 10 (100.0%) |
Real Estate & Mortgages in Paradise Park
Real Estate and Mortgage Overview in Paradise Park
| Characteristic | Without Mortgage | With Mortgage |
| Housing Units | 179 | 35 |
| Median Property Value | $397,800 | $0 |
| Median Household Income | $96,097 | $0 |
| Monthly Housing Costs | $641 | $35 |
| Real Estate Taxes | $2,653 | $0 |
Property Value by Mortgage Status in Paradise Park
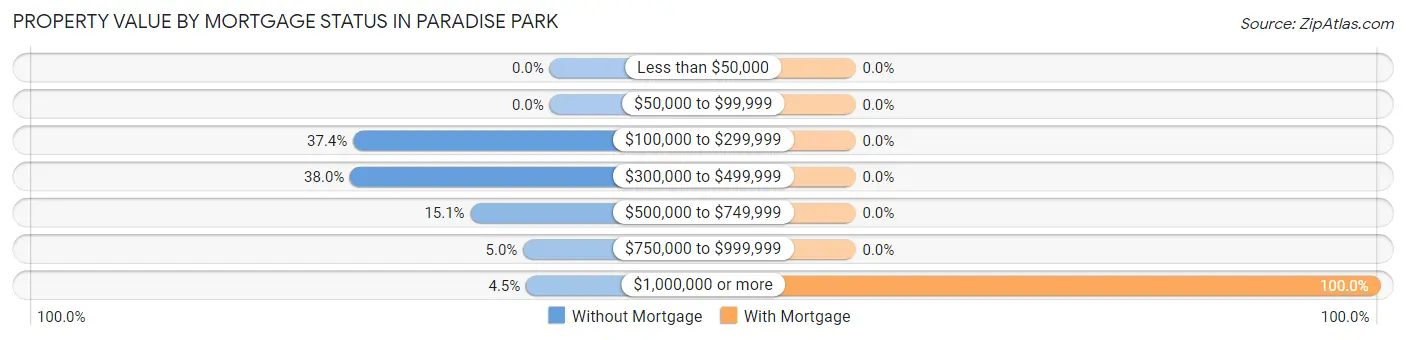
| Property Value | Without Mortgage | With Mortgage |
| Less than $50,000 | 0 (0.0%) | 0 (0.0%) |
| $50,000 to $99,999 | 0 (0.0%) | 0 (0.0%) |
| $100,000 to $299,999 | 67 (37.4%) | 0 (0.0%) |
| $300,000 to $499,999 | 68 (38.0%) | 0 (0.0%) |
| $500,000 to $749,999 | 27 (15.1%) | 0 (0.0%) |
| $750,000 to $999,999 | 9 (5.0%) | 0 (0.0%) |
| $1,000,000 or more | 8 (4.5%) | 35 (100.0%) |
| Total | 179 (100.0%) | 35 (100.0%) |
Household Income by Mortgage Status in Paradise Park
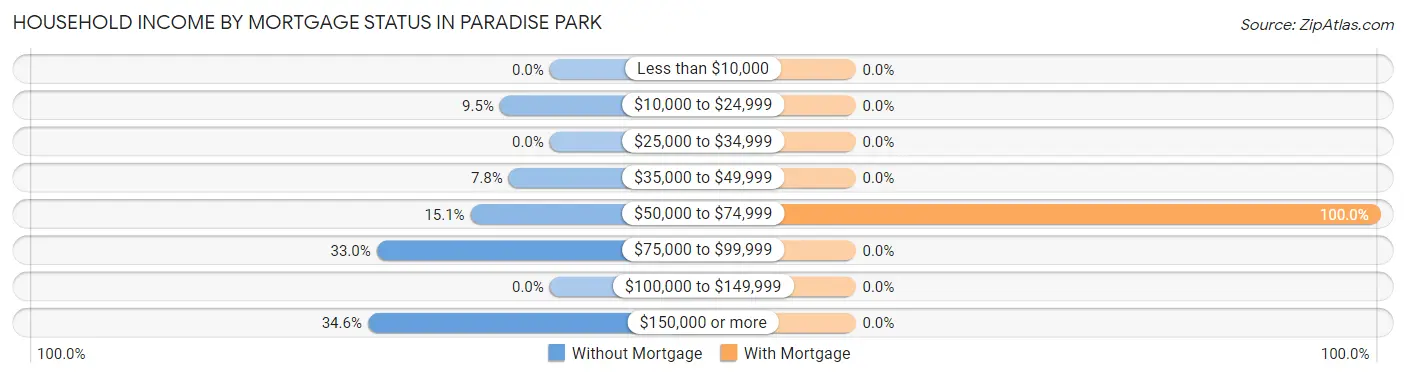
| Household Income | Without Mortgage | With Mortgage |
| Less than $10,000 | 0 (0.0%) | 0 (0.0%) |
| $10,000 to $24,999 | 17 (9.5%) | 0 (0.0%) |
| $25,000 to $34,999 | 0 (0.0%) | 0 (0.0%) |
| $35,000 to $49,999 | 14 (7.8%) | 0 (0.0%) |
| $50,000 to $74,999 | 27 (15.1%) | 35 (100.0%) |
| $75,000 to $99,999 | 59 (33.0%) | 0 (0.0%) |
| $100,000 to $149,999 | 0 (0.0%) | 0 (0.0%) |
| $150,000 or more | 62 (34.6%) | 0 (0.0%) |
| Total | 179 (100.0%) | 35 (100.0%) |
Property Value to Household Income Ratio in Paradise Park
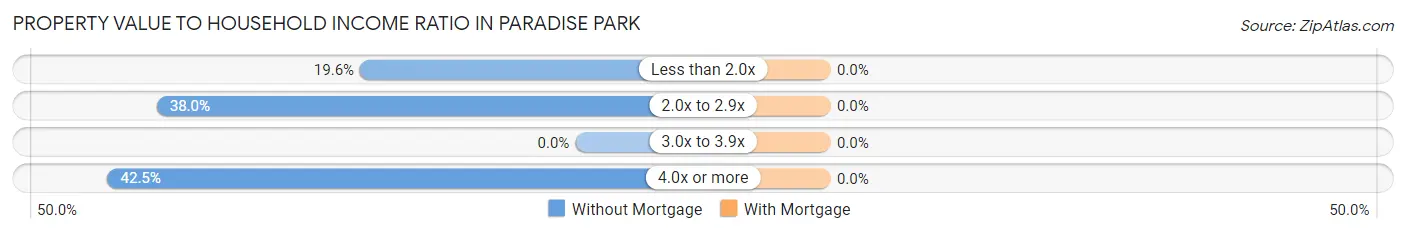
| Value-to-Income Ratio | Without Mortgage | With Mortgage |
| Less than 2.0x | 35 (19.6%) | 0 (0.0%) |
| 2.0x to 2.9x | 68 (38.0%) | 0 (0.0%) |
| 3.0x to 3.9x | 0 (0.0%) | 0 (0.0%) |
| 4.0x or more | 76 (42.5%) | 0 (0.0%) |
| Total | 179 (100.0%) | 35 (100.0%) |
Real Estate Taxes by Mortgage Status in Paradise Park
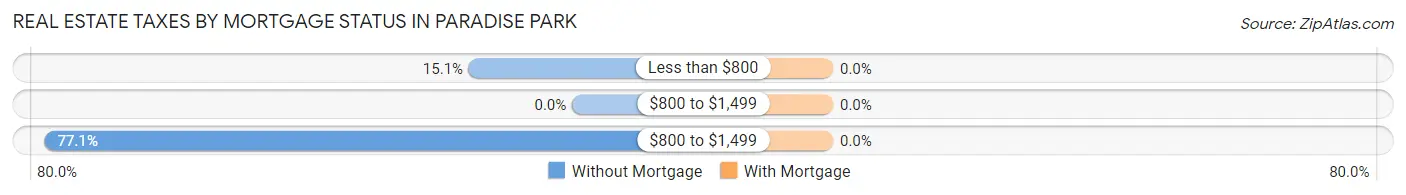
| Property Taxes | Without Mortgage | With Mortgage |
| Less than $800 | 27 (15.1%) | 0 (0.0%) |
| $800 to $1,499 | 0 (0.0%) | 0 (0.0%) |
| $800 to $1,499 | 138 (77.1%) | 0 (0.0%) |
| Total | 179 (100.0%) | 35 (100.0%) |
Health & Disability in Paradise Park
Health Insurance Coverage by Age in Paradise Park
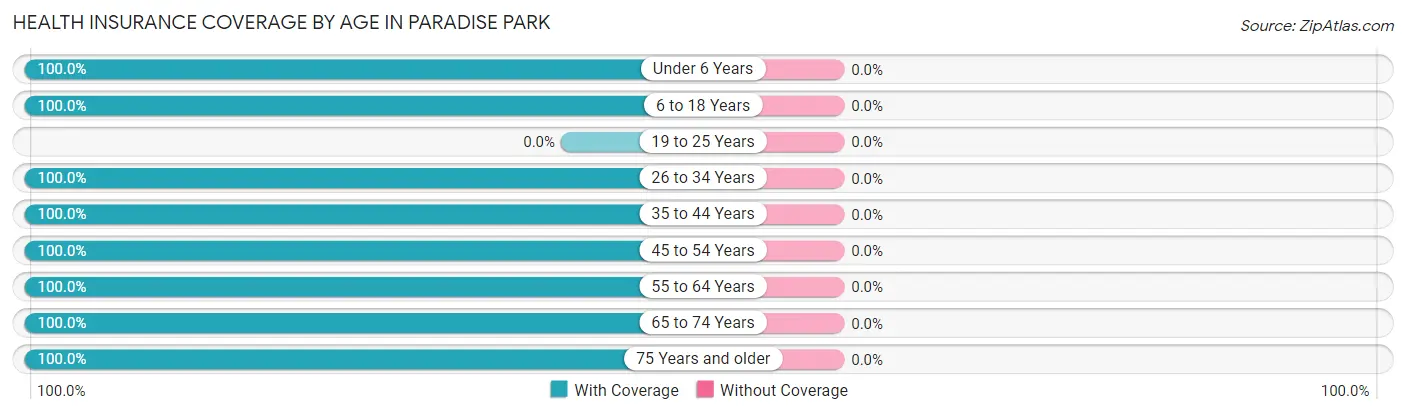
| Age Bracket | With Coverage | Without Coverage |
| Under 6 Years | 62 (100.0%) | 0 (0.0%) |
| 6 to 18 Years | 37 (100.0%) | 0 (0.0%) |
| 19 to 25 Years | 0 (0.0%) | 0 (0.0%) |
| 26 to 34 Years | 86 (100.0%) | 0 (0.0%) |
| 35 to 44 Years | 84 (100.0%) | 0 (0.0%) |
| 45 to 54 Years | 10 (100.0%) | 0 (0.0%) |
| 55 to 64 Years | 52 (100.0%) | 0 (0.0%) |
| 65 to 74 Years | 154 (100.0%) | 0 (0.0%) |
| 75 Years and older | 53 (100.0%) | 0 (0.0%) |
| Total | 538 (100.0%) | 0 (0.0%) |
Health Insurance Coverage by Citizenship Status in Paradise Park
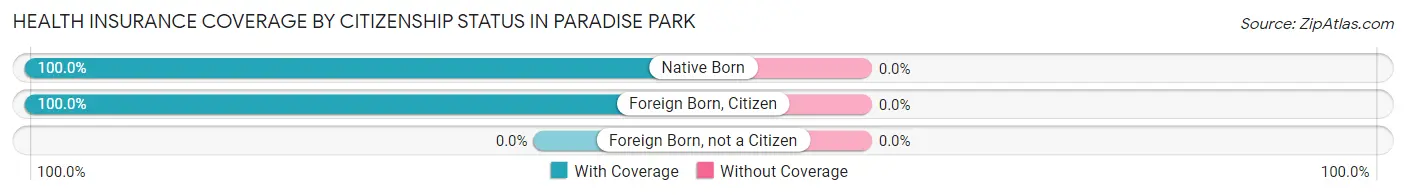
| Citizenship Status | With Coverage | Without Coverage |
| Native Born | 62 (100.0%) | 0 (0.0%) |
| Foreign Born, Citizen | 37 (100.0%) | 0 (0.0%) |
| Foreign Born, not a Citizen | 0 (0.0%) | 0 (0.0%) |
Health Insurance Coverage by Household Income in Paradise Park
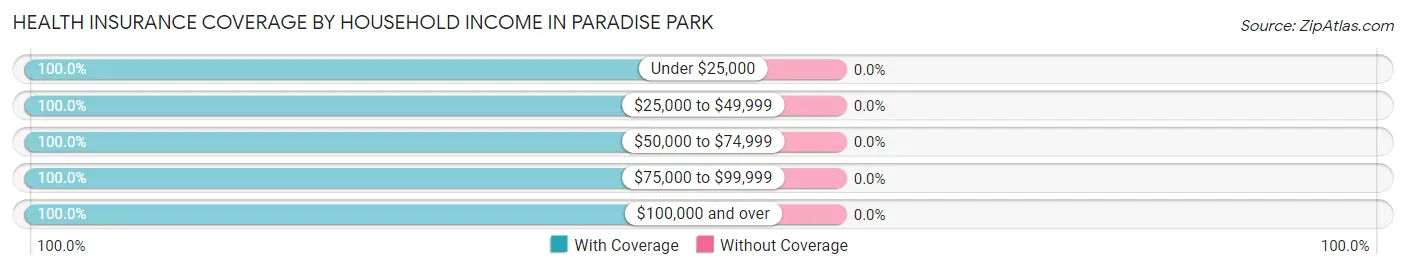
| Household Income | With Coverage | Without Coverage |
| Under $25,000 | 46 (100.0%) | 0 (0.0%) |
| $25,000 to $49,999 | 49 (100.0%) | 0 (0.0%) |
| $50,000 to $74,999 | 27 (100.0%) | 0 (0.0%) |
| $75,000 to $99,999 | 138 (100.0%) | 0 (0.0%) |
| $100,000 and over | 278 (100.0%) | 0 (0.0%) |
Public vs Private Health Insurance Coverage by Age in Paradise Park
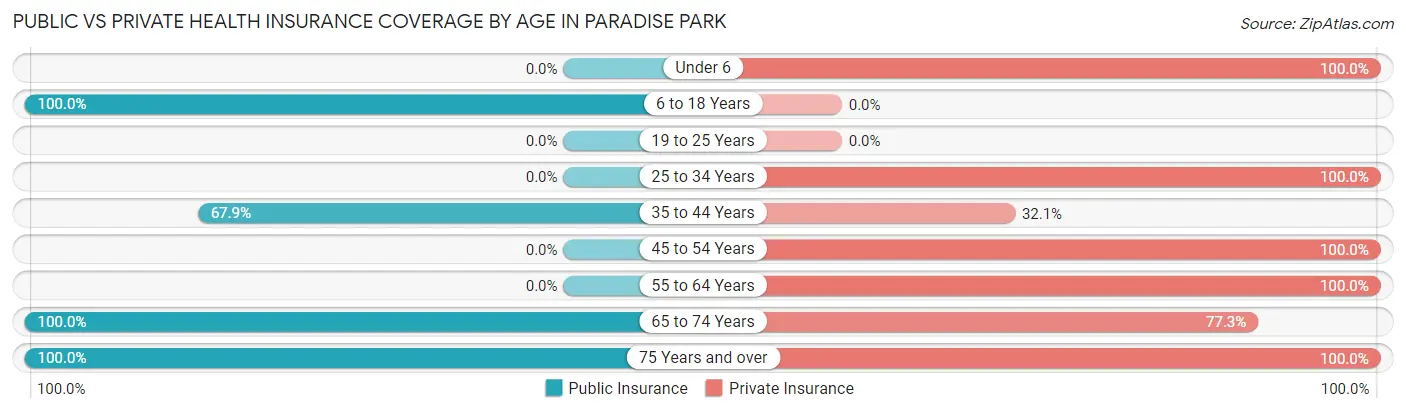
| Age Bracket | Public Insurance | Private Insurance |
| Under 6 | 0 (0.0%) | 62 (100.0%) |
| 6 to 18 Years | 37 (100.0%) | 0 (0.0%) |
| 19 to 25 Years | 0 (0.0%) | 0 (0.0%) |
| 25 to 34 Years | 0 (0.0%) | 86 (100.0%) |
| 35 to 44 Years | 57 (67.9%) | 27 (32.1%) |
| 45 to 54 Years | 0 (0.0%) | 10 (100.0%) |
| 55 to 64 Years | 0 (0.0%) | 52 (100.0%) |
| 65 to 74 Years | 154 (100.0%) | 119 (77.3%) |
| 75 Years and over | 53 (100.0%) | 53 (100.0%) |
| Total | 301 (55.9%) | 409 (76.0%) |
Disability Status by Sex by Age in Paradise Park
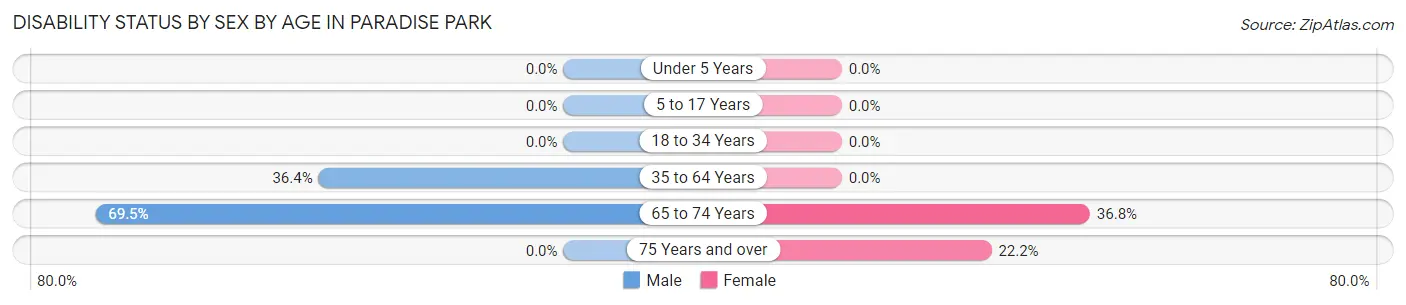
| Age Bracket | Male | Female |
| Under 5 Years | 0 (0.0%) | 0 (0.0%) |
| 5 to 17 Years | 0 (0.0%) | 0 (0.0%) |
| 18 to 34 Years | 0 (0.0%) | 0 (0.0%) |
| 35 to 64 Years | 36 (36.4%) | 0 (0.0%) |
| 65 to 74 Years | 41 (69.5%) | 35 (36.8%) |
| 75 Years and over | 0 (0.0%) | 10 (22.2%) |
Disability Class by Sex by Age in Paradise Park
Disability Class: Hearing Difficulty
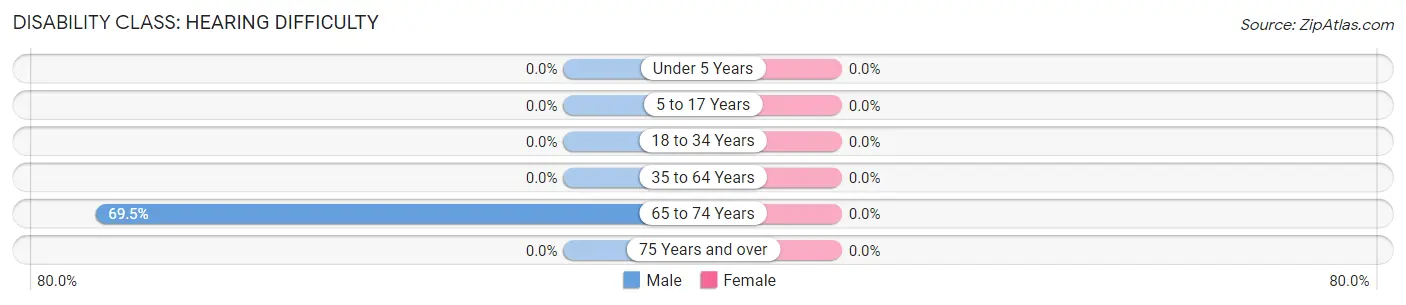
| Age Bracket | Male | Female |
| Under 5 Years | 0 (0.0%) | 0 (0.0%) |
| 5 to 17 Years | 0 (0.0%) | 0 (0.0%) |
| 18 to 34 Years | 0 (0.0%) | 0 (0.0%) |
| 35 to 64 Years | 0 (0.0%) | 0 (0.0%) |
| 65 to 74 Years | 41 (69.5%) | 0 (0.0%) |
| 75 Years and over | 0 (0.0%) | 0 (0.0%) |
Disability Class: Vision Difficulty
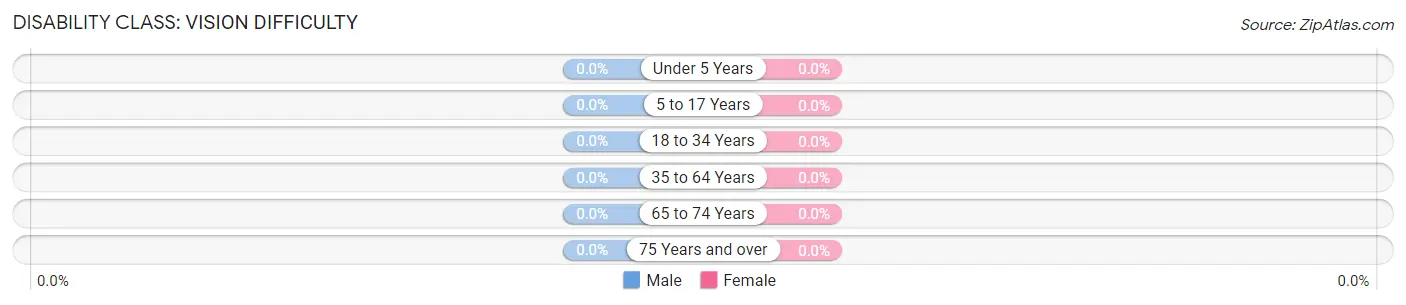
| Age Bracket | Male | Female |
| Under 5 Years | 0 (0.0%) | 0 (0.0%) |
| 5 to 17 Years | 0 (0.0%) | 0 (0.0%) |
| 18 to 34 Years | 0 (0.0%) | 0 (0.0%) |
| 35 to 64 Years | 0 (0.0%) | 0 (0.0%) |
| 65 to 74 Years | 0 (0.0%) | 0 (0.0%) |
| 75 Years and over | 0 (0.0%) | 0 (0.0%) |
Disability Class: Cognitive Difficulty
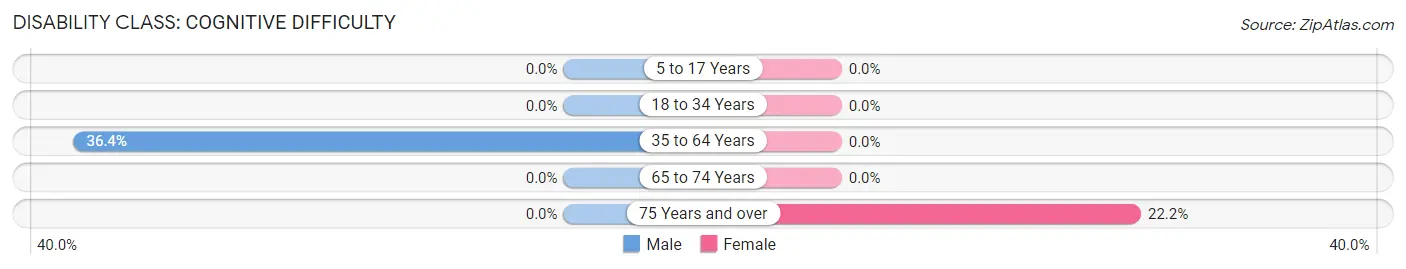
| Age Bracket | Male | Female |
| 5 to 17 Years | 0 (0.0%) | 0 (0.0%) |
| 18 to 34 Years | 0 (0.0%) | 0 (0.0%) |
| 35 to 64 Years | 36 (36.4%) | 0 (0.0%) |
| 65 to 74 Years | 0 (0.0%) | 0 (0.0%) |
| 75 Years and over | 0 (0.0%) | 10 (22.2%) |
Disability Class: Ambulatory Difficulty
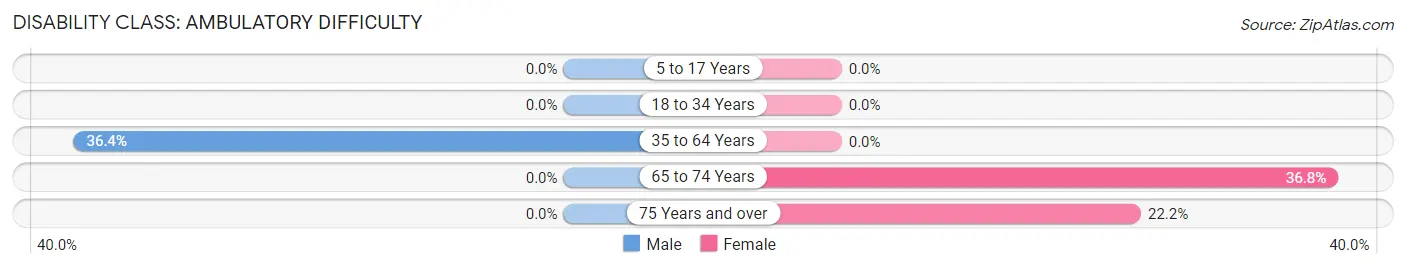
| Age Bracket | Male | Female |
| 5 to 17 Years | 0 (0.0%) | 0 (0.0%) |
| 18 to 34 Years | 0 (0.0%) | 0 (0.0%) |
| 35 to 64 Years | 36 (36.4%) | 0 (0.0%) |
| 65 to 74 Years | 0 (0.0%) | 35 (36.8%) |
| 75 Years and over | 0 (0.0%) | 10 (22.2%) |
Disability Class: Self-Care Difficulty
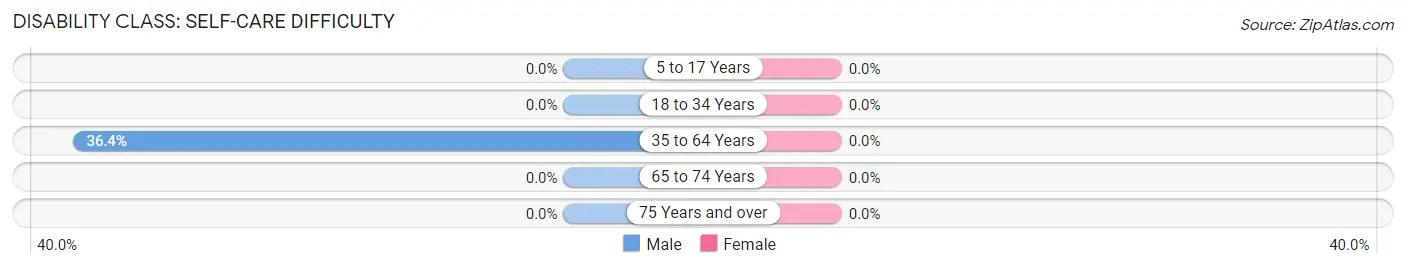
| Age Bracket | Male | Female |
| 5 to 17 Years | 0 (0.0%) | 0 (0.0%) |
| 18 to 34 Years | 0 (0.0%) | 0 (0.0%) |
| 35 to 64 Years | 36 (36.4%) | 0 (0.0%) |
| 65 to 74 Years | 0 (0.0%) | 0 (0.0%) |
| 75 Years and over | 0 (0.0%) | 0 (0.0%) |
Technology Access in Paradise Park
Computing Device Access in Paradise Park
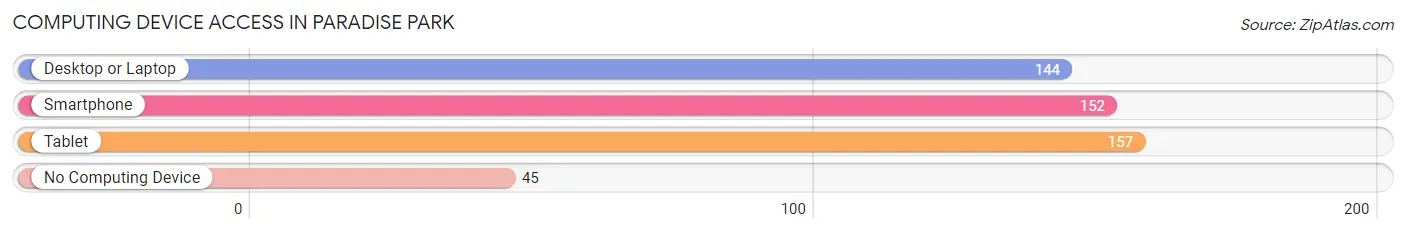
| Device Type | # Households | % Households |
| Desktop or Laptop | 144 | 64.3% |
| Smartphone | 152 | 67.9% |
| Tablet | 157 | 70.1% |
| No Computing Device | 45 | 20.1% |
| Total | 224 | 100.0% |
Internet Access in Paradise Park
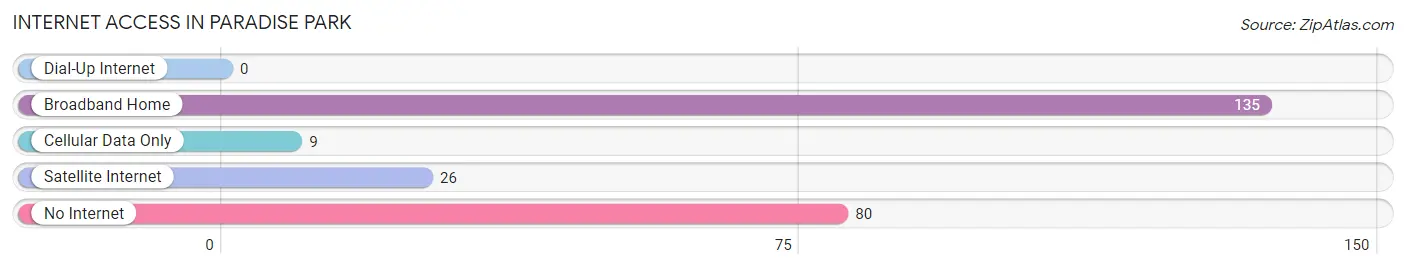
| Internet Type | # Households | % Households |
| Dial-Up Internet | 0 | 0.0% |
| Broadband Home | 135 | 60.3% |
| Cellular Data Only | 9 | 4.0% |
| Satellite Internet | 26 | 11.6% |
| No Internet | 80 | 35.7% |
| Total | 224 | 100.0% |
Paradise Park Summary
Paradise Park is a small unincorporated community located in the foothills of the Sierra Nevada Mountains in El Dorado County, California. It is situated approximately 25 miles east of Placerville and about 50 miles northeast of Sacramento. The community is surrounded by the Eldorado National Forest and is home to a population of approximately 1,000 people.
History
The area that is now known as Paradise Park was first settled in the late 1800s by miners and loggers who were drawn to the area by the abundance of natural resources. The first post office in the area was established in 1891 and the community was officially named Paradise Park in 1895.
In the early 1900s, the area began to attract tourists who were drawn to the area by its natural beauty and recreational opportunities. The first hotel in the area was built in 1906 and the first ski resort was established in the area in the 1920s.
In the 1950s, the area began to attract more permanent residents who were drawn to the area by its rural lifestyle and proximity to the Sierra Nevada Mountains. The population of the area has remained relatively stable since then, with the majority of the population being made up of retirees and families.
Geography
Paradise Park is located in the foothills of the Sierra Nevada Mountains in El Dorado County, California. The area is surrounded by the Eldorado National Forest and is home to a variety of wildlife, including deer, bears, and mountain lions. The area is also home to a variety of plant life, including pine, oak, and cedar trees.
The climate in the area is generally mild, with temperatures ranging from the mid-30s in the winter to the mid-90s in the summer. The area receives an average of 20 inches of precipitation per year, with most of it falling in the winter months.
Economy
The economy of Paradise Park is largely based on tourism and recreation. The area is home to several ski resorts, as well as a variety of outdoor activities such as hiking, camping, and fishing. The area is also home to several wineries and vineyards, as well as a variety of restaurants and shops.
The area is also home to a variety of businesses, including a lumber mill, a sawmill, and a variety of small businesses. The area is also home to a number of small farms and ranches, as well as a variety of service-based businesses.
Demographics
As of the 2010 census, the population of Paradise Park was 1,000 people. The racial makeup of the area was 94.2% White, 0.7% African American, 0.7% Native American, 0.7% Asian, 0.3% Pacific Islander, and 3.1% from other races. The median household income in the area was $50,000, and the median age was 44.
The area is home to a variety of religious denominations, including Catholic, Protestant, and Mormon. The area is also home to a variety of recreational activities, including skiing, hiking, camping, and fishing. The area is also home to a variety of cultural events, including the annual Paradise Park Music Festival.
Common Questions
What is Per Capita Income in Paradise Park?
Per Capita income in Paradise Park is $38,802.
What is the Median Household income in Paradise Park?
Median Household Income in Paradise Park is $94,750.
What is Inequality or Gini Index in Paradise Park?
Inequality or Gini Index in Paradise Park is 0.34.
What is the Total Population of Paradise Park?
Total Population of Paradise Park is 538.
What is the Total Male Population of Paradise Park?
Total Male Population of Paradise Park is 300.
What is the Total Female Population of Paradise Park?
Total Female Population of Paradise Park is 238.
What is the Ratio of Males per 100 Females in Paradise Park?
There are 126.05 Males per 100 Females in Paradise Park.
What is the Ratio of Females per 100 Males in Paradise Park?
There are 79.33 Females per 100 Males in Paradise Park.
What is the Median Population Age in Paradise Park?
Median Population Age in Paradise Park is 46.5 Years.
What is the Average Family Size in Paradise Park
Average Family Size in Paradise Park is 3.5 People.
What is the Average Household Size in Paradise Park
Average Household Size in Paradise Park is 2.4 People.
How Large is the Labor Force in Paradise Park?
There are 200 People in the Labor Forcein in Paradise Park.
What is the Percentage of People in the Labor Force in Paradise Park?
45.6% of People are in the Labor Force in Paradise Park.
What is the Unemployment Rate in Paradise Park?
Unemployment Rate in Paradise Park is 9.0%.