Searles Valley, CA Map & Demographics
Searles Valley Map
Searles Valley Overview
$24,522
PER CAPITA INCOME
$66,094
AVG FAMILY INCOME
$54,013
AVG HOUSEHOLD INCOME
47.5%
WAGE / INCOME GAP [ % ]
52.5¢/ $1
WAGE / INCOME GAP [ $ ]
$8,792
FAMILY INCOME DEFICIT
0.43
INEQUALITY / GINI INDEX
1,716
TOTAL POPULATION
1,012
MALE POPULATION
704
FEMALE POPULATION
143.75
MALES / 100 FEMALES
69.57
FEMALES / 100 MALES
35.9
MEDIAN AGE
3.2
AVG FAMILY SIZE
2.6
AVG HOUSEHOLD SIZE
604
LABOR FORCE [ PEOPLE ]
49.6%
PERCENT IN LABOR FORCE
8.9%
UNEMPLOYMENT RATE
Income in Searles Valley
Income Overview in Searles Valley
Per Capita Income in Searles Valley is $24,522, while median incomes of families and households are $66,094 and $54,013 respectively.
| Characteristic | Number | Measure |
| Per Capita Income | 1,716 | $24,522 |
| Median Family Income | 443 | $66,094 |
| Mean Family Income | 443 | $74,007 |
| Median Household Income | 653 | $54,013 |
| Mean Household Income | 653 | $63,704 |
| Income Deficit | 443 | $8,792 |
| Wage / Income Gap (%) | 1,716 | 47.55% |
| Wage / Income Gap ($) | 1,716 | 52.45¢ per $1 |
| Gini / Inequality Index | 1,716 | 0.43 |
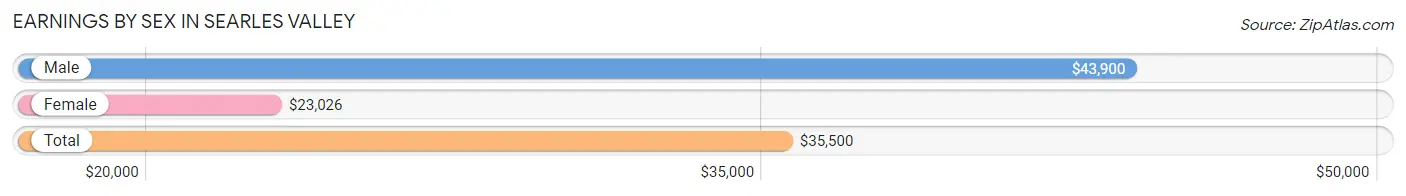
Earnings by Sex in Searles Valley
Average Earnings in Searles Valley are $35,500, $43,900 for men and $23,026 for women, a difference of 47.5%.
| Sex | Number | Average Earnings |
| Male | 354 (56.4%) | $43,900 |
| Female | 274 (43.6%) | $23,026 |
| Total | 628 (100.0%) | $35,500 |
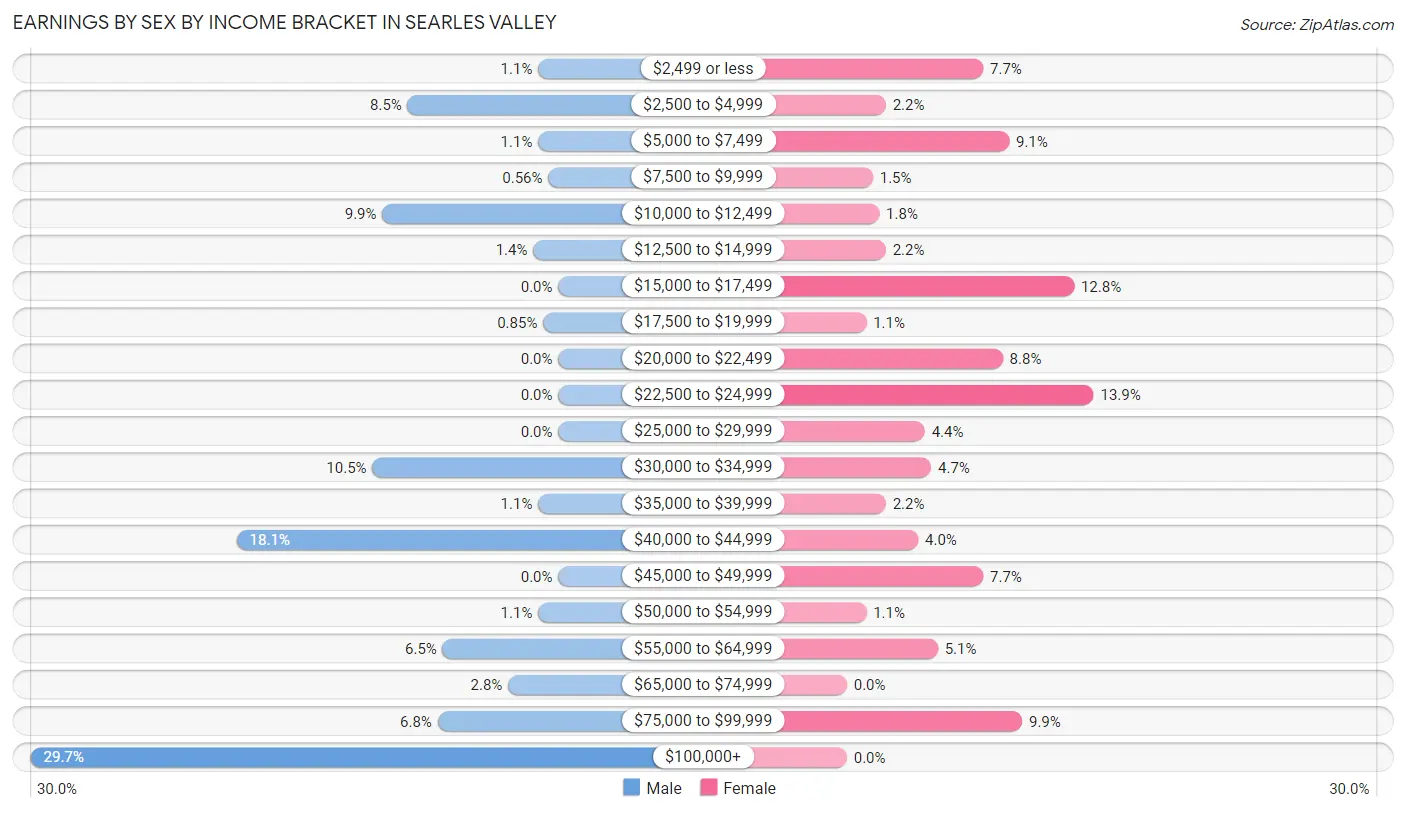
Earnings by Sex by Income Bracket in Searles Valley
The most common earnings brackets in Searles Valley are $100,000+ for men (105 | 29.7%) and $22,500 to $24,999 for women (38 | 13.9%).
| Income | Male | Female |
| $2,499 or less | 4 (1.1%) | 21 (7.7%) |
| $2,500 to $4,999 | 30 (8.5%) | 6 (2.2%) |
| $5,000 to $7,499 | 4 (1.1%) | 25 (9.1%) |
| $7,500 to $9,999 | 2 (0.6%) | 4 (1.5%) |
| $10,000 to $12,499 | 35 (9.9%) | 5 (1.8%) |
| $12,500 to $14,999 | 5 (1.4%) | 6 (2.2%) |
| $15,000 to $17,499 | 0 (0.0%) | 35 (12.8%) |
| $17,500 to $19,999 | 3 (0.9%) | 3 (1.1%) |
| $20,000 to $22,499 | 0 (0.0%) | 24 (8.8%) |
| $22,500 to $24,999 | 0 (0.0%) | 38 (13.9%) |
| $25,000 to $29,999 | 0 (0.0%) | 12 (4.4%) |
| $30,000 to $34,999 | 37 (10.4%) | 13 (4.7%) |
| $35,000 to $39,999 | 4 (1.1%) | 6 (2.2%) |
| $40,000 to $44,999 | 64 (18.1%) | 11 (4.0%) |
| $45,000 to $49,999 | 0 (0.0%) | 21 (7.7%) |
| $50,000 to $54,999 | 4 (1.1%) | 3 (1.1%) |
| $55,000 to $64,999 | 23 (6.5%) | 14 (5.1%) |
| $65,000 to $74,999 | 10 (2.8%) | 0 (0.0%) |
| $75,000 to $99,999 | 24 (6.8%) | 27 (9.9%) |
| $100,000+ | 105 (29.7%) | 0 (0.0%) |
| Total | 354 (100.0%) | 274 (100.0%) |
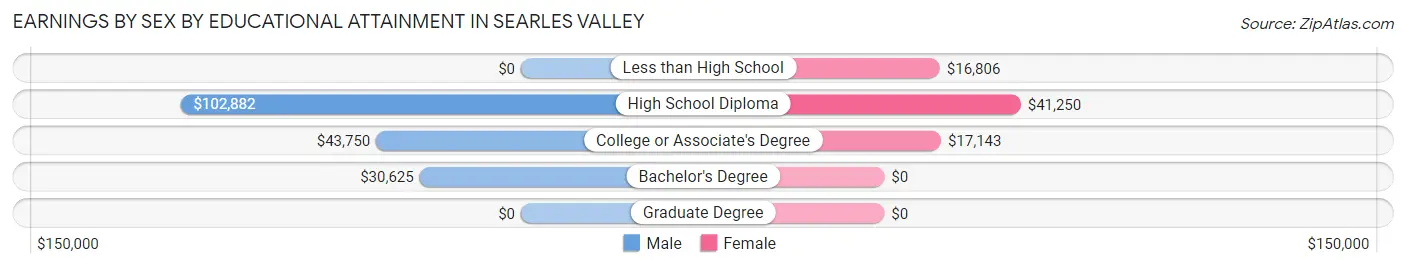
Earnings by Sex by Educational Attainment in Searles Valley
Average earnings in Searles Valley are $44,400 for men and $23,750 for women, a difference of 46.5%. Men with an educational attainment of high school diploma enjoy the highest average annual earnings of $102,882, while those with bachelor's degree education earn the least with $30,625. Women with an educational attainment of high school diploma earn the most with the average annual earnings of $41,250, while those with less than high school education have the smallest earnings of $16,806.
| Educational Attainment | Male Income | Female Income |
| Less than High School | - | - |
| High School Diploma | $102,882 | $41,250 |
| College or Associate's Degree | $43,750 | $17,143 |
| Bachelor's Degree | $30,625 | $0 |
| Graduate Degree | - | - |
| Total | $44,400 | $23,750 |
Family Income in Searles Valley
Family Income Brackets in Searles Valley
According to the Searles Valley family income data, there are 98 families falling into the $50,000 to $74,999 income range, which is the most common income bracket and makes up 22.1% of all families. Conversely, the $200,000+ income bracket is the least frequent group with only 6 families (1.3%) belonging to this category.
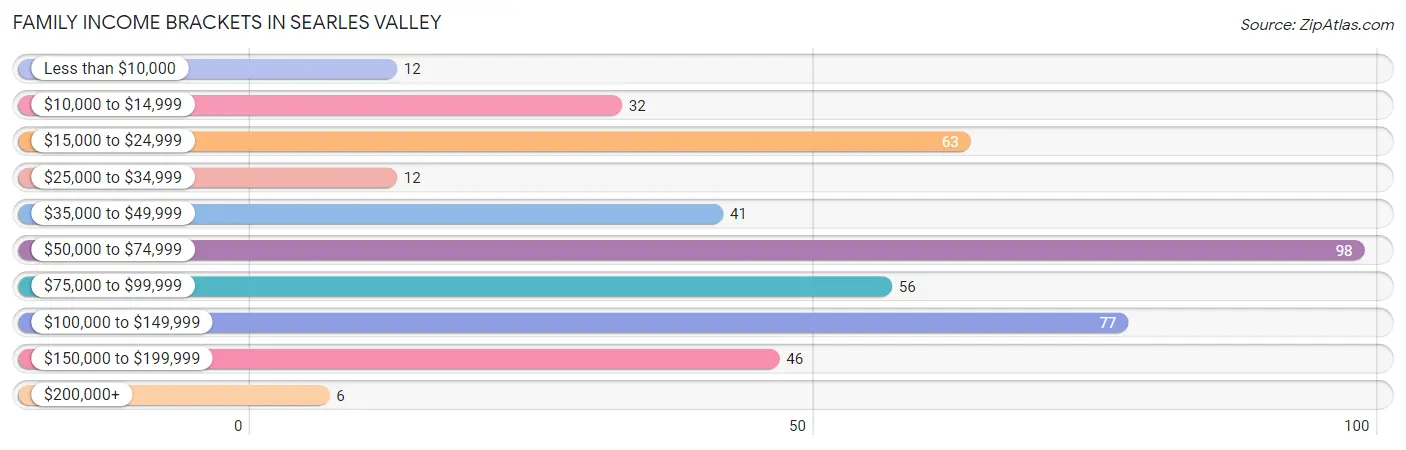
| Income Bracket | # Families | % Families |
| Less than $10,000 | 12 | 2.7% |
| $10,000 to $14,999 | 32 | 7.2% |
| $15,000 to $24,999 | 63 | 14.2% |
| $25,000 to $34,999 | 12 | 2.7% |
| $35,000 to $49,999 | 41 | 9.3% |
| $50,000 to $74,999 | 98 | 22.1% |
| $75,000 to $99,999 | 56 | 12.6% |
| $100,000 to $149,999 | 77 | 17.4% |
| $150,000 to $199,999 | 46 | 10.4% |
| $200,000+ | 6 | 1.4% |
Family Income by Famaliy Size in Searles Valley
4-person families (54 | 12.2%) account for the highest median family income in Searles Valley with $103,542 per family, while 3-person families (90 | 20.3%) have the highest median income of $32,813 per family member.
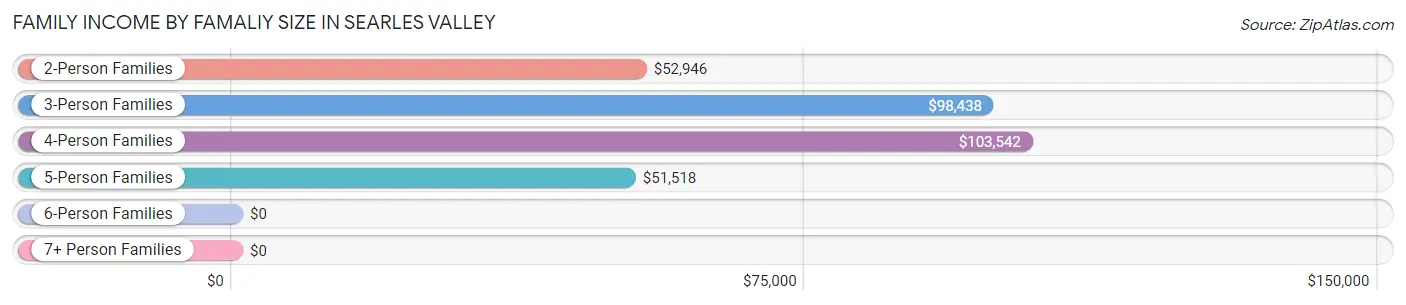
| Income Bracket | # Families | Median Income |
| 2-Person Families | 229 (51.7%) | $52,946 |
| 3-Person Families | 90 (20.3%) | $98,438 |
| 4-Person Families | 54 (12.2%) | $103,542 |
| 5-Person Families | 33 (7.4%) | $51,518 |
| 6-Person Families | 20 (4.5%) | $0 |
| 7+ Person Families | 17 (3.8%) | $0 |
| Total | 443 (100.0%) | $66,094 |
Family Income by Number of Earners in Searles Valley
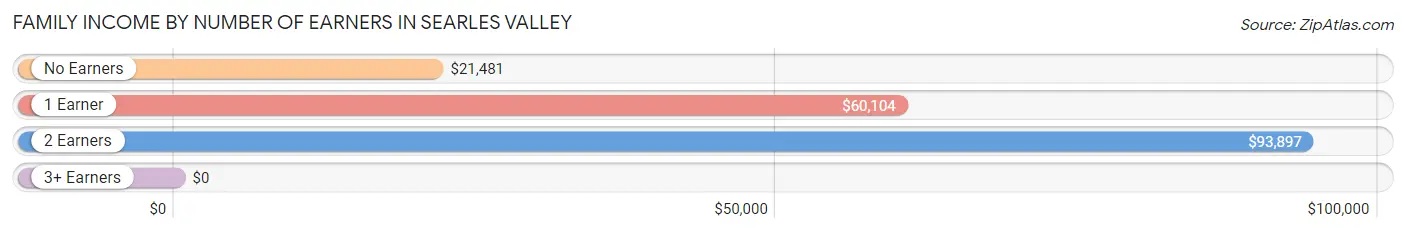
| Number of Earners | # Families | Median Income |
| No Earners | 102 (23.0%) | $21,481 |
| 1 Earner | 203 (45.8%) | $60,104 |
| 2 Earners | 117 (26.4%) | $93,897 |
| 3+ Earners | 21 (4.7%) | $0 |
| Total | 443 (100.0%) | $66,094 |
Household Income in Searles Valley
Household Income Brackets in Searles Valley
With 146 households falling in the category, the $50,000 to $74,999 income range is the most frequent in Searles Valley, accounting for 22.4% of all households. In contrast, only 6 households (0.9%) fall into the $200,000+ income bracket, making it the least populous group.
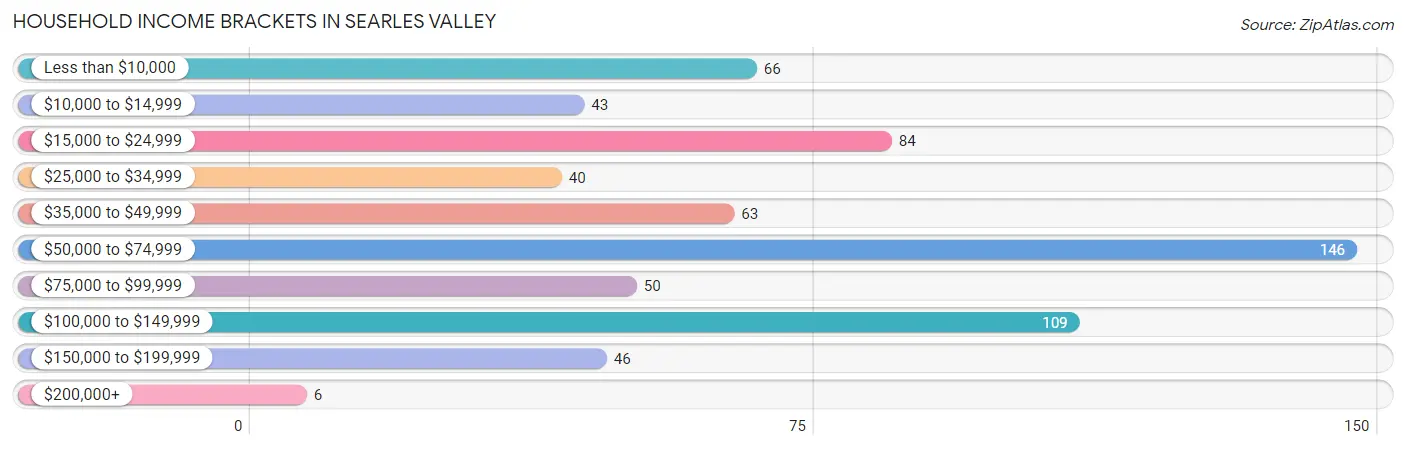
| Income Bracket | # Households | % Households |
| Less than $10,000 | 66 | 10.1% |
| $10,000 to $14,999 | 43 | 6.6% |
| $15,000 to $24,999 | 84 | 12.9% |
| $25,000 to $34,999 | 40 | 6.1% |
| $35,000 to $49,999 | 63 | 9.6% |
| $50,000 to $74,999 | 146 | 22.4% |
| $75,000 to $99,999 | 50 | 7.7% |
| $100,000 to $149,999 | 109 | 16.7% |
| $150,000 to $199,999 | 46 | 7.0% |
| $200,000+ | 6 | 0.9% |
Household Income by Householder Age in Searles Valley
The median household income in Searles Valley is $54,013, with the highest median household income of $61,976 found in the 25 to 44 years age bracket for the primary householder. A total of 217 households (33.2%) fall into this category. Meanwhile, the 15 to 24 years age bracket for the primary householder has the lowest median household income of $0, with 48 households (7.3%) in this group.
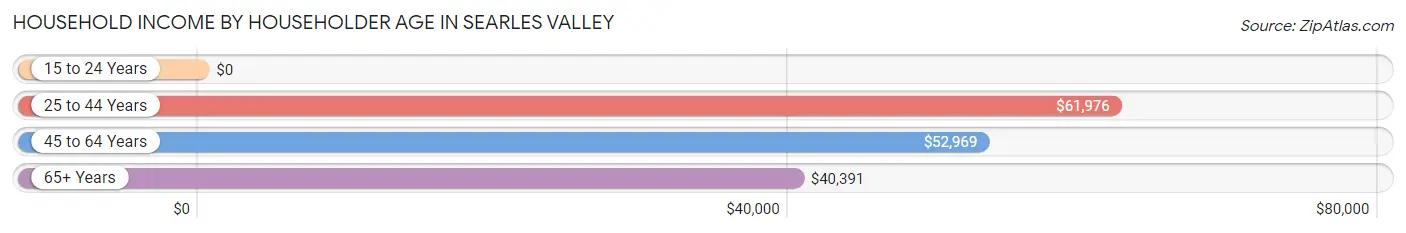
| Income Bracket | # Households | Median Income |
| 15 to 24 Years | 48 (7.3%) | $0 |
| 25 to 44 Years | 217 (33.2%) | $61,976 |
| 45 to 64 Years | 245 (37.5%) | $52,969 |
| 65+ Years | 143 (21.9%) | $40,391 |
| Total | 653 (100.0%) | $54,013 |
Poverty in Searles Valley
Income Below Poverty by Sex and Age in Searles Valley
With 19.0% poverty level for males and 20.9% for females among the residents of Searles Valley, under 5 year old males and 5 year old females are the most vulnerable to poverty, with 29 males (35.4%) and 5 females (100.0%) in their respective age groups living below the poverty level.
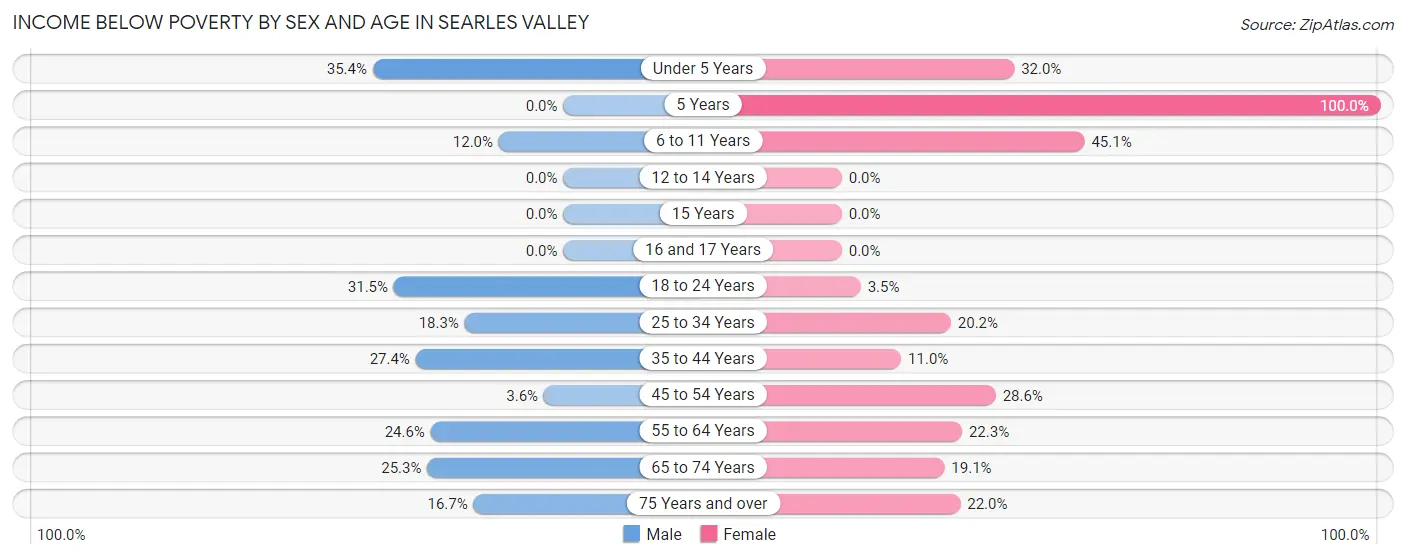
| Age Bracket | Male | Female |
| Under 5 Years | 29 (35.4%) | 8 (32.0%) |
| 5 Years | 0 (0.0%) | 5 (100.0%) |
| 6 to 11 Years | 17 (12.0%) | 41 (45.1%) |
| 12 to 14 Years | 0 (0.0%) | 0 (0.0%) |
| 15 Years | 0 (0.0%) | 0 (0.0%) |
| 16 and 17 Years | 0 (0.0%) | 0 (0.0%) |
| 18 to 24 Years | 28 (31.5%) | 2 (3.5%) |
| 25 to 34 Years | 13 (18.3%) | 17 (20.2%) |
| 35 to 44 Years | 37 (27.4%) | 14 (11.0%) |
| 45 to 54 Years | 3 (3.6%) | 12 (28.6%) |
| 55 to 64 Years | 32 (24.6%) | 29 (22.3%) |
| 65 to 74 Years | 24 (25.3%) | 8 (19.1%) |
| 75 Years and over | 7 (16.7%) | 11 (22.0%) |
| Total | 190 (19.0%) | 147 (20.9%) |
Income Above Poverty by Sex and Age in Searles Valley
According to the poverty statistics in Searles Valley, males aged 12 to 14 years and females aged 12 to 14 years are the age groups that are most secure financially, with 100.0% of males and 100.0% of females in these age groups living above the poverty line.
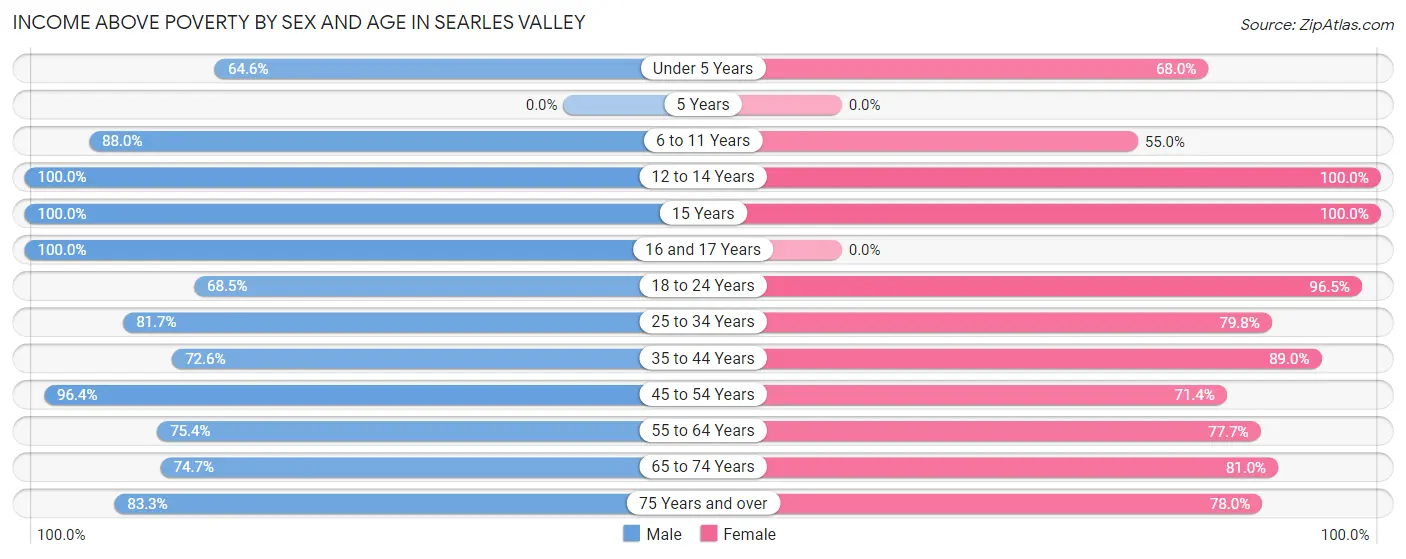
| Age Bracket | Male | Female |
| Under 5 Years | 53 (64.6%) | 17 (68.0%) |
| 5 Years | 0 (0.0%) | 0 (0.0%) |
| 6 to 11 Years | 125 (88.0%) | 50 (54.9%) |
| 12 to 14 Years | 64 (100.0%) | 38 (100.0%) |
| 15 Years | 28 (100.0%) | 13 (100.0%) |
| 16 and 17 Years | 41 (100.0%) | 0 (0.0%) |
| 18 to 24 Years | 61 (68.5%) | 55 (96.5%) |
| 25 to 34 Years | 58 (81.7%) | 67 (79.8%) |
| 35 to 44 Years | 98 (72.6%) | 113 (89.0%) |
| 45 to 54 Years | 80 (96.4%) | 30 (71.4%) |
| 55 to 64 Years | 98 (75.4%) | 101 (77.7%) |
| 65 to 74 Years | 71 (74.7%) | 34 (80.9%) |
| 75 Years and over | 35 (83.3%) | 39 (78.0%) |
| Total | 812 (81.0%) | 557 (79.1%) |
Income Below Poverty Among Married-Couple Families in Searles Valley
The poverty statistics for married-couple families in Searles Valley show that 10.2% or 34 of the total 335 families live below the poverty line. Families with no children have the highest poverty rate of 15.5%, comprising of 32 families. On the other hand, families with 3 or 4 children have the lowest poverty rate of 0.0%, which includes 0 families.
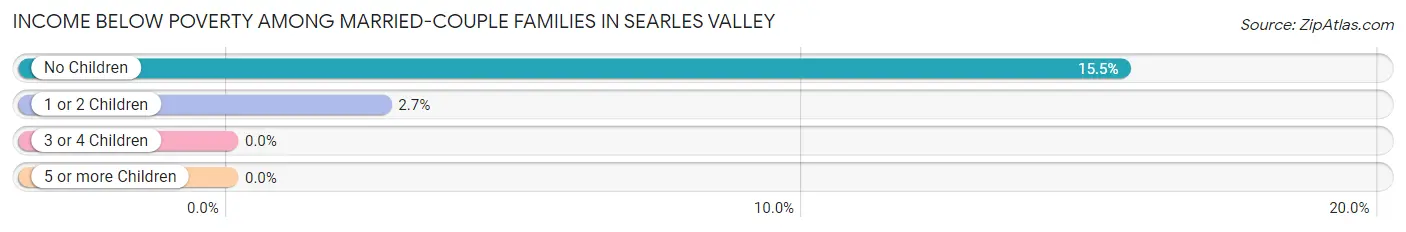
| Children | Above Poverty | Below Poverty |
| No Children | 174 (84.5%) | 32 (15.5%) |
| 1 or 2 Children | 73 (97.3%) | 2 (2.7%) |
| 3 or 4 Children | 37 (100.0%) | 0 (0.0%) |
| 5 or more Children | 17 (100.0%) | 0 (0.0%) |
| Total | 301 (89.8%) | 34 (10.2%) |
Income Below Poverty Among Single-Parent Households in Searles Valley
According to the poverty data in Searles Valley, 36.9% or 24 single-father households and 32.6% or 14 single-mother households are living below the poverty line. Among single-father households, those with 5 or more children have the highest poverty rate, with 8 households (100.0%) experiencing poverty. Likewise, among single-mother households, those with 1 or 2 children have the highest poverty rate, with 6 households (33.3%) falling below the poverty line.
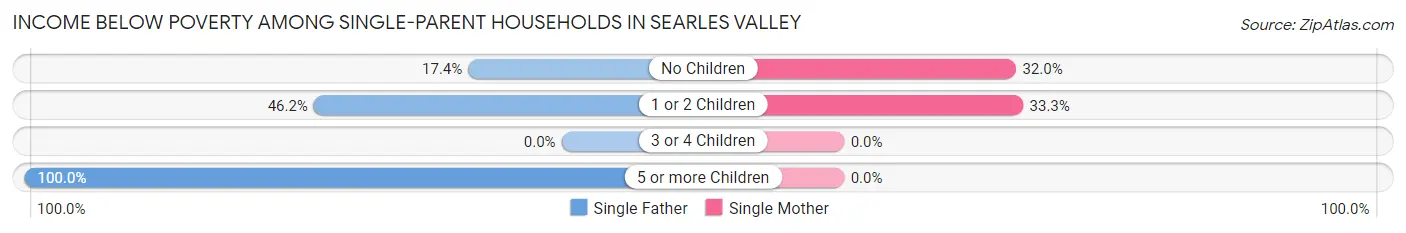
| Children | Single Father | Single Mother |
| No Children | 4 (17.4%) | 8 (32.0%) |
| 1 or 2 Children | 12 (46.2%) | 6 (33.3%) |
| 3 or 4 Children | 0 (0.0%) | 0 (0.0%) |
| 5 or more Children | 8 (100.0%) | 0 (0.0%) |
| Total | 24 (36.9%) | 14 (32.6%) |
Income Below Poverty Among Married-Couple vs Single-Parent Households in Searles Valley
The poverty data for Searles Valley shows that 34 of the married-couple family households (10.2%) and 38 of the single-parent households (35.2%) are living below the poverty level. Within the married-couple family households, those with no children have the highest poverty rate, with 32 households (15.5%) falling below the poverty line. Among the single-parent households, those with 5 or more children have the highest poverty rate, with 8 household (100.0%) living below poverty.
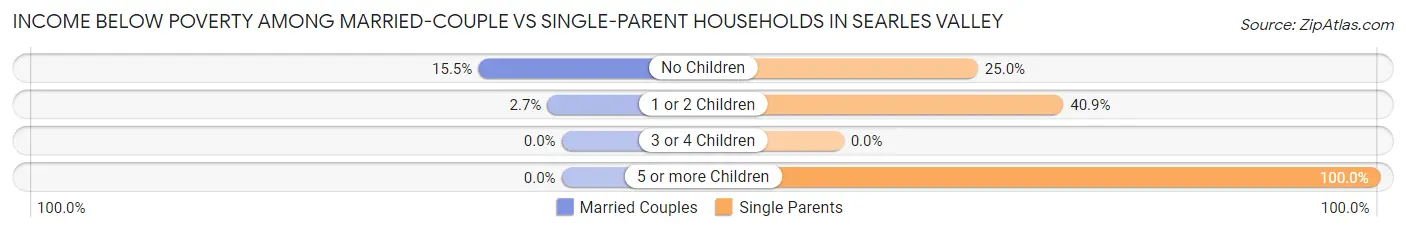
| Children | Married-Couple Families | Single-Parent Households |
| No Children | 32 (15.5%) | 12 (25.0%) |
| 1 or 2 Children | 2 (2.7%) | 18 (40.9%) |
| 3 or 4 Children | 0 (0.0%) | 0 (0.0%) |
| 5 or more Children | 0 (0.0%) | 8 (100.0%) |
| Total | 34 (10.2%) | 38 (35.2%) |
Race in Searles Valley
The most populous races in Searles Valley are White / Caucasian (1,424 | 83.0%), Hispanic or Latino (318 | 18.5%), and Two or more Races (146 | 8.5%).
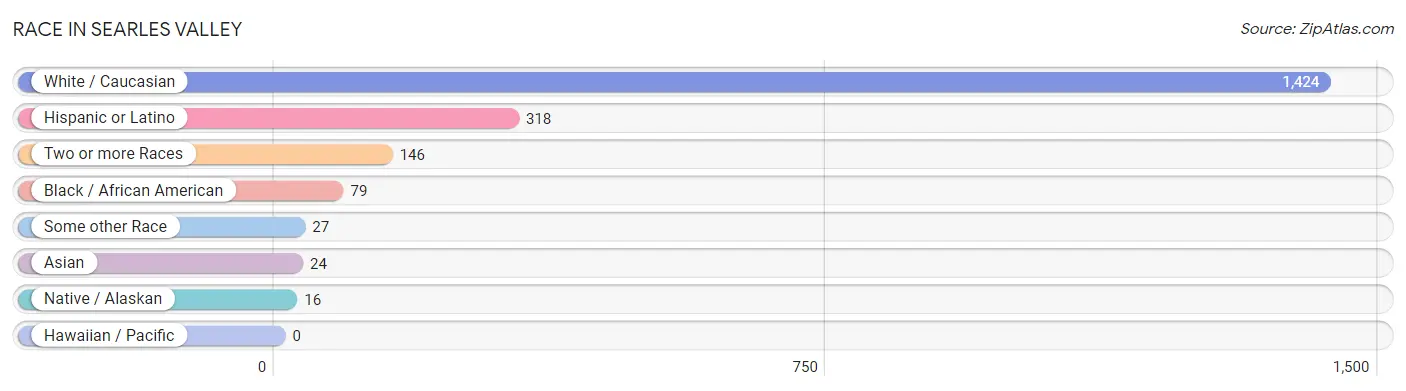
| Race | # Population | % Population |
| Asian | 24 | 1.4% |
| Black / African American | 79 | 4.6% |
| Hawaiian / Pacific | 0 | 0.0% |
| Hispanic or Latino | 318 | 18.5% |
| Native / Alaskan | 16 | 0.9% |
| White / Caucasian | 1,424 | 83.0% |
| Two or more Races | 146 | 8.5% |
| Some other Race | 27 | 1.6% |
| Total | 1,716 | 100.0% |
Ancestry in Searles Valley
The most populous ancestries reported in Searles Valley are Mexican (265 | 15.4%), Irish (181 | 10.5%), English (178 | 10.4%), European (170 | 9.9%), and Dutch (140 | 8.2%), together accounting for 54.4% of all Searles Valley residents.
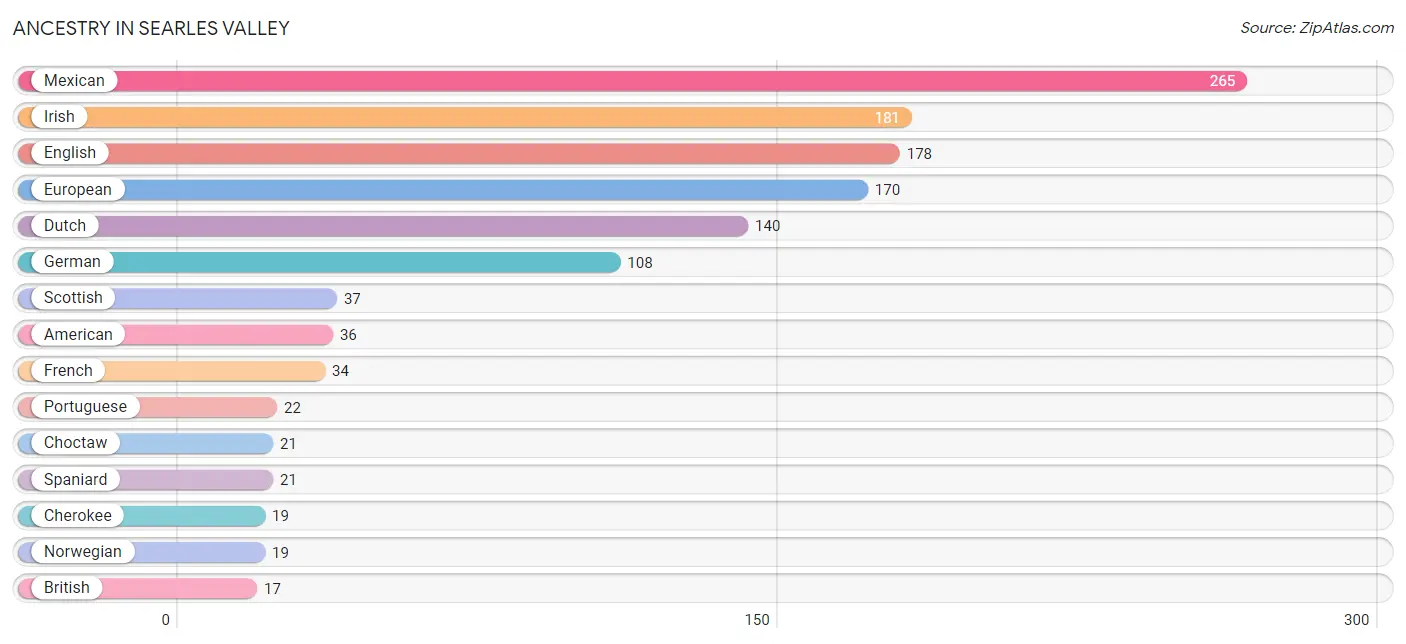
| Ancestry | # Population | % Population |
| American | 36 | 2.1% |
| British | 17 | 1.0% |
| Burmese | 4 | 0.2% |
| Cherokee | 19 | 1.1% |
| Chippewa | 7 | 0.4% |
| Choctaw | 21 | 1.2% |
| Colombian | 13 | 0.8% |
| Comanche | 2 | 0.1% |
| Creek | 2 | 0.1% |
| Czechoslovakian | 14 | 0.8% |
| Dutch | 140 | 8.2% |
| English | 178 | 10.4% |
| European | 170 | 9.9% |
| French | 34 | 2.0% |
| German | 108 | 6.3% |
| Indian (Asian) | 14 | 0.8% |
| Irish | 181 | 10.5% |
| Italian | 7 | 0.4% |
| Korean | 3 | 0.2% |
| Mexican | 265 | 15.4% |
| Northern European | 3 | 0.2% |
| Norwegian | 19 | 1.1% |
| Polish | 4 | 0.2% |
| Portuguese | 22 | 1.3% |
| Pueblo | 5 | 0.3% |
| Russian | 6 | 0.4% |
| Scotch-Irish | 14 | 0.8% |
| Scottish | 37 | 2.2% |
| South American | 13 | 0.8% |
| Spaniard | 21 | 1.2% |
| Spanish | 14 | 0.8% |
| Sri Lankan | 3 | 0.2% |
| Swedish | 5 | 0.3% | View All 33 Rows |
Immigrants in Searles Valley
The most numerous immigrant groups reported in Searles Valley came from Asia (24 | 1.4%), Eastern Asia (18 | 1.1%), China (14 | 0.8%), Central America (12 | 0.7%), and Latin America (12 | 0.7%), together accounting for 4.7% of all Searles Valley residents.
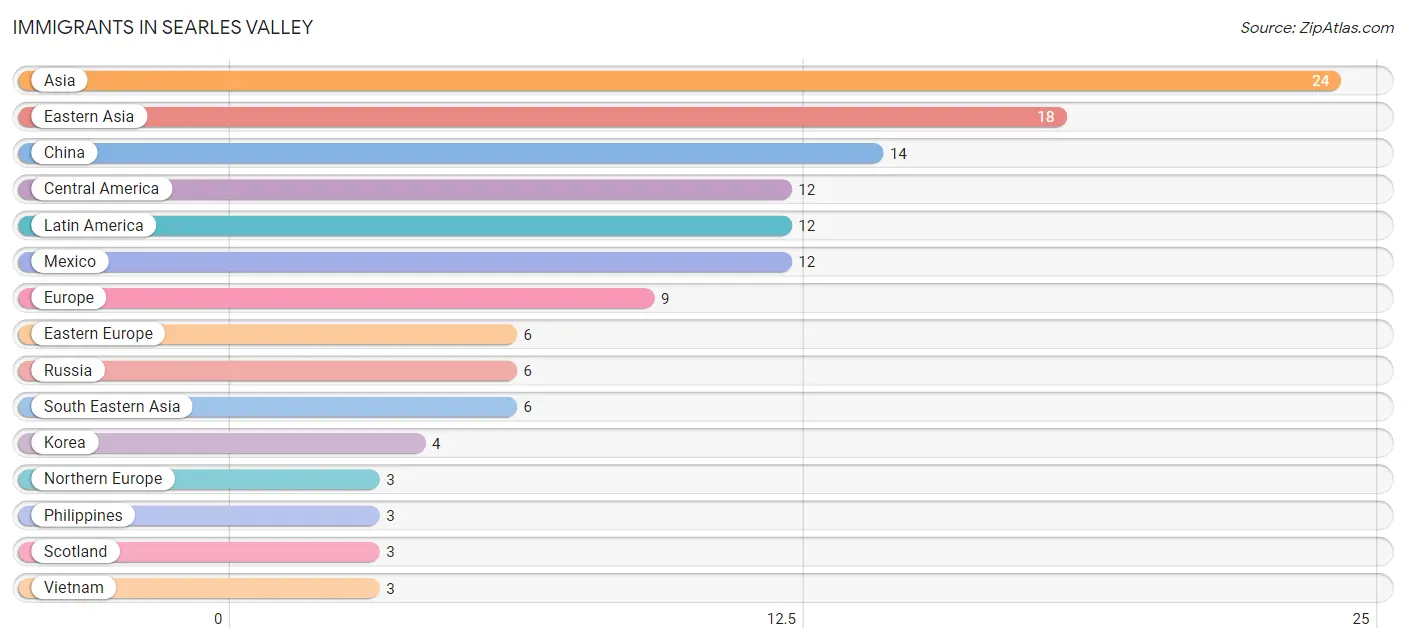
| Immigration Origin | # Population | % Population |
| Asia | 24 | 1.4% |
| Central America | 12 | 0.7% |
| China | 14 | 0.8% |
| Eastern Asia | 18 | 1.1% |
| Eastern Europe | 6 | 0.4% |
| Europe | 9 | 0.5% |
| Korea | 4 | 0.2% |
| Latin America | 12 | 0.7% |
| Mexico | 12 | 0.7% |
| Northern Europe | 3 | 0.2% |
| Philippines | 3 | 0.2% |
| Russia | 6 | 0.4% |
| Scotland | 3 | 0.2% |
| South Eastern Asia | 6 | 0.4% |
| Vietnam | 3 | 0.2% | View All 15 Rows |
Sex and Age in Searles Valley
Sex and Age in Searles Valley
The most populous age groups in Searles Valley are 10 to 14 Years (118 | 11.7%) for men and 55 to 59 Years (84 | 11.9%) for women.
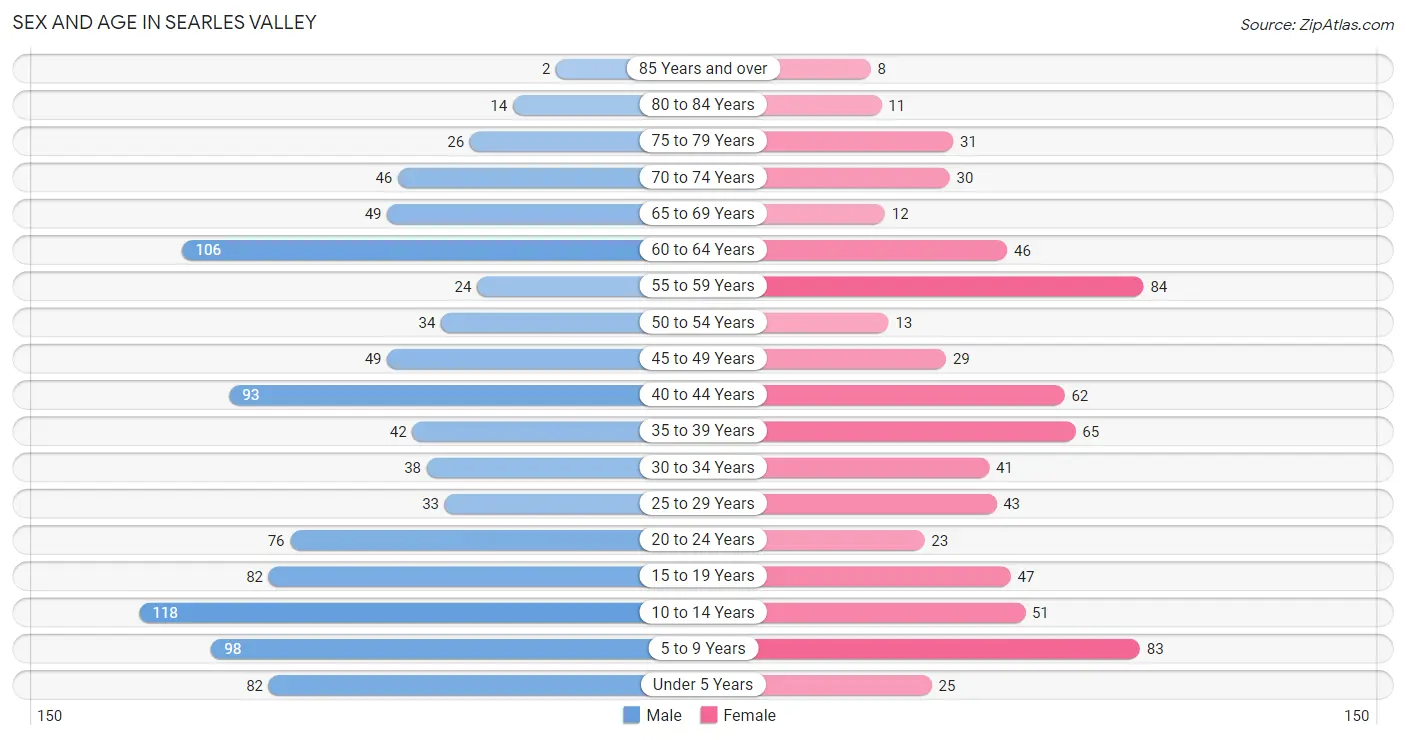
| Age Bracket | Male | Female |
| Under 5 Years | 82 (8.1%) | 25 (3.5%) |
| 5 to 9 Years | 98 (9.7%) | 83 (11.8%) |
| 10 to 14 Years | 118 (11.7%) | 51 (7.2%) |
| 15 to 19 Years | 82 (8.1%) | 47 (6.7%) |
| 20 to 24 Years | 76 (7.5%) | 23 (3.3%) |
| 25 to 29 Years | 33 (3.3%) | 43 (6.1%) |
| 30 to 34 Years | 38 (3.7%) | 41 (5.8%) |
| 35 to 39 Years | 42 (4.2%) | 65 (9.2%) |
| 40 to 44 Years | 93 (9.2%) | 62 (8.8%) |
| 45 to 49 Years | 49 (4.8%) | 29 (4.1%) |
| 50 to 54 Years | 34 (3.4%) | 13 (1.8%) |
| 55 to 59 Years | 24 (2.4%) | 84 (11.9%) |
| 60 to 64 Years | 106 (10.5%) | 46 (6.5%) |
| 65 to 69 Years | 49 (4.8%) | 12 (1.7%) |
| 70 to 74 Years | 46 (4.5%) | 30 (4.3%) |
| 75 to 79 Years | 26 (2.6%) | 31 (4.4%) |
| 80 to 84 Years | 14 (1.4%) | 11 (1.6%) |
| 85 Years and over | 2 (0.2%) | 8 (1.1%) |
| Total | 1,012 (100.0%) | 704 (100.0%) |
Families and Households in Searles Valley
Median Family Size in Searles Valley
The median family size in Searles Valley is 3.24 persons per family, with single male/father families (65 | 14.7%) accounting for the largest median family size of 3.98 persons per family. On the other hand, single female/mother families (43 | 9.7%) represent the smallest median family size with 2.26 persons per family.
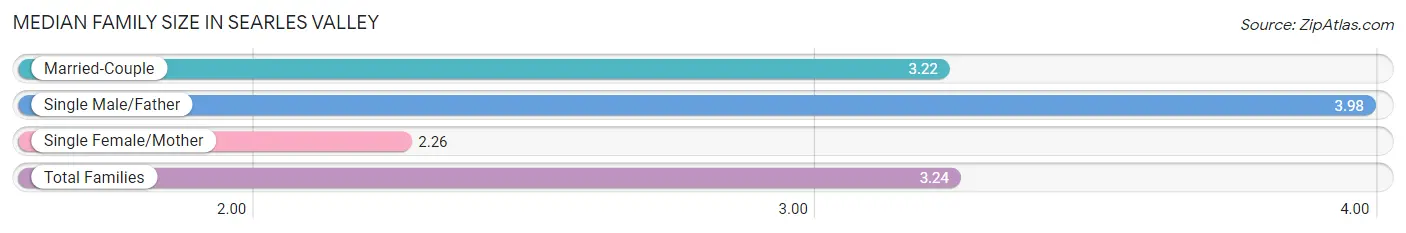
| Family Type | # Families | Family Size |
| Married-Couple | 335 (75.6%) | 3.22 |
| Single Male/Father | 65 (14.7%) | 3.98 |
| Single Female/Mother | 43 (9.7%) | 2.26 |
| Total Families | 443 (100.0%) | 3.24 |
Median Household Size in Searles Valley
The median household size in Searles Valley is 2.63 persons per household, with single male/father households (65 | 10.0%) accounting for the largest median household size of 4.68 persons per household. non-family households (210 | 32.2%) represent the smallest median household size with 1.10 persons per household.
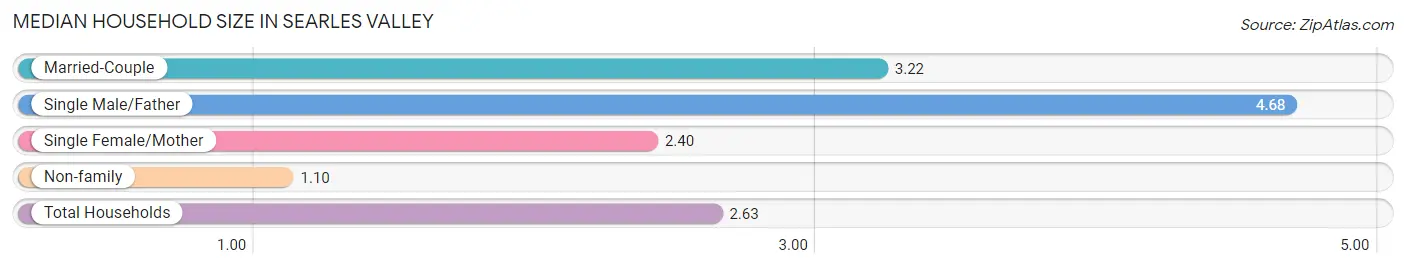
| Household Type | # Households | Household Size |
| Married-Couple | 335 (51.3%) | 3.22 |
| Single Male/Father | 65 (10.0%) | 4.68 |
| Single Female/Mother | 43 (6.6%) | 2.40 |
| Non-family | 210 (32.2%) | 1.10 |
| Total Households | 653 (100.0%) | 2.63 |
Household Size by Marriage Status in Searles Valley
Out of a total of 653 households in Searles Valley, 443 (67.8%) are family households, while 210 (32.2%) are nonfamily households. The most numerous type of family households are 2-person households, comprising 221, and the most common type of nonfamily households are 1-person households, comprising 190.
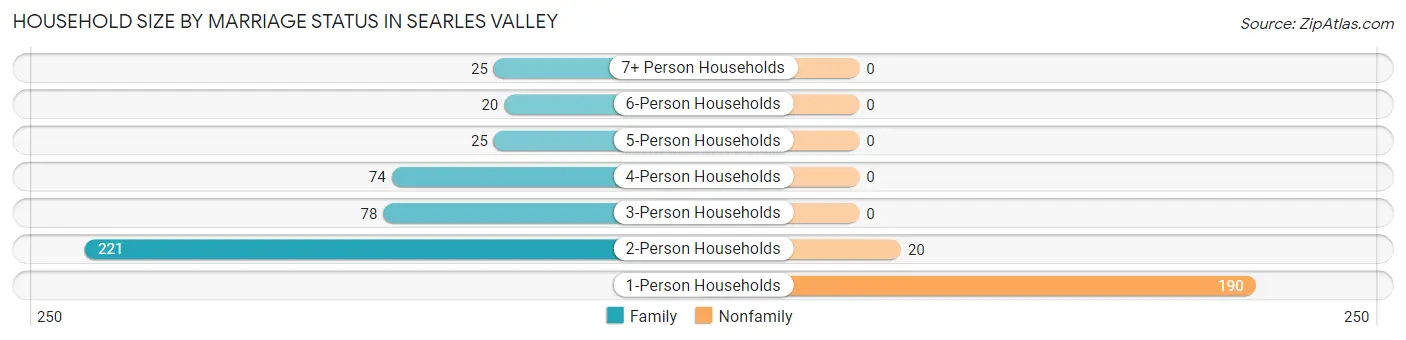
| Household Size | Family Households | Nonfamily Households |
| 1-Person Households | - | 190 (29.1%) |
| 2-Person Households | 221 (33.8%) | 20 (3.1%) |
| 3-Person Households | 78 (11.9%) | 0 (0.0%) |
| 4-Person Households | 74 (11.3%) | 0 (0.0%) |
| 5-Person Households | 25 (3.8%) | 0 (0.0%) |
| 6-Person Households | 20 (3.1%) | 0 (0.0%) |
| 7+ Person Households | 25 (3.8%) | 0 (0.0%) |
| Total | 443 (67.8%) | 210 (32.2%) |
Female Fertility in Searles Valley
Fertility by Age in Searles Valley
Average fertility rate in Searles Valley is 65.0 births per 1,000 women. Women in the age bracket of 20 to 34 years have the highest fertility rate with 187.0 births per 1,000 women. Women in the age bracket of 20 to 34 years acount for 100.0% of all women with births.
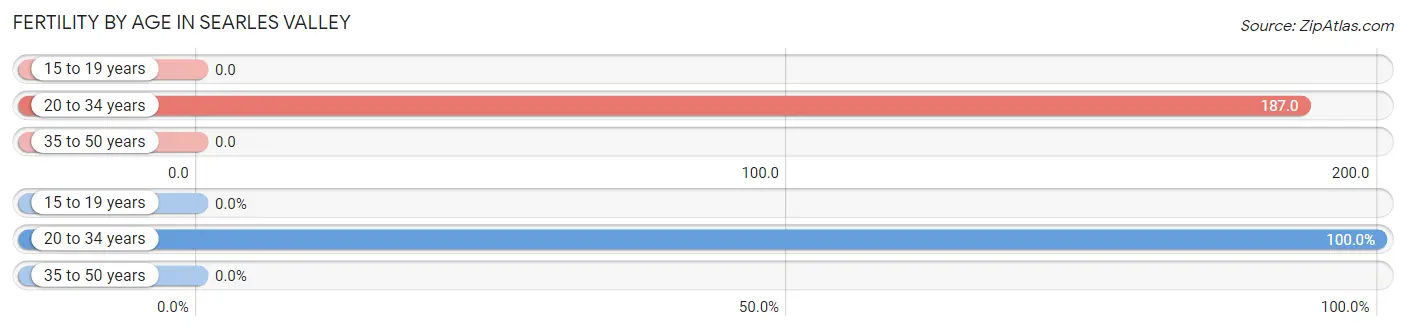
| Age Bracket | Women with Births | Births / 1,000 Women |
| 15 to 19 years | 0 (0.0%) | 0.0 |
| 20 to 34 years | 20 (100.0%) | 187.0 |
| 35 to 50 years | 0 (0.0%) | 0.0 |
| Total | 20 (100.0%) | 65.0 |
Fertility by Age by Marriage Status in Searles Valley
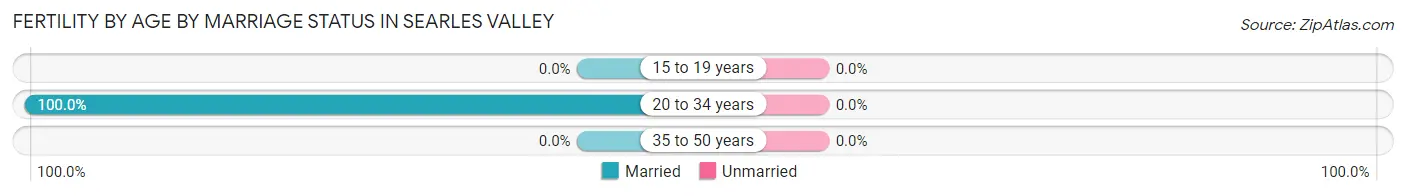
| Age Bracket | Married | Unmarried |
| 15 to 19 years | 0 (0.0%) | 0 (0.0%) |
| 20 to 34 years | 20 (100.0%) | 0 (0.0%) |
| 35 to 50 years | 0 (0.0%) | 0 (0.0%) |
| Total | 20 (100.0%) | 0 (0.0%) |
Fertility by Education in Searles Valley
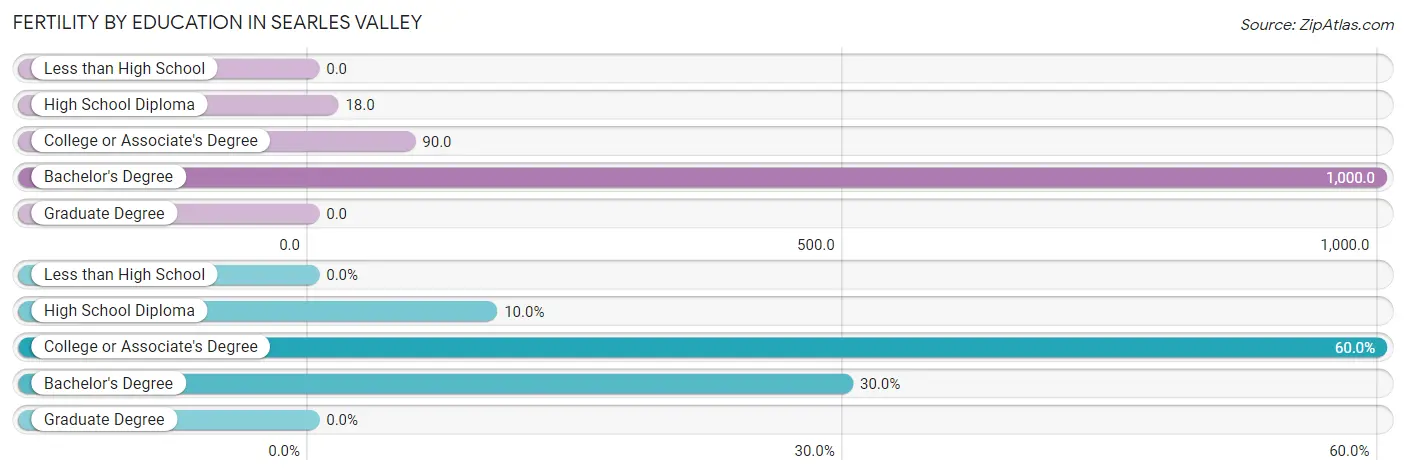
| Educational Attainment | Women with Births | Births / 1,000 Women |
| Less than High School | 0 (0.0%) | 0.0 |
| High School Diploma | 2 (10.0%) | 18.0 |
| College or Associate's Degree | 12 (60.0%) | 90.0 |
| Bachelor's Degree | 6 (30.0%) | 1,000.0 |
| Graduate Degree | 0 (0.0%) | 0.0 |
| Total | 20 (100.0%) | 65.0 |
Fertility by Education by Marriage Status in Searles Valley
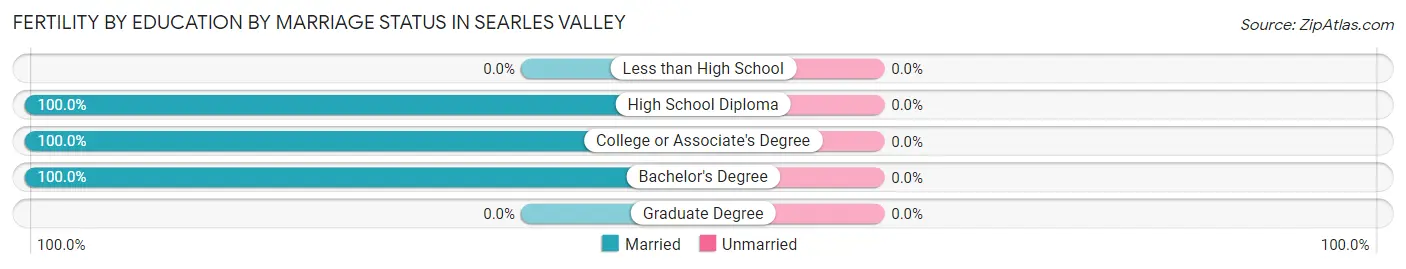
| Educational Attainment | Married | Unmarried |
| Less than High School | 0 (0.0%) | 0 (0.0%) |
| High School Diploma | 2 (100.0%) | 0 (0.0%) |
| College or Associate's Degree | 12 (100.0%) | 0 (0.0%) |
| Bachelor's Degree | 6 (100.0%) | 0 (0.0%) |
| Graduate Degree | 0 (0.0%) | 0 (0.0%) |
| Total | 20 (100.0%) | 0 (0.0%) |
Employment Characteristics in Searles Valley
Employment by Class of Employer in Searles Valley
Among the 534 employed individuals in Searles Valley, private company employees (369 | 69.1%), federal government employees (49 | 9.2%), and local government employees (44 | 8.2%) make up the most common classes of employment.
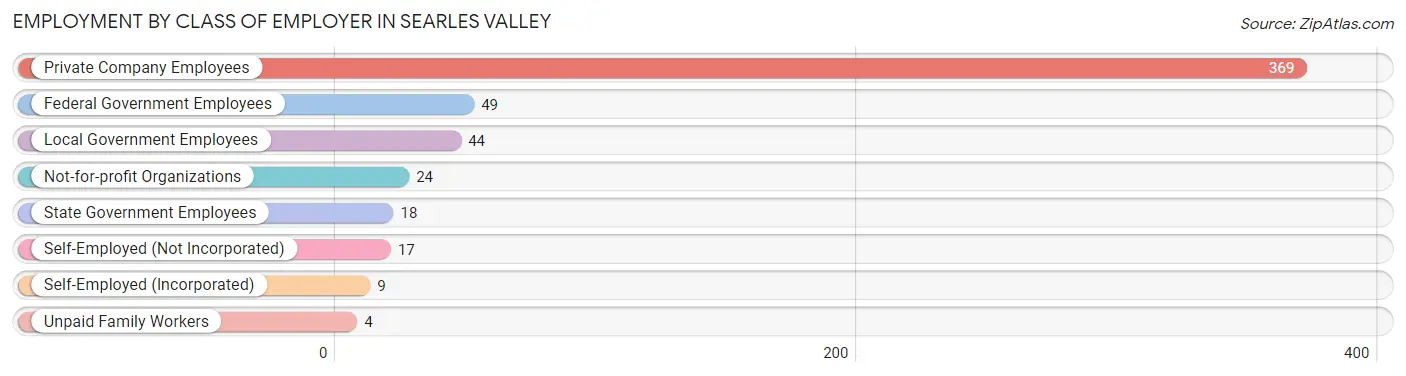
| Employer Class | # Employees | % Employees |
| Private Company Employees | 369 | 69.1% |
| Self-Employed (Incorporated) | 9 | 1.7% |
| Self-Employed (Not Incorporated) | 17 | 3.2% |
| Not-for-profit Organizations | 24 | 4.5% |
| Local Government Employees | 44 | 8.2% |
| State Government Employees | 18 | 3.4% |
| Federal Government Employees | 49 | 9.2% |
| Unpaid Family Workers | 4 | 0.7% |
| Total | 534 | 100.0% |
Employment Status by Age in Searles Valley
According to the labor force statistics for Searles Valley, out of the total population over 16 years of age (1,218), 49.6% or 604 individuals are in the labor force, with 8.9% or 54 of them unemployed. The age group with the highest labor force participation rate is 30 to 34 years, with 81.0% or 64 individuals in the labor force. Within the labor force, the 75 years and over age range has the highest percentage of unemployed individuals, with 100.0% or 3 of them being unemployed.
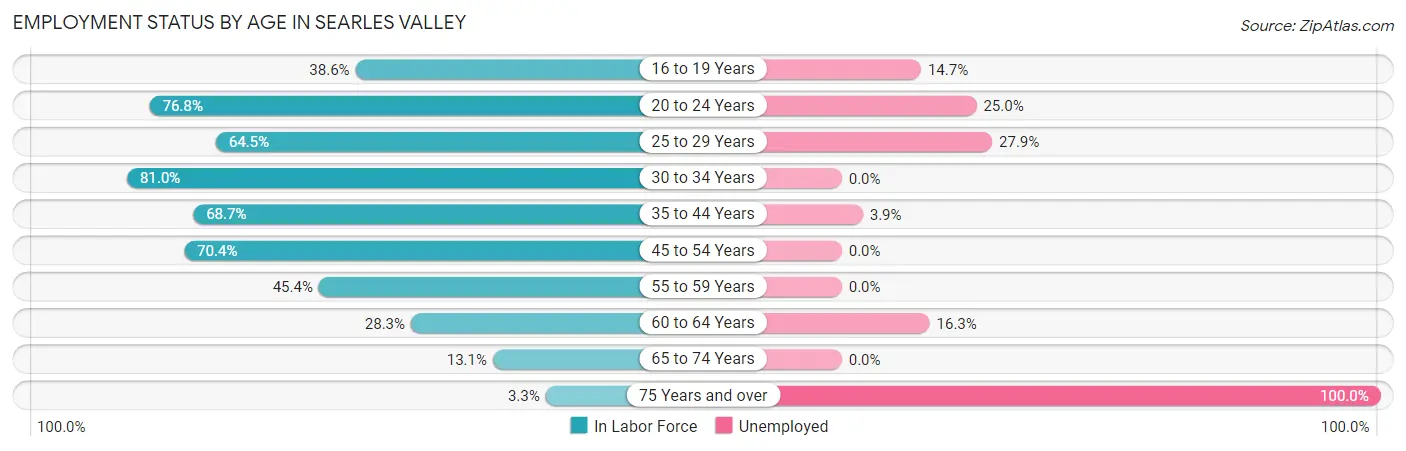
| Age Bracket | In Labor Force | Unemployed |
| 16 to 19 Years | 34 (38.6%) | 5 (14.7%) |
| 20 to 24 Years | 76 (76.8%) | 19 (25.0%) |
| 25 to 29 Years | 49 (64.5%) | 14 (27.9%) |
| 30 to 34 Years | 64 (81.0%) | 0 (0.0%) |
| 35 to 44 Years | 180 (68.7%) | 7 (3.9%) |
| 45 to 54 Years | 88 (70.4%) | 0 (0.0%) |
| 55 to 59 Years | 49 (45.4%) | 0 (0.0%) |
| 60 to 64 Years | 43 (28.3%) | 7 (16.3%) |
| 65 to 74 Years | 18 (13.1%) | 0 (0.0%) |
| 75 Years and over | 3 (3.3%) | 3 (100.0%) |
| Total | 604 (49.6%) | 54 (8.9%) |
Employment Status by Educational Attainment in Searles Valley
According to labor force statistics for Searles Valley, 59.0% of individuals (473) out of the total population between 25 and 64 years of age (802) are in the labor force, with 5.6% or 26 of them being unemployed. The group with the highest labor force participation rate are those with the educational attainment of bachelor's degree or higher, with 84.0% or 68 individuals in the labor force. Within the labor force, individuals with college / associate degree education have the highest percentage of unemployment, with 11.0% or 22 of them being unemployed.
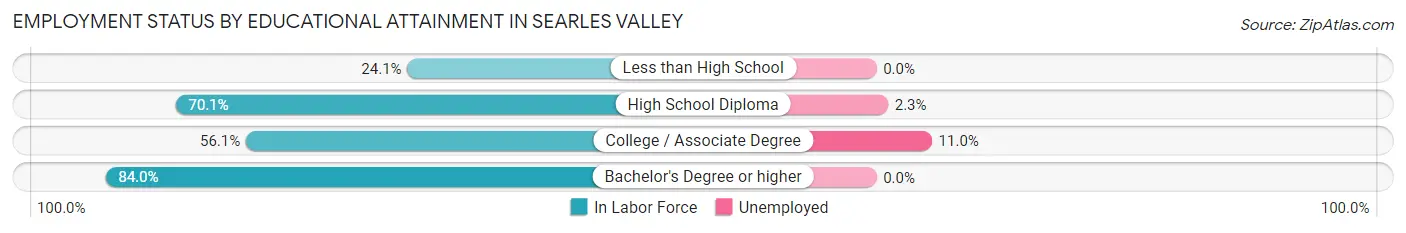
| Educational Attainment | In Labor Force | Unemployed |
| Less than High School | 26 (24.1%) | 0 (0.0%) |
| High School Diploma | 176 (70.1%) | 6 (2.3%) |
| College / Associate Degree | 203 (56.1%) | 40 (11.0%) |
| Bachelor's Degree or higher | 68 (84.0%) | 0 (0.0%) |
| Total | 473 (59.0%) | 45 (5.6%) |
Employment Occupations by Sex in Searles Valley
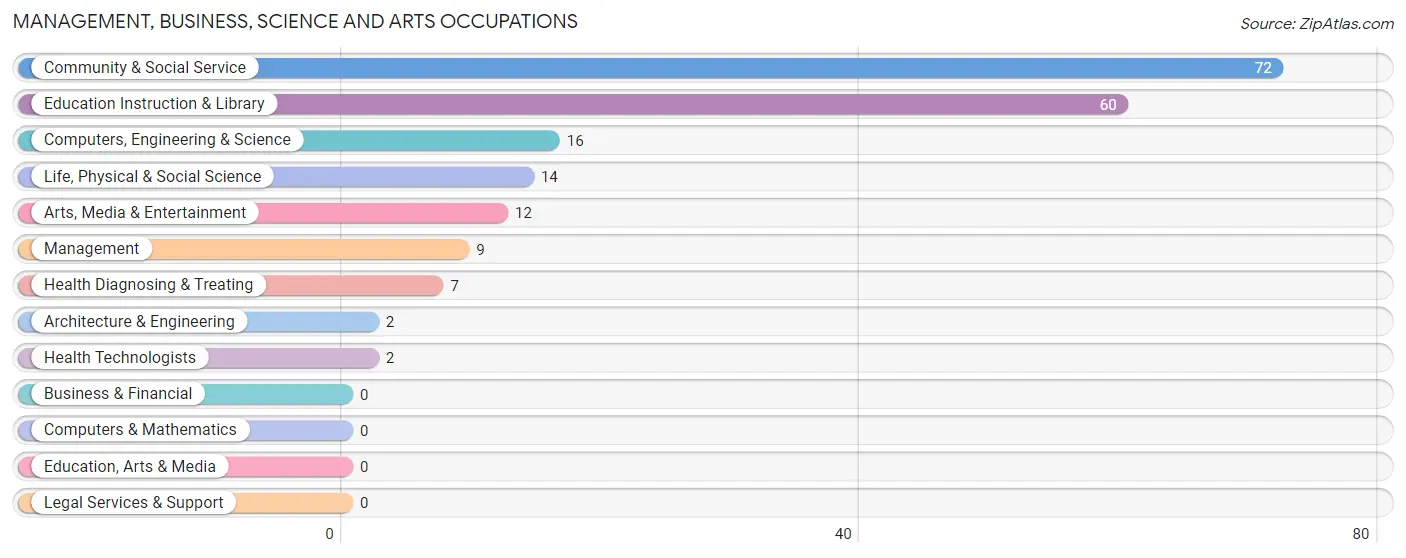
Management, Business, Science and Arts Occupations
The most common Management, Business, Science and Arts occupations in Searles Valley are Community & Social Service (72 | 13.3%), Education Instruction & Library (60 | 11.1%), Computers, Engineering & Science (16 | 2.9%), Life, Physical & Social Science (14 | 2.6%), and Arts, Media & Entertainment (12 | 2.2%).
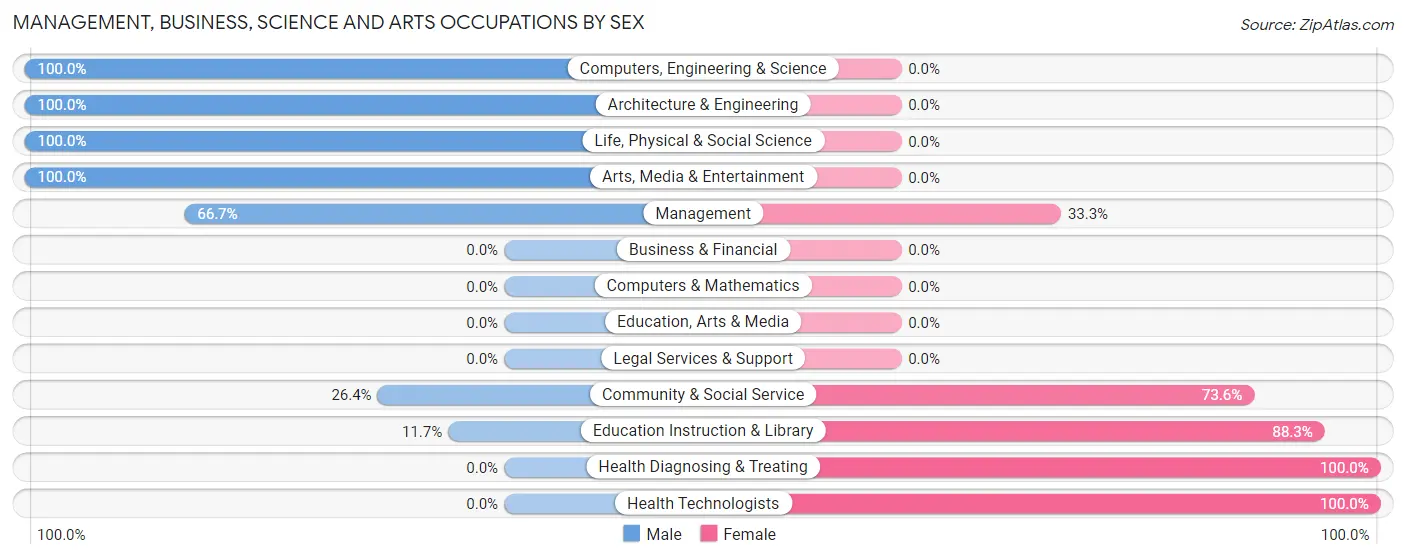
Management, Business, Science and Arts Occupations by Sex
Within the Management, Business, Science and Arts occupations in Searles Valley, the most male-oriented occupations are Computers, Engineering & Science (100.0%), Architecture & Engineering (100.0%), and Life, Physical & Social Science (100.0%), while the most female-oriented occupations are Health Diagnosing & Treating (100.0%), Health Technologists (100.0%), and Education Instruction & Library (88.3%).
| Occupation | Male | Female |
| Management | 6 (66.7%) | 3 (33.3%) |
| Business & Financial | 0 (0.0%) | 0 (0.0%) |
| Computers, Engineering & Science | 16 (100.0%) | 0 (0.0%) |
| Computers & Mathematics | 0 (0.0%) | 0 (0.0%) |
| Architecture & Engineering | 2 (100.0%) | 0 (0.0%) |
| Life, Physical & Social Science | 14 (100.0%) | 0 (0.0%) |
| Community & Social Service | 19 (26.4%) | 53 (73.6%) |
| Education, Arts & Media | 0 (0.0%) | 0 (0.0%) |
| Legal Services & Support | 0 (0.0%) | 0 (0.0%) |
| Education Instruction & Library | 7 (11.7%) | 53 (88.3%) |
| Arts, Media & Entertainment | 12 (100.0%) | 0 (0.0%) |
| Health Diagnosing & Treating | 0 (0.0%) | 7 (100.0%) |
| Health Technologists | 0 (0.0%) | 2 (100.0%) |
| Total (Category) | 41 (39.4%) | 63 (60.6%) |
| Total (Overall) | 320 (59.0%) | 222 (41.0%) |
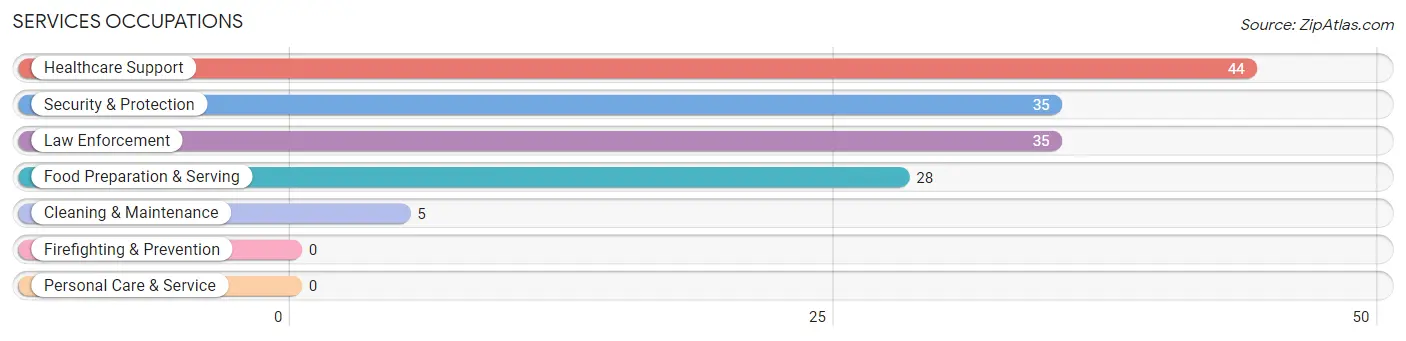
Services Occupations
The most common Services occupations in Searles Valley are Healthcare Support (44 | 8.1%), Security & Protection (35 | 6.5%), Law Enforcement (35 | 6.5%), Food Preparation & Serving (28 | 5.2%), and Cleaning & Maintenance (5 | 0.9%).
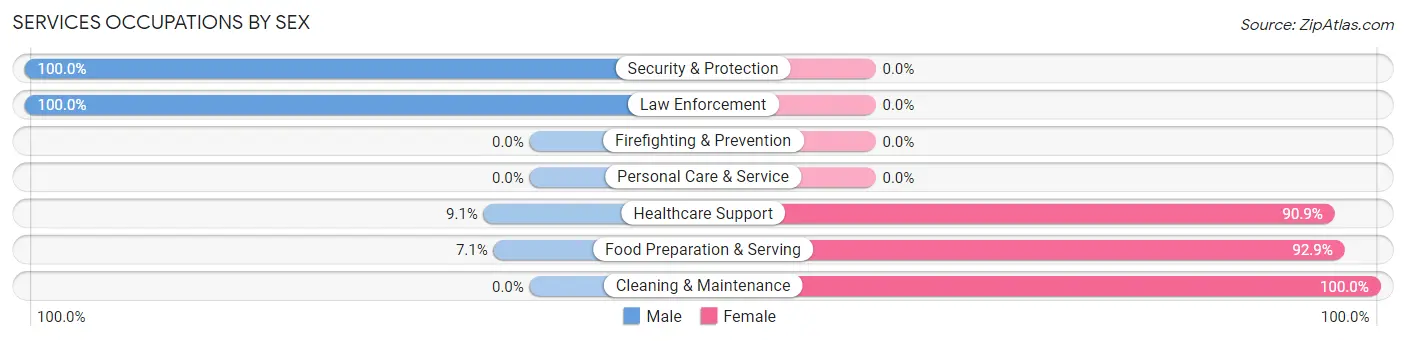
Services Occupations by Sex
Within the Services occupations in Searles Valley, the most male-oriented occupations are Security & Protection (100.0%), Law Enforcement (100.0%), and Healthcare Support (9.1%), while the most female-oriented occupations are Cleaning & Maintenance (100.0%), Food Preparation & Serving (92.9%), and Healthcare Support (90.9%).
| Occupation | Male | Female |
| Healthcare Support | 4 (9.1%) | 40 (90.9%) |
| Security & Protection | 35 (100.0%) | 0 (0.0%) |
| Firefighting & Prevention | 0 (0.0%) | 0 (0.0%) |
| Law Enforcement | 35 (100.0%) | 0 (0.0%) |
| Food Preparation & Serving | 2 (7.1%) | 26 (92.9%) |
| Cleaning & Maintenance | 0 (0.0%) | 5 (100.0%) |
| Personal Care & Service | 0 (0.0%) | 0 (0.0%) |
| Total (Category) | 41 (36.6%) | 71 (63.4%) |
| Total (Overall) | 320 (59.0%) | 222 (41.0%) |
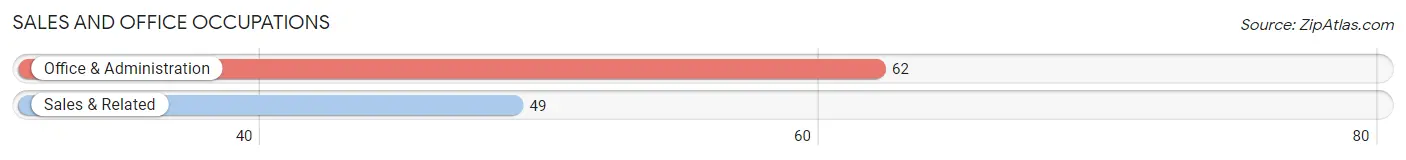
Sales and Office Occupations
The most common Sales and Office occupations in Searles Valley are Office & Administration (62 | 11.4%), and Sales & Related (49 | 9.0%).
Sales and Office Occupations by Sex
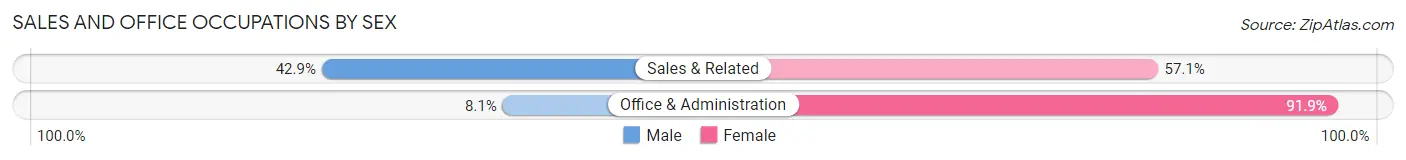
| Occupation | Male | Female |
| Sales & Related | 21 (42.9%) | 28 (57.1%) |
| Office & Administration | 5 (8.1%) | 57 (91.9%) |
| Total (Category) | 26 (23.4%) | 85 (76.6%) |
| Total (Overall) | 320 (59.0%) | 222 (41.0%) |
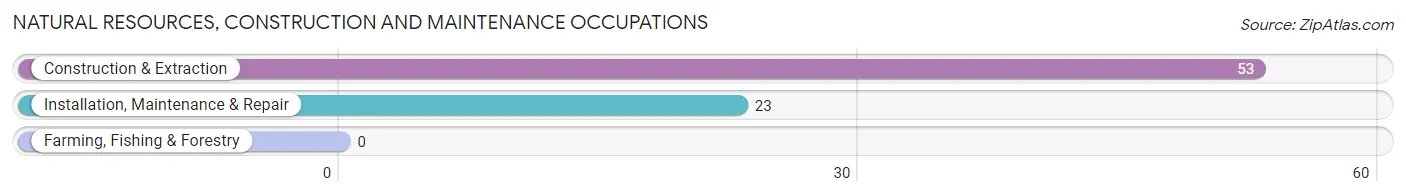
Natural Resources, Construction and Maintenance Occupations
The most common Natural Resources, Construction and Maintenance occupations in Searles Valley are Construction & Extraction (53 | 9.8%), and Installation, Maintenance & Repair (23 | 4.2%).
Natural Resources, Construction and Maintenance Occupations by Sex
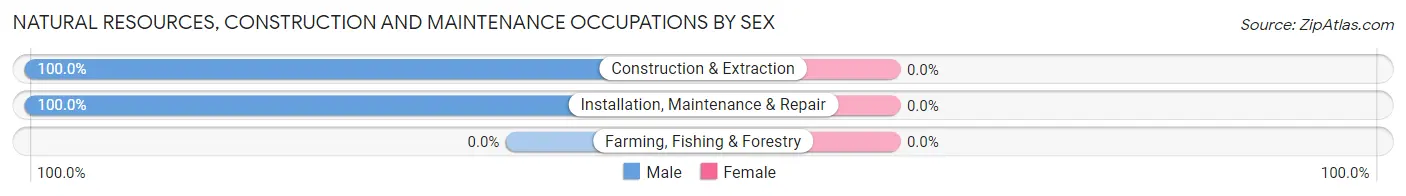
| Occupation | Male | Female |
| Farming, Fishing & Forestry | 0 (0.0%) | 0 (0.0%) |
| Construction & Extraction | 53 (100.0%) | 0 (0.0%) |
| Installation, Maintenance & Repair | 23 (100.0%) | 0 (0.0%) |
| Total (Category) | 76 (100.0%) | 0 (0.0%) |
| Total (Overall) | 320 (59.0%) | 222 (41.0%) |
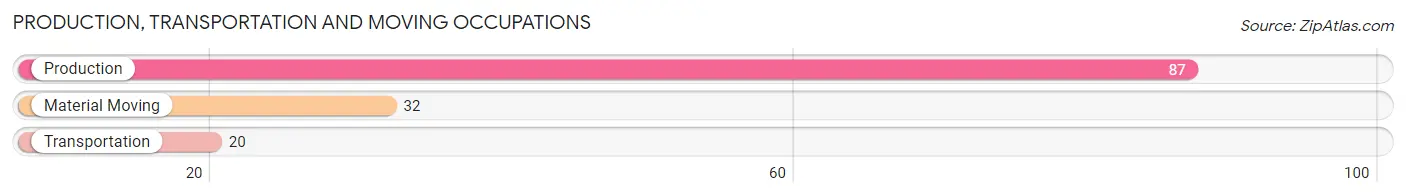
Production, Transportation and Moving Occupations
The most common Production, Transportation and Moving occupations in Searles Valley are Production (87 | 16.1%), Material Moving (32 | 5.9%), and Transportation (20 | 3.7%).
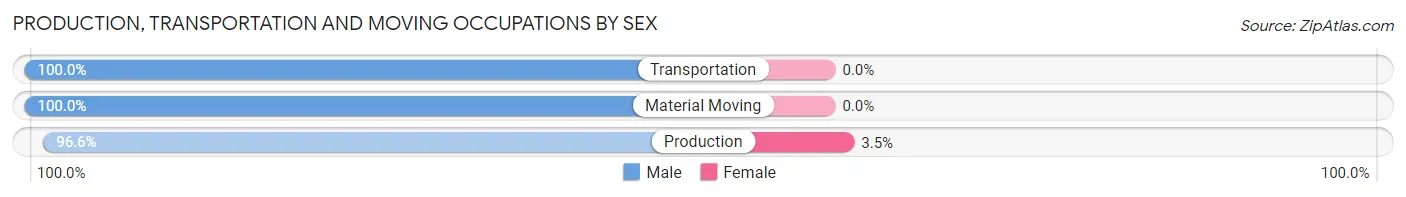
Production, Transportation and Moving Occupations by Sex
| Occupation | Male | Female |
| Production | 84 (96.6%) | 3 (3.5%) |
| Transportation | 20 (100.0%) | 0 (0.0%) |
| Material Moving | 32 (100.0%) | 0 (0.0%) |
| Total (Category) | 136 (97.8%) | 3 (2.2%) |
| Total (Overall) | 320 (59.0%) | 222 (41.0%) |
Employment Industries by Sex in Searles Valley
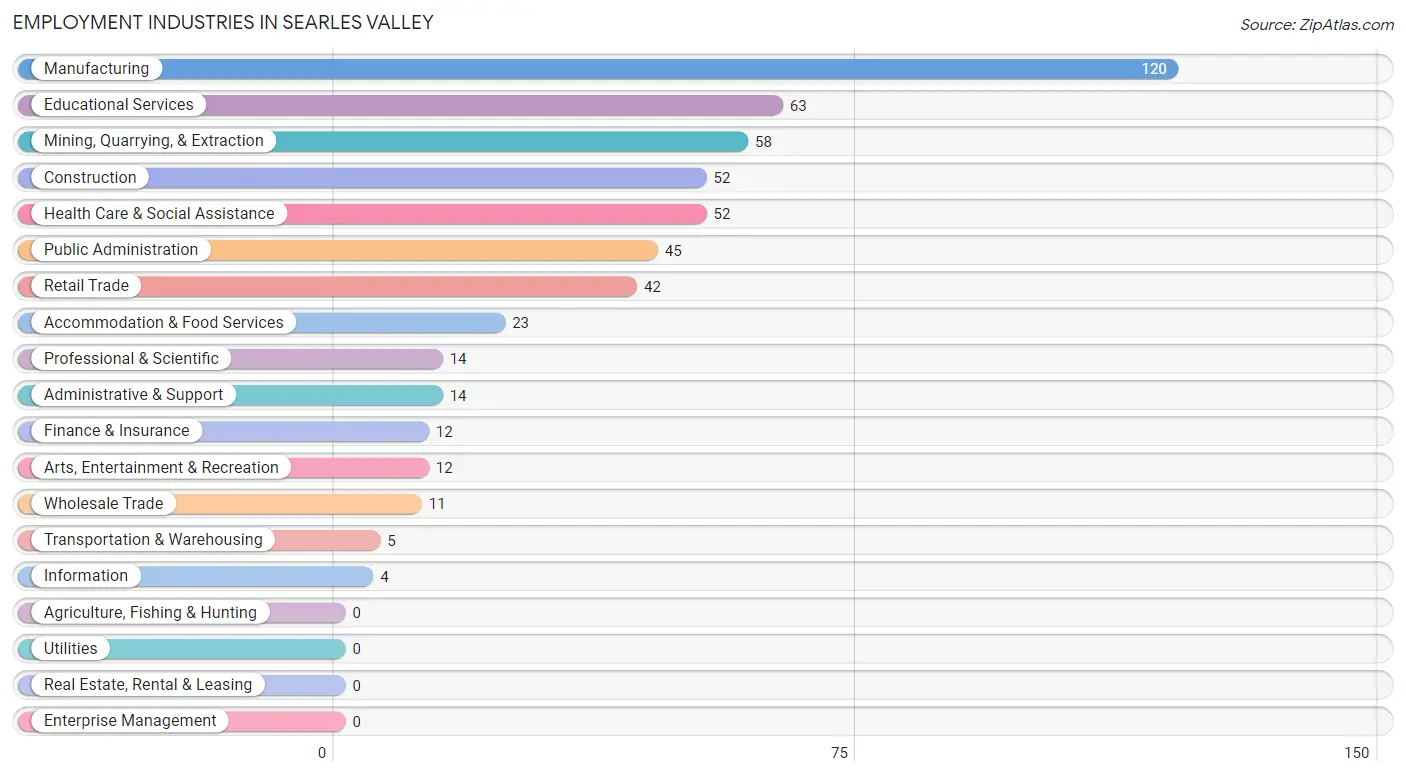
Employment Industries in Searles Valley
The major employment industries in Searles Valley include Manufacturing (120 | 22.1%), Educational Services (63 | 11.6%), Mining, Quarrying, & Extraction (58 | 10.7%), Construction (52 | 9.6%), and Health Care & Social Assistance (52 | 9.6%).
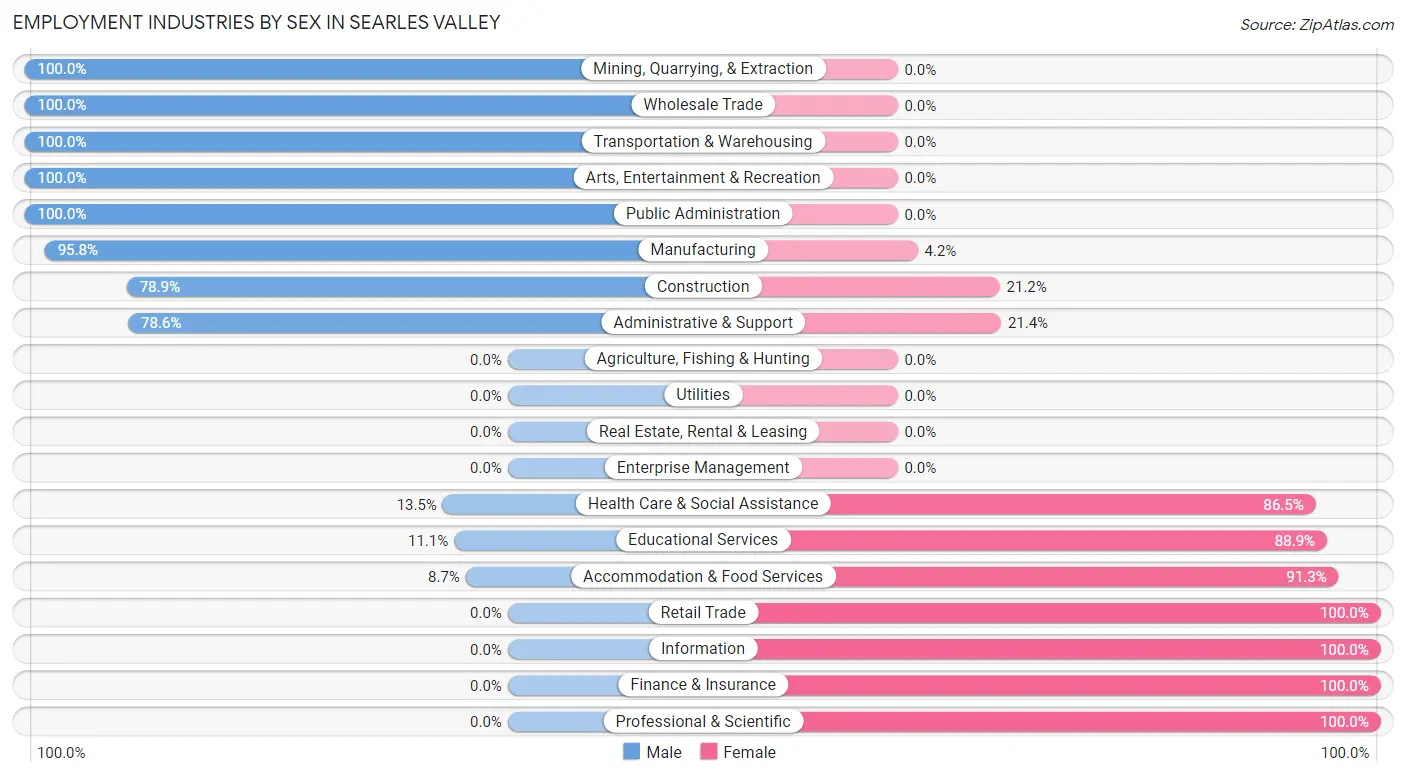
Employment Industries by Sex in Searles Valley
The Searles Valley industries that see more men than women are Mining, Quarrying, & Extraction (100.0%), Wholesale Trade (100.0%), and Transportation & Warehousing (100.0%), whereas the industries that tend to have a higher number of women are Retail Trade (100.0%), Information (100.0%), and Finance & Insurance (100.0%).
| Industry | Male | Female |
| Agriculture, Fishing & Hunting | 0 (0.0%) | 0 (0.0%) |
| Mining, Quarrying, & Extraction | 58 (100.0%) | 0 (0.0%) |
| Construction | 41 (78.8%) | 11 (21.1%) |
| Manufacturing | 115 (95.8%) | 5 (4.2%) |
| Wholesale Trade | 11 (100.0%) | 0 (0.0%) |
| Retail Trade | 0 (0.0%) | 42 (100.0%) |
| Transportation & Warehousing | 5 (100.0%) | 0 (0.0%) |
| Utilities | 0 (0.0%) | 0 (0.0%) |
| Information | 0 (0.0%) | 4 (100.0%) |
| Finance & Insurance | 0 (0.0%) | 12 (100.0%) |
| Real Estate, Rental & Leasing | 0 (0.0%) | 0 (0.0%) |
| Professional & Scientific | 0 (0.0%) | 14 (100.0%) |
| Enterprise Management | 0 (0.0%) | 0 (0.0%) |
| Administrative & Support | 11 (78.6%) | 3 (21.4%) |
| Educational Services | 7 (11.1%) | 56 (88.9%) |
| Health Care & Social Assistance | 7 (13.5%) | 45 (86.5%) |
| Arts, Entertainment & Recreation | 12 (100.0%) | 0 (0.0%) |
| Accommodation & Food Services | 2 (8.7%) | 21 (91.3%) |
| Public Administration | 45 (100.0%) | 0 (0.0%) |
| Total | 320 (59.0%) | 222 (41.0%) |
Education in Searles Valley
School Enrollment in Searles Valley
The most common levels of schooling among the 579 students in Searles Valley are elementary school (215 | 37.1%), high school (114 | 19.7%), and college / undergraduate (103 | 17.8%).
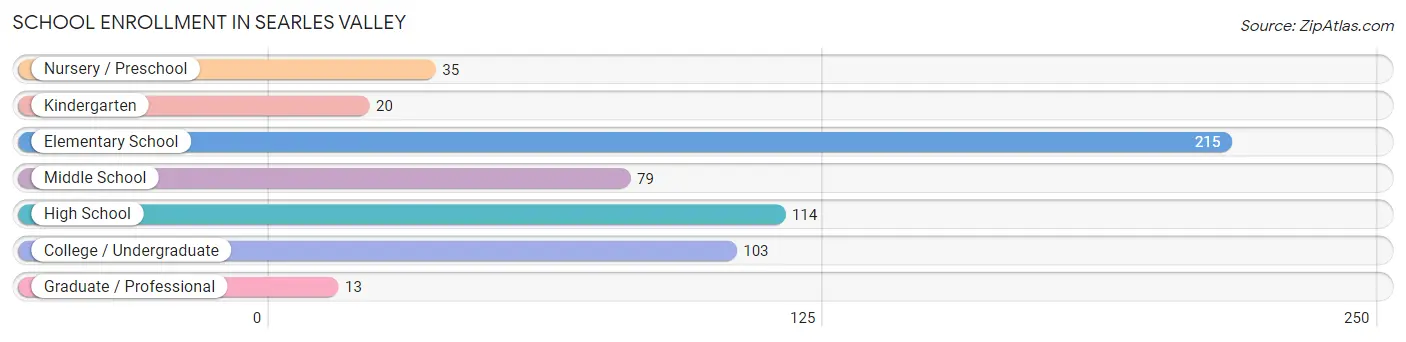
| School Level | # Students | % Students |
| Nursery / Preschool | 35 | 6.0% |
| Kindergarten | 20 | 3.5% |
| Elementary School | 215 | 37.1% |
| Middle School | 79 | 13.6% |
| High School | 114 | 19.7% |
| College / Undergraduate | 103 | 17.8% |
| Graduate / Professional | 13 | 2.2% |
| Total | 579 | 100.0% |
School Enrollment by Age by Funding Source in Searles Valley
Out of a total of 579 students who are enrolled in schools in Searles Valley, 30 (5.2%) attend a private institution, while the remaining 549 (94.8%) are enrolled in public schools. The age group of 3 to 4 year olds has the highest likelihood of being enrolled in private schools, with 12 (34.3% in the age bracket) enrolled. Conversely, the age group of 10 to 14 year olds has the lowest likelihood of being enrolled in a private school, with 169 (100.0% in the age bracket) attending a public institution.
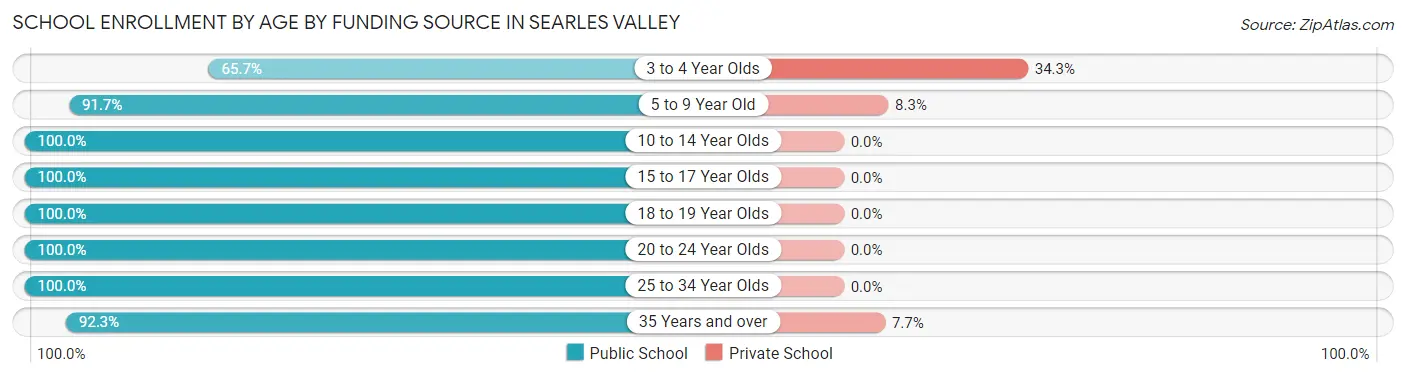
| Age Bracket | Public School | Private School |
| 3 to 4 Year Olds | 23 (65.7%) | 12 (34.3%) |
| 5 to 9 Year Old | 166 (91.7%) | 15 (8.3%) |
| 10 to 14 Year Olds | 169 (100.0%) | 0 (0.0%) |
| 15 to 17 Year Olds | 74 (100.0%) | 0 (0.0%) |
| 18 to 19 Year Olds | 26 (100.0%) | 0 (0.0%) |
| 20 to 24 Year Olds | 9 (100.0%) | 0 (0.0%) |
| 25 to 34 Year Olds | 46 (100.0%) | 0 (0.0%) |
| 35 Years and over | 36 (92.3%) | 3 (7.7%) |
| Total | 549 (94.8%) | 30 (5.2%) |
Educational Attainment by Field of Study in Searles Valley
Education (23 | 16.2%), social sciences (21 | 14.8%), business (21 | 14.8%), literature & languages (17 | 12.0%), and psychology (11 | 7.7%) are the most common fields of study among 142 individuals in Searles Valley who have obtained a bachelor's degree or higher.
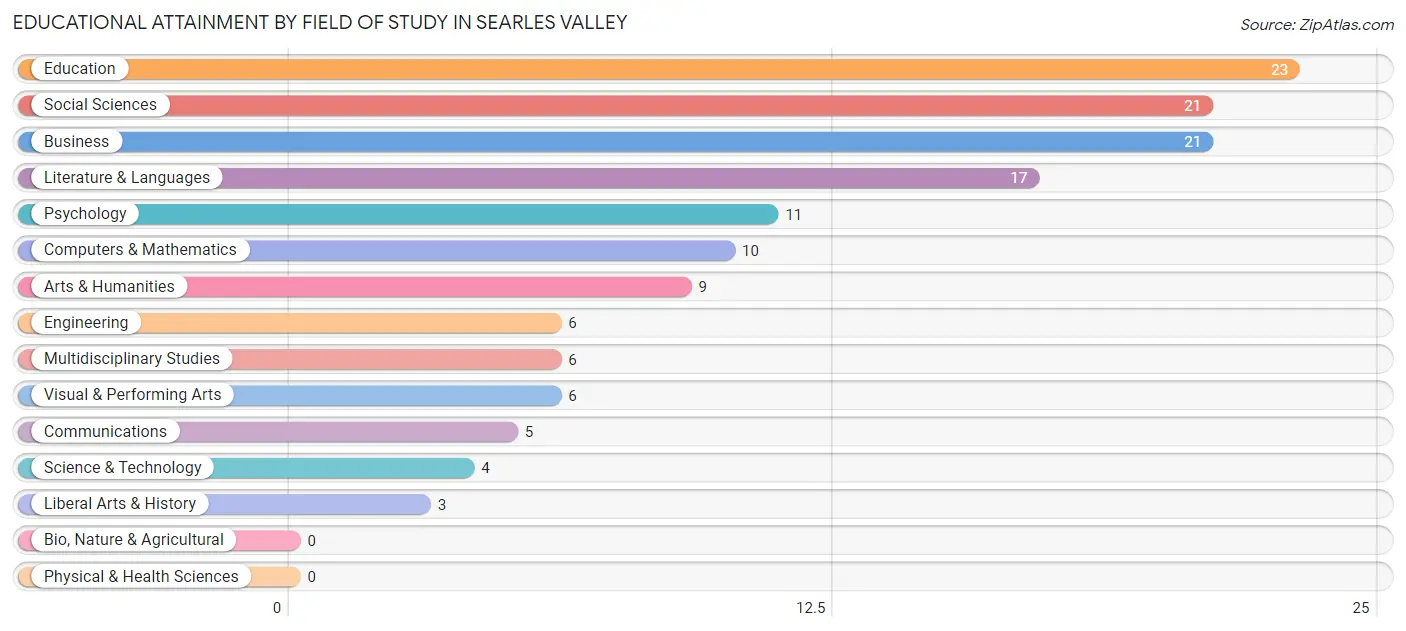
| Field of Study | # Graduates | % Graduates |
| Computers & Mathematics | 10 | 7.0% |
| Bio, Nature & Agricultural | 0 | 0.0% |
| Physical & Health Sciences | 0 | 0.0% |
| Psychology | 11 | 7.7% |
| Social Sciences | 21 | 14.8% |
| Engineering | 6 | 4.2% |
| Multidisciplinary Studies | 6 | 4.2% |
| Science & Technology | 4 | 2.8% |
| Business | 21 | 14.8% |
| Education | 23 | 16.2% |
| Literature & Languages | 17 | 12.0% |
| Liberal Arts & History | 3 | 2.1% |
| Visual & Performing Arts | 6 | 4.2% |
| Communications | 5 | 3.5% |
| Arts & Humanities | 9 | 6.3% |
| Total | 142 | 100.0% |
Transportation & Commute in Searles Valley
Vehicle Availability by Sex in Searles Valley
The most prevalent vehicle ownership categories in Searles Valley are males with 3 vehicles (131, accounting for 40.9%) and females with 3 vehicles (82, making up 61.2%).
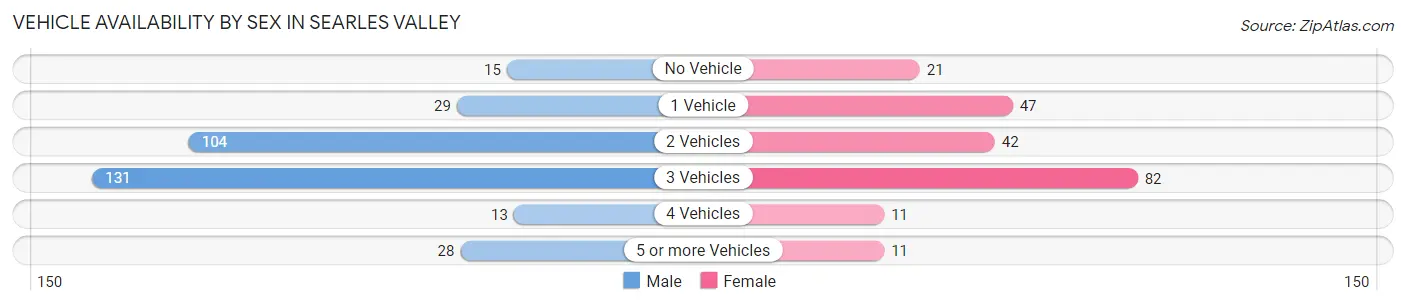
| Vehicles Available | Male | Female |
| No Vehicle | 15 (4.7%) | 21 (9.8%) |
| 1 Vehicle | 29 (9.1%) | 47 (22.0%) |
| 2 Vehicles | 104 (32.5%) | 42 (19.6%) |
| 3 Vehicles | 131 (40.9%) | 82 (38.3%) |
| 4 Vehicles | 13 (4.1%) | 11 (5.1%) |
| 5 or more Vehicles | 28 (8.7%) | 11 (5.1%) |
| Total | 320 (100.0%) | 214 (100.0%) |
Commute Time in Searles Valley
The most frequently occuring commute durations in Searles Valley are 5 to 9 minutes (174 commuters, 35.7%), less than 5 minutes (103 commuters, 21.1%), and 30 to 34 minutes (62 commuters, 12.7%).
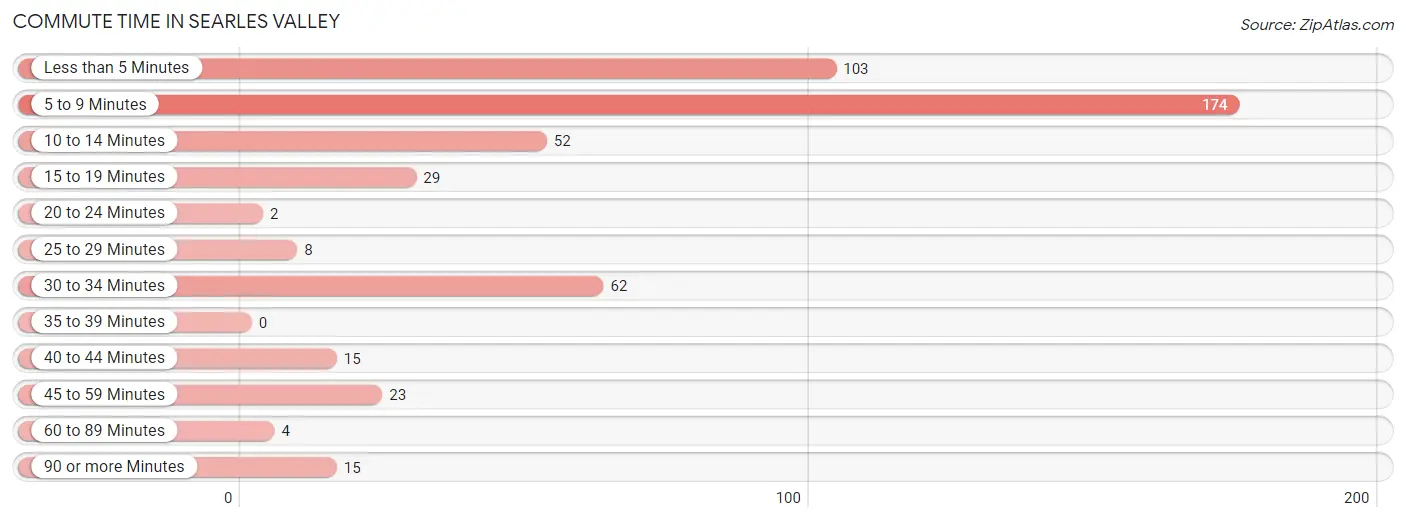
| Commute Time | # Commuters | % Commuters |
| Less than 5 Minutes | 103 | 21.1% |
| 5 to 9 Minutes | 174 | 35.7% |
| 10 to 14 Minutes | 52 | 10.7% |
| 15 to 19 Minutes | 29 | 5.9% |
| 20 to 24 Minutes | 2 | 0.4% |
| 25 to 29 Minutes | 8 | 1.6% |
| 30 to 34 Minutes | 62 | 12.7% |
| 35 to 39 Minutes | 0 | 0.0% |
| 40 to 44 Minutes | 15 | 3.1% |
| 45 to 59 Minutes | 23 | 4.7% |
| 60 to 89 Minutes | 4 | 0.8% |
| 90 or more Minutes | 15 | 3.1% |
Commute Time by Sex in Searles Valley
The most common commute times in Searles Valley are 5 to 9 minutes (132 commuters, 42.0%) for males and less than 5 minutes (50 commuters, 28.9%) for females.
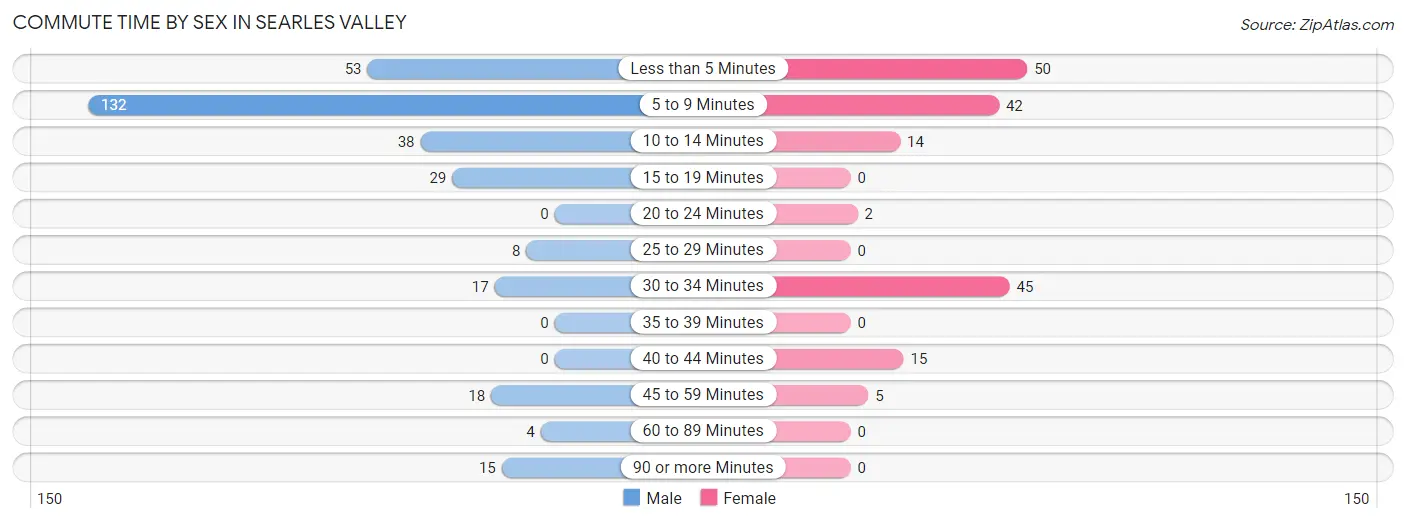
| Commute Time | Male | Female |
| Less than 5 Minutes | 53 (16.9%) | 50 (28.9%) |
| 5 to 9 Minutes | 132 (42.0%) | 42 (24.3%) |
| 10 to 14 Minutes | 38 (12.1%) | 14 (8.1%) |
| 15 to 19 Minutes | 29 (9.2%) | 0 (0.0%) |
| 20 to 24 Minutes | 0 (0.0%) | 2 (1.2%) |
| 25 to 29 Minutes | 8 (2.5%) | 0 (0.0%) |
| 30 to 34 Minutes | 17 (5.4%) | 45 (26.0%) |
| 35 to 39 Minutes | 0 (0.0%) | 0 (0.0%) |
| 40 to 44 Minutes | 0 (0.0%) | 15 (8.7%) |
| 45 to 59 Minutes | 18 (5.7%) | 5 (2.9%) |
| 60 to 89 Minutes | 4 (1.3%) | 0 (0.0%) |
| 90 or more Minutes | 15 (4.8%) | 0 (0.0%) |
Time of Departure to Work by Sex in Searles Valley
The most frequent times of departure to work in Searles Valley are 5:00 AM to 5:29 AM (95, 30.2%) for males and 7:00 AM to 7:29 AM (58, 33.5%) for females.
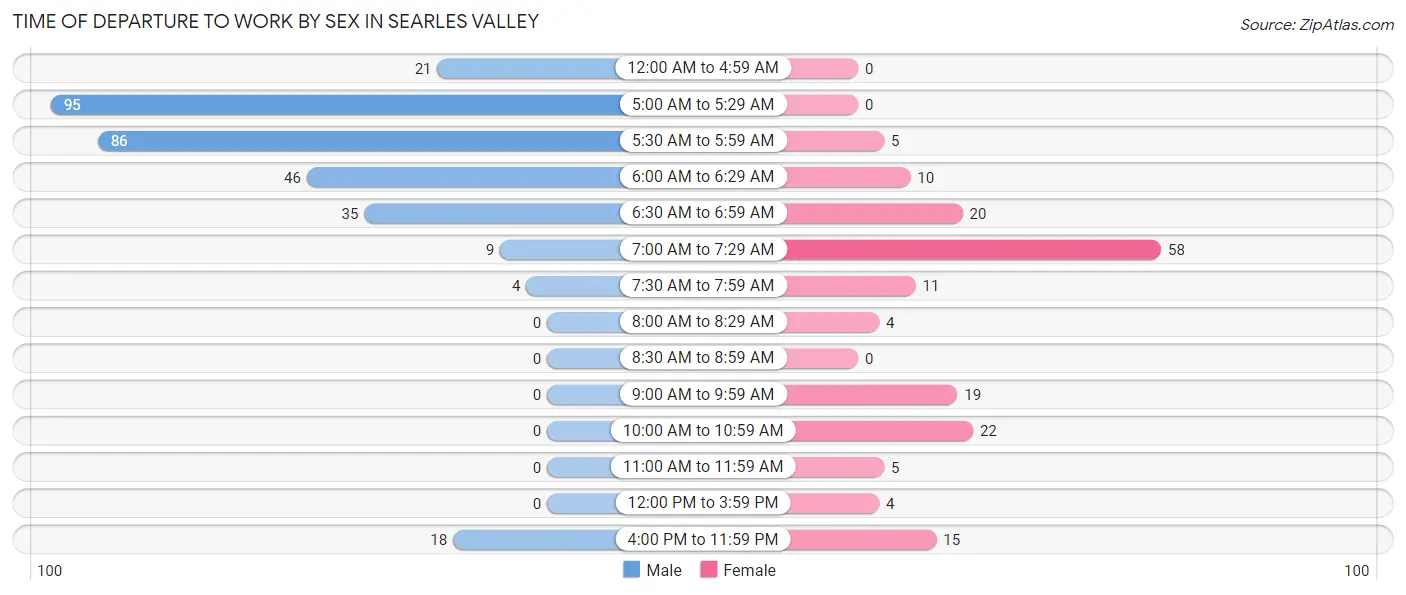
| Time of Departure | Male | Female |
| 12:00 AM to 4:59 AM | 21 (6.7%) | 0 (0.0%) |
| 5:00 AM to 5:29 AM | 95 (30.2%) | 0 (0.0%) |
| 5:30 AM to 5:59 AM | 86 (27.4%) | 5 (2.9%) |
| 6:00 AM to 6:29 AM | 46 (14.6%) | 10 (5.8%) |
| 6:30 AM to 6:59 AM | 35 (11.2%) | 20 (11.6%) |
| 7:00 AM to 7:29 AM | 9 (2.9%) | 58 (33.5%) |
| 7:30 AM to 7:59 AM | 4 (1.3%) | 11 (6.4%) |
| 8:00 AM to 8:29 AM | 0 (0.0%) | 4 (2.3%) |
| 8:30 AM to 8:59 AM | 0 (0.0%) | 0 (0.0%) |
| 9:00 AM to 9:59 AM | 0 (0.0%) | 19 (11.0%) |
| 10:00 AM to 10:59 AM | 0 (0.0%) | 22 (12.7%) |
| 11:00 AM to 11:59 AM | 0 (0.0%) | 5 (2.9%) |
| 12:00 PM to 3:59 PM | 0 (0.0%) | 4 (2.3%) |
| 4:00 PM to 11:59 PM | 18 (5.7%) | 15 (8.7%) |
| Total | 314 (100.0%) | 173 (100.0%) |
Housing Occupancy in Searles Valley
Occupancy by Ownership in Searles Valley
Of the total 653 dwellings in Searles Valley, owner-occupied units account for 361 (55.3%), while renter-occupied units make up 292 (44.7%).
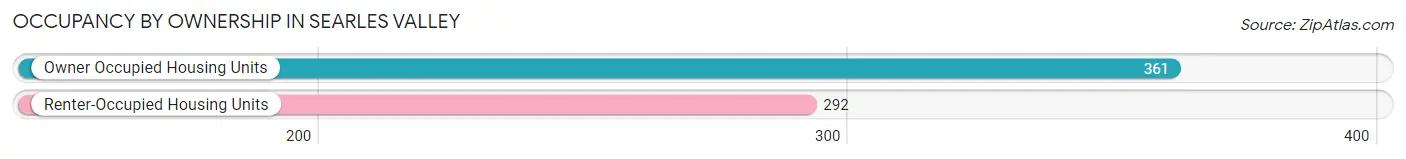
| Occupancy | # Housing Units | % Housing Units |
| Owner Occupied Housing Units | 361 | 55.3% |
| Renter-Occupied Housing Units | 292 | 44.7% |
| Total Occupied Housing Units | 653 | 100.0% |
Occupancy by Household Size in Searles Valley
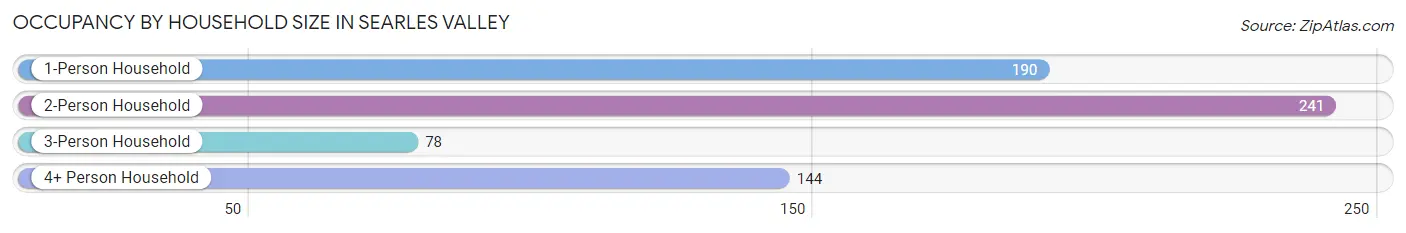
| Household Size | # Housing Units | % Housing Units |
| 1-Person Household | 190 | 29.1% |
| 2-Person Household | 241 | 36.9% |
| 3-Person Household | 78 | 11.9% |
| 4+ Person Household | 144 | 22.1% |
| Total Housing Units | 653 | 100.0% |
Occupancy by Ownership by Household Size in Searles Valley
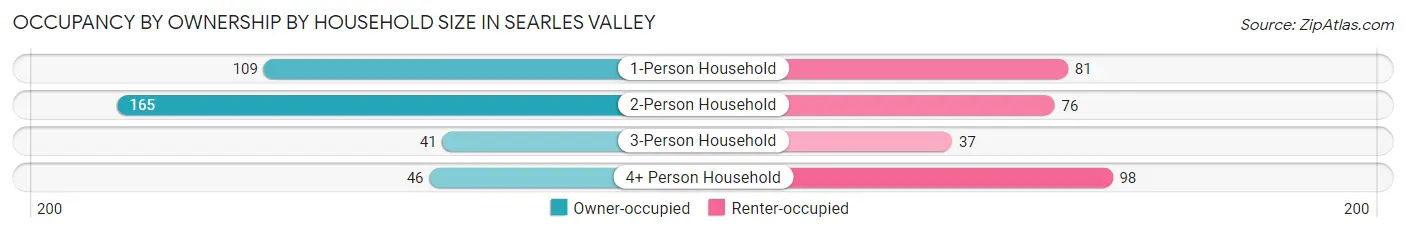
| Household Size | Owner-occupied | Renter-occupied |
| 1-Person Household | 109 (57.4%) | 81 (42.6%) |
| 2-Person Household | 165 (68.5%) | 76 (31.5%) |
| 3-Person Household | 41 (52.6%) | 37 (47.4%) |
| 4+ Person Household | 46 (31.9%) | 98 (68.1%) |
| Total Housing Units | 361 (55.3%) | 292 (44.7%) |
Occupancy by Educational Attainment in Searles Valley
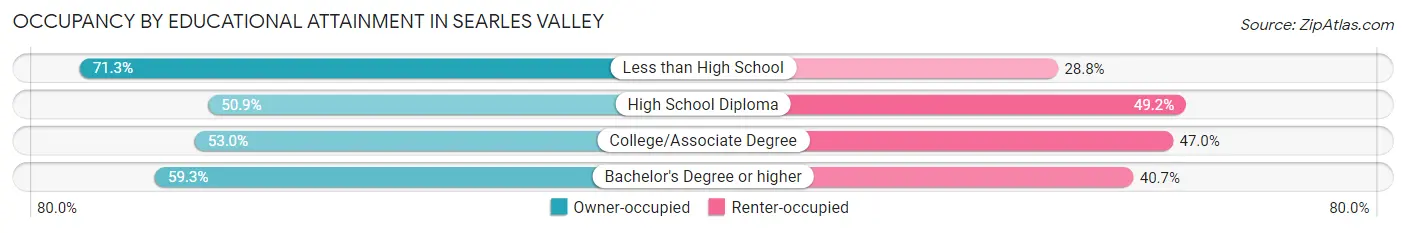
| Household Size | Owner-occupied | Renter-occupied |
| Less than High School | 57 (71.3%) | 23 (28.7%) |
| High School Diploma | 120 (50.8%) | 116 (49.1%) |
| College/Associate Degree | 133 (53.0%) | 118 (47.0%) |
| Bachelor's Degree or higher | 51 (59.3%) | 35 (40.7%) |
Occupancy by Age of Householder in Searles Valley
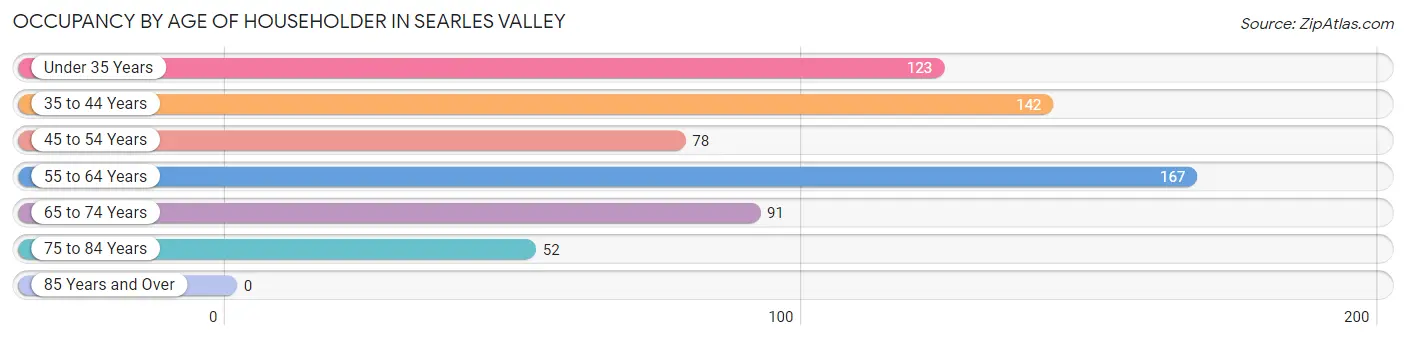
| Age Bracket | # Households | % Households |
| Under 35 Years | 123 | 18.8% |
| 35 to 44 Years | 142 | 21.7% |
| 45 to 54 Years | 78 | 11.9% |
| 55 to 64 Years | 167 | 25.6% |
| 65 to 74 Years | 91 | 13.9% |
| 75 to 84 Years | 52 | 8.0% |
| 85 Years and Over | 0 | 0.0% |
| Total | 653 | 100.0% |
Housing Finances in Searles Valley
Median Income by Occupancy in Searles Valley
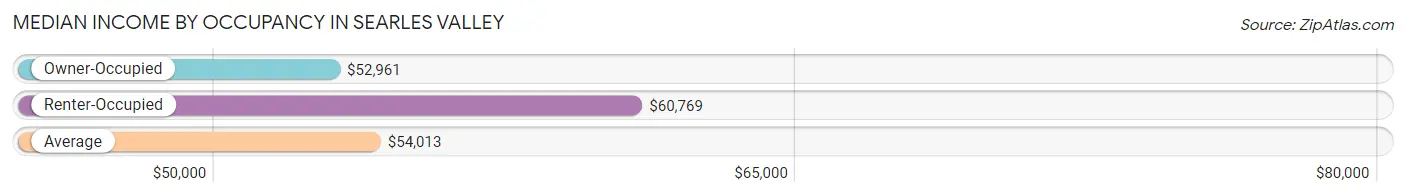
| Occupancy Type | # Households | Median Income |
| Owner-Occupied | 361 (55.3%) | $52,961 |
| Renter-Occupied | 292 (44.7%) | $60,769 |
| Average | 653 (100.0%) | $54,013 |
Occupancy by Householder Income Bracket in Searles Valley
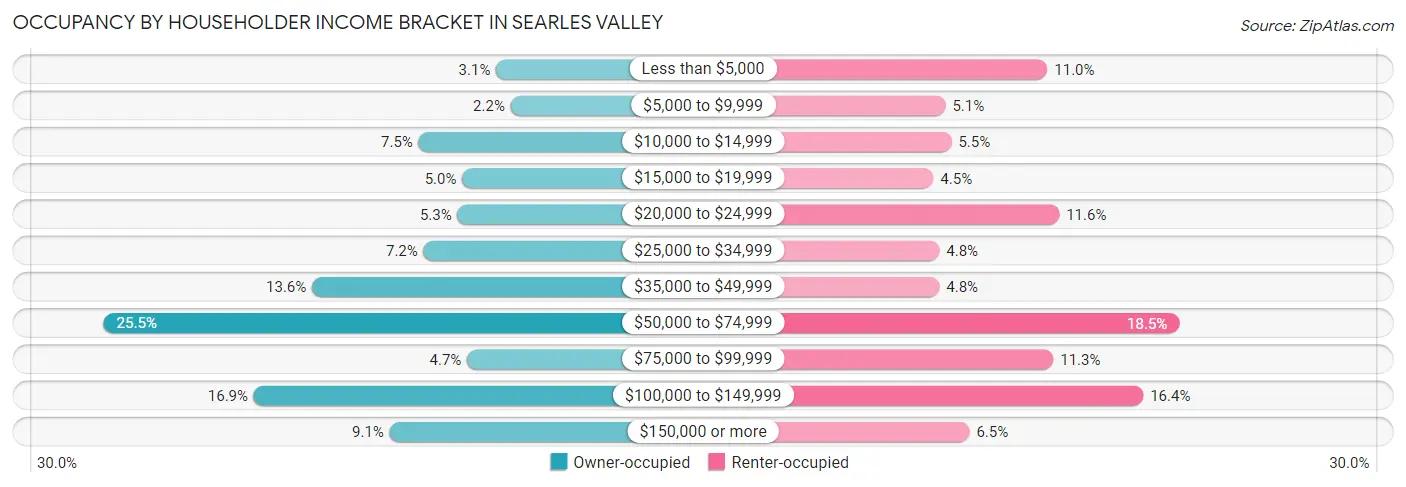
| Income Bracket | Owner-occupied | Renter-occupied |
| Less than $5,000 | 11 (3.0%) | 32 (11.0%) |
| $5,000 to $9,999 | 8 (2.2%) | 15 (5.1%) |
| $10,000 to $14,999 | 27 (7.5%) | 16 (5.5%) |
| $15,000 to $19,999 | 18 (5.0%) | 13 (4.4%) |
| $20,000 to $24,999 | 19 (5.3%) | 34 (11.6%) |
| $25,000 to $34,999 | 26 (7.2%) | 14 (4.8%) |
| $35,000 to $49,999 | 49 (13.6%) | 14 (4.8%) |
| $50,000 to $74,999 | 92 (25.5%) | 54 (18.5%) |
| $75,000 to $99,999 | 17 (4.7%) | 33 (11.3%) |
| $100,000 to $149,999 | 61 (16.9%) | 48 (16.4%) |
| $150,000 or more | 33 (9.1%) | 19 (6.5%) |
| Total | 361 (100.0%) | 292 (100.0%) |
Monthly Housing Cost Tiers in Searles Valley
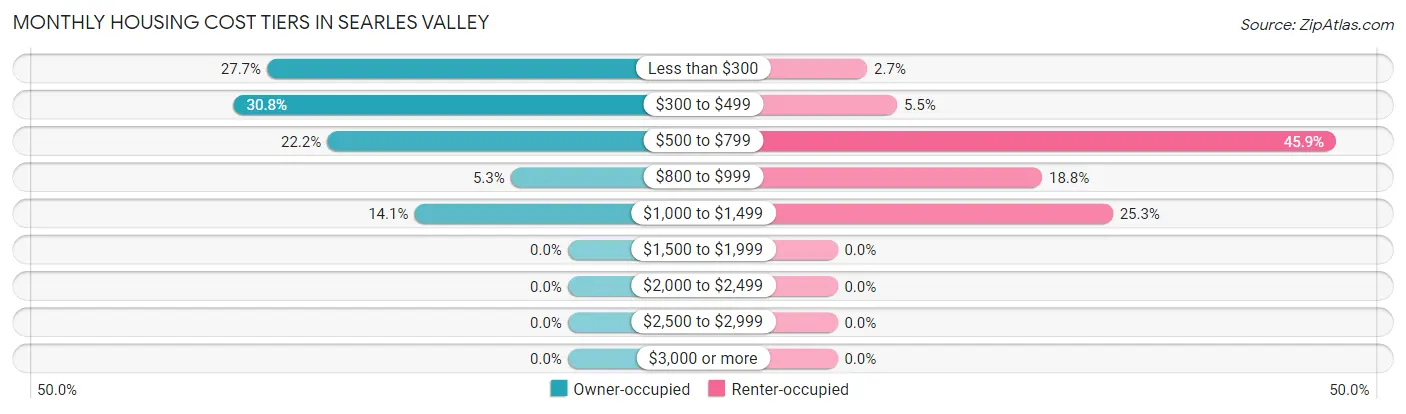
| Monthly Cost | Owner-occupied | Renter-occupied |
| Less than $300 | 100 (27.7%) | 8 (2.7%) |
| $300 to $499 | 111 (30.7%) | 16 (5.5%) |
| $500 to $799 | 80 (22.2%) | 134 (45.9%) |
| $800 to $999 | 19 (5.3%) | 55 (18.8%) |
| $1,000 to $1,499 | 51 (14.1%) | 74 (25.3%) |
| $1,500 to $1,999 | 0 (0.0%) | 0 (0.0%) |
| $2,000 to $2,499 | 0 (0.0%) | 0 (0.0%) |
| $2,500 to $2,999 | 0 (0.0%) | 0 (0.0%) |
| $3,000 or more | 0 (0.0%) | 0 (0.0%) |
| Total | 361 (100.0%) | 292 (100.0%) |
Physical Housing Characteristics in Searles Valley
Housing Structures in Searles Valley
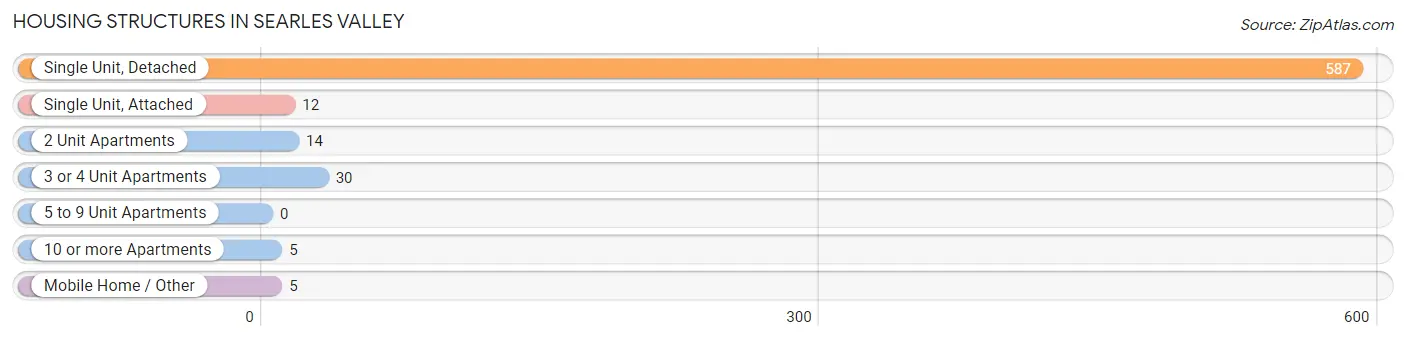
| Structure Type | # Housing Units | % Housing Units |
| Single Unit, Detached | 587 | 89.9% |
| Single Unit, Attached | 12 | 1.8% |
| 2 Unit Apartments | 14 | 2.1% |
| 3 or 4 Unit Apartments | 30 | 4.6% |
| 5 to 9 Unit Apartments | 0 | 0.0% |
| 10 or more Apartments | 5 | 0.8% |
| Mobile Home / Other | 5 | 0.8% |
| Total | 653 | 100.0% |
Housing Structures by Occupancy in Searles Valley
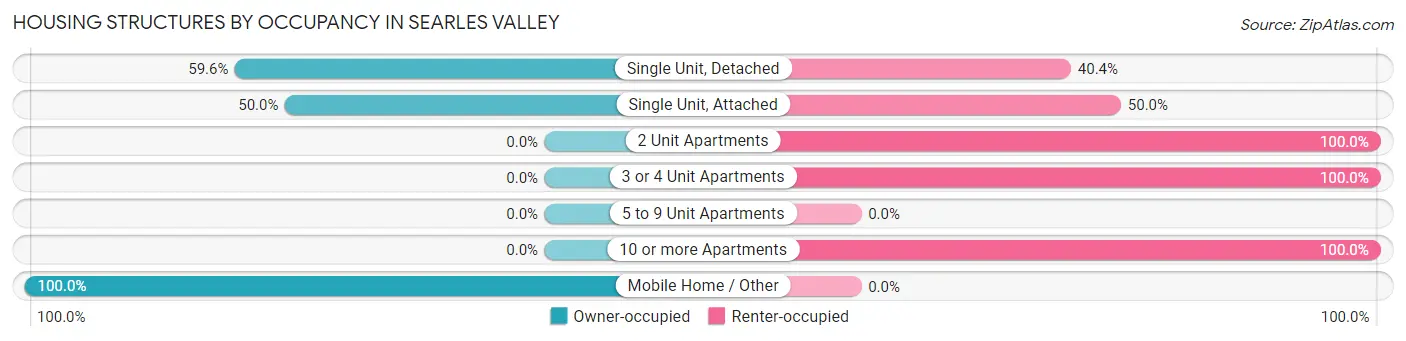
| Structure Type | Owner-occupied | Renter-occupied |
| Single Unit, Detached | 350 (59.6%) | 237 (40.4%) |
| Single Unit, Attached | 6 (50.0%) | 6 (50.0%) |
| 2 Unit Apartments | 0 (0.0%) | 14 (100.0%) |
| 3 or 4 Unit Apartments | 0 (0.0%) | 30 (100.0%) |
| 5 to 9 Unit Apartments | 0 (0.0%) | 0 (0.0%) |
| 10 or more Apartments | 0 (0.0%) | 5 (100.0%) |
| Mobile Home / Other | 5 (100.0%) | 0 (0.0%) |
| Total | 361 (55.3%) | 292 (44.7%) |
Housing Structures by Number of Rooms in Searles Valley
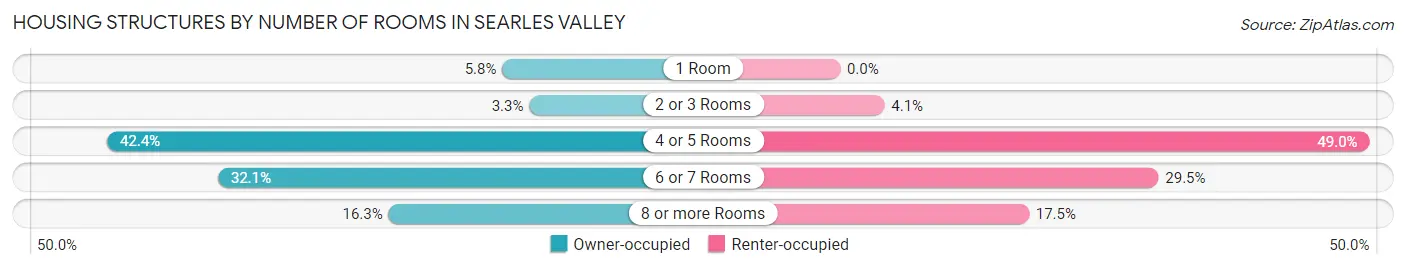
| Number of Rooms | Owner-occupied | Renter-occupied |
| 1 Room | 21 (5.8%) | 0 (0.0%) |
| 2 or 3 Rooms | 12 (3.3%) | 12 (4.1%) |
| 4 or 5 Rooms | 153 (42.4%) | 143 (49.0%) |
| 6 or 7 Rooms | 116 (32.1%) | 86 (29.4%) |
| 8 or more Rooms | 59 (16.3%) | 51 (17.5%) |
| Total | 361 (100.0%) | 292 (100.0%) |
Housing Structure by Heating Type in Searles Valley
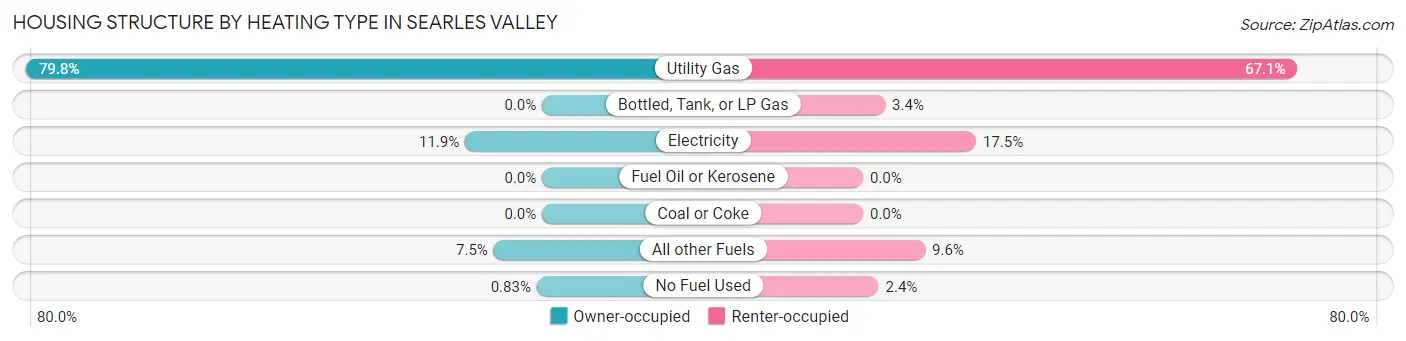
| Heating Type | Owner-occupied | Renter-occupied |
| Utility Gas | 288 (79.8%) | 196 (67.1%) |
| Bottled, Tank, or LP Gas | 0 (0.0%) | 10 (3.4%) |
| Electricity | 43 (11.9%) | 51 (17.5%) |
| Fuel Oil or Kerosene | 0 (0.0%) | 0 (0.0%) |
| Coal or Coke | 0 (0.0%) | 0 (0.0%) |
| All other Fuels | 27 (7.5%) | 28 (9.6%) |
| No Fuel Used | 3 (0.8%) | 7 (2.4%) |
| Total | 361 (100.0%) | 292 (100.0%) |
Household Vehicle Usage in Searles Valley
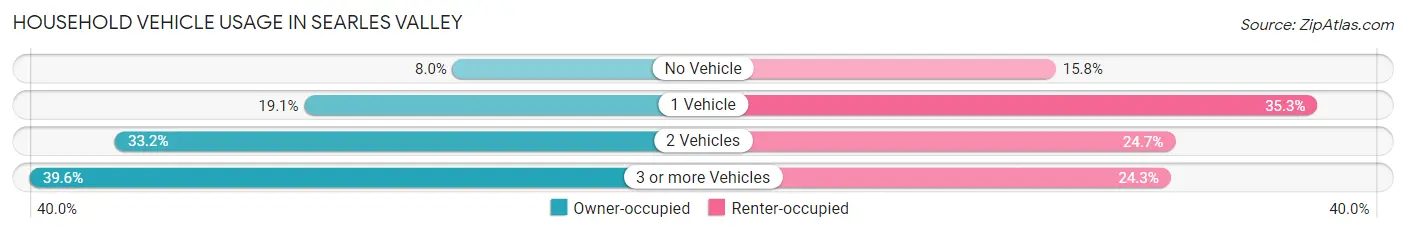
| Vehicles per Household | Owner-occupied | Renter-occupied |
| No Vehicle | 29 (8.0%) | 46 (15.8%) |
| 1 Vehicle | 69 (19.1%) | 103 (35.3%) |
| 2 Vehicles | 120 (33.2%) | 72 (24.7%) |
| 3 or more Vehicles | 143 (39.6%) | 71 (24.3%) |
| Total | 361 (100.0%) | 292 (100.0%) |
Real Estate & Mortgages in Searles Valley
Real Estate and Mortgage Overview in Searles Valley
| Characteristic | Without Mortgage | With Mortgage |
| Housing Units | 265 | 96 |
| Median Property Value | $68,900 | $97,100 |
| Median Household Income | $43,125 | $19 |
| Monthly Housing Costs | $383 | $0 |
| Real Estate Taxes | $588 | $0 |
Property Value by Mortgage Status in Searles Valley
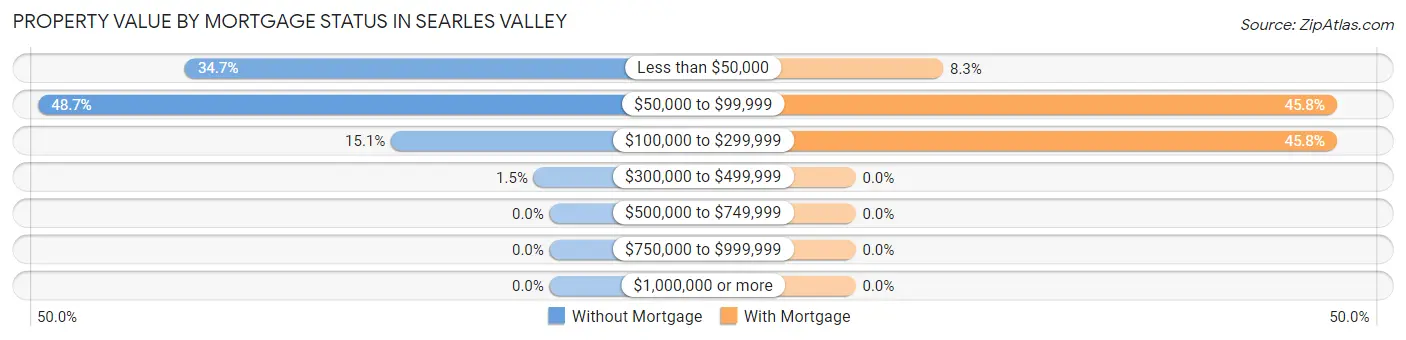
| Property Value | Without Mortgage | With Mortgage |
| Less than $50,000 | 92 (34.7%) | 8 (8.3%) |
| $50,000 to $99,999 | 129 (48.7%) | 44 (45.8%) |
| $100,000 to $299,999 | 40 (15.1%) | 44 (45.8%) |
| $300,000 to $499,999 | 4 (1.5%) | 0 (0.0%) |
| $500,000 to $749,999 | 0 (0.0%) | 0 (0.0%) |
| $750,000 to $999,999 | 0 (0.0%) | 0 (0.0%) |
| $1,000,000 or more | 0 (0.0%) | 0 (0.0%) |
| Total | 265 (100.0%) | 96 (100.0%) |
Household Income by Mortgage Status in Searles Valley
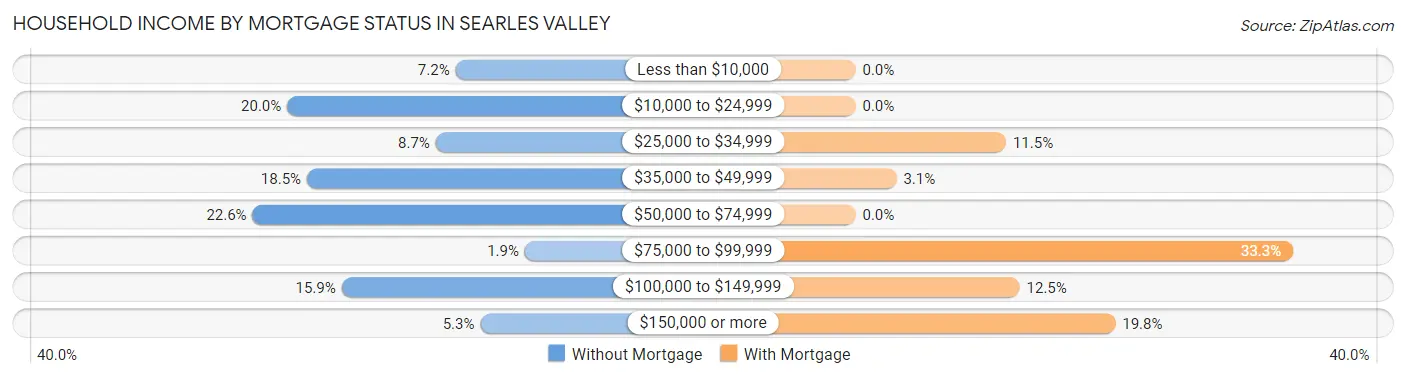
| Household Income | Without Mortgage | With Mortgage |
| Less than $10,000 | 19 (7.2%) | 0 (0.0%) |
| $10,000 to $24,999 | 53 (20.0%) | 0 (0.0%) |
| $25,000 to $34,999 | 23 (8.7%) | 11 (11.5%) |
| $35,000 to $49,999 | 49 (18.5%) | 3 (3.1%) |
| $50,000 to $74,999 | 60 (22.6%) | 0 (0.0%) |
| $75,000 to $99,999 | 5 (1.9%) | 32 (33.3%) |
| $100,000 to $149,999 | 42 (15.9%) | 12 (12.5%) |
| $150,000 or more | 14 (5.3%) | 19 (19.8%) |
| Total | 265 (100.0%) | 96 (100.0%) |
Property Value to Household Income Ratio in Searles Valley
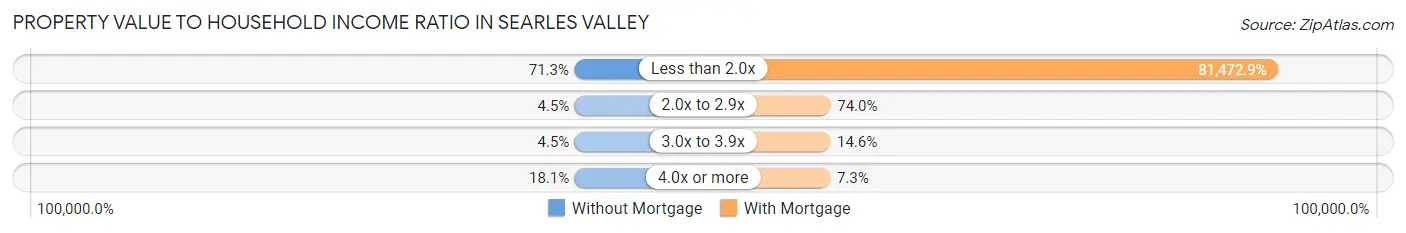
| Value-to-Income Ratio | Without Mortgage | With Mortgage |
| Less than 2.0x | 189 (71.3%) | 78,214 (81,472.9%) |
| 2.0x to 2.9x | 12 (4.5%) | 71 (74.0%) |
| 3.0x to 3.9x | 12 (4.5%) | 14 (14.6%) |
| 4.0x or more | 48 (18.1%) | 7 (7.3%) |
| Total | 265 (100.0%) | 96 (100.0%) |
Real Estate Taxes by Mortgage Status in Searles Valley
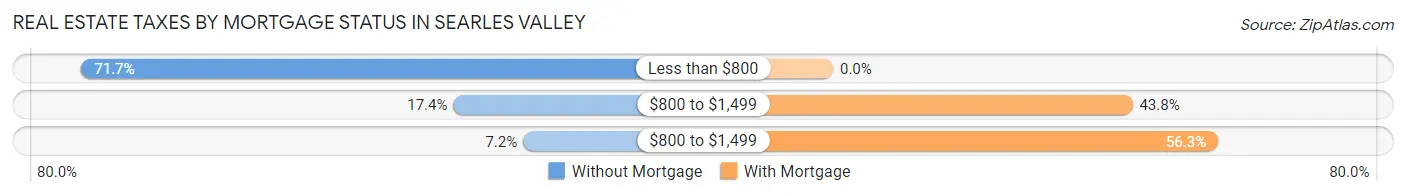
| Property Taxes | Without Mortgage | With Mortgage |
| Less than $800 | 190 (71.7%) | 0 (0.0%) |
| $800 to $1,499 | 46 (17.4%) | 42 (43.8%) |
| $800 to $1,499 | 19 (7.2%) | 54 (56.2%) |
| Total | 265 (100.0%) | 96 (100.0%) |
Health & Disability in Searles Valley
Health Insurance Coverage by Age in Searles Valley
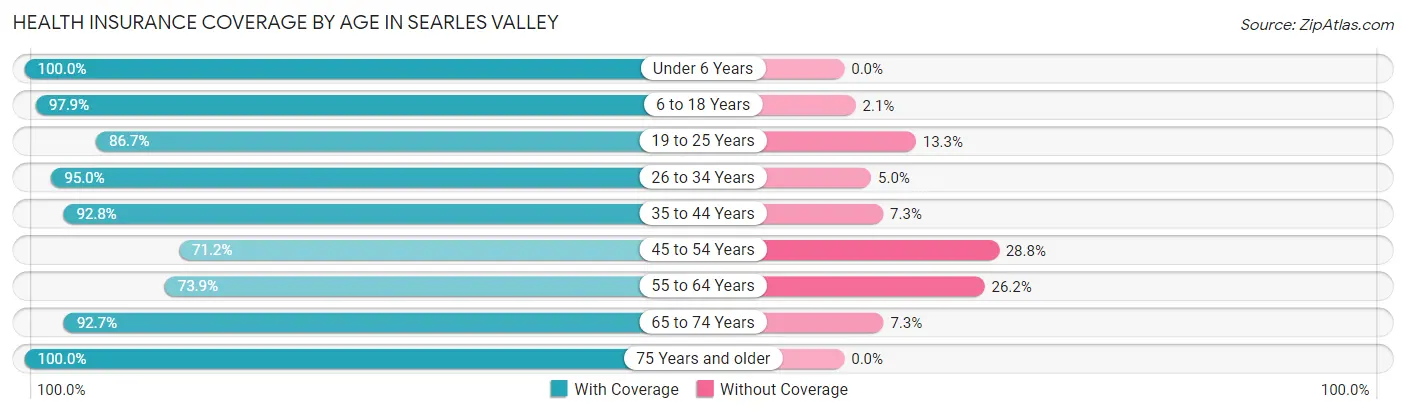
| Age Bracket | With Coverage | Without Coverage |
| Under 6 Years | 112 (100.0%) | 0 (0.0%) |
| 6 to 18 Years | 464 (97.9%) | 10 (2.1%) |
| 19 to 25 Years | 91 (86.7%) | 14 (13.3%) |
| 26 to 34 Years | 133 (95.0%) | 7 (5.0%) |
| 35 to 44 Years | 243 (92.7%) | 19 (7.2%) |
| 45 to 54 Years | 89 (71.2%) | 36 (28.8%) |
| 55 to 64 Years | 192 (73.9%) | 68 (26.2%) |
| 65 to 74 Years | 127 (92.7%) | 10 (7.3%) |
| 75 Years and older | 92 (100.0%) | 0 (0.0%) |
| Total | 1,543 (90.4%) | 164 (9.6%) |
Health Insurance Coverage by Citizenship Status in Searles Valley
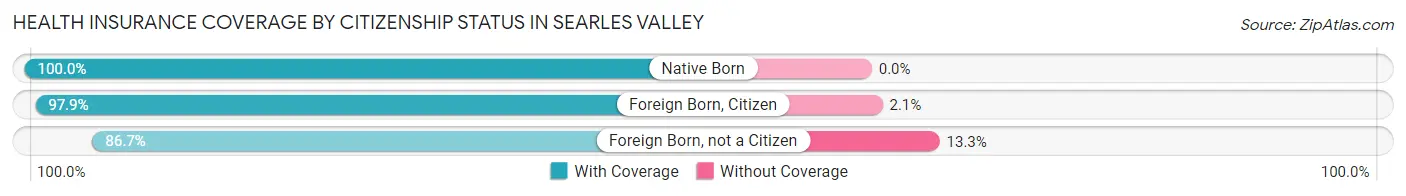
| Citizenship Status | With Coverage | Without Coverage |
| Native Born | 112 (100.0%) | 0 (0.0%) |
| Foreign Born, Citizen | 464 (97.9%) | 10 (2.1%) |
| Foreign Born, not a Citizen | 91 (86.7%) | 14 (13.3%) |
Health Insurance Coverage by Household Income in Searles Valley
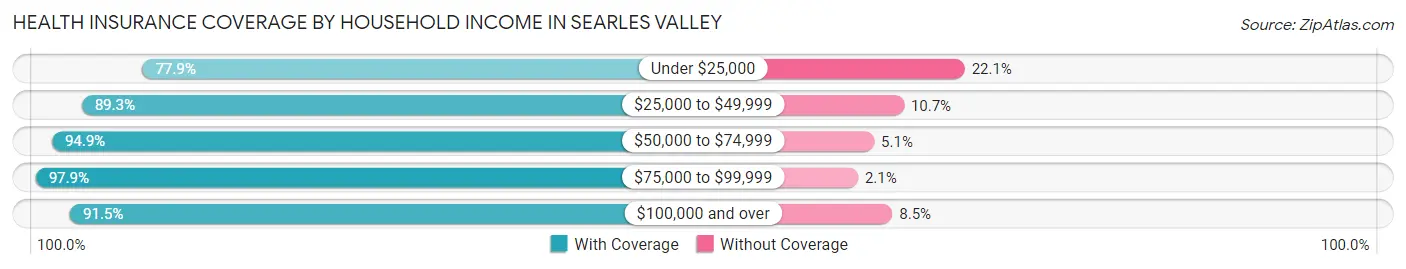
| Household Income | With Coverage | Without Coverage |
| Under $25,000 | 254 (77.9%) | 72 (22.1%) |
| $25,000 to $49,999 | 225 (89.3%) | 27 (10.7%) |
| $50,000 to $74,999 | 444 (94.9%) | 24 (5.1%) |
| $75,000 to $99,999 | 234 (97.9%) | 5 (2.1%) |
| $100,000 and over | 386 (91.5%) | 36 (8.5%) |
Public vs Private Health Insurance Coverage by Age in Searles Valley
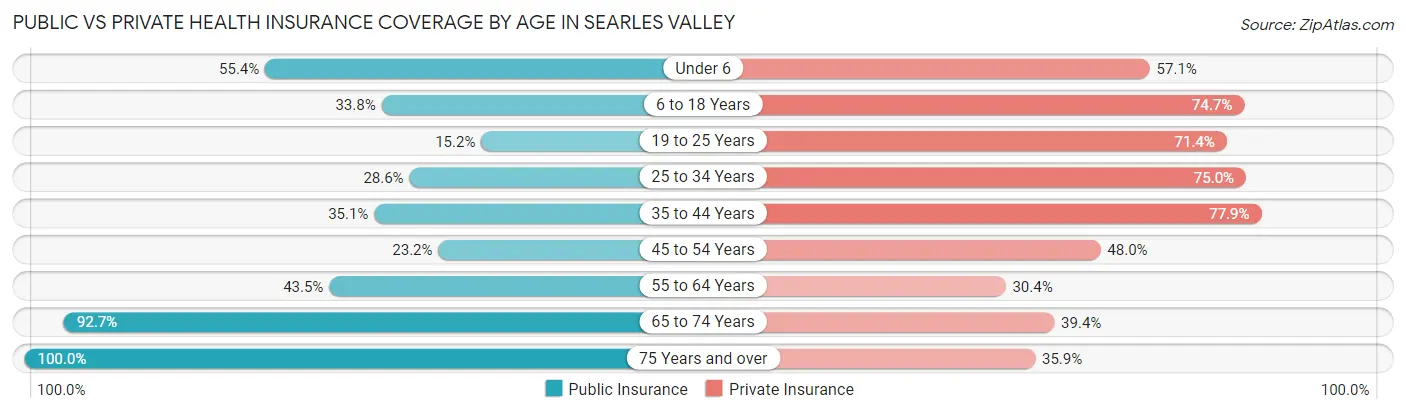
| Age Bracket | Public Insurance | Private Insurance |
| Under 6 | 62 (55.4%) | 64 (57.1%) |
| 6 to 18 Years | 160 (33.8%) | 354 (74.7%) |
| 19 to 25 Years | 16 (15.2%) | 75 (71.4%) |
| 25 to 34 Years | 40 (28.6%) | 105 (75.0%) |
| 35 to 44 Years | 92 (35.1%) | 204 (77.9%) |
| 45 to 54 Years | 29 (23.2%) | 60 (48.0%) |
| 55 to 64 Years | 113 (43.5%) | 79 (30.4%) |
| 65 to 74 Years | 127 (92.7%) | 54 (39.4%) |
| 75 Years and over | 92 (100.0%) | 33 (35.9%) |
| Total | 731 (42.8%) | 1,028 (60.2%) |
Disability Status by Sex by Age in Searles Valley
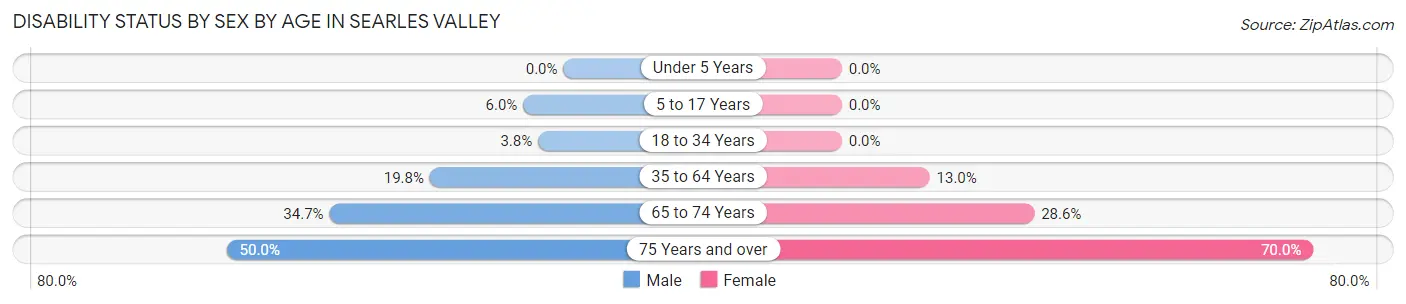
| Age Bracket | Male | Female |
| Under 5 Years | 0 (0.0%) | 0 (0.0%) |
| 5 to 17 Years | 17 (6.0%) | 0 (0.0%) |
| 18 to 34 Years | 6 (3.7%) | 0 (0.0%) |
| 35 to 64 Years | 69 (19.8%) | 39 (13.0%) |
| 65 to 74 Years | 33 (34.7%) | 12 (28.6%) |
| 75 Years and over | 21 (50.0%) | 35 (70.0%) |
Disability Class by Sex by Age in Searles Valley
Disability Class: Hearing Difficulty
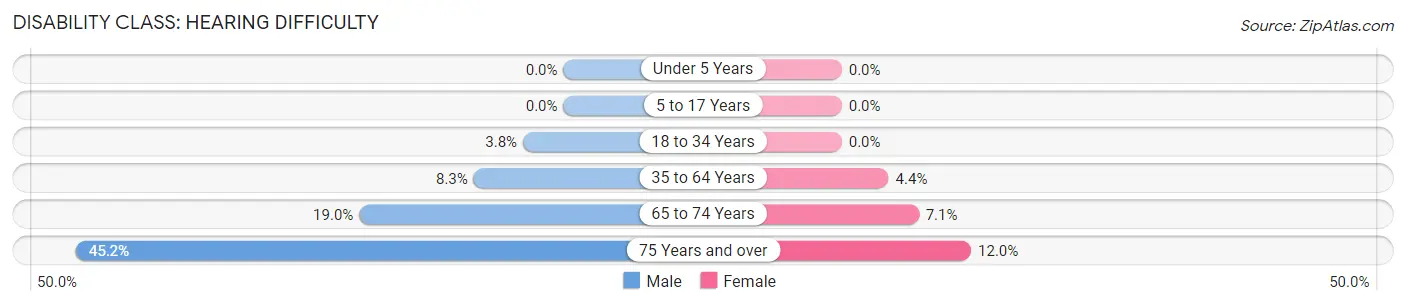
| Age Bracket | Male | Female |
| Under 5 Years | 0 (0.0%) | 0 (0.0%) |
| 5 to 17 Years | 0 (0.0%) | 0 (0.0%) |
| 18 to 34 Years | 6 (3.7%) | 0 (0.0%) |
| 35 to 64 Years | 29 (8.3%) | 13 (4.3%) |
| 65 to 74 Years | 18 (19.0%) | 3 (7.1%) |
| 75 Years and over | 19 (45.2%) | 6 (12.0%) |
Disability Class: Vision Difficulty
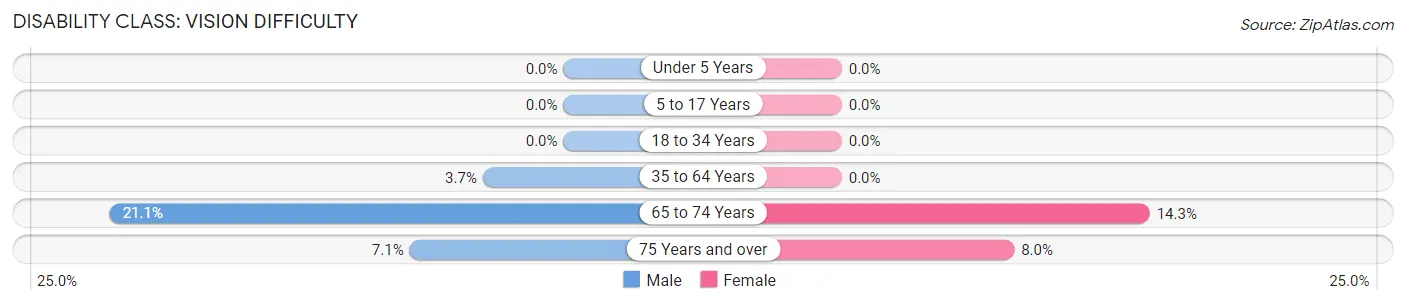
| Age Bracket | Male | Female |
| Under 5 Years | 0 (0.0%) | 0 (0.0%) |
| 5 to 17 Years | 0 (0.0%) | 0 (0.0%) |
| 18 to 34 Years | 0 (0.0%) | 0 (0.0%) |
| 35 to 64 Years | 13 (3.7%) | 0 (0.0%) |
| 65 to 74 Years | 20 (21.0%) | 6 (14.3%) |
| 75 Years and over | 3 (7.1%) | 4 (8.0%) |
Disability Class: Cognitive Difficulty
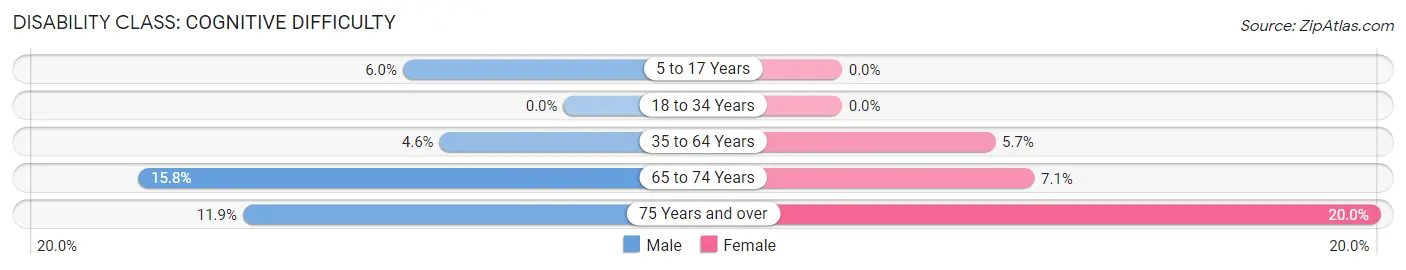
| Age Bracket | Male | Female |
| 5 to 17 Years | 17 (6.0%) | 0 (0.0%) |
| 18 to 34 Years | 0 (0.0%) | 0 (0.0%) |
| 35 to 64 Years | 16 (4.6%) | 17 (5.7%) |
| 65 to 74 Years | 15 (15.8%) | 3 (7.1%) |
| 75 Years and over | 5 (11.9%) | 10 (20.0%) |
Disability Class: Ambulatory Difficulty
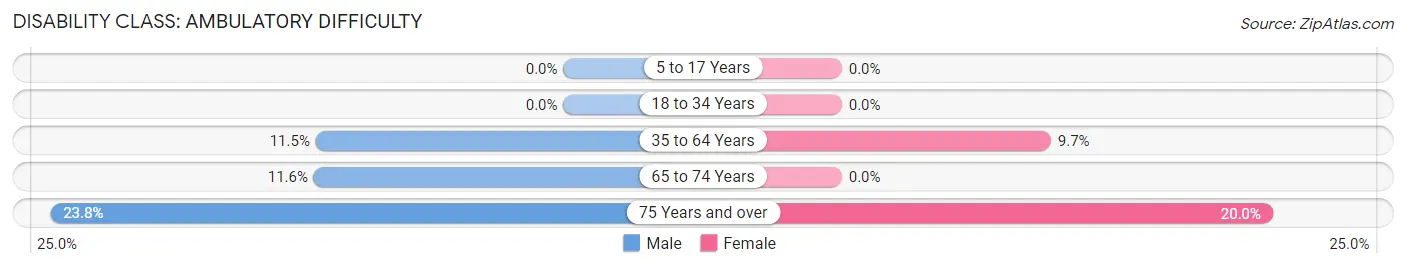
| Age Bracket | Male | Female |
| 5 to 17 Years | 0 (0.0%) | 0 (0.0%) |
| 18 to 34 Years | 0 (0.0%) | 0 (0.0%) |
| 35 to 64 Years | 40 (11.5%) | 29 (9.7%) |
| 65 to 74 Years | 11 (11.6%) | 0 (0.0%) |
| 75 Years and over | 10 (23.8%) | 10 (20.0%) |
Disability Class: Self-Care Difficulty
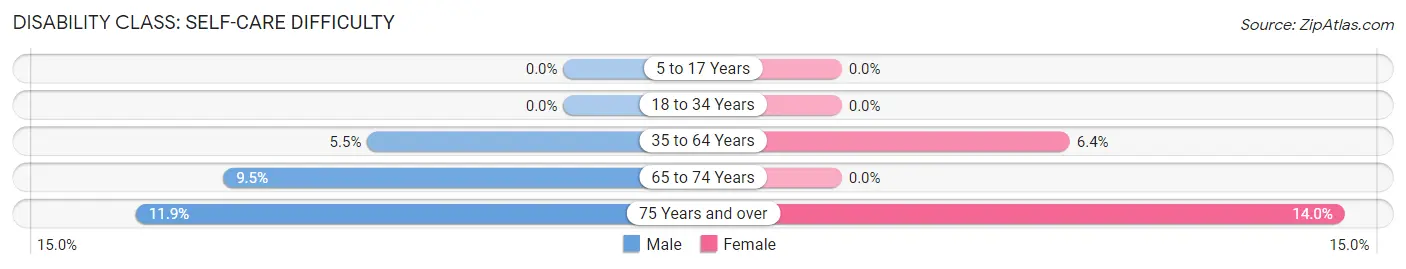
| Age Bracket | Male | Female |
| 5 to 17 Years | 0 (0.0%) | 0 (0.0%) |
| 18 to 34 Years | 0 (0.0%) | 0 (0.0%) |
| 35 to 64 Years | 19 (5.5%) | 19 (6.4%) |
| 65 to 74 Years | 9 (9.5%) | 0 (0.0%) |
| 75 Years and over | 5 (11.9%) | 7 (14.0%) |
Technology Access in Searles Valley
Computing Device Access in Searles Valley
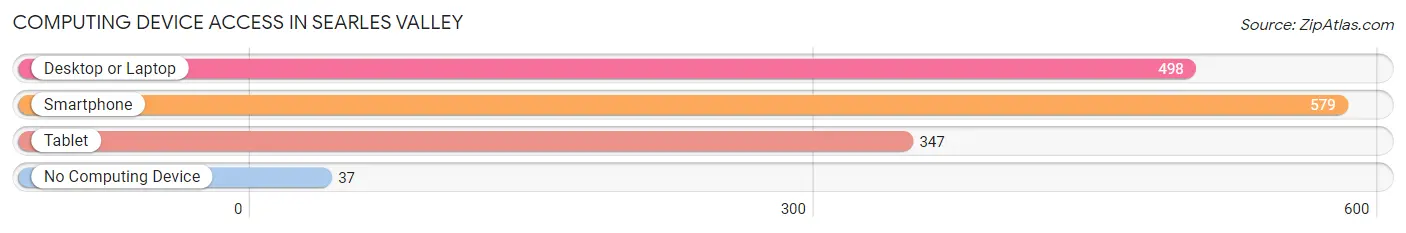
| Device Type | # Households | % Households |
| Desktop or Laptop | 498 | 76.3% |
| Smartphone | 579 | 88.7% |
| Tablet | 347 | 53.1% |
| No Computing Device | 37 | 5.7% |
| Total | 653 | 100.0% |
Internet Access in Searles Valley
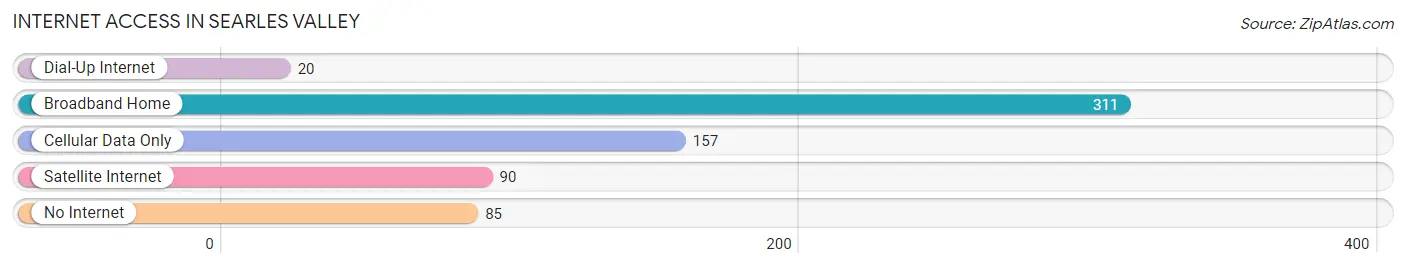
| Internet Type | # Households | % Households |
| Dial-Up Internet | 20 | 3.1% |
| Broadband Home | 311 | 47.6% |
| Cellular Data Only | 157 | 24.0% |
| Satellite Internet | 90 | 13.8% |
| No Internet | 85 | 13.0% |
| Total | 653 | 100.0% |
Searles Valley Summary
Searles Valley is a small, unincorporated community located in the Mojave Desert of San Bernardino County, California. It is situated in the northern part of the county, about 25 miles northeast of Barstow and about 75 miles northeast of Los Angeles. The area is known for its unique geology, which includes the Searles Lake, a dry lake bed that is the largest source of borax in the world. The area is also home to several Native American tribes, including the Chemehuevi, the Kawaiisu, and the Timbisha Shoshone.
Geography
Searles Valley is located in the northern part of San Bernardino County, in the Mojave Desert. It is bordered by the San Bernardino Mountains to the west, the Panamint Range to the east, and the Argus Range to the south. The area is characterized by its dry climate, with temperatures ranging from the mid-90s in the summer to the mid-50s in the winter. The area is also known for its unique geology, which includes the Searles Lake, a dry lake bed that is the largest source of borax in the world.
History
The area now known as Searles Valley has been inhabited by Native American tribes for thousands of years. The Chemehuevi, the Kawaiisu, and the Timbisha Shoshone all lived in the area prior to the arrival of European settlers. The first Europeans to settle in the area were miners, who arrived in the late 19th century in search of gold and silver. The area was also home to several borax mining operations, which began in the late 19th century and continued until the mid-20th century.
Economy
Searles Valley is an unincorporated community, and as such, does not have its own economy. The area is largely dependent on the nearby cities of Barstow and Trona for employment and services. The area is home to several borax mining operations, which are the primary source of employment in the area. The area is also home to several Native American tribes, which operate casinos and other businesses in the area.
Demographics
As of the 2010 census, the population of Searles Valley was 1,717. The population is largely white (77.3%), with smaller percentages of Native American (7.2%), African American (3.2%), Asian (2.2%), and other races (10.1%). The median household income in the area is $37,917, and the median age is 37.7 years.
Conclusion
Searles Valley is a small, unincorporated community located in the Mojave Desert of San Bernardino County, California. It is known for its unique geology, which includes the Searles Lake, a dry lake bed that is the largest source of borax in the world. The area is also home to several Native American tribes, which operate casinos and other businesses in the area. The area is largely dependent on the nearby cities of Barstow and Trona for employment and services. The population of Searles Valley is largely white, with smaller percentages of Native American, African American, Asian, and other races. The median household income in the area is $37,917, and the median age is 37.7 years.
Common Questions
What is Per Capita Income in Searles Valley?
Per Capita income in Searles Valley is $24,522.
What is the Median Family Income in Searles Valley?
Median Family Income in Searles Valley is $66,094.
What is the Median Household income in Searles Valley?
Median Household Income in Searles Valley is $54,013.
What is Income or Wage Gap in Searles Valley?
Income or Wage Gap in Searles Valley is 47.5%.
Women in Searles Valley earn 52.5 cents for every dollar earned by a man.
What is Family Income Deficit in Searles Valley?
Family Income Deficit in Searles Valley is $8,792.
Families that are below poverty line in Searles Valley earn $8,792 less on average than the poverty threshold level.
What is Inequality or Gini Index in Searles Valley?
Inequality or Gini Index in Searles Valley is 0.43.
What is the Total Population of Searles Valley?
Total Population of Searles Valley is 1,716.
What is the Total Male Population of Searles Valley?
Total Male Population of Searles Valley is 1,012.
What is the Total Female Population of Searles Valley?
Total Female Population of Searles Valley is 704.
What is the Ratio of Males per 100 Females in Searles Valley?
There are 143.75 Males per 100 Females in Searles Valley.
What is the Ratio of Females per 100 Males in Searles Valley?
There are 69.57 Females per 100 Males in Searles Valley.
What is the Median Population Age in Searles Valley?
Median Population Age in Searles Valley is 35.9 Years.
What is the Average Family Size in Searles Valley
Average Family Size in Searles Valley is 3.2 People.
What is the Average Household Size in Searles Valley
Average Household Size in Searles Valley is 2.6 People.
How Large is the Labor Force in Searles Valley?
There are 604 People in the Labor Forcein in Searles Valley.
What is the Percentage of People in the Labor Force in Searles Valley?
49.6% of People are in the Labor Force in Searles Valley.
What is the Unemployment Rate in Searles Valley?
Unemployment Rate in Searles Valley is 8.9%.