Copperopolis, CA Map & Demographics
Copperopolis Map
Copperopolis Overview
$42,347
PER CAPITA INCOME
$103,159
AVG FAMILY INCOME
$96,250
AVG HOUSEHOLD INCOME
40.5%
WAGE / INCOME GAP [ % ]
59.5¢/ $1
WAGE / INCOME GAP [ $ ]
0.41
INEQUALITY / GINI INDEX
3,819
TOTAL POPULATION
1,772
MALE POPULATION
2,047
FEMALE POPULATION
86.57
MALES / 100 FEMALES
115.52
FEMALES / 100 MALES
43.7
MEDIAN AGE
3.2
AVG FAMILY SIZE
2.8
AVG HOUSEHOLD SIZE
1,679
LABOR FORCE [ PEOPLE ]
54.2%
PERCENT IN LABOR FORCE
9.5%
UNEMPLOYMENT RATE
Copperopolis Zip Codes
Copperopolis Area Codes
Income in Copperopolis
Income Overview in Copperopolis
Per Capita Income in Copperopolis is $42,347, while median incomes of families and households are $103,159 and $96,250 respectively.
| Characteristic | Number | Measure |
| Per Capita Income | 3,819 | $42,347 |
| Median Family Income | 1,063 | $103,159 |
| Mean Family Income | 1,063 | $121,210 |
| Median Household Income | 1,352 | $96,250 |
| Mean Household Income | 1,352 | $113,846 |
| Income Deficit | 1,063 | $0 |
| Wage / Income Gap (%) | 3,819 | 40.48% |
| Wage / Income Gap ($) | 3,819 | 59.52¢ per $1 |
| Gini / Inequality Index | 3,819 | 0.41 |
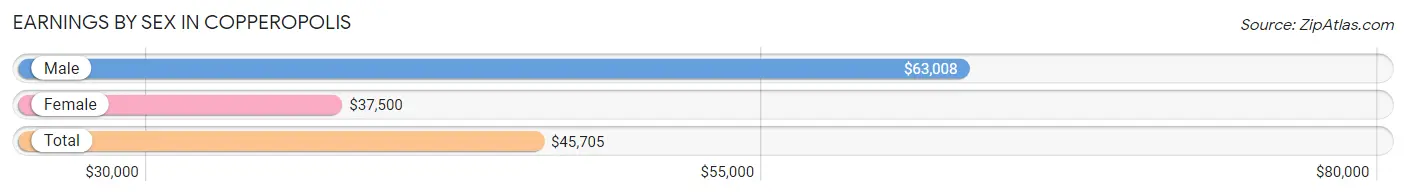
Earnings by Sex in Copperopolis
Average Earnings in Copperopolis are $45,705, $63,008 for men and $37,500 for women, a difference of 40.5%.
| Sex | Number | Average Earnings |
| Male | 773 (46.7%) | $63,008 |
| Female | 884 (53.3%) | $37,500 |
| Total | 1,657 (100.0%) | $45,705 |
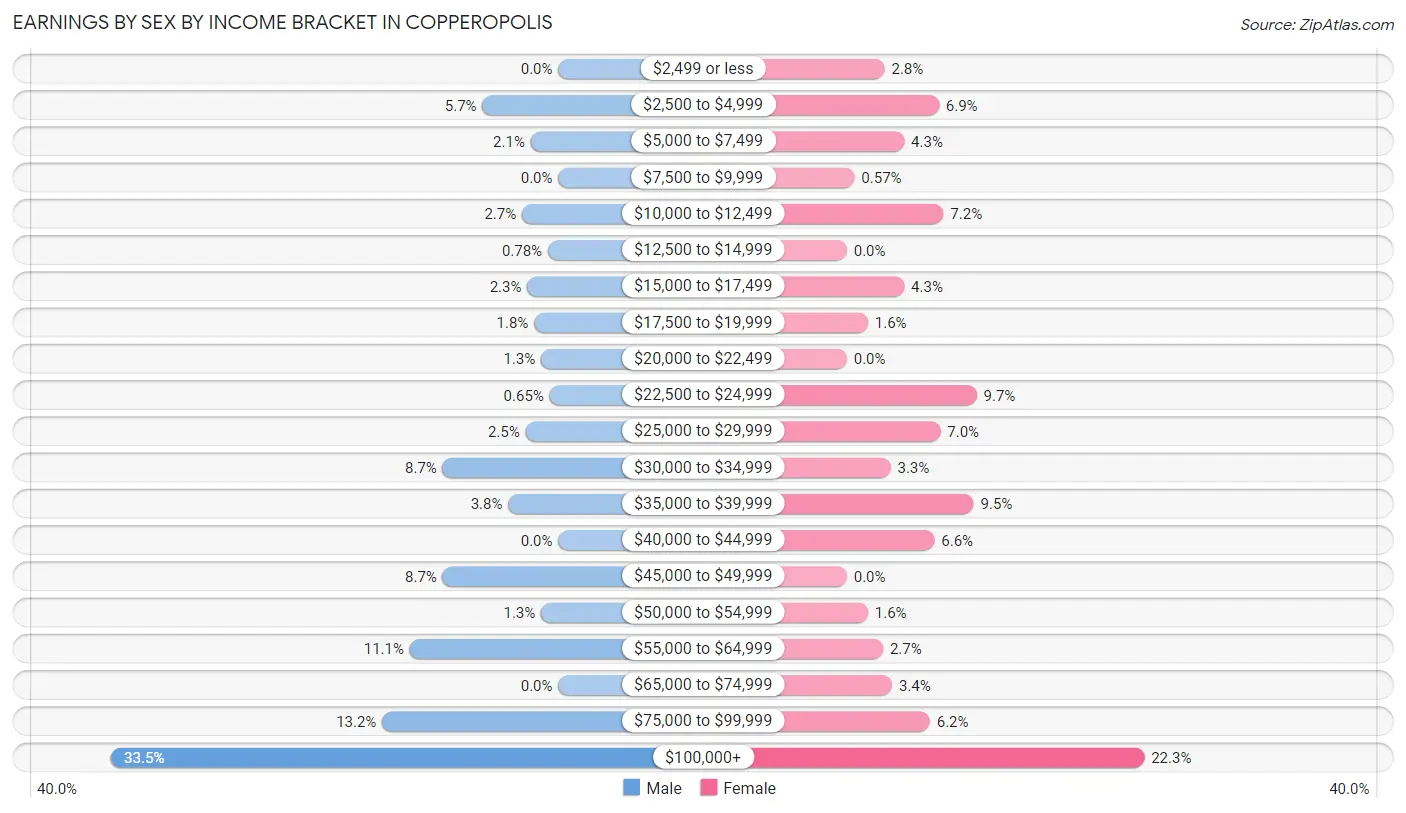
Earnings by Sex by Income Bracket in Copperopolis
The most common earnings brackets in Copperopolis are $100,000+ for men (259 | 33.5%) and $100,000+ for women (197 | 22.3%).
| Income | Male | Female |
| $2,499 or less | 0 (0.0%) | 25 (2.8%) |
| $2,500 to $4,999 | 44 (5.7%) | 61 (6.9%) |
| $5,000 to $7,499 | 16 (2.1%) | 38 (4.3%) |
| $7,500 to $9,999 | 0 (0.0%) | 5 (0.6%) |
| $10,000 to $12,499 | 21 (2.7%) | 64 (7.2%) |
| $12,500 to $14,999 | 6 (0.8%) | 0 (0.0%) |
| $15,000 to $17,499 | 18 (2.3%) | 38 (4.3%) |
| $17,500 to $19,999 | 14 (1.8%) | 14 (1.6%) |
| $20,000 to $22,499 | 10 (1.3%) | 0 (0.0%) |
| $22,500 to $24,999 | 5 (0.6%) | 86 (9.7%) |
| $25,000 to $29,999 | 19 (2.5%) | 62 (7.0%) |
| $30,000 to $34,999 | 67 (8.7%) | 29 (3.3%) |
| $35,000 to $39,999 | 29 (3.7%) | 84 (9.5%) |
| $40,000 to $44,999 | 0 (0.0%) | 58 (6.6%) |
| $45,000 to $49,999 | 67 (8.7%) | 0 (0.0%) |
| $50,000 to $54,999 | 10 (1.3%) | 14 (1.6%) |
| $55,000 to $64,999 | 86 (11.1%) | 24 (2.7%) |
| $65,000 to $74,999 | 0 (0.0%) | 30 (3.4%) |
| $75,000 to $99,999 | 102 (13.2%) | 55 (6.2%) |
| $100,000+ | 259 (33.5%) | 197 (22.3%) |
| Total | 773 (100.0%) | 884 (100.0%) |
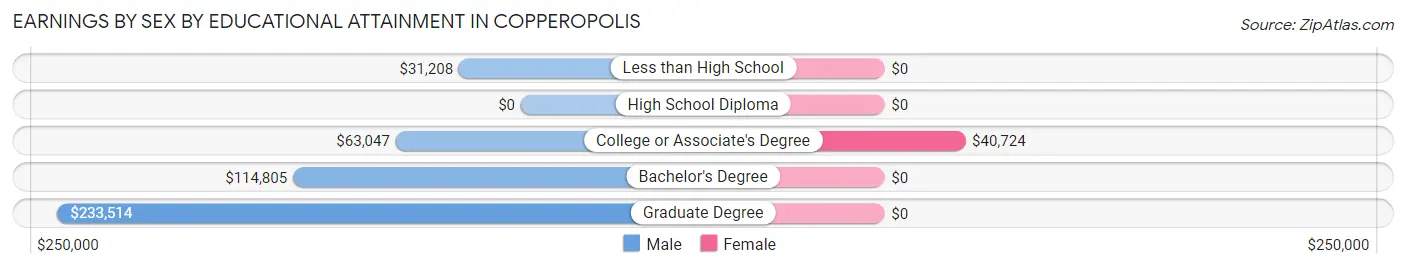
Earnings by Sex by Educational Attainment in Copperopolis
Average earnings in Copperopolis are $63,008 for men and $40,586 for women, a difference of 35.6%. Men with an educational attainment of graduate degree enjoy the highest average annual earnings of $233,514, while those with less than high school education earn the least with $31,208. Women with an educational attainment of college or associate's degree earn the most with the average annual earnings of $40,724, while those with college or associate's degree education have the smallest earnings of $40,724.
| Educational Attainment | Male Income | Female Income |
| Less than High School | $31,208 | $0 |
| High School Diploma | - | - |
| College or Associate's Degree | $63,047 | $40,724 |
| Bachelor's Degree | $114,805 | $0 |
| Graduate Degree | $233,514 | $0 |
| Total | $63,008 | $40,586 |
Family Income in Copperopolis
Family Income Brackets in Copperopolis
According to the Copperopolis family income data, there are 276 families falling into the $100,000 to $149,999 income range, which is the most common income bracket and makes up 26.0% of all families.
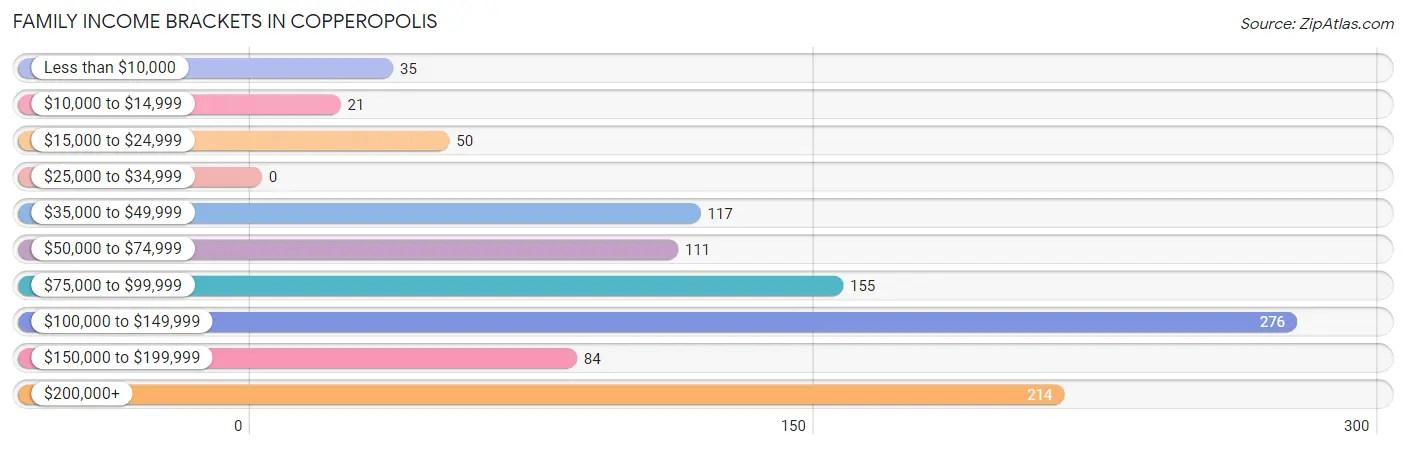
| Income Bracket | # Families | % Families |
| Less than $10,000 | 35 | 3.3% |
| $10,000 to $14,999 | 21 | 2.0% |
| $15,000 to $24,999 | 50 | 4.7% |
| $25,000 to $34,999 | 0 | 0.0% |
| $35,000 to $49,999 | 117 | 11.0% |
| $50,000 to $74,999 | 111 | 10.4% |
| $75,000 to $99,999 | 155 | 14.6% |
| $100,000 to $149,999 | 276 | 26.0% |
| $150,000 to $199,999 | 84 | 7.9% |
| $200,000+ | 214 | 20.1% |
Family Income by Famaliy Size in Copperopolis
4-person families (250 | 23.5%) account for the highest median family income in Copperopolis with $140,167 per family, while 2-person families (522 | 49.1%) have the highest median income of $44,861 per family member.
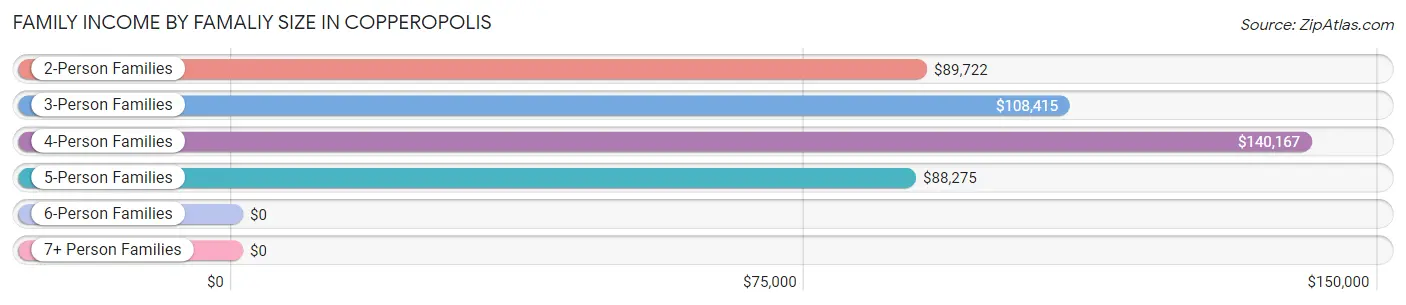
| Income Bracket | # Families | Median Income |
| 2-Person Families | 522 (49.1%) | $89,722 |
| 3-Person Families | 192 (18.1%) | $108,415 |
| 4-Person Families | 250 (23.5%) | $140,167 |
| 5-Person Families | 99 (9.3%) | $88,275 |
| 6-Person Families | 0 (0.0%) | $0 |
| 7+ Person Families | 0 (0.0%) | $0 |
| Total | 1,063 (100.0%) | $103,159 |
Family Income by Number of Earners in Copperopolis
The median family income in Copperopolis is $103,159, with families comprising 3+ earners (81) having the highest median family income of $224,183, while families with no earners (331) have the lowest median family income of $78,586, accounting for 7.6% and 31.1% of families, respectively.
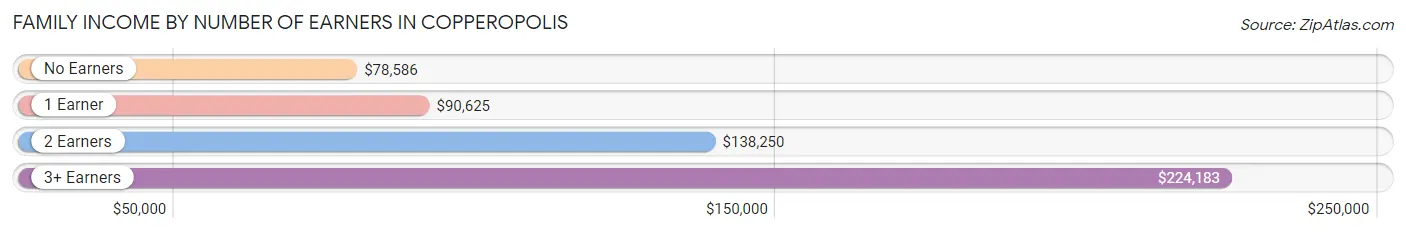
| Number of Earners | # Families | Median Income |
| No Earners | 331 (31.1%) | $78,586 |
| 1 Earner | 302 (28.4%) | $90,625 |
| 2 Earners | 349 (32.8%) | $138,250 |
| 3+ Earners | 81 (7.6%) | $224,183 |
| Total | 1,063 (100.0%) | $103,159 |
Household Income in Copperopolis
Household Income Brackets in Copperopolis
With 320 households falling in the category, the $100,000 to $149,999 income range is the most frequent in Copperopolis, accounting for 23.7% of all households. In contrast, only 32 households (2.4%) fall into the $10,000 to $14,999 income bracket, making it the least populous group.
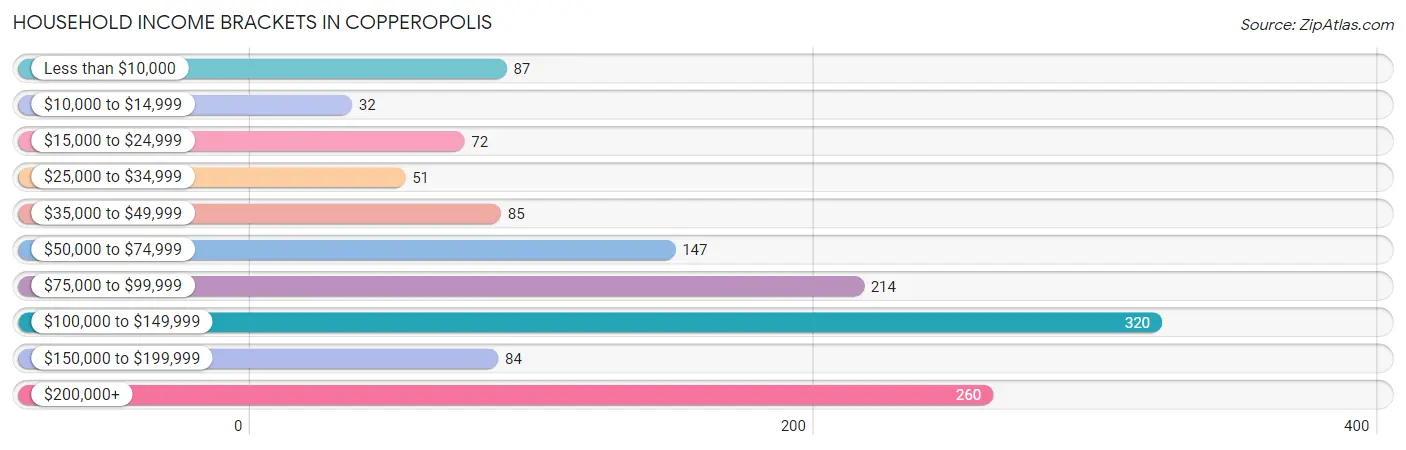
| Income Bracket | # Households | % Households |
| Less than $10,000 | 87 | 6.4% |
| $10,000 to $14,999 | 32 | 2.4% |
| $15,000 to $24,999 | 72 | 5.3% |
| $25,000 to $34,999 | 51 | 3.8% |
| $35,000 to $49,999 | 85 | 6.3% |
| $50,000 to $74,999 | 147 | 10.9% |
| $75,000 to $99,999 | 214 | 15.8% |
| $100,000 to $149,999 | 320 | 23.7% |
| $150,000 to $199,999 | 84 | 6.2% |
| $200,000+ | 260 | 19.2% |
Household Income by Householder Age in Copperopolis
The median household income in Copperopolis is $96,250, with the highest median household income of $138,000 found in the 45 to 64 years age bracket for the primary householder. A total of 570 households (42.2%) fall into this category.
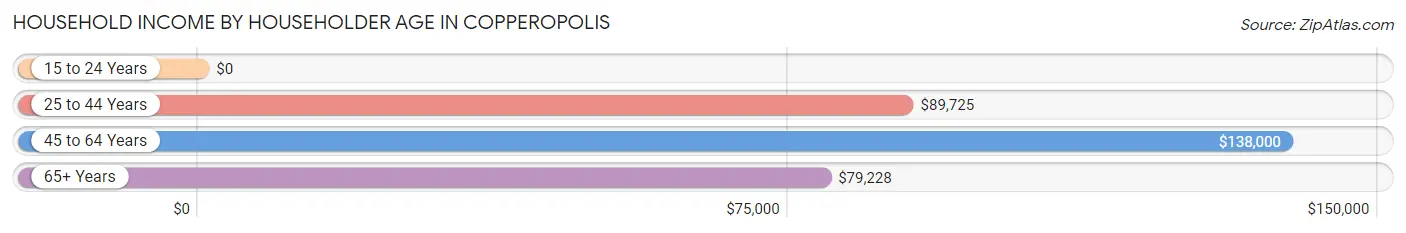
| Income Bracket | # Households | Median Income |
| 15 to 24 Years | 0 (0.0%) | $0 |
| 25 to 44 Years | 377 (27.9%) | $89,725 |
| 45 to 64 Years | 570 (42.2%) | $138,000 |
| 65+ Years | 405 (30.0%) | $79,228 |
| Total | 1,352 (100.0%) | $96,250 |
Poverty in Copperopolis
Income Below Poverty by Sex and Age in Copperopolis
With 11.8% poverty level for males and 8.7% for females among the residents of Copperopolis, 6 to 11 year old males and 5 year old females are the most vulnerable to poverty, with 25 males (22.1%) and 28 females (100.0%) in their respective age groups living below the poverty level.
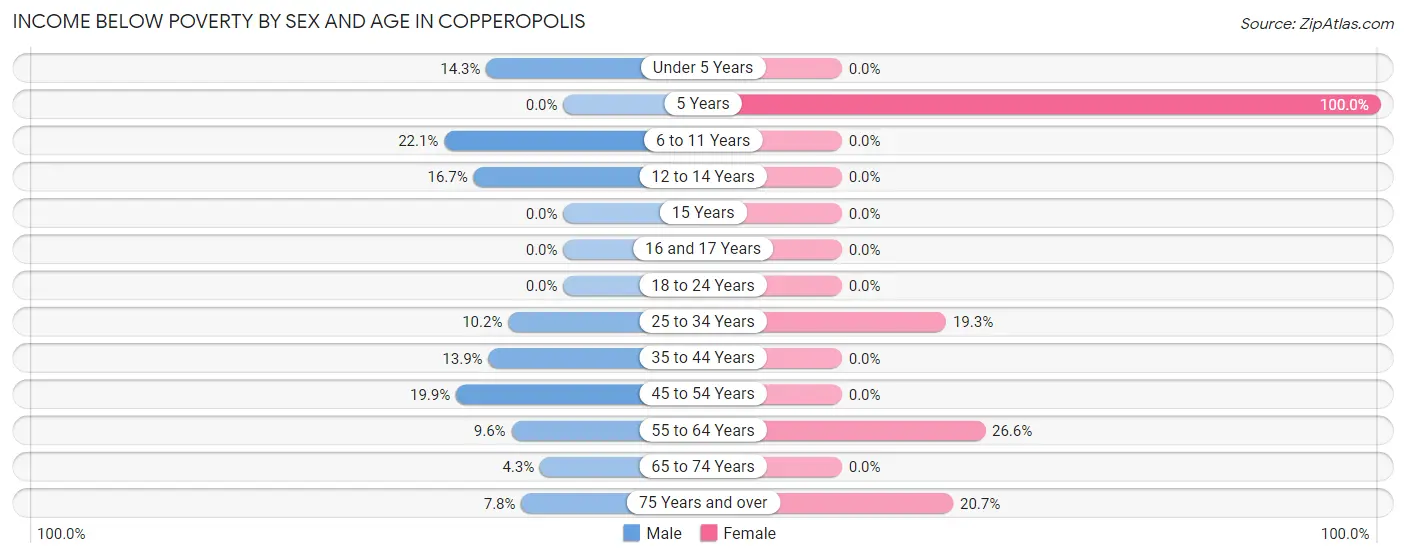
| Age Bracket | Male | Female |
| Under 5 Years | 26 (14.3%) | 0 (0.0%) |
| 5 Years | 0 (0.0%) | 28 (100.0%) |
| 6 to 11 Years | 25 (22.1%) | 0 (0.0%) |
| 12 to 14 Years | 13 (16.7%) | 0 (0.0%) |
| 15 Years | 0 (0.0%) | 0 (0.0%) |
| 16 and 17 Years | 0 (0.0%) | 0 (0.0%) |
| 18 to 24 Years | 0 (0.0%) | 0 (0.0%) |
| 25 to 34 Years | 22 (10.2%) | 47 (19.3%) |
| 35 to 44 Years | 21 (13.9%) | 0 (0.0%) |
| 45 to 54 Years | 52 (19.9%) | 0 (0.0%) |
| 55 to 64 Years | 26 (9.6%) | 71 (26.6%) |
| 65 to 74 Years | 13 (4.3%) | 0 (0.0%) |
| 75 Years and over | 12 (7.8%) | 32 (20.6%) |
| Total | 210 (11.8%) | 178 (8.7%) |
Income Above Poverty by Sex and Age in Copperopolis
According to the poverty statistics in Copperopolis, males aged 5 years and females aged under 5 years are the age groups that are most secure financially, with 100.0% of males and 100.0% of females in these age groups living above the poverty line.
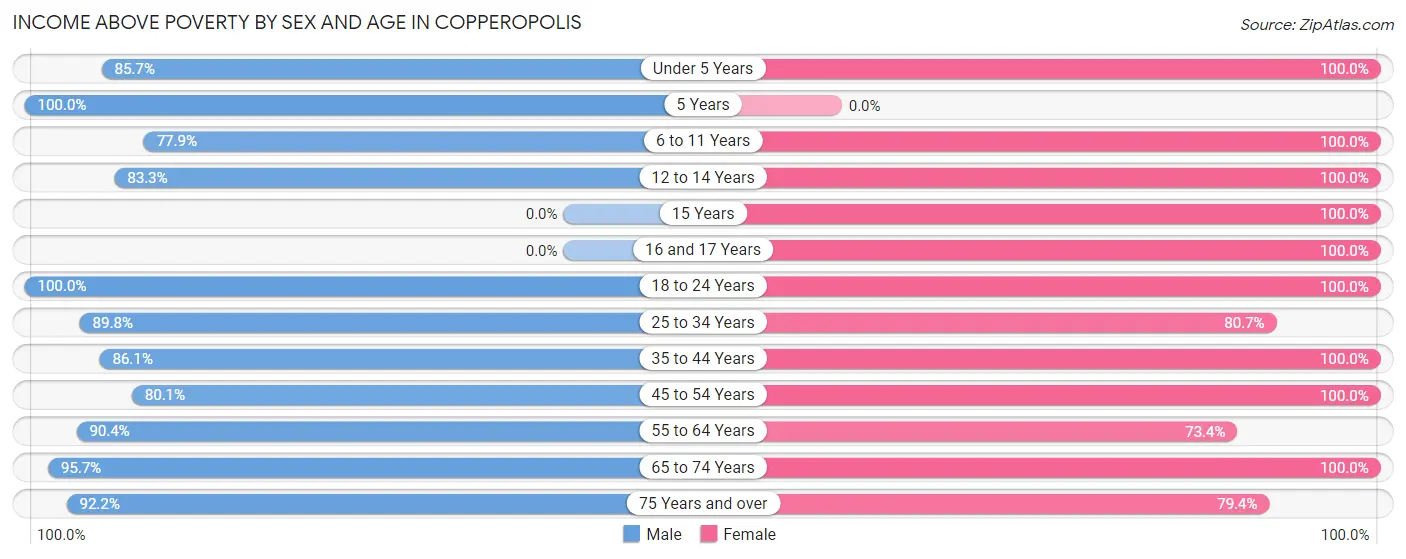
| Age Bracket | Male | Female |
| Under 5 Years | 156 (85.7%) | 71 (100.0%) |
| 5 Years | 14 (100.0%) | 0 (0.0%) |
| 6 to 11 Years | 88 (77.9%) | 106 (100.0%) |
| 12 to 14 Years | 65 (83.3%) | 84 (100.0%) |
| 15 Years | 0 (0.0%) | 45 (100.0%) |
| 16 and 17 Years | 0 (0.0%) | 102 (100.0%) |
| 18 to 24 Years | 34 (100.0%) | 133 (100.0%) |
| 25 to 34 Years | 193 (89.8%) | 196 (80.7%) |
| 35 to 44 Years | 130 (86.1%) | 365 (100.0%) |
| 45 to 54 Years | 209 (80.1%) | 215 (100.0%) |
| 55 to 64 Years | 244 (90.4%) | 196 (73.4%) |
| 65 to 74 Years | 287 (95.7%) | 233 (100.0%) |
| 75 Years and over | 142 (92.2%) | 123 (79.3%) |
| Total | 1,562 (88.1%) | 1,869 (91.3%) |
Income Below Poverty Among Married-Couple Families in Copperopolis
The poverty statistics for married-couple families in Copperopolis show that 4.5% or 38 of the total 847 families live below the poverty line. Families with no children have the highest poverty rate of 4.9%, comprising of 26 families. On the other hand, families with 3 or 4 children have the lowest poverty rate of 0.0%, which includes 0 families.
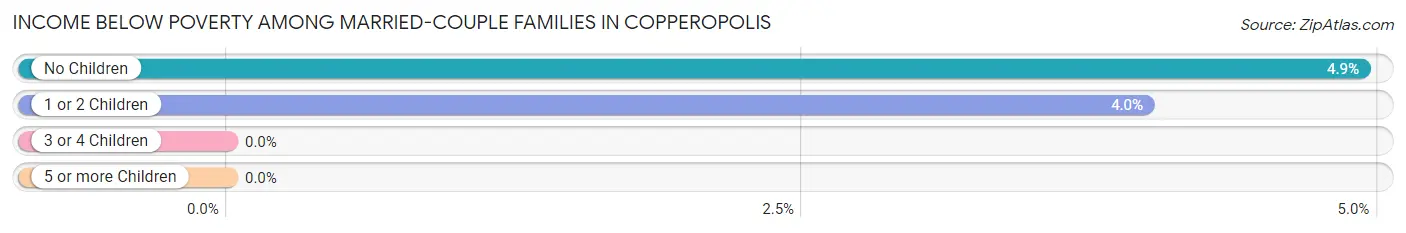
| Children | Above Poverty | Below Poverty |
| No Children | 501 (95.1%) | 26 (4.9%) |
| 1 or 2 Children | 289 (96.0%) | 12 (4.0%) |
| 3 or 4 Children | 19 (100.0%) | 0 (0.0%) |
| 5 or more Children | 0 (0.0%) | 0 (0.0%) |
| Total | 809 (95.5%) | 38 (4.5%) |
Income Below Poverty Among Single-Parent Households in Copperopolis
According to the poverty data in Copperopolis, 87.5% or 21 single-father households and 24.5% or 47 single-mother households are living below the poverty line. Among single-father households, those with 1 or 2 children have the highest poverty rate, with 21 households (100.0%) experiencing poverty. Likewise, among single-mother households, those with no children have the highest poverty rate, with 25 households (51.0%) falling below the poverty line.
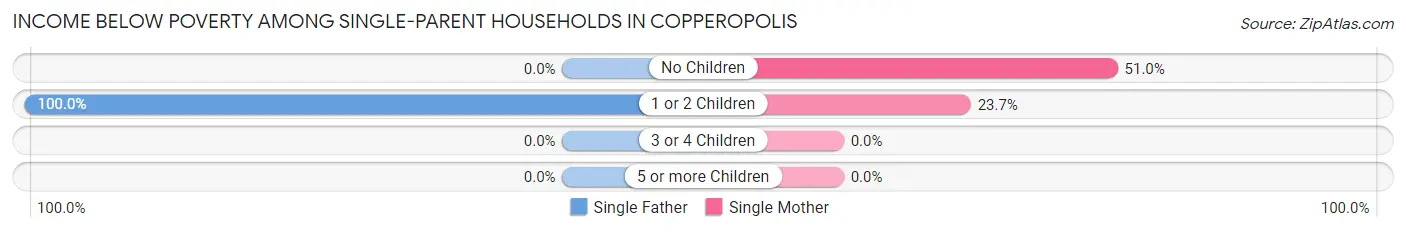
| Children | Single Father | Single Mother |
| No Children | 0 (0.0%) | 25 (51.0%) |
| 1 or 2 Children | 21 (100.0%) | 22 (23.7%) |
| 3 or 4 Children | 0 (0.0%) | 0 (0.0%) |
| 5 or more Children | 0 (0.0%) | 0 (0.0%) |
| Total | 21 (87.5%) | 47 (24.5%) |
Income Below Poverty Among Married-Couple vs Single-Parent Households in Copperopolis
The poverty data for Copperopolis shows that 38 of the married-couple family households (4.5%) and 68 of the single-parent households (31.5%) are living below the poverty level. Within the married-couple family households, those with no children have the highest poverty rate, with 26 households (4.9%) falling below the poverty line. Among the single-parent households, those with no children have the highest poverty rate, with 25 household (48.1%) living below poverty.
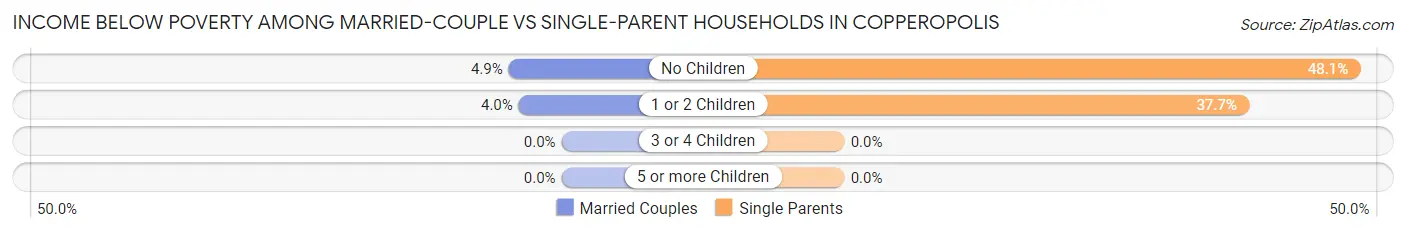
| Children | Married-Couple Families | Single-Parent Households |
| No Children | 26 (4.9%) | 25 (48.1%) |
| 1 or 2 Children | 12 (4.0%) | 43 (37.7%) |
| 3 or 4 Children | 0 (0.0%) | 0 (0.0%) |
| 5 or more Children | 0 (0.0%) | 0 (0.0%) |
| Total | 38 (4.5%) | 68 (31.5%) |
Race in Copperopolis
The most populous races in Copperopolis are White / Caucasian (2,875 | 75.3%), Hispanic or Latino (936 | 24.5%), and Two or more Races (646 | 16.9%).
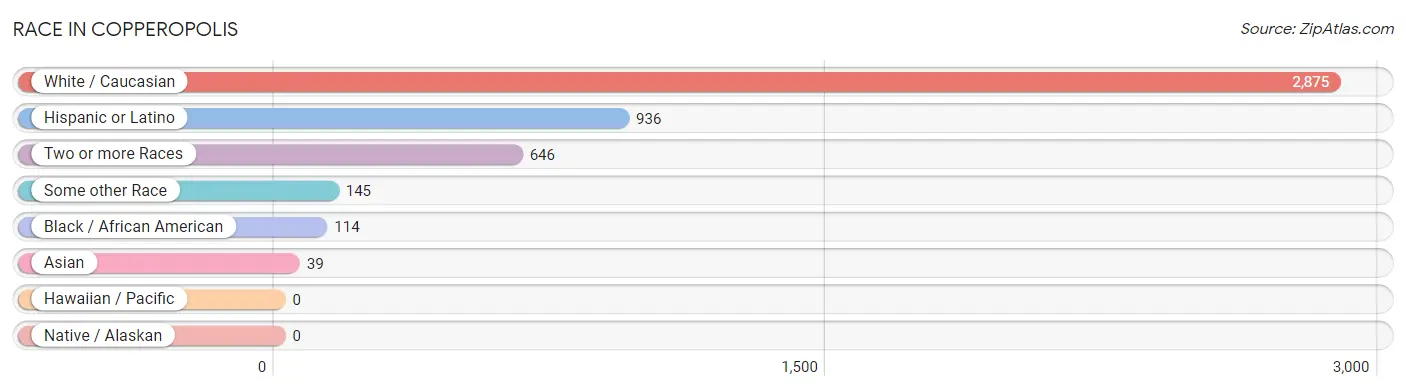
| Race | # Population | % Population |
| Asian | 39 | 1.0% |
| Black / African American | 114 | 3.0% |
| Hawaiian / Pacific | 0 | 0.0% |
| Hispanic or Latino | 936 | 24.5% |
| Native / Alaskan | 0 | 0.0% |
| White / Caucasian | 2,875 | 75.3% |
| Two or more Races | 646 | 16.9% |
| Some other Race | 145 | 3.8% |
| Total | 3,819 | 100.0% |
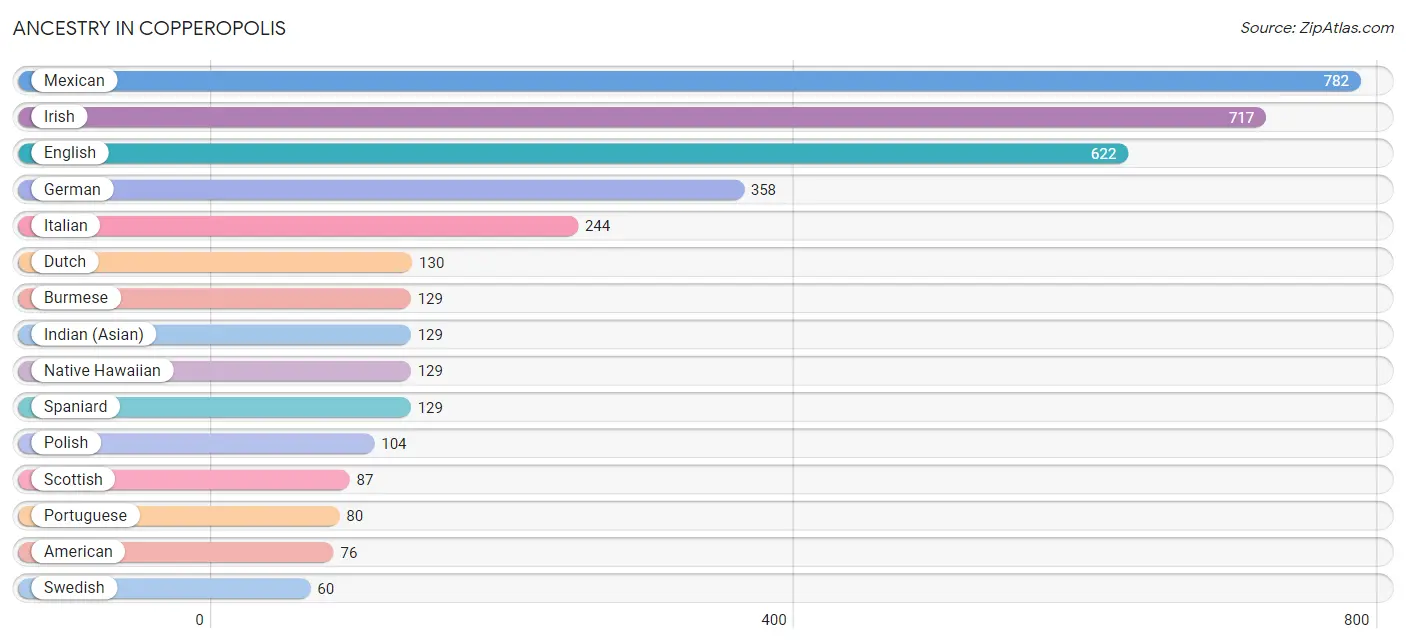
Ancestry in Copperopolis
The most populous ancestries reported in Copperopolis are Mexican (782 | 20.5%), Irish (717 | 18.8%), English (622 | 16.3%), German (358 | 9.4%), and Italian (244 | 6.4%), together accounting for 71.3% of all Copperopolis residents.
| Ancestry | # Population | % Population |
| American | 76 | 2.0% |
| Bhutanese | 12 | 0.3% |
| Burmese | 129 | 3.4% |
| Canadian | 5 | 0.1% |
| Cherokee | 13 | 0.3% |
| Danish | 27 | 0.7% |
| Dutch | 130 | 3.4% |
| Eastern European | 37 | 1.0% |
| English | 622 | 16.3% |
| European | 9 | 0.2% |
| French | 41 | 1.1% |
| German | 358 | 9.4% |
| Greek | 4 | 0.1% |
| Indian (Asian) | 129 | 3.4% |
| Irish | 717 | 18.8% |
| Italian | 244 | 6.4% |
| Korean | 39 | 1.0% |
| Mexican | 782 | 20.5% |
| Native Hawaiian | 129 | 3.4% |
| Norwegian | 44 | 1.1% |
| Polish | 104 | 2.7% |
| Portuguese | 80 | 2.1% |
| Puerto Rican | 12 | 0.3% |
| Russian | 35 | 0.9% |
| Scotch-Irish | 40 | 1.1% |
| Scottish | 87 | 2.3% |
| Spaniard | 129 | 3.4% |
| Swedish | 60 | 1.6% |
| Swiss | 13 | 0.3% |
| Welsh | 27 | 0.7% | View All 30 Rows |
Immigrants in Copperopolis
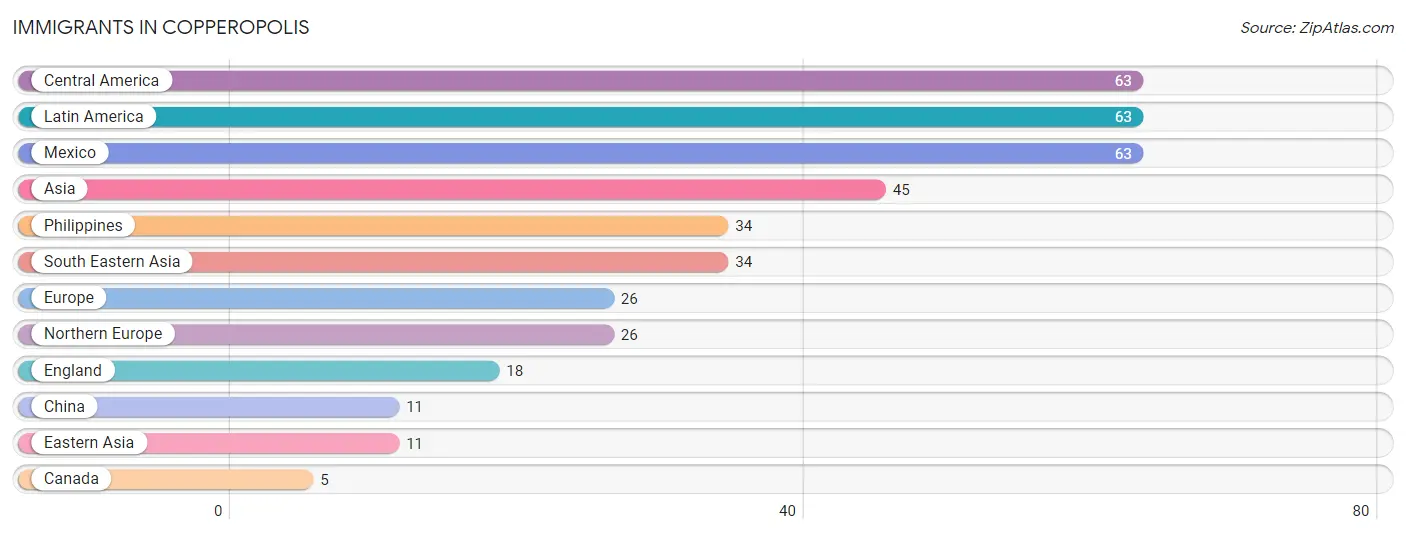
The most numerous immigrant groups reported in Copperopolis came from Central America (63 | 1.7%), Latin America (63 | 1.7%), Mexico (63 | 1.7%), Asia (45 | 1.2%), and Philippines (34 | 0.9%), together accounting for 7.0% of all Copperopolis residents.
| Immigration Origin | # Population | % Population |
| Asia | 45 | 1.2% |
| Canada | 5 | 0.1% |
| Central America | 63 | 1.7% |
| China | 11 | 0.3% |
| Eastern Asia | 11 | 0.3% |
| England | 18 | 0.5% |
| Europe | 26 | 0.7% |
| Latin America | 63 | 1.7% |
| Mexico | 63 | 1.7% |
| Northern Europe | 26 | 0.7% |
| Philippines | 34 | 0.9% |
| South Eastern Asia | 34 | 0.9% | View All 12 Rows |
Sex and Age in Copperopolis
Sex and Age in Copperopolis
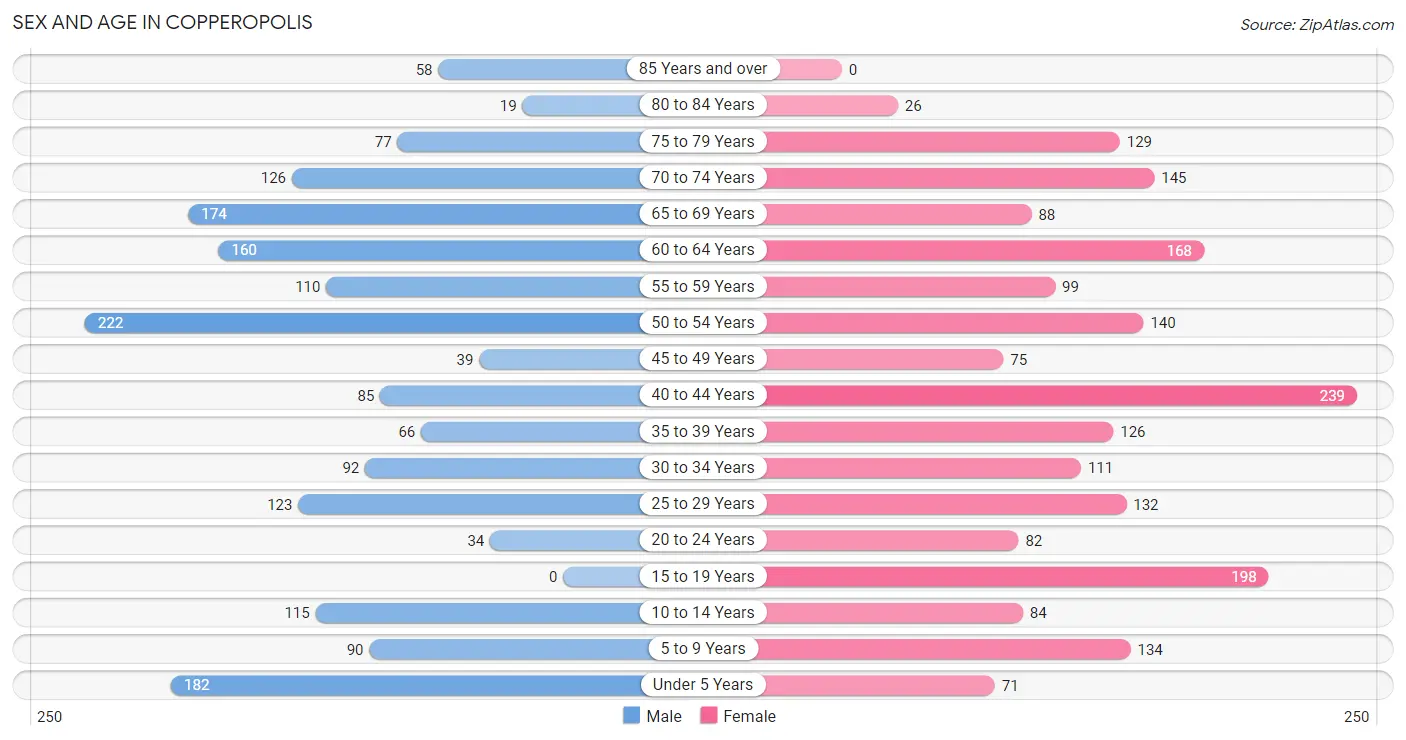
The most populous age groups in Copperopolis are 50 to 54 Years (222 | 12.5%) for men and 40 to 44 Years (239 | 11.7%) for women.
| Age Bracket | Male | Female |
| Under 5 Years | 182 (10.3%) | 71 (3.5%) |
| 5 to 9 Years | 90 (5.1%) | 134 (6.6%) |
| 10 to 14 Years | 115 (6.5%) | 84 (4.1%) |
| 15 to 19 Years | 0 (0.0%) | 198 (9.7%) |
| 20 to 24 Years | 34 (1.9%) | 82 (4.0%) |
| 25 to 29 Years | 123 (6.9%) | 132 (6.5%) |
| 30 to 34 Years | 92 (5.2%) | 111 (5.4%) |
| 35 to 39 Years | 66 (3.7%) | 126 (6.2%) |
| 40 to 44 Years | 85 (4.8%) | 239 (11.7%) |
| 45 to 49 Years | 39 (2.2%) | 75 (3.7%) |
| 50 to 54 Years | 222 (12.5%) | 140 (6.8%) |
| 55 to 59 Years | 110 (6.2%) | 99 (4.8%) |
| 60 to 64 Years | 160 (9.0%) | 168 (8.2%) |
| 65 to 69 Years | 174 (9.8%) | 88 (4.3%) |
| 70 to 74 Years | 126 (7.1%) | 145 (7.1%) |
| 75 to 79 Years | 77 (4.3%) | 129 (6.3%) |
| 80 to 84 Years | 19 (1.1%) | 26 (1.3%) |
| 85 Years and over | 58 (3.3%) | 0 (0.0%) |
| Total | 1,772 (100.0%) | 2,047 (100.0%) |
Families and Households in Copperopolis
Median Family Size in Copperopolis
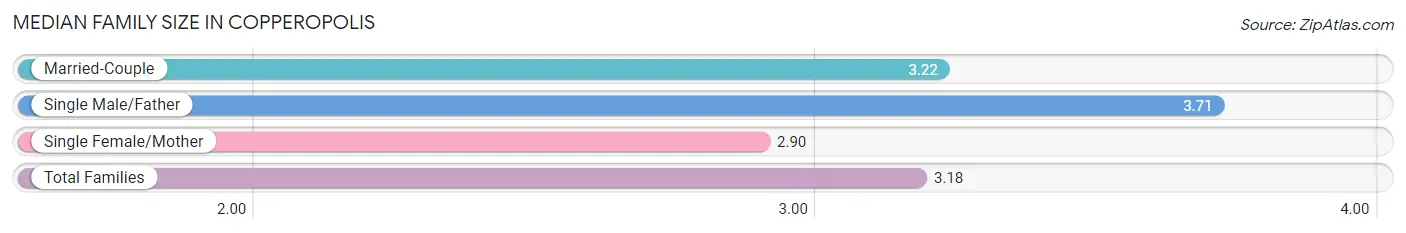
The median family size in Copperopolis is 3.18 persons per family, with single male/father families (24 | 2.3%) accounting for the largest median family size of 3.71 persons per family. On the other hand, single female/mother families (192 | 18.1%) represent the smallest median family size with 2.90 persons per family.
| Family Type | # Families | Family Size |
| Married-Couple | 847 (79.7%) | 3.22 |
| Single Male/Father | 24 (2.3%) | 3.71 |
| Single Female/Mother | 192 (18.1%) | 2.90 |
| Total Families | 1,063 (100.0%) | 3.18 |
Median Household Size in Copperopolis
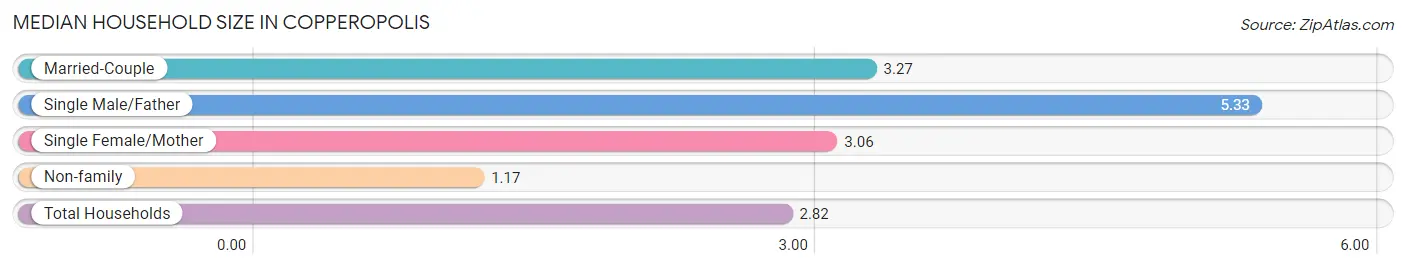
The median household size in Copperopolis is 2.82 persons per household, with single male/father households (24 | 1.8%) accounting for the largest median household size of 5.33 persons per household. non-family households (289 | 21.4%) represent the smallest median household size with 1.17 persons per household.
| Household Type | # Households | Household Size |
| Married-Couple | 847 (62.6%) | 3.27 |
| Single Male/Father | 24 (1.8%) | 5.33 |
| Single Female/Mother | 192 (14.2%) | 3.06 |
| Non-family | 289 (21.4%) | 1.17 |
| Total Households | 1,352 (100.0%) | 2.82 |
Household Size by Marriage Status in Copperopolis
Out of a total of 1,352 households in Copperopolis, 1,063 (78.6%) are family households, while 289 (21.4%) are nonfamily households. The most numerous type of family households are 2-person households, comprising 480, and the most common type of nonfamily households are 1-person households, comprising 239.
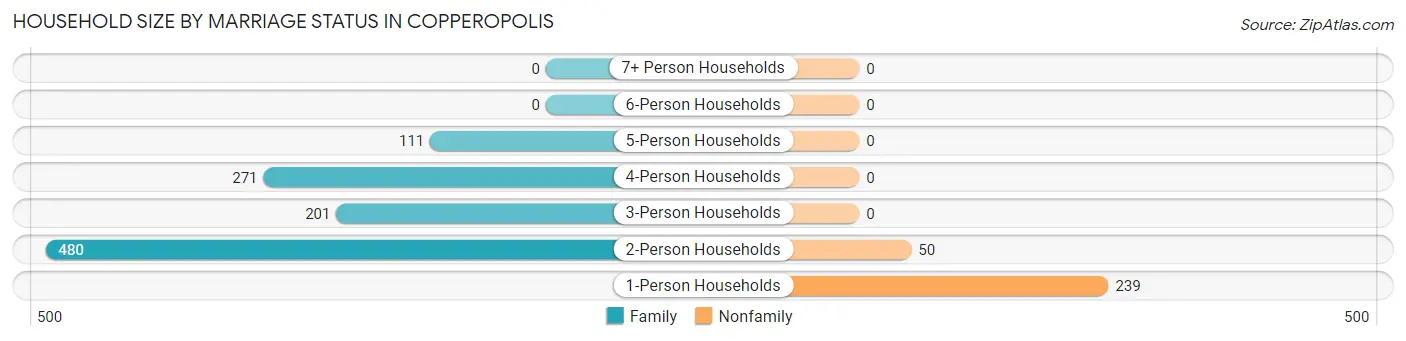
| Household Size | Family Households | Nonfamily Households |
| 1-Person Households | - | 239 (17.7%) |
| 2-Person Households | 480 (35.5%) | 50 (3.7%) |
| 3-Person Households | 201 (14.9%) | 0 (0.0%) |
| 4-Person Households | 271 (20.0%) | 0 (0.0%) |
| 5-Person Households | 111 (8.2%) | 0 (0.0%) |
| 6-Person Households | 0 (0.0%) | 0 (0.0%) |
| 7+ Person Households | 0 (0.0%) | 0 (0.0%) |
| Total | 1,063 (78.6%) | 289 (21.4%) |
Female Fertility in Copperopolis
Fertility by Age in Copperopolis
Average fertility rate in Copperopolis is 161.0 births per 1,000 women. Women in the age bracket of 35 to 50 years have the highest fertility rate with 211.0 births per 1,000 women. Women in the age bracket of 35 to 50 years acount for 61.6% of all women with births.
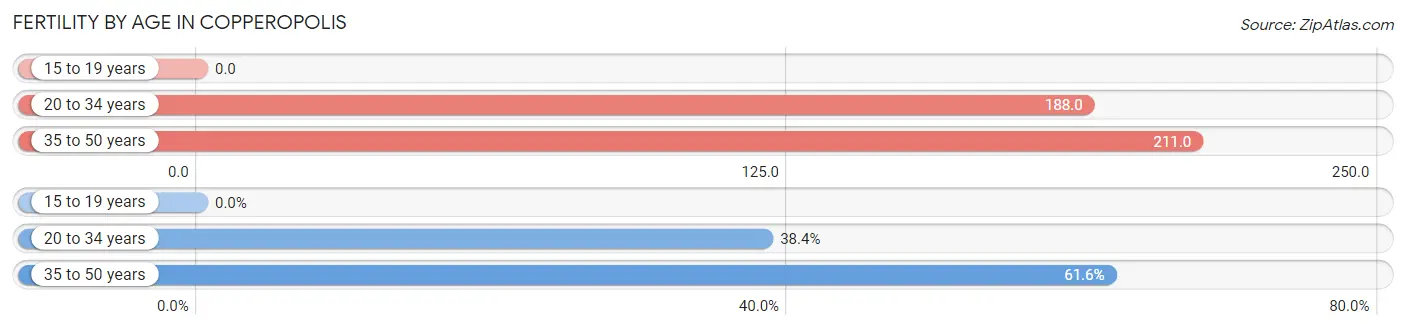
| Age Bracket | Women with Births | Births / 1,000 Women |
| 15 to 19 years | 0 (0.0%) | 0.0 |
| 20 to 34 years | 61 (38.4%) | 188.0 |
| 35 to 50 years | 98 (61.6%) | 211.0 |
| Total | 159 (100.0%) | 161.0 |
Fertility by Age by Marriage Status in Copperopolis
49.7% of women with births (159) in Copperopolis are married. The highest percentage of unmarried women with births falls into 35 to 50 years age bracket with 51.0% of them unmarried at the time of birth, while the lowest percentage of unmarried women with births belong to 20 to 34 years age bracket with 49.2% of them unmarried.
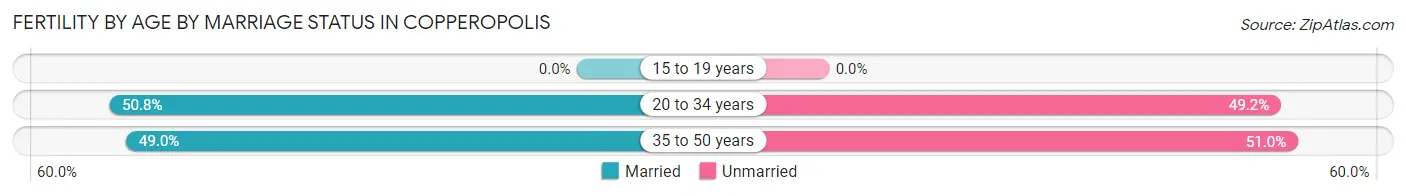
| Age Bracket | Married | Unmarried |
| 15 to 19 years | 0 (0.0%) | 0 (0.0%) |
| 20 to 34 years | 31 (50.8%) | 30 (49.2%) |
| 35 to 50 years | 48 (49.0%) | 50 (51.0%) |
| Total | 79 (49.7%) | 80 (50.3%) |
Fertility by Education in Copperopolis
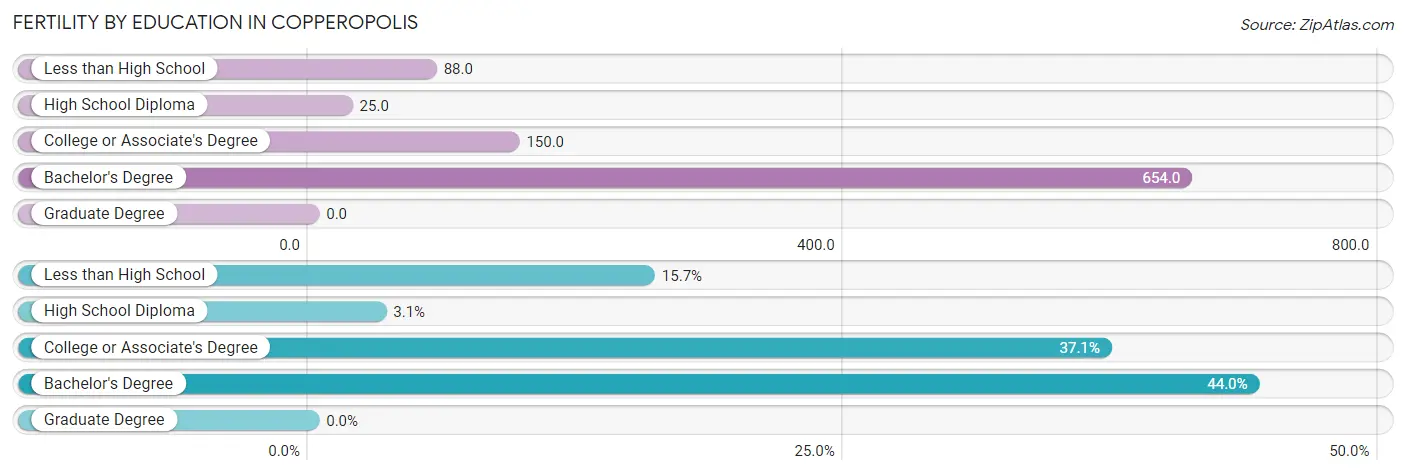
| Educational Attainment | Women with Births | Births / 1,000 Women |
| Less than High School | 25 (15.7%) | 88.0 |
| High School Diploma | 5 (3.1%) | 25.0 |
| College or Associate's Degree | 59 (37.1%) | 150.0 |
| Bachelor's Degree | 70 (44.0%) | 654.0 |
| Graduate Degree | 0 (0.0%) | 0.0 |
| Total | 159 (100.0%) | 161.0 |
Fertility by Education by Marriage Status in Copperopolis
50.3% of women with births in Copperopolis are unmarried. Women with the educational attainment of bachelor's degree are most likely to be married with 100.0% of them married at childbirth, while women with the educational attainment of less than high school are least likely to be married with 100.0% of them unmarried at childbirth.
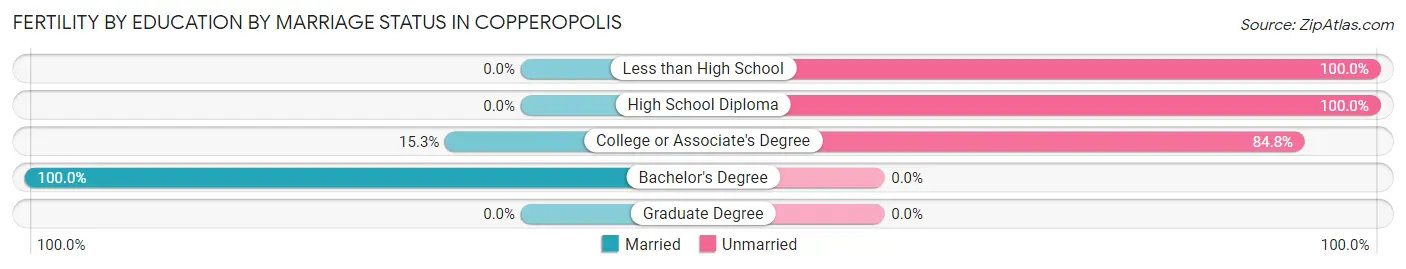
| Educational Attainment | Married | Unmarried |
| Less than High School | 0 (0.0%) | 25 (100.0%) |
| High School Diploma | 0 (0.0%) | 5 (100.0%) |
| College or Associate's Degree | 9 (15.2%) | 50 (84.8%) |
| Bachelor's Degree | 70 (100.0%) | 0 (0.0%) |
| Graduate Degree | 0 (0.0%) | 0 (0.0%) |
| Total | 79 (49.7%) | 80 (50.3%) |
Employment Characteristics in Copperopolis
Employment by Class of Employer in Copperopolis
Among the 1,519 employed individuals in Copperopolis, private company employees (942 | 62.0%), local government employees (285 | 18.8%), and not-for-profit organizations (160 | 10.5%) make up the most common classes of employment.
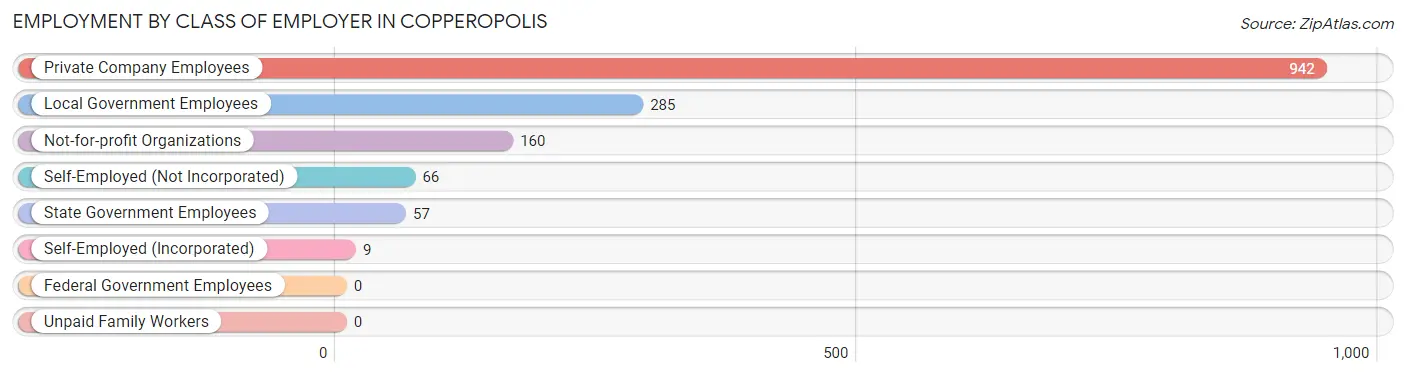
| Employer Class | # Employees | % Employees |
| Private Company Employees | 942 | 62.0% |
| Self-Employed (Incorporated) | 9 | 0.6% |
| Self-Employed (Not Incorporated) | 66 | 4.3% |
| Not-for-profit Organizations | 160 | 10.5% |
| Local Government Employees | 285 | 18.8% |
| State Government Employees | 57 | 3.7% |
| Federal Government Employees | 0 | 0.0% |
| Unpaid Family Workers | 0 | 0.0% |
| Total | 1,519 | 100.0% |
Employment Status by Age in Copperopolis
According to the labor force statistics for Copperopolis, out of the total population over 16 years of age (3,098), 54.2% or 1,679 individuals are in the labor force, with 9.5% or 160 of them unemployed. The age group with the highest labor force participation rate is 45 to 54 years, with 92.9% or 442 individuals in the labor force. Within the labor force, the 65 to 74 years age range has the highest percentage of unemployed individuals, with 47.0% or 31 of them being unemployed.
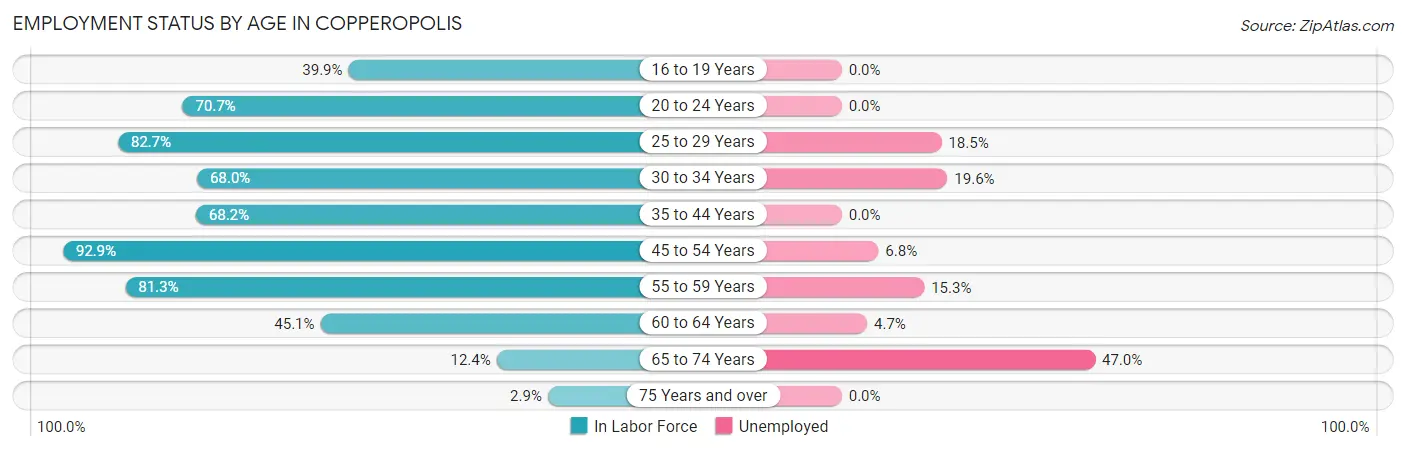
| Age Bracket | In Labor Force | Unemployed |
| 16 to 19 Years | 61 (39.9%) | 0 (0.0%) |
| 20 to 24 Years | 82 (70.7%) | 0 (0.0%) |
| 25 to 29 Years | 211 (82.7%) | 39 (18.5%) |
| 30 to 34 Years | 138 (68.0%) | 27 (19.6%) |
| 35 to 44 Years | 352 (68.2%) | 0 (0.0%) |
| 45 to 54 Years | 442 (92.9%) | 30 (6.8%) |
| 55 to 59 Years | 170 (81.3%) | 26 (15.3%) |
| 60 to 64 Years | 148 (45.1%) | 7 (4.7%) |
| 65 to 74 Years | 66 (12.4%) | 31 (47.0%) |
| 75 Years and over | 9 (2.9%) | 0 (0.0%) |
| Total | 1,679 (54.2%) | 160 (9.5%) |
Employment Status by Educational Attainment in Copperopolis
According to labor force statistics for Copperopolis, 73.5% of individuals (1,460) out of the total population between 25 and 64 years of age (1,987) are in the labor force, with 8.8% or 128 of them being unemployed. The group with the highest labor force participation rate are those with the educational attainment of bachelor's degree or higher, with 87.8% or 294 individuals in the labor force. Within the labor force, individuals with less than high school education have the highest percentage of unemployment, with 14.7% or 20 of them being unemployed.
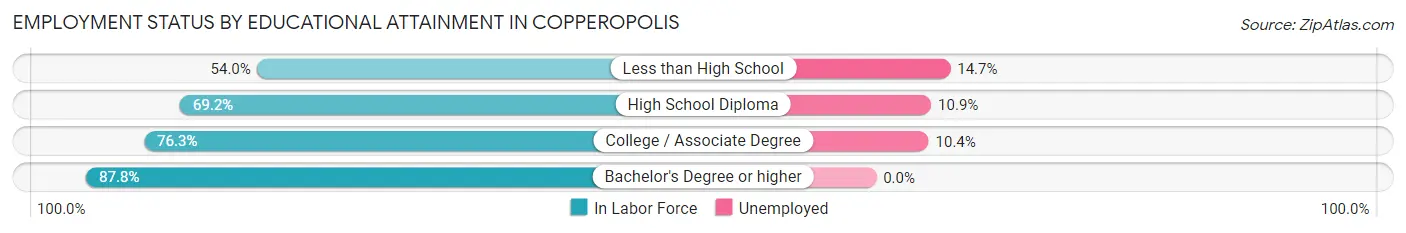
| Educational Attainment | In Labor Force | Unemployed |
| Less than High School | 136 (54.0%) | 37 (14.7%) |
| High School Diploma | 359 (69.2%) | 57 (10.9%) |
| College / Associate Degree | 672 (76.3%) | 92 (10.4%) |
| Bachelor's Degree or higher | 294 (87.8%) | 0 (0.0%) |
| Total | 1,460 (73.5%) | 175 (8.8%) |
Employment Occupations by Sex in Copperopolis
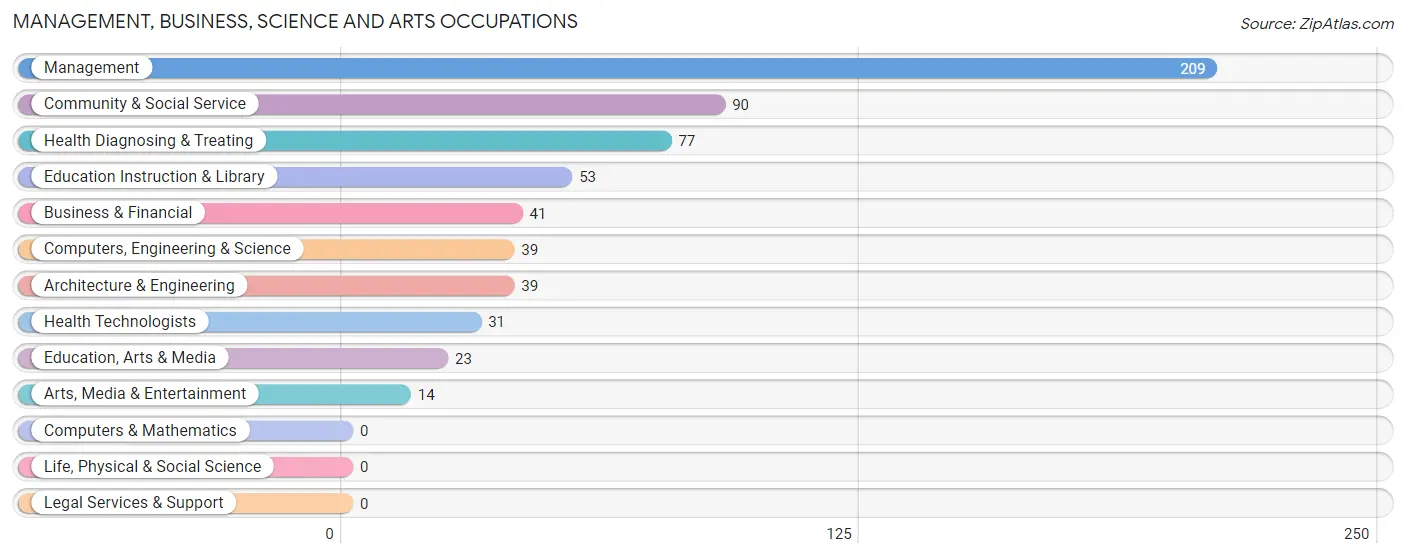
Management, Business, Science and Arts Occupations
The most common Management, Business, Science and Arts occupations in Copperopolis are Management (209 | 13.8%), Community & Social Service (90 | 5.9%), Health Diagnosing & Treating (77 | 5.1%), Education Instruction & Library (53 | 3.5%), and Business & Financial (41 | 2.7%).
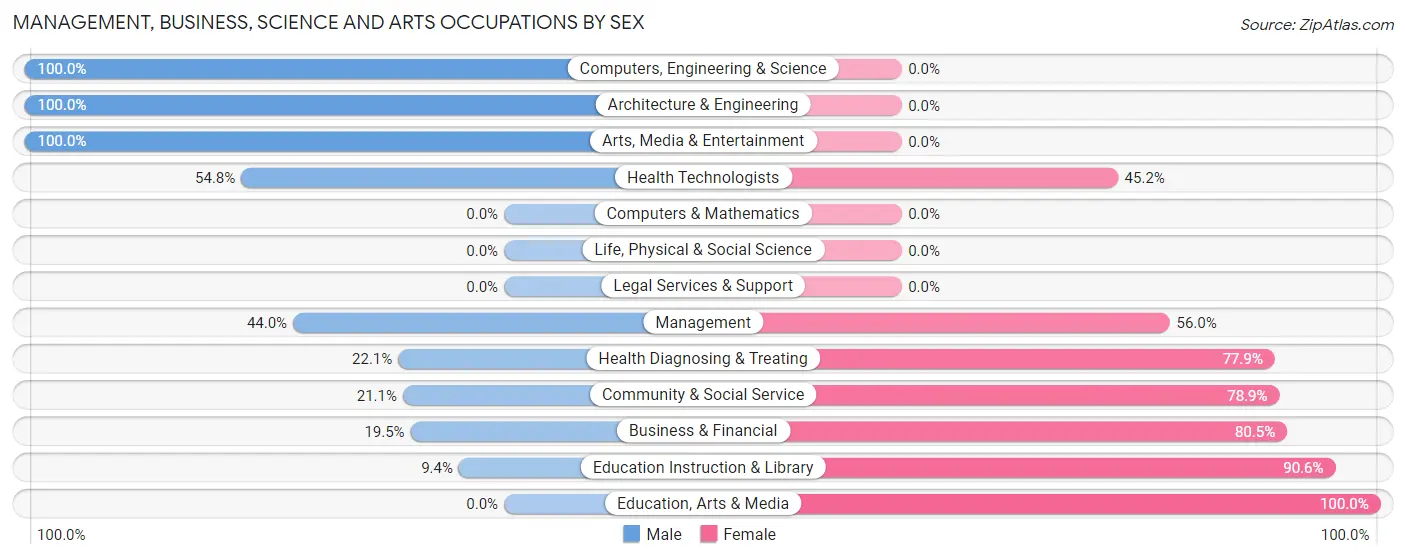
Management, Business, Science and Arts Occupations by Sex
Within the Management, Business, Science and Arts occupations in Copperopolis, the most male-oriented occupations are Computers, Engineering & Science (100.0%), Architecture & Engineering (100.0%), and Arts, Media & Entertainment (100.0%), while the most female-oriented occupations are Education, Arts & Media (100.0%), Education Instruction & Library (90.6%), and Business & Financial (80.5%).
| Occupation | Male | Female |
| Management | 92 (44.0%) | 117 (56.0%) |
| Business & Financial | 8 (19.5%) | 33 (80.5%) |
| Computers, Engineering & Science | 39 (100.0%) | 0 (0.0%) |
| Computers & Mathematics | 0 (0.0%) | 0 (0.0%) |
| Architecture & Engineering | 39 (100.0%) | 0 (0.0%) |
| Life, Physical & Social Science | 0 (0.0%) | 0 (0.0%) |
| Community & Social Service | 19 (21.1%) | 71 (78.9%) |
| Education, Arts & Media | 0 (0.0%) | 23 (100.0%) |
| Legal Services & Support | 0 (0.0%) | 0 (0.0%) |
| Education Instruction & Library | 5 (9.4%) | 48 (90.6%) |
| Arts, Media & Entertainment | 14 (100.0%) | 0 (0.0%) |
| Health Diagnosing & Treating | 17 (22.1%) | 60 (77.9%) |
| Health Technologists | 17 (54.8%) | 14 (45.2%) |
| Total (Category) | 175 (38.4%) | 281 (61.6%) |
| Total (Overall) | 729 (48.0%) | 790 (52.0%) |
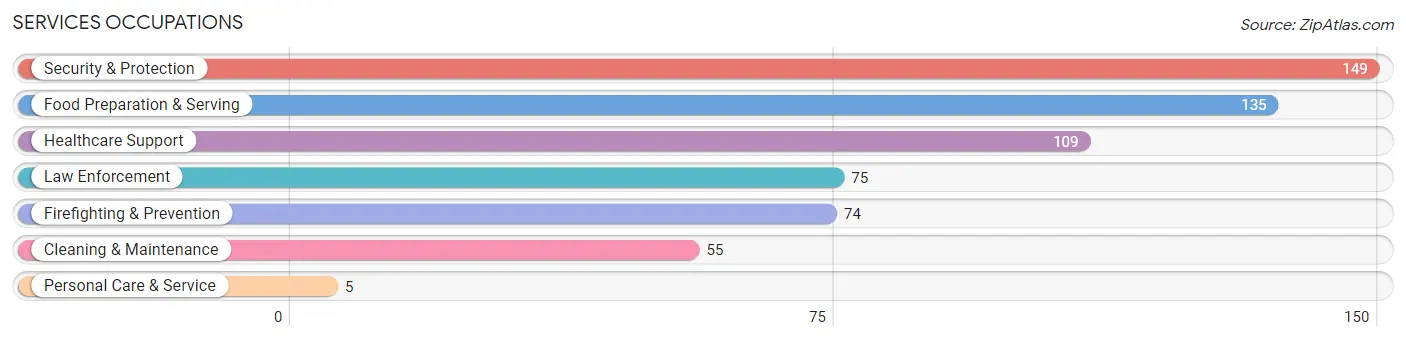
Services Occupations
The most common Services occupations in Copperopolis are Security & Protection (149 | 9.8%), Food Preparation & Serving (135 | 8.9%), Healthcare Support (109 | 7.2%), Law Enforcement (75 | 4.9%), and Firefighting & Prevention (74 | 4.9%).
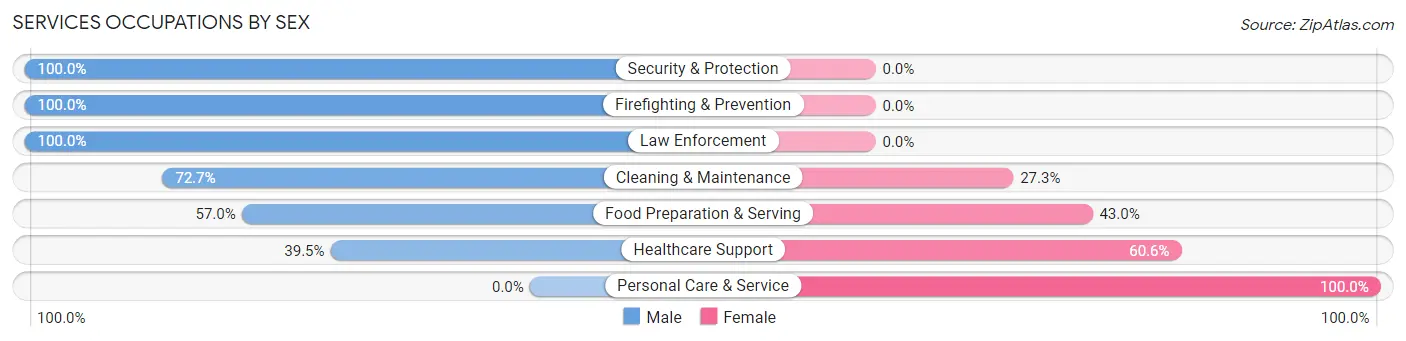
Services Occupations by Sex
Within the Services occupations in Copperopolis, the most male-oriented occupations are Security & Protection (100.0%), Firefighting & Prevention (100.0%), and Law Enforcement (100.0%), while the most female-oriented occupations are Personal Care & Service (100.0%), Healthcare Support (60.6%), and Food Preparation & Serving (43.0%).
| Occupation | Male | Female |
| Healthcare Support | 43 (39.5%) | 66 (60.6%) |
| Security & Protection | 149 (100.0%) | 0 (0.0%) |
| Firefighting & Prevention | 74 (100.0%) | 0 (0.0%) |
| Law Enforcement | 75 (100.0%) | 0 (0.0%) |
| Food Preparation & Serving | 77 (57.0%) | 58 (43.0%) |
| Cleaning & Maintenance | 40 (72.7%) | 15 (27.3%) |
| Personal Care & Service | 0 (0.0%) | 5 (100.0%) |
| Total (Category) | 309 (68.2%) | 144 (31.8%) |
| Total (Overall) | 729 (48.0%) | 790 (52.0%) |
Sales and Office Occupations
The most common Sales and Office occupations in Copperopolis are Sales & Related (218 | 14.3%), and Office & Administration (198 | 13.0%).

Sales and Office Occupations by Sex

| Occupation | Male | Female |
| Sales & Related | 61 (28.0%) | 157 (72.0%) |
| Office & Administration | 30 (15.1%) | 168 (84.9%) |
| Total (Category) | 91 (21.9%) | 325 (78.1%) |
| Total (Overall) | 729 (48.0%) | 790 (52.0%) |
Natural Resources, Construction and Maintenance Occupations
The most common Natural Resources, Construction and Maintenance occupations in Copperopolis are Construction & Extraction (101 | 6.7%), and Installation, Maintenance & Repair (10 | 0.7%).
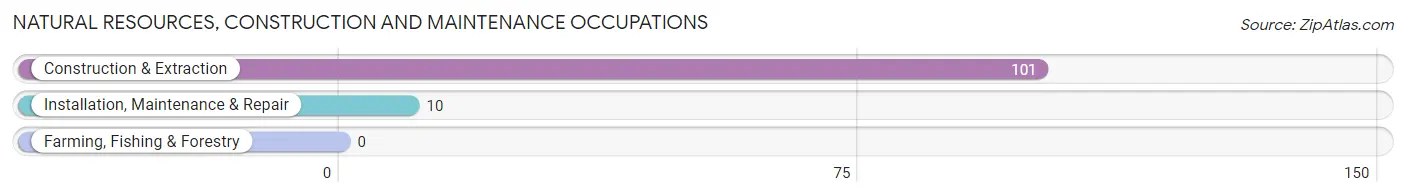
Natural Resources, Construction and Maintenance Occupations by Sex
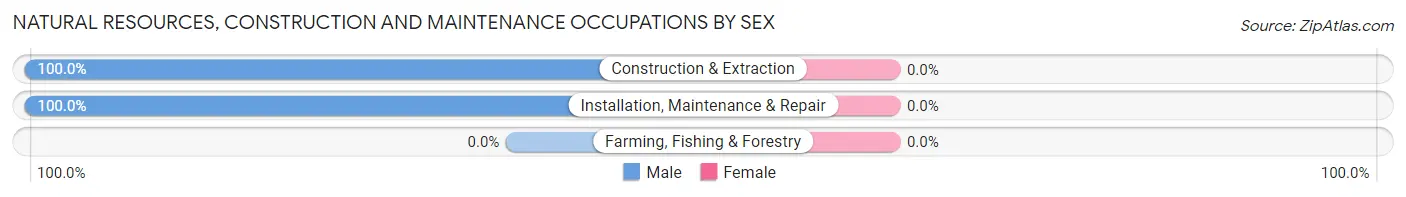
| Occupation | Male | Female |
| Farming, Fishing & Forestry | 0 (0.0%) | 0 (0.0%) |
| Construction & Extraction | 101 (100.0%) | 0 (0.0%) |
| Installation, Maintenance & Repair | 10 (100.0%) | 0 (0.0%) |
| Total (Category) | 111 (100.0%) | 0 (0.0%) |
| Total (Overall) | 729 (48.0%) | 790 (52.0%) |
Production, Transportation and Moving Occupations
The most common Production, Transportation and Moving occupations in Copperopolis are Material Moving (40 | 2.6%), Transportation (36 | 2.4%), and Production (7 | 0.5%).
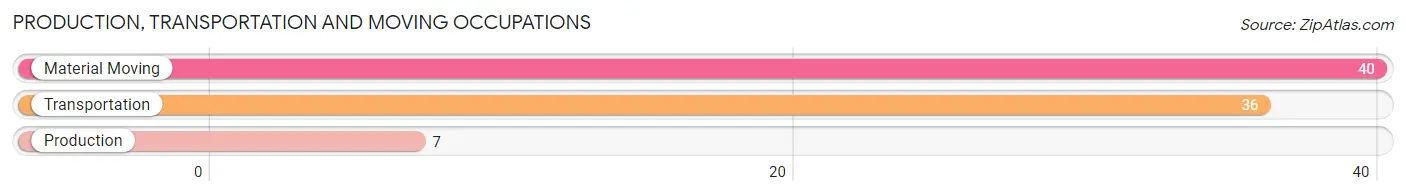
Production, Transportation and Moving Occupations by Sex
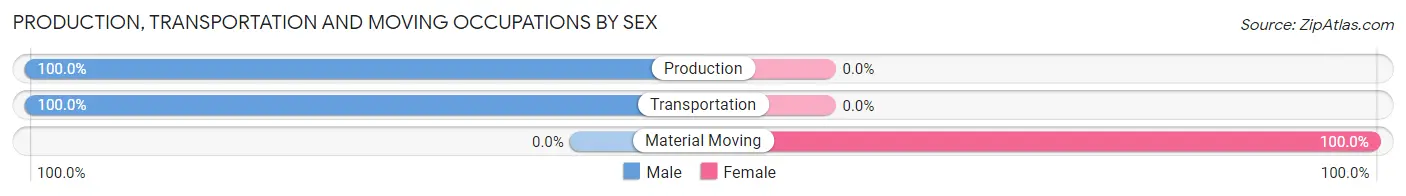
| Occupation | Male | Female |
| Production | 7 (100.0%) | 0 (0.0%) |
| Transportation | 36 (100.0%) | 0 (0.0%) |
| Material Moving | 0 (0.0%) | 40 (100.0%) |
| Total (Category) | 43 (51.8%) | 40 (48.2%) |
| Total (Overall) | 729 (48.0%) | 790 (52.0%) |
Employment Industries by Sex in Copperopolis
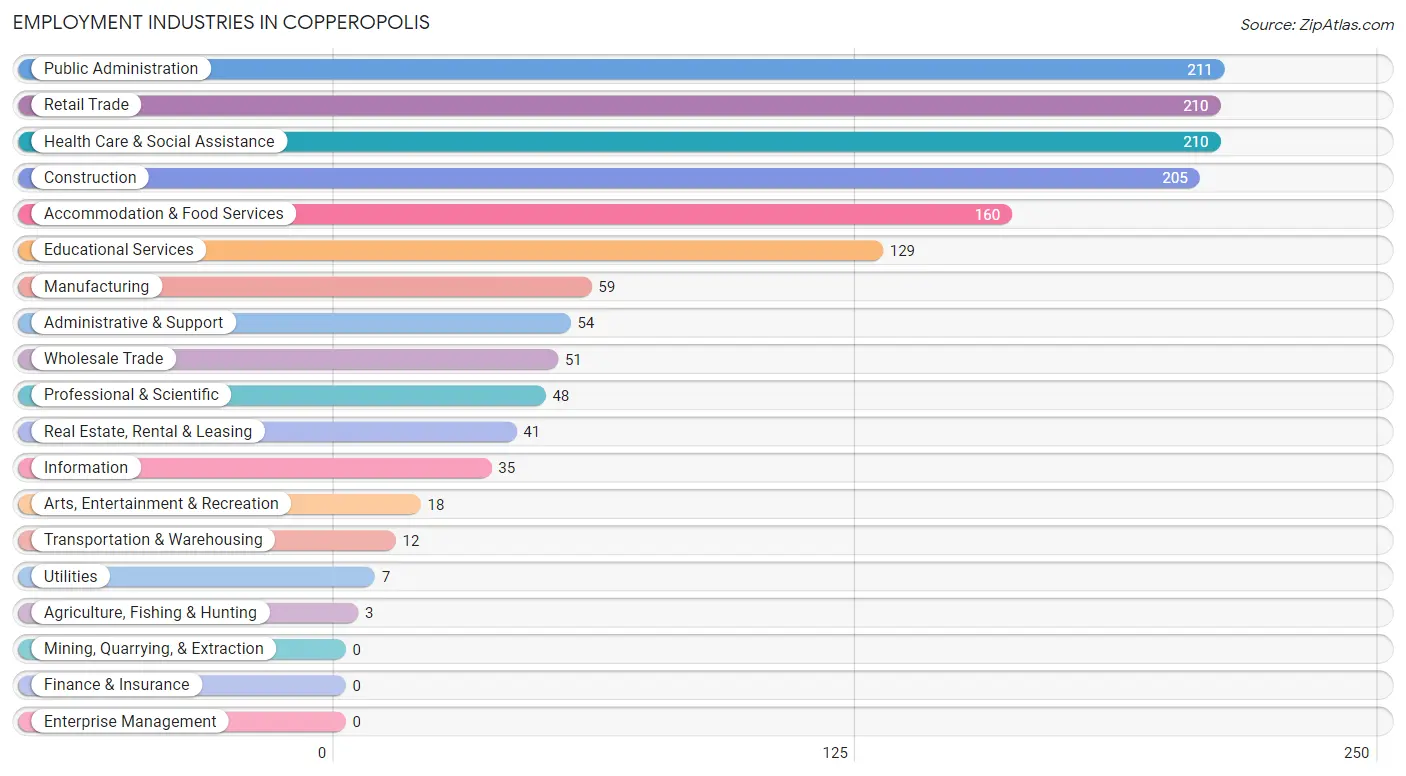
Employment Industries in Copperopolis
The major employment industries in Copperopolis include Public Administration (211 | 13.9%), Retail Trade (210 | 13.8%), Health Care & Social Assistance (210 | 13.8%), Construction (205 | 13.5%), and Accommodation & Food Services (160 | 10.5%).
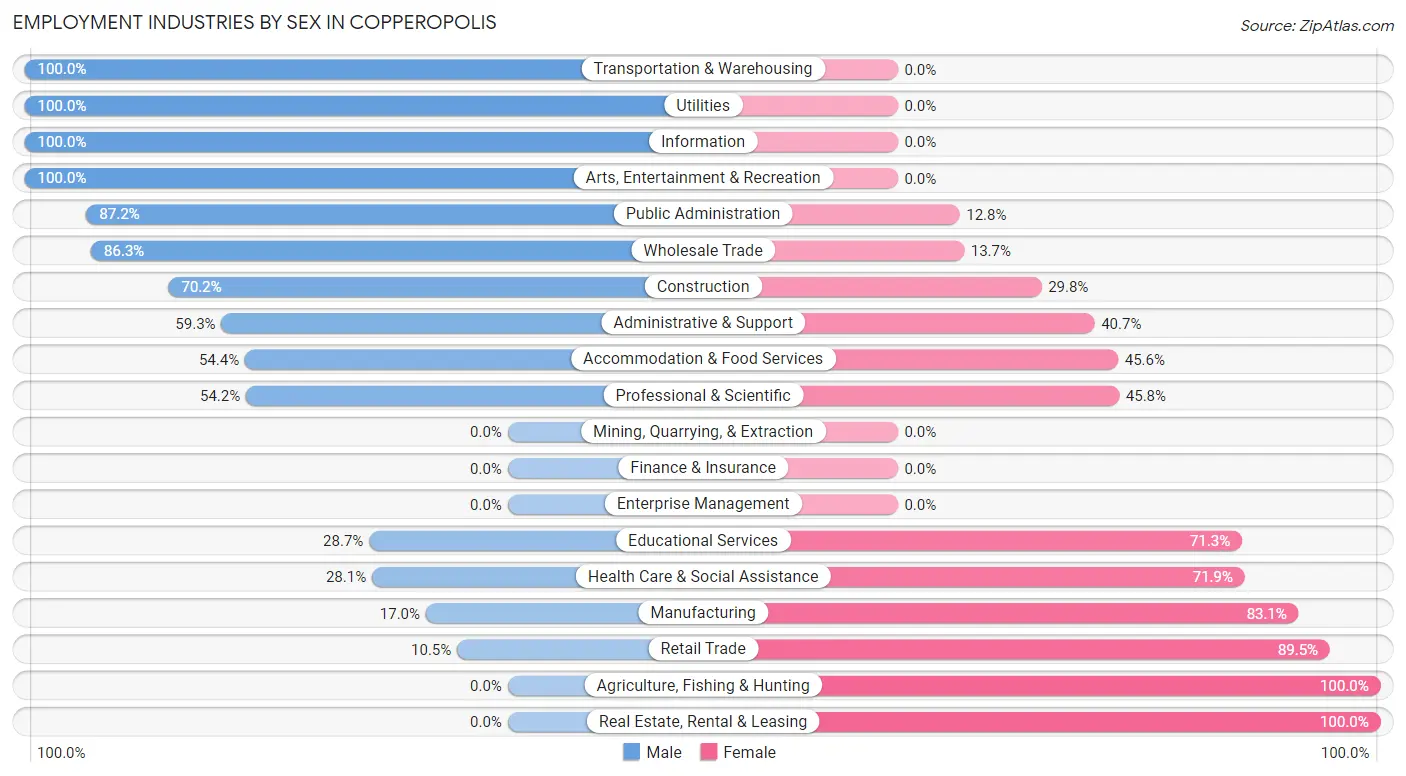
Employment Industries by Sex in Copperopolis
The Copperopolis industries that see more men than women are Transportation & Warehousing (100.0%), Utilities (100.0%), and Information (100.0%), whereas the industries that tend to have a higher number of women are Agriculture, Fishing & Hunting (100.0%), Real Estate, Rental & Leasing (100.0%), and Retail Trade (89.5%).
| Industry | Male | Female |
| Agriculture, Fishing & Hunting | 0 (0.0%) | 3 (100.0%) |
| Mining, Quarrying, & Extraction | 0 (0.0%) | 0 (0.0%) |
| Construction | 144 (70.2%) | 61 (29.8%) |
| Manufacturing | 10 (17.0%) | 49 (83.1%) |
| Wholesale Trade | 44 (86.3%) | 7 (13.7%) |
| Retail Trade | 22 (10.5%) | 188 (89.5%) |
| Transportation & Warehousing | 12 (100.0%) | 0 (0.0%) |
| Utilities | 7 (100.0%) | 0 (0.0%) |
| Information | 35 (100.0%) | 0 (0.0%) |
| Finance & Insurance | 0 (0.0%) | 0 (0.0%) |
| Real Estate, Rental & Leasing | 0 (0.0%) | 41 (100.0%) |
| Professional & Scientific | 26 (54.2%) | 22 (45.8%) |
| Enterprise Management | 0 (0.0%) | 0 (0.0%) |
| Administrative & Support | 32 (59.3%) | 22 (40.7%) |
| Educational Services | 37 (28.7%) | 92 (71.3%) |
| Health Care & Social Assistance | 59 (28.1%) | 151 (71.9%) |
| Arts, Entertainment & Recreation | 18 (100.0%) | 0 (0.0%) |
| Accommodation & Food Services | 87 (54.4%) | 73 (45.6%) |
| Public Administration | 184 (87.2%) | 27 (12.8%) |
| Total | 729 (48.0%) | 790 (52.0%) |
Education in Copperopolis
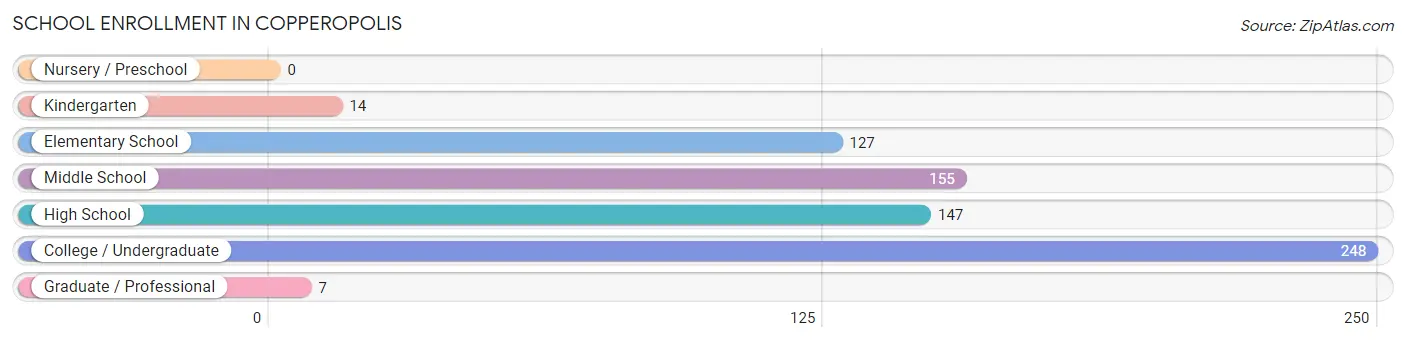
School Enrollment in Copperopolis
The most common levels of schooling among the 698 students in Copperopolis are college / undergraduate (248 | 35.5%), middle school (155 | 22.2%), and high school (147 | 21.1%).
| School Level | # Students | % Students |
| Nursery / Preschool | 0 | 0.0% |
| Kindergarten | 14 | 2.0% |
| Elementary School | 127 | 18.2% |
| Middle School | 155 | 22.2% |
| High School | 147 | 21.1% |
| College / Undergraduate | 248 | 35.5% |
| Graduate / Professional | 7 | 1.0% |
| Total | 698 | 100.0% |
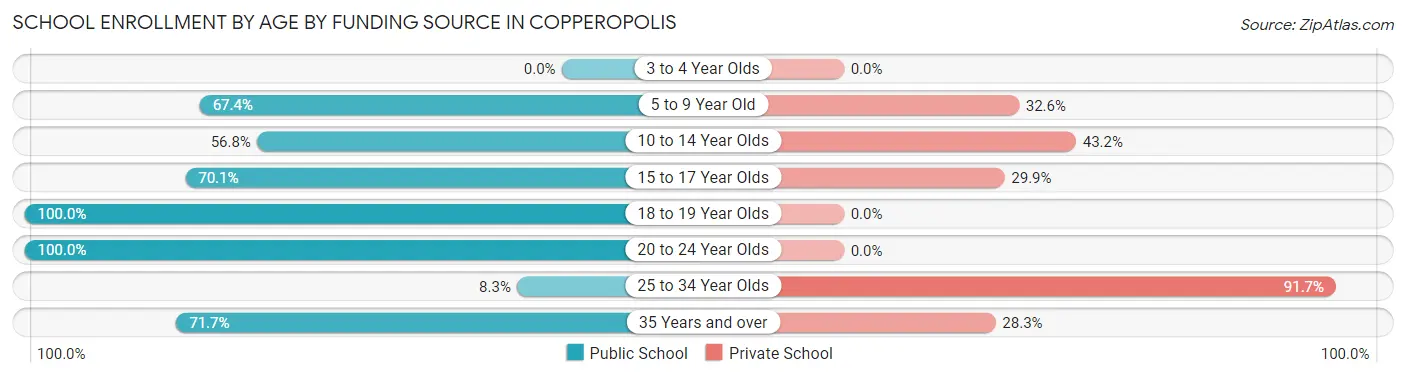
School Enrollment by Age by Funding Source in Copperopolis
Out of a total of 698 students who are enrolled in schools in Copperopolis, 238 (34.1%) attend a private institution, while the remaining 460 (65.9%) are enrolled in public schools. The age group of 25 to 34 year olds has the highest likelihood of being enrolled in private schools, with 55 (91.7% in the age bracket) enrolled. Conversely, the age group of 18 to 19 year olds has the lowest likelihood of being enrolled in a private school, with 21 (100.0% in the age bracket) attending a public institution.
| Age Bracket | Public School | Private School |
| 3 to 4 Year Olds | 0 (0.0%) | 0 (0.0%) |
| 5 to 9 Year Old | 95 (67.4%) | 46 (32.6%) |
| 10 to 14 Year Olds | 88 (56.8%) | 67 (43.2%) |
| 15 to 17 Year Olds | 103 (70.1%) | 44 (29.9%) |
| 18 to 19 Year Olds | 21 (100.0%) | 0 (0.0%) |
| 20 to 24 Year Olds | 82 (100.0%) | 0 (0.0%) |
| 25 to 34 Year Olds | 5 (8.3%) | 55 (91.7%) |
| 35 Years and over | 66 (71.7%) | 26 (28.3%) |
| Total | 460 (65.9%) | 238 (34.1%) |
Educational Attainment by Field of Study in Copperopolis
Business (203 | 34.4%), education (119 | 20.1%), social sciences (52 | 8.8%), bio, nature & agricultural (49 | 8.3%), and science & technology (38 | 6.4%) are the most common fields of study among 591 individuals in Copperopolis who have obtained a bachelor's degree or higher.
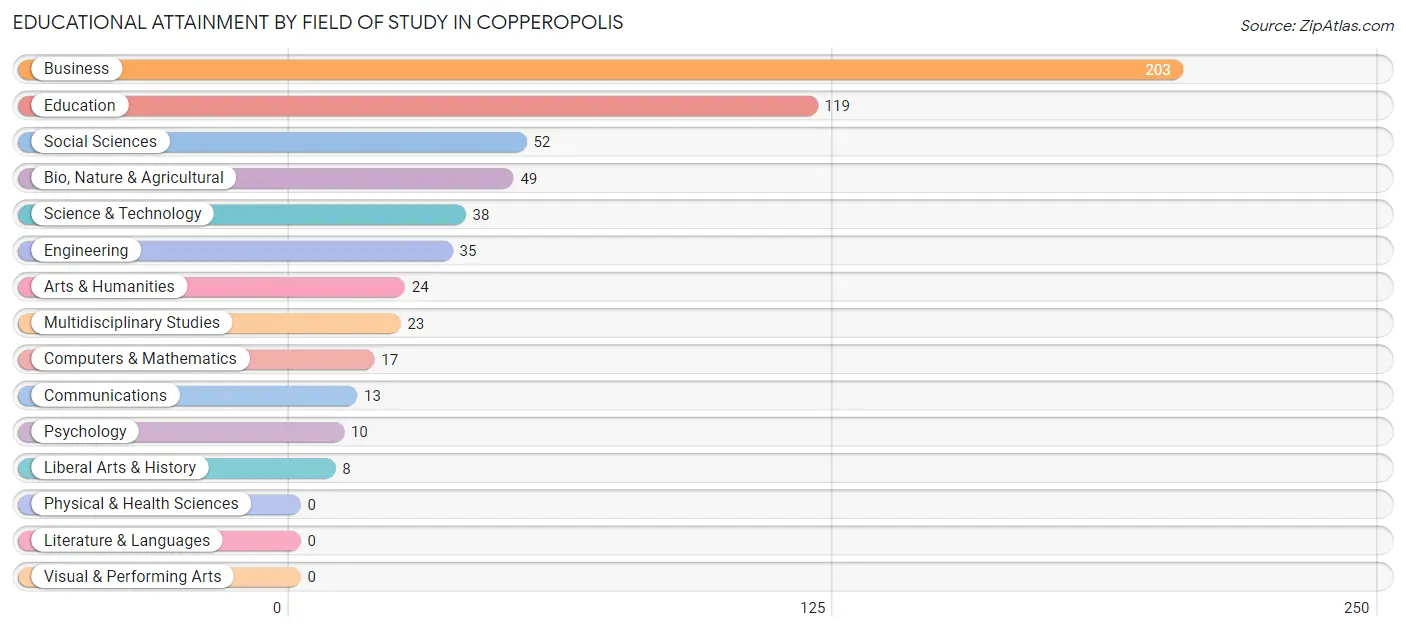
| Field of Study | # Graduates | % Graduates |
| Computers & Mathematics | 17 | 2.9% |
| Bio, Nature & Agricultural | 49 | 8.3% |
| Physical & Health Sciences | 0 | 0.0% |
| Psychology | 10 | 1.7% |
| Social Sciences | 52 | 8.8% |
| Engineering | 35 | 5.9% |
| Multidisciplinary Studies | 23 | 3.9% |
| Science & Technology | 38 | 6.4% |
| Business | 203 | 34.4% |
| Education | 119 | 20.1% |
| Literature & Languages | 0 | 0.0% |
| Liberal Arts & History | 8 | 1.3% |
| Visual & Performing Arts | 0 | 0.0% |
| Communications | 13 | 2.2% |
| Arts & Humanities | 24 | 4.1% |
| Total | 591 | 100.0% |
Transportation & Commute in Copperopolis
Vehicle Availability by Sex in Copperopolis
The most prevalent vehicle ownership categories in Copperopolis are males with 3 vehicles (258, accounting for 35.4%) and females with 3 vehicles (214, making up 32.7%).
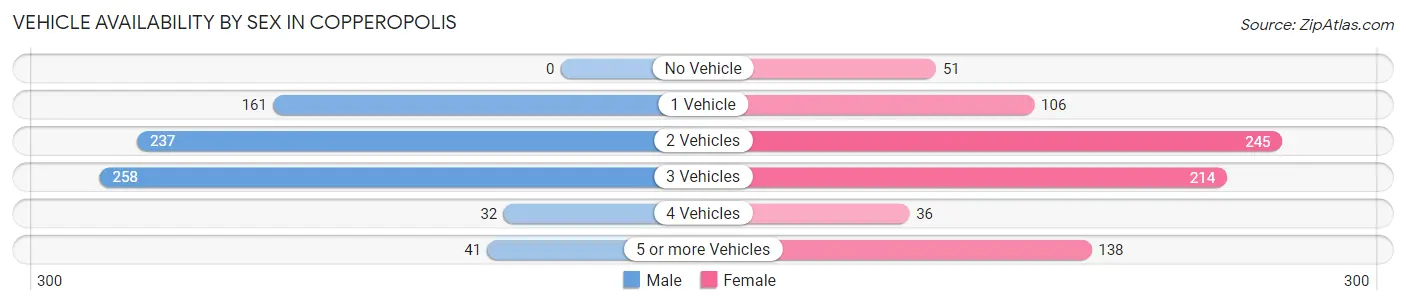
| Vehicles Available | Male | Female |
| No Vehicle | 0 (0.0%) | 51 (6.5%) |
| 1 Vehicle | 161 (22.1%) | 106 (13.4%) |
| 2 Vehicles | 237 (32.5%) | 245 (31.0%) |
| 3 Vehicles | 258 (35.4%) | 214 (27.1%) |
| 4 Vehicles | 32 (4.4%) | 36 (4.6%) |
| 5 or more Vehicles | 41 (5.6%) | 138 (17.5%) |
| Total | 729 (100.0%) | 790 (100.0%) |
Commute Time in Copperopolis
The most frequently occuring commute durations in Copperopolis are 45 to 59 minutes (325 commuters, 24.0%), 5 to 9 minutes (265 commuters, 19.6%), and 30 to 34 minutes (165 commuters, 12.2%).
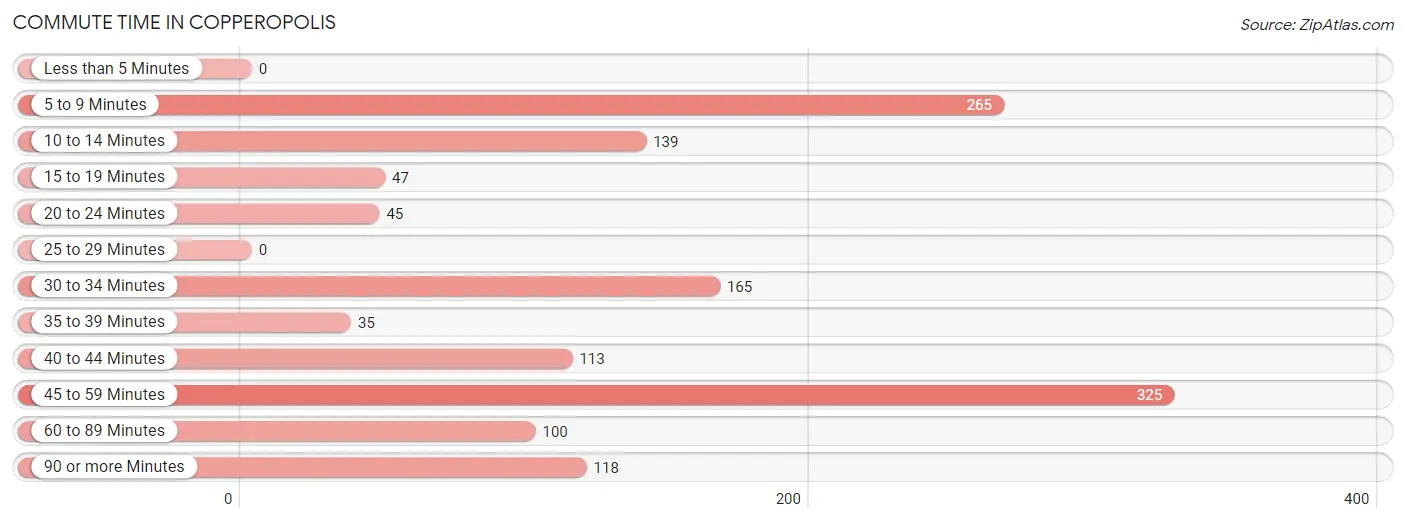
| Commute Time | # Commuters | % Commuters |
| Less than 5 Minutes | 0 | 0.0% |
| 5 to 9 Minutes | 265 | 19.6% |
| 10 to 14 Minutes | 139 | 10.3% |
| 15 to 19 Minutes | 47 | 3.5% |
| 20 to 24 Minutes | 45 | 3.3% |
| 25 to 29 Minutes | 0 | 0.0% |
| 30 to 34 Minutes | 165 | 12.2% |
| 35 to 39 Minutes | 35 | 2.6% |
| 40 to 44 Minutes | 113 | 8.4% |
| 45 to 59 Minutes | 325 | 24.0% |
| 60 to 89 Minutes | 100 | 7.4% |
| 90 or more Minutes | 118 | 8.7% |
Commute Time by Sex in Copperopolis
The most common commute times in Copperopolis are 45 to 59 minutes (133 commuters, 19.6%) for males and 45 to 59 minutes (192 commuters, 28.6%) for females.
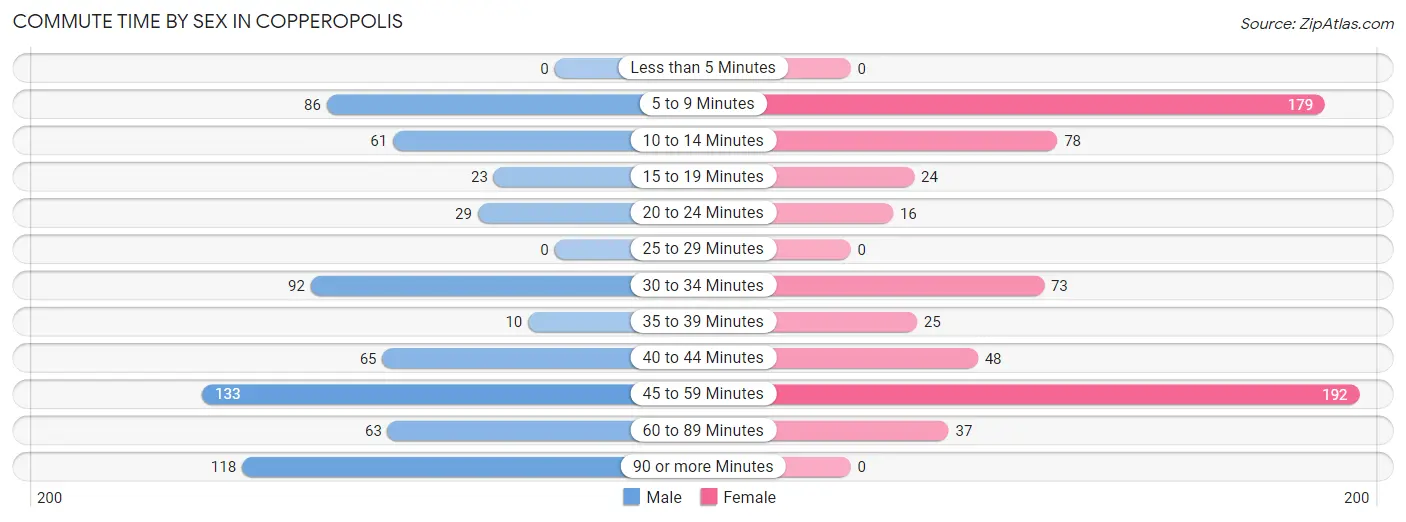
| Commute Time | Male | Female |
| Less than 5 Minutes | 0 (0.0%) | 0 (0.0%) |
| 5 to 9 Minutes | 86 (12.7%) | 179 (26.6%) |
| 10 to 14 Minutes | 61 (9.0%) | 78 (11.6%) |
| 15 to 19 Minutes | 23 (3.4%) | 24 (3.6%) |
| 20 to 24 Minutes | 29 (4.3%) | 16 (2.4%) |
| 25 to 29 Minutes | 0 (0.0%) | 0 (0.0%) |
| 30 to 34 Minutes | 92 (13.5%) | 73 (10.9%) |
| 35 to 39 Minutes | 10 (1.5%) | 25 (3.7%) |
| 40 to 44 Minutes | 65 (9.6%) | 48 (7.1%) |
| 45 to 59 Minutes | 133 (19.6%) | 192 (28.6%) |
| 60 to 89 Minutes | 63 (9.3%) | 37 (5.5%) |
| 90 or more Minutes | 118 (17.3%) | 0 (0.0%) |
Time of Departure to Work by Sex in Copperopolis
The most frequent times of departure to work in Copperopolis are 12:00 AM to 4:59 AM (99, 14.6%) for males and 8:00 AM to 8:29 AM (147, 21.9%) for females.
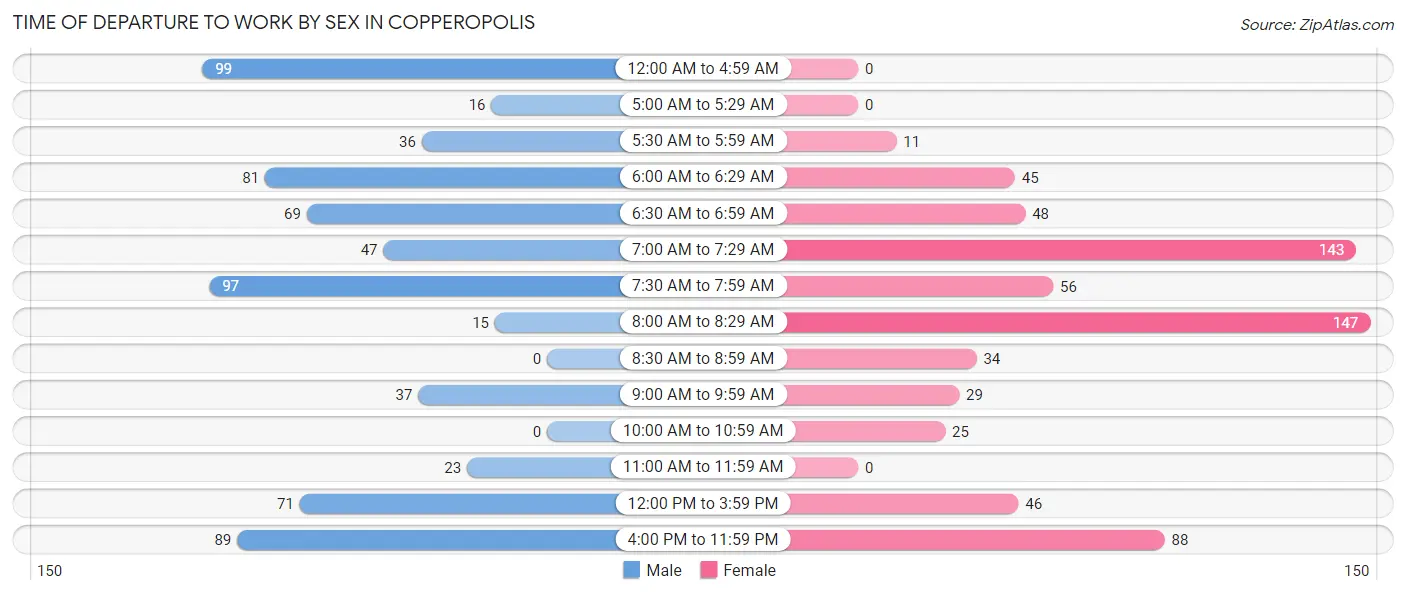
| Time of Departure | Male | Female |
| 12:00 AM to 4:59 AM | 99 (14.6%) | 0 (0.0%) |
| 5:00 AM to 5:29 AM | 16 (2.4%) | 0 (0.0%) |
| 5:30 AM to 5:59 AM | 36 (5.3%) | 11 (1.6%) |
| 6:00 AM to 6:29 AM | 81 (11.9%) | 45 (6.7%) |
| 6:30 AM to 6:59 AM | 69 (10.2%) | 48 (7.1%) |
| 7:00 AM to 7:29 AM | 47 (6.9%) | 143 (21.3%) |
| 7:30 AM to 7:59 AM | 97 (14.3%) | 56 (8.3%) |
| 8:00 AM to 8:29 AM | 15 (2.2%) | 147 (21.9%) |
| 8:30 AM to 8:59 AM | 0 (0.0%) | 34 (5.1%) |
| 9:00 AM to 9:59 AM | 37 (5.4%) | 29 (4.3%) |
| 10:00 AM to 10:59 AM | 0 (0.0%) | 25 (3.7%) |
| 11:00 AM to 11:59 AM | 23 (3.4%) | 0 (0.0%) |
| 12:00 PM to 3:59 PM | 71 (10.4%) | 46 (6.9%) |
| 4:00 PM to 11:59 PM | 89 (13.1%) | 88 (13.1%) |
| Total | 680 (100.0%) | 672 (100.0%) |
Housing Occupancy in Copperopolis
Occupancy by Ownership in Copperopolis
Of the total 1,352 dwellings in Copperopolis, owner-occupied units account for 1,071 (79.2%), while renter-occupied units make up 281 (20.8%).
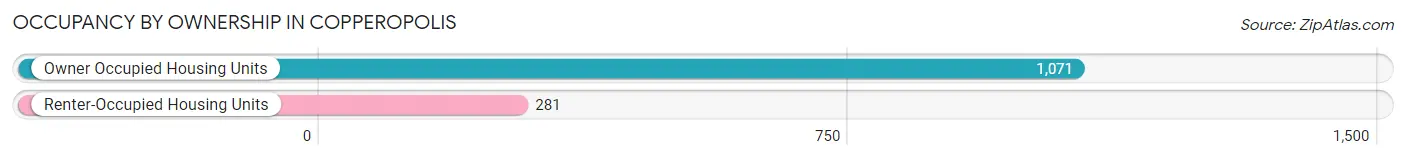
| Occupancy | # Housing Units | % Housing Units |
| Owner Occupied Housing Units | 1,071 | 79.2% |
| Renter-Occupied Housing Units | 281 | 20.8% |
| Total Occupied Housing Units | 1,352 | 100.0% |
Occupancy by Household Size in Copperopolis
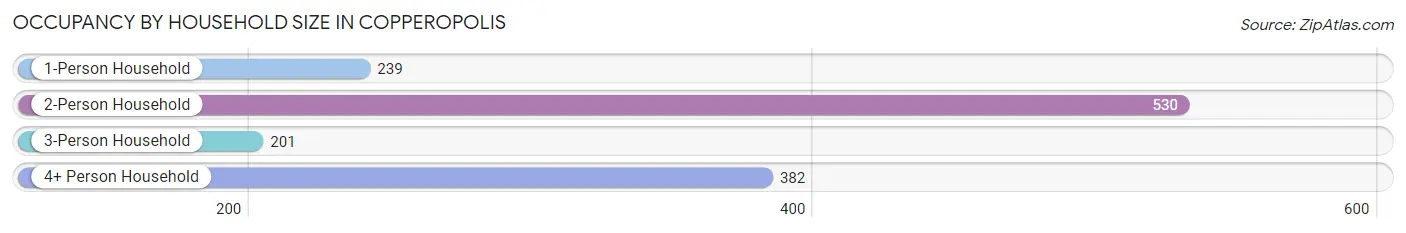
| Household Size | # Housing Units | % Housing Units |
| 1-Person Household | 239 | 17.7% |
| 2-Person Household | 530 | 39.2% |
| 3-Person Household | 201 | 14.9% |
| 4+ Person Household | 382 | 28.2% |
| Total Housing Units | 1,352 | 100.0% |
Occupancy by Ownership by Household Size in Copperopolis
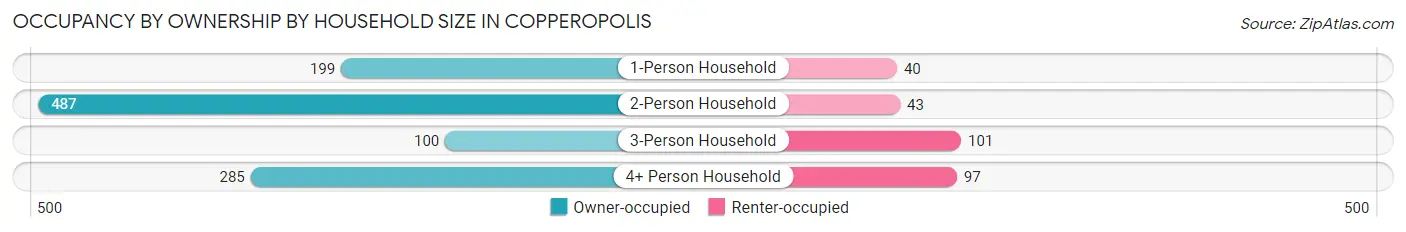
| Household Size | Owner-occupied | Renter-occupied |
| 1-Person Household | 199 (83.3%) | 40 (16.7%) |
| 2-Person Household | 487 (91.9%) | 43 (8.1%) |
| 3-Person Household | 100 (49.7%) | 101 (50.2%) |
| 4+ Person Household | 285 (74.6%) | 97 (25.4%) |
| Total Housing Units | 1,071 (79.2%) | 281 (20.8%) |
Occupancy by Educational Attainment in Copperopolis
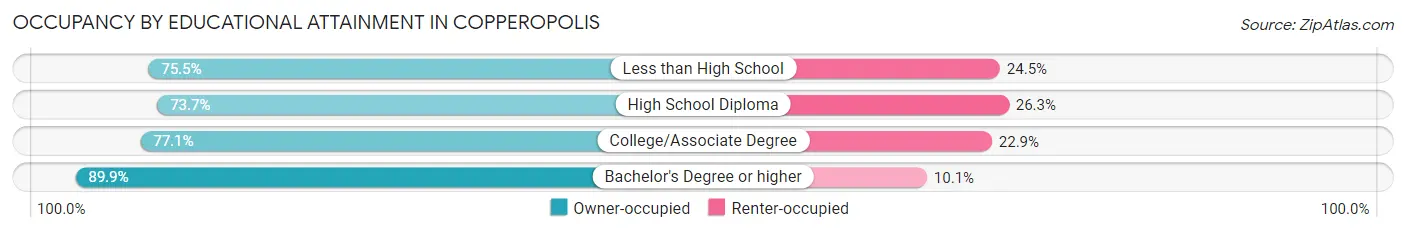
| Household Size | Owner-occupied | Renter-occupied |
| Less than High School | 40 (75.5%) | 13 (24.5%) |
| High School Diploma | 241 (73.7%) | 86 (26.3%) |
| College/Associate Degree | 504 (77.1%) | 150 (22.9%) |
| Bachelor's Degree or higher | 286 (89.9%) | 32 (10.1%) |
Occupancy by Age of Householder in Copperopolis
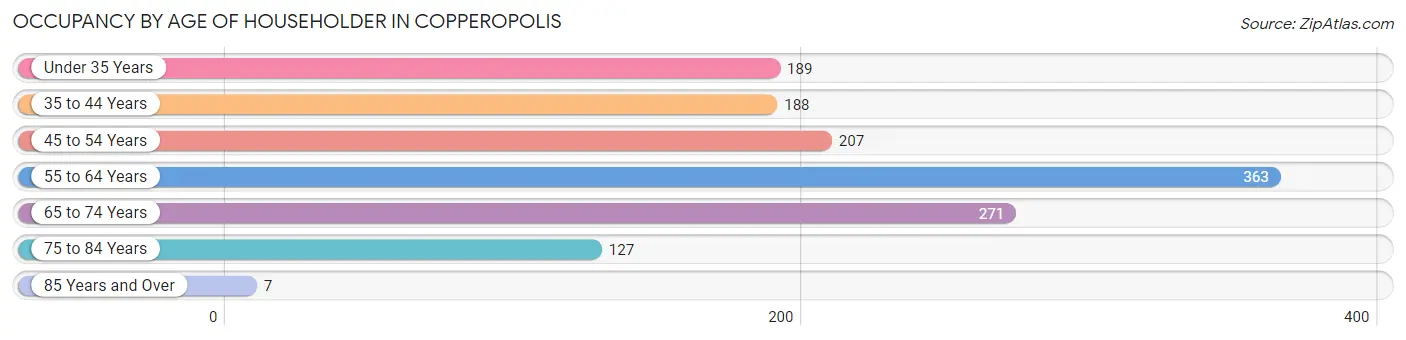
| Age Bracket | # Households | % Households |
| Under 35 Years | 189 | 14.0% |
| 35 to 44 Years | 188 | 13.9% |
| 45 to 54 Years | 207 | 15.3% |
| 55 to 64 Years | 363 | 26.9% |
| 65 to 74 Years | 271 | 20.0% |
| 75 to 84 Years | 127 | 9.4% |
| 85 Years and Over | 7 | 0.5% |
| Total | 1,352 | 100.0% |
Housing Finances in Copperopolis
Median Income by Occupancy in Copperopolis
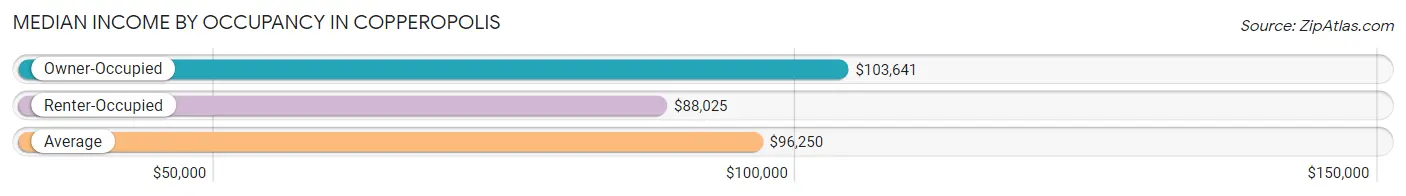
| Occupancy Type | # Households | Median Income |
| Owner-Occupied | 1,071 (79.2%) | $103,641 |
| Renter-Occupied | 281 (20.8%) | $88,025 |
| Average | 1,352 (100.0%) | $96,250 |
Occupancy by Householder Income Bracket in Copperopolis
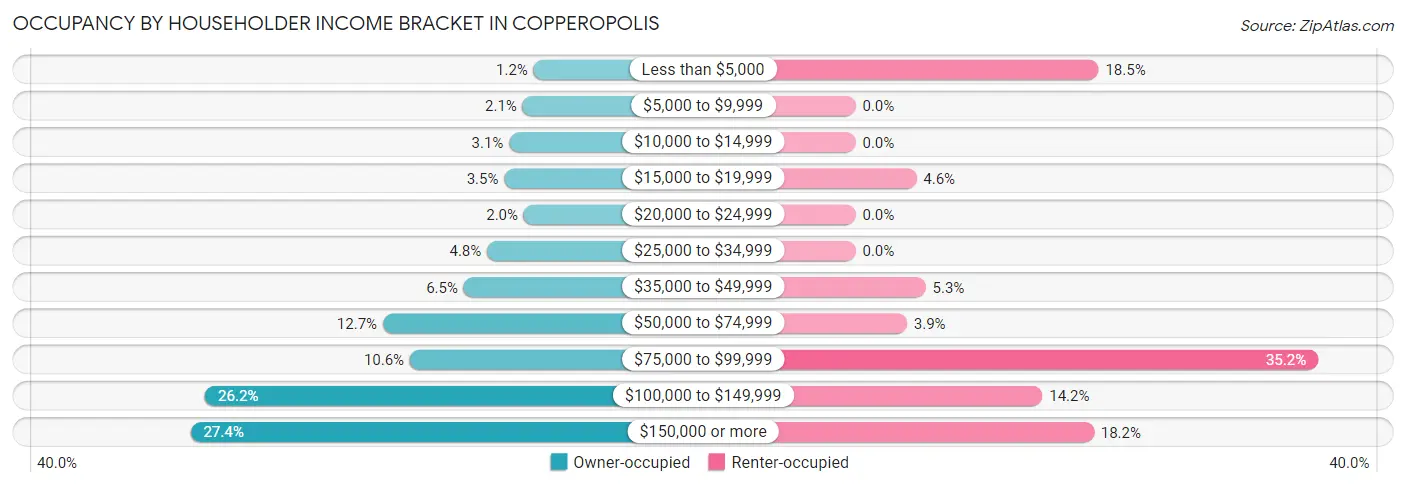
| Income Bracket | Owner-occupied | Renter-occupied |
| Less than $5,000 | 13 (1.2%) | 52 (18.5%) |
| $5,000 to $9,999 | 22 (2.1%) | 0 (0.0%) |
| $10,000 to $14,999 | 33 (3.1%) | 0 (0.0%) |
| $15,000 to $19,999 | 37 (3.5%) | 13 (4.6%) |
| $20,000 to $24,999 | 21 (2.0%) | 0 (0.0%) |
| $25,000 to $34,999 | 51 (4.8%) | 0 (0.0%) |
| $35,000 to $49,999 | 70 (6.5%) | 15 (5.3%) |
| $50,000 to $74,999 | 136 (12.7%) | 11 (3.9%) |
| $75,000 to $99,999 | 114 (10.6%) | 99 (35.2%) |
| $100,000 to $149,999 | 281 (26.2%) | 40 (14.2%) |
| $150,000 or more | 293 (27.4%) | 51 (18.1%) |
| Total | 1,071 (100.0%) | 281 (100.0%) |
Monthly Housing Cost Tiers in Copperopolis
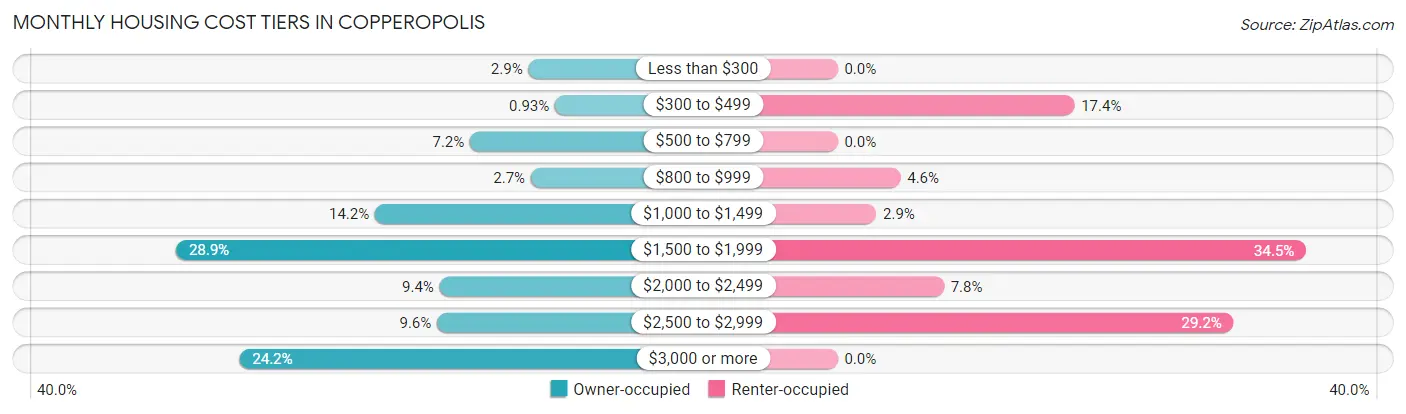
| Monthly Cost | Owner-occupied | Renter-occupied |
| Less than $300 | 31 (2.9%) | 0 (0.0%) |
| $300 to $499 | 10 (0.9%) | 49 (17.4%) |
| $500 to $799 | 77 (7.2%) | 0 (0.0%) |
| $800 to $999 | 29 (2.7%) | 13 (4.6%) |
| $1,000 to $1,499 | 152 (14.2%) | 8 (2.9%) |
| $1,500 to $1,999 | 309 (28.8%) | 97 (34.5%) |
| $2,000 to $2,499 | 101 (9.4%) | 22 (7.8%) |
| $2,500 to $2,999 | 103 (9.6%) | 82 (29.2%) |
| $3,000 or more | 259 (24.2%) | 0 (0.0%) |
| Total | 1,071 (100.0%) | 281 (100.0%) |
Physical Housing Characteristics in Copperopolis
Housing Structures in Copperopolis
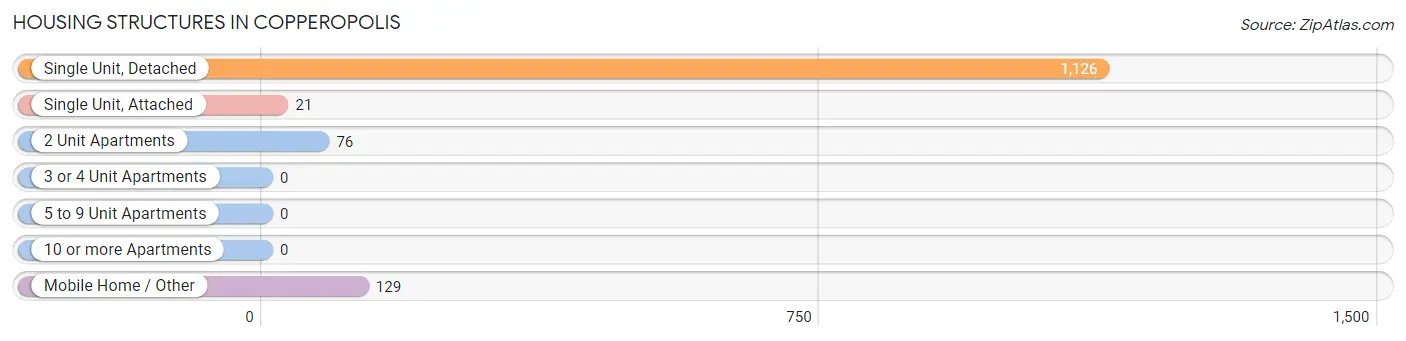
| Structure Type | # Housing Units | % Housing Units |
| Single Unit, Detached | 1,126 | 83.3% |
| Single Unit, Attached | 21 | 1.5% |
| 2 Unit Apartments | 76 | 5.6% |
| 3 or 4 Unit Apartments | 0 | 0.0% |
| 5 to 9 Unit Apartments | 0 | 0.0% |
| 10 or more Apartments | 0 | 0.0% |
| Mobile Home / Other | 129 | 9.5% |
| Total | 1,352 | 100.0% |
Housing Structures by Occupancy in Copperopolis
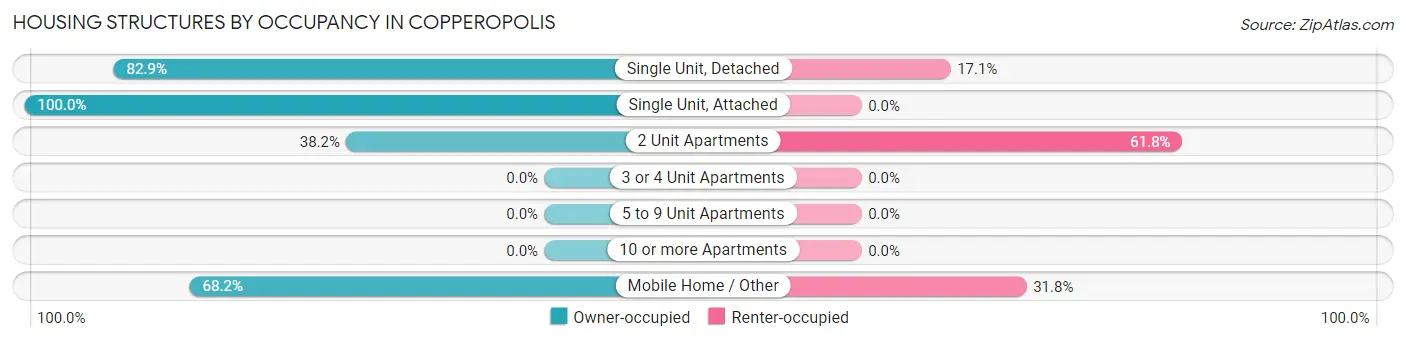
| Structure Type | Owner-occupied | Renter-occupied |
| Single Unit, Detached | 933 (82.9%) | 193 (17.1%) |
| Single Unit, Attached | 21 (100.0%) | 0 (0.0%) |
| 2 Unit Apartments | 29 (38.2%) | 47 (61.8%) |
| 3 or 4 Unit Apartments | 0 (0.0%) | 0 (0.0%) |
| 5 to 9 Unit Apartments | 0 (0.0%) | 0 (0.0%) |
| 10 or more Apartments | 0 (0.0%) | 0 (0.0%) |
| Mobile Home / Other | 88 (68.2%) | 41 (31.8%) |
| Total | 1,071 (79.2%) | 281 (20.8%) |
Housing Structures by Number of Rooms in Copperopolis
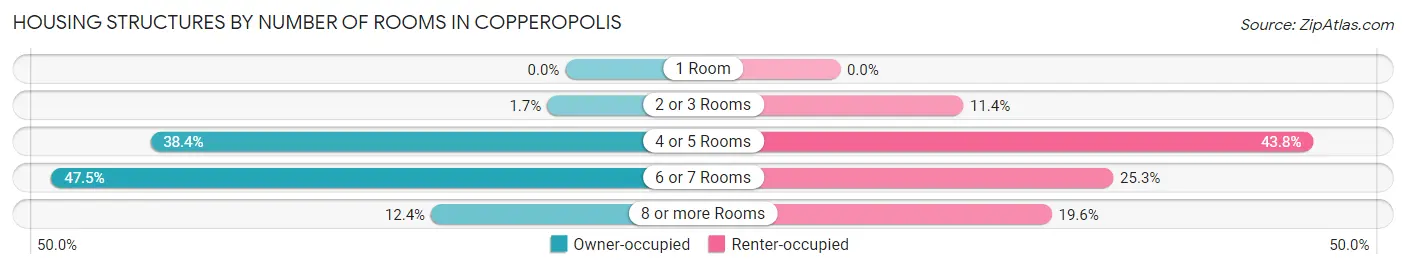
| Number of Rooms | Owner-occupied | Renter-occupied |
| 1 Room | 0 (0.0%) | 0 (0.0%) |
| 2 or 3 Rooms | 18 (1.7%) | 32 (11.4%) |
| 4 or 5 Rooms | 411 (38.4%) | 123 (43.8%) |
| 6 or 7 Rooms | 509 (47.5%) | 71 (25.3%) |
| 8 or more Rooms | 133 (12.4%) | 55 (19.6%) |
| Total | 1,071 (100.0%) | 281 (100.0%) |
Housing Structure by Heating Type in Copperopolis
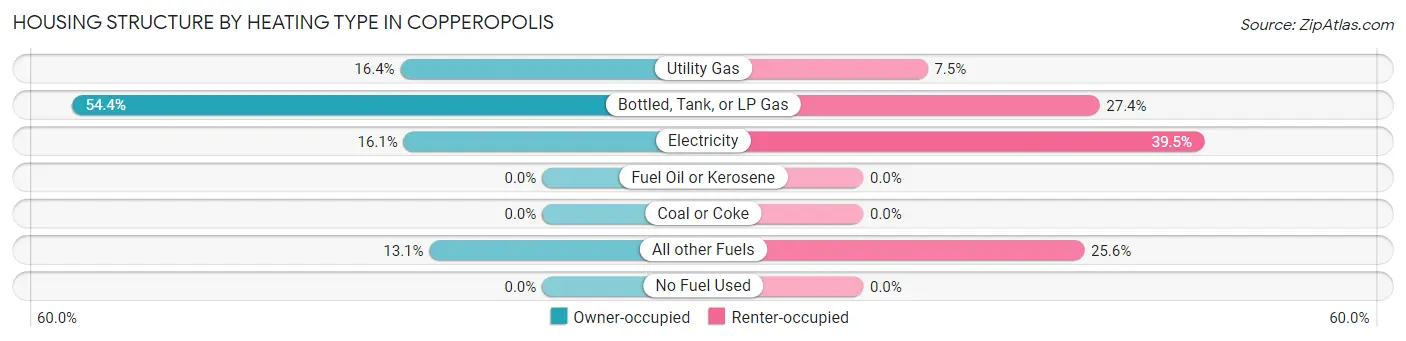
| Heating Type | Owner-occupied | Renter-occupied |
| Utility Gas | 176 (16.4%) | 21 (7.5%) |
| Bottled, Tank, or LP Gas | 583 (54.4%) | 77 (27.4%) |
| Electricity | 172 (16.1%) | 111 (39.5%) |
| Fuel Oil or Kerosene | 0 (0.0%) | 0 (0.0%) |
| Coal or Coke | 0 (0.0%) | 0 (0.0%) |
| All other Fuels | 140 (13.1%) | 72 (25.6%) |
| No Fuel Used | 0 (0.0%) | 0 (0.0%) |
| Total | 1,071 (100.0%) | 281 (100.0%) |
Household Vehicle Usage in Copperopolis
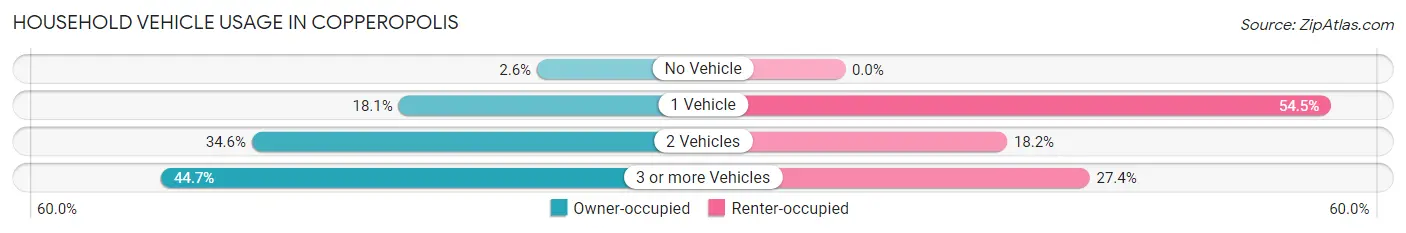
| Vehicles per Household | Owner-occupied | Renter-occupied |
| No Vehicle | 28 (2.6%) | 0 (0.0%) |
| 1 Vehicle | 194 (18.1%) | 153 (54.4%) |
| 2 Vehicles | 370 (34.5%) | 51 (18.1%) |
| 3 or more Vehicles | 479 (44.7%) | 77 (27.4%) |
| Total | 1,071 (100.0%) | 281 (100.0%) |
Real Estate & Mortgages in Copperopolis
Real Estate and Mortgage Overview in Copperopolis
| Characteristic | Without Mortgage | With Mortgage |
| Housing Units | 258 | 813 |
| Median Property Value | $411,900 | $367,800 |
| Median Household Income | $56,000 | $226 |
| Monthly Housing Costs | $928 | $259 |
| Real Estate Taxes | $3,736 | $52 |
Property Value by Mortgage Status in Copperopolis
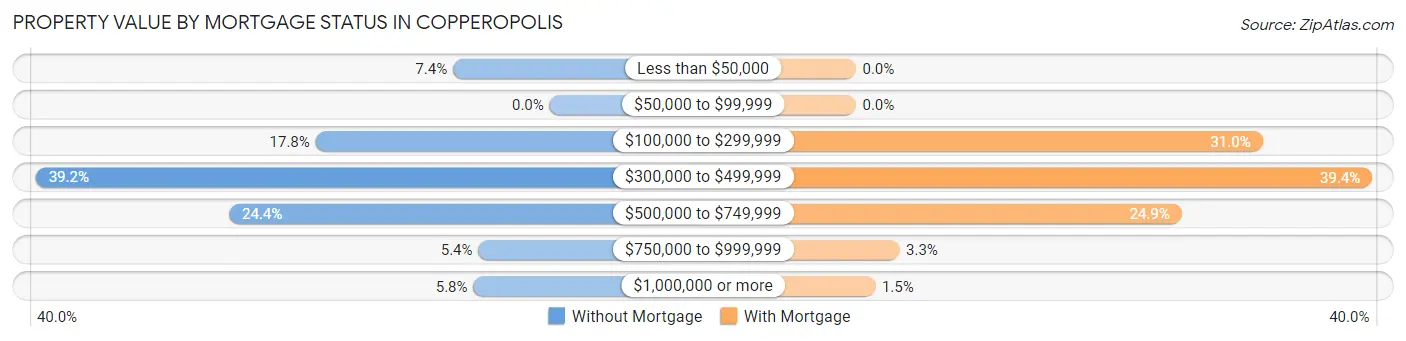
| Property Value | Without Mortgage | With Mortgage |
| Less than $50,000 | 19 (7.4%) | 0 (0.0%) |
| $50,000 to $99,999 | 0 (0.0%) | 0 (0.0%) |
| $100,000 to $299,999 | 46 (17.8%) | 252 (31.0%) |
| $300,000 to $499,999 | 101 (39.2%) | 320 (39.4%) |
| $500,000 to $749,999 | 63 (24.4%) | 202 (24.8%) |
| $750,000 to $999,999 | 14 (5.4%) | 27 (3.3%) |
| $1,000,000 or more | 15 (5.8%) | 12 (1.5%) |
| Total | 258 (100.0%) | 813 (100.0%) |
Household Income by Mortgage Status in Copperopolis
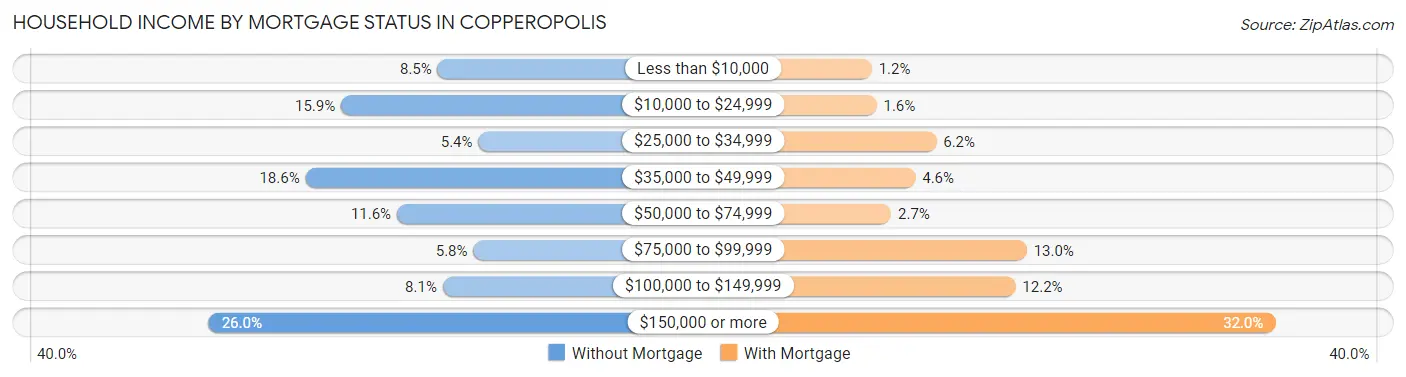
| Household Income | Without Mortgage | With Mortgage |
| Less than $10,000 | 22 (8.5%) | 10 (1.2%) |
| $10,000 to $24,999 | 41 (15.9%) | 13 (1.6%) |
| $25,000 to $34,999 | 14 (5.4%) | 50 (6.1%) |
| $35,000 to $49,999 | 48 (18.6%) | 37 (4.5%) |
| $50,000 to $74,999 | 30 (11.6%) | 22 (2.7%) |
| $75,000 to $99,999 | 15 (5.8%) | 106 (13.0%) |
| $100,000 to $149,999 | 21 (8.1%) | 99 (12.2%) |
| $150,000 or more | 67 (26.0%) | 260 (32.0%) |
| Total | 258 (100.0%) | 813 (100.0%) |
Property Value to Household Income Ratio in Copperopolis
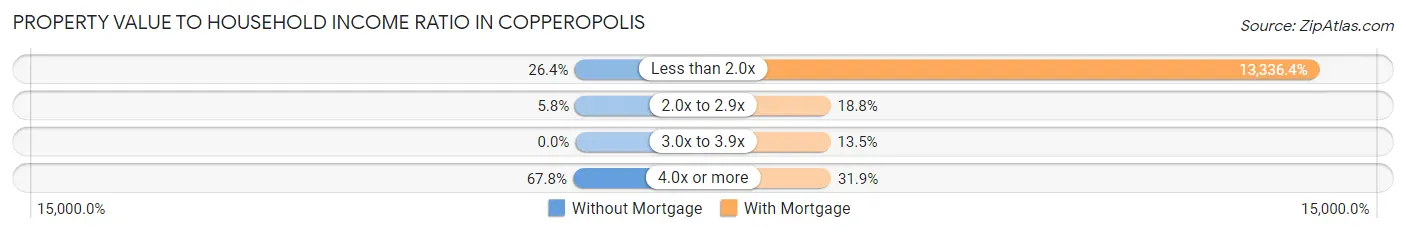
| Value-to-Income Ratio | Without Mortgage | With Mortgage |
| Less than 2.0x | 68 (26.4%) | 108,425 (13,336.4%) |
| 2.0x to 2.9x | 15 (5.8%) | 153 (18.8%) |
| 3.0x to 3.9x | 0 (0.0%) | 110 (13.5%) |
| 4.0x or more | 175 (67.8%) | 259 (31.9%) |
| Total | 258 (100.0%) | 813 (100.0%) |
Real Estate Taxes by Mortgage Status in Copperopolis
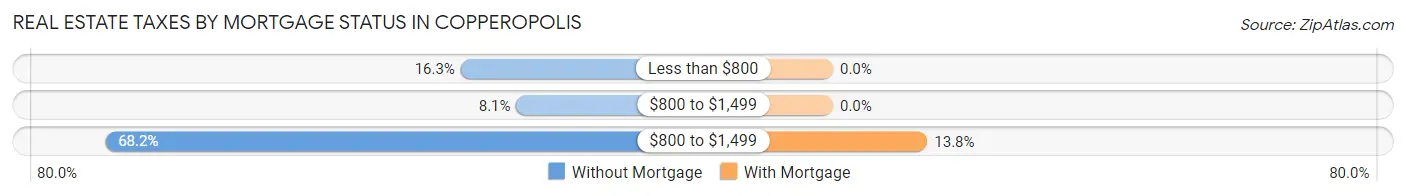
| Property Taxes | Without Mortgage | With Mortgage |
| Less than $800 | 42 (16.3%) | 0 (0.0%) |
| $800 to $1,499 | 21 (8.1%) | 0 (0.0%) |
| $800 to $1,499 | 176 (68.2%) | 112 (13.8%) |
| Total | 258 (100.0%) | 813 (100.0%) |
Health & Disability in Copperopolis
Health Insurance Coverage by Age in Copperopolis
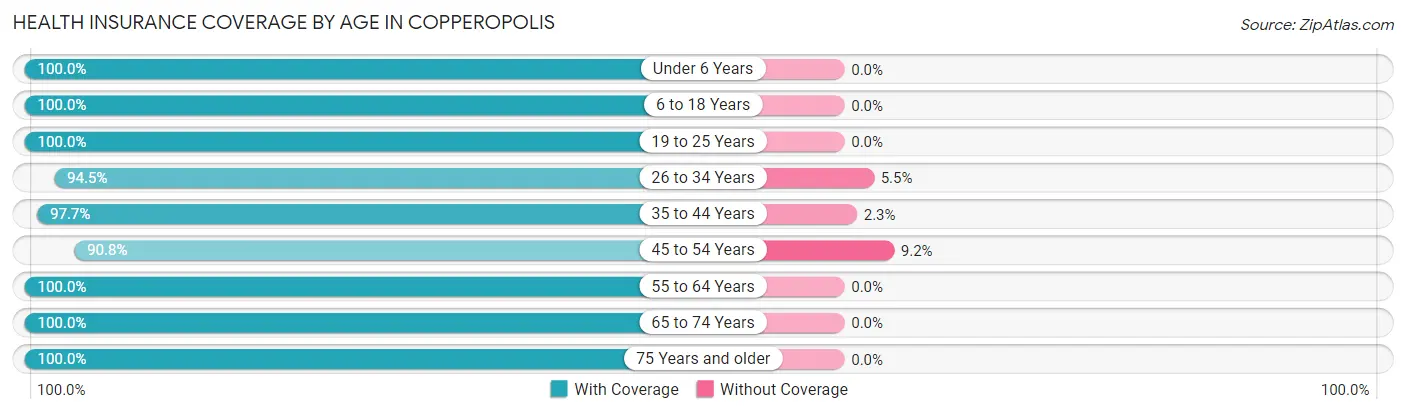
| Age Bracket | With Coverage | Without Coverage |
| Under 6 Years | 295 (100.0%) | 0 (0.0%) |
| 6 to 18 Years | 558 (100.0%) | 0 (0.0%) |
| 19 to 25 Years | 176 (100.0%) | 0 (0.0%) |
| 26 to 34 Years | 396 (94.5%) | 23 (5.5%) |
| 35 to 44 Years | 504 (97.7%) | 12 (2.3%) |
| 45 to 54 Years | 432 (90.8%) | 44 (9.2%) |
| 55 to 64 Years | 537 (100.0%) | 0 (0.0%) |
| 65 to 74 Years | 533 (100.0%) | 0 (0.0%) |
| 75 Years and older | 309 (100.0%) | 0 (0.0%) |
| Total | 3,740 (97.9%) | 79 (2.1%) |
Health Insurance Coverage by Citizenship Status in Copperopolis

| Citizenship Status | With Coverage | Without Coverage |
| Native Born | 295 (100.0%) | 0 (0.0%) |
| Foreign Born, Citizen | 558 (100.0%) | 0 (0.0%) |
| Foreign Born, not a Citizen | 176 (100.0%) | 0 (0.0%) |
Health Insurance Coverage by Household Income in Copperopolis
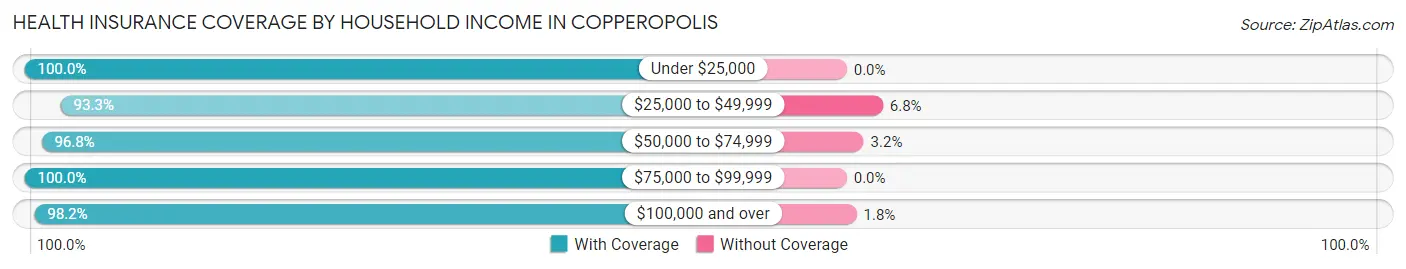
| Household Income | With Coverage | Without Coverage |
| Under $25,000 | 366 (100.0%) | 0 (0.0%) |
| $25,000 to $49,999 | 373 (93.2%) | 27 (6.8%) |
| $50,000 to $74,999 | 460 (96.8%) | 15 (3.2%) |
| $75,000 to $99,999 | 562 (100.0%) | 0 (0.0%) |
| $100,000 and over | 1,979 (98.2%) | 37 (1.8%) |
Public vs Private Health Insurance Coverage by Age in Copperopolis
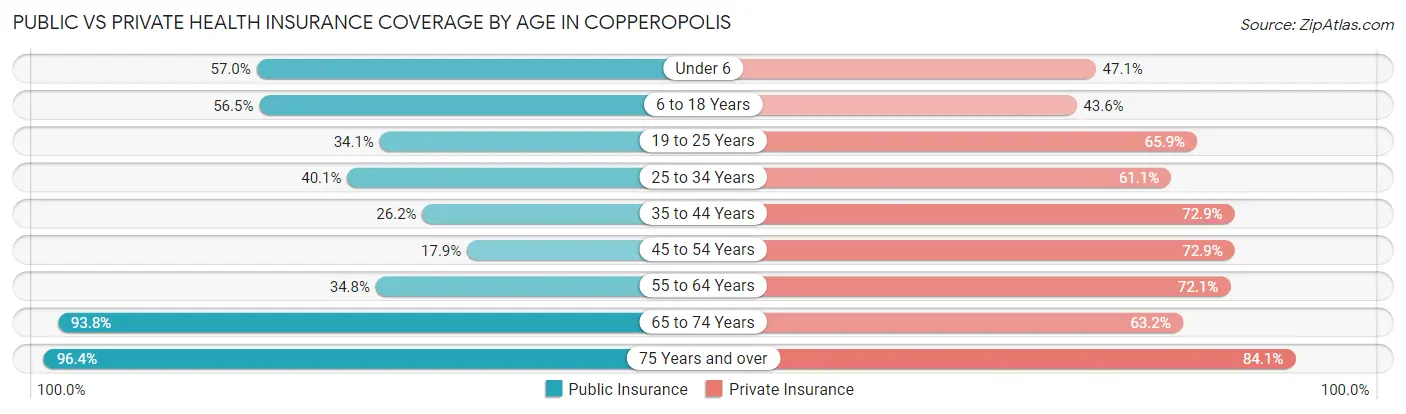
| Age Bracket | Public Insurance | Private Insurance |
| Under 6 | 168 (57.0%) | 139 (47.1%) |
| 6 to 18 Years | 315 (56.5%) | 243 (43.5%) |
| 19 to 25 Years | 60 (34.1%) | 116 (65.9%) |
| 25 to 34 Years | 168 (40.1%) | 256 (61.1%) |
| 35 to 44 Years | 135 (26.2%) | 376 (72.9%) |
| 45 to 54 Years | 85 (17.9%) | 347 (72.9%) |
| 55 to 64 Years | 187 (34.8%) | 387 (72.1%) |
| 65 to 74 Years | 500 (93.8%) | 337 (63.2%) |
| 75 Years and over | 298 (96.4%) | 260 (84.1%) |
| Total | 1,916 (50.2%) | 2,461 (64.4%) |
Disability Status by Sex by Age in Copperopolis
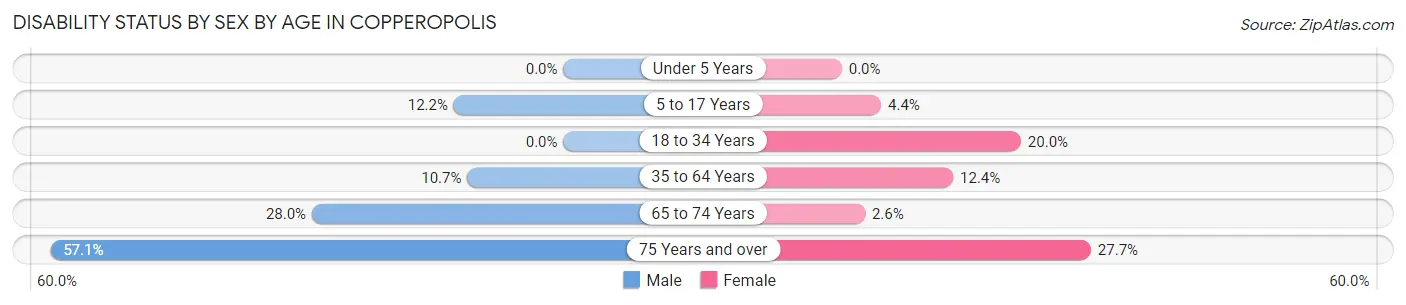
| Age Bracket | Male | Female |
| Under 5 Years | 0 (0.0%) | 0 (0.0%) |
| 5 to 17 Years | 25 (12.2%) | 16 (4.4%) |
| 18 to 34 Years | 0 (0.0%) | 75 (20.0%) |
| 35 to 64 Years | 73 (10.7%) | 105 (12.4%) |
| 65 to 74 Years | 84 (28.0%) | 6 (2.6%) |
| 75 Years and over | 88 (57.1%) | 43 (27.7%) |
Disability Class by Sex by Age in Copperopolis
Disability Class: Hearing Difficulty
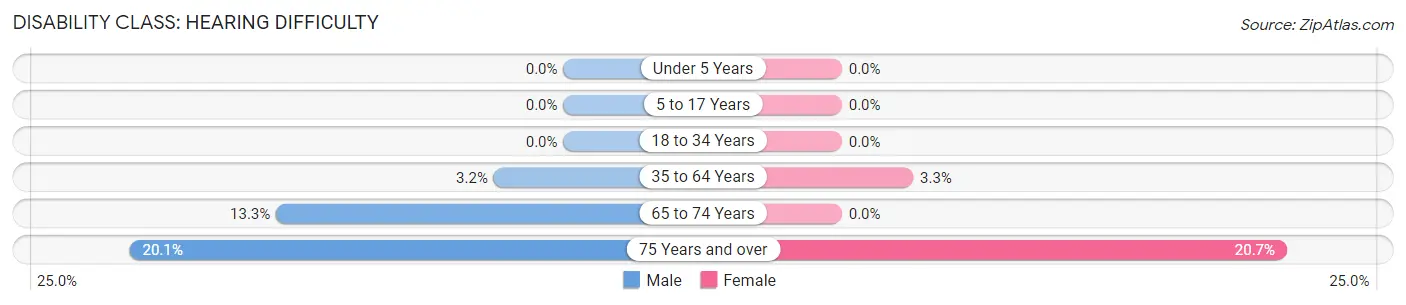
| Age Bracket | Male | Female |
| Under 5 Years | 0 (0.0%) | 0 (0.0%) |
| 5 to 17 Years | 0 (0.0%) | 0 (0.0%) |
| 18 to 34 Years | 0 (0.0%) | 0 (0.0%) |
| 35 to 64 Years | 22 (3.2%) | 28 (3.3%) |
| 65 to 74 Years | 40 (13.3%) | 0 (0.0%) |
| 75 Years and over | 31 (20.1%) | 32 (20.6%) |
Disability Class: Vision Difficulty
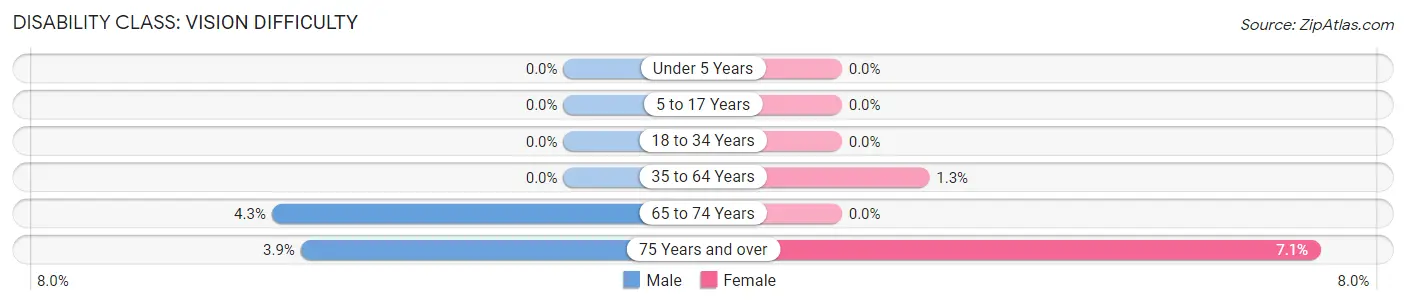
| Age Bracket | Male | Female |
| Under 5 Years | 0 (0.0%) | 0 (0.0%) |
| 5 to 17 Years | 0 (0.0%) | 0 (0.0%) |
| 18 to 34 Years | 0 (0.0%) | 0 (0.0%) |
| 35 to 64 Years | 0 (0.0%) | 11 (1.3%) |
| 65 to 74 Years | 13 (4.3%) | 0 (0.0%) |
| 75 Years and over | 6 (3.9%) | 11 (7.1%) |
Disability Class: Cognitive Difficulty
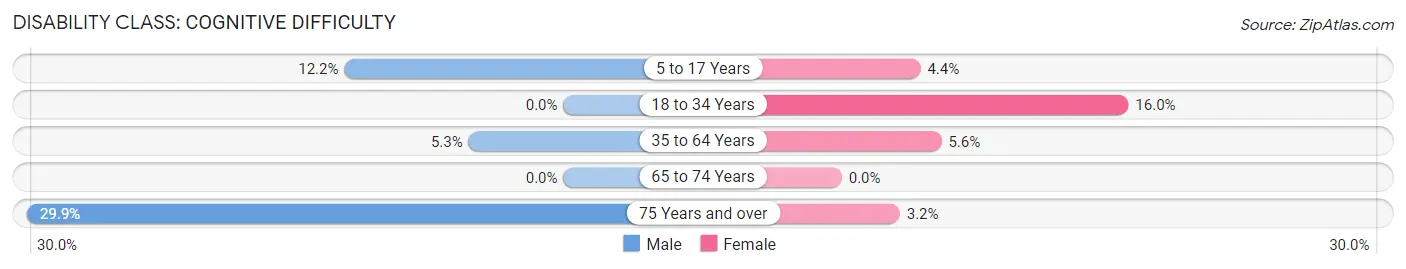
| Age Bracket | Male | Female |
| 5 to 17 Years | 25 (12.2%) | 16 (4.4%) |
| 18 to 34 Years | 0 (0.0%) | 60 (16.0%) |
| 35 to 64 Years | 36 (5.3%) | 47 (5.6%) |
| 65 to 74 Years | 0 (0.0%) | 0 (0.0%) |
| 75 Years and over | 46 (29.9%) | 5 (3.2%) |
Disability Class: Ambulatory Difficulty
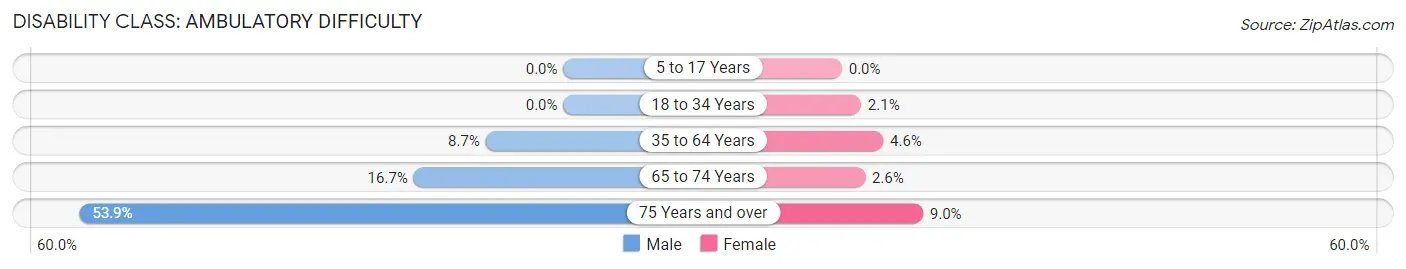
| Age Bracket | Male | Female |
| 5 to 17 Years | 0 (0.0%) | 0 (0.0%) |
| 18 to 34 Years | 0 (0.0%) | 8 (2.1%) |
| 35 to 64 Years | 59 (8.6%) | 39 (4.6%) |
| 65 to 74 Years | 50 (16.7%) | 6 (2.6%) |
| 75 Years and over | 83 (53.9%) | 14 (9.0%) |
Disability Class: Self-Care Difficulty
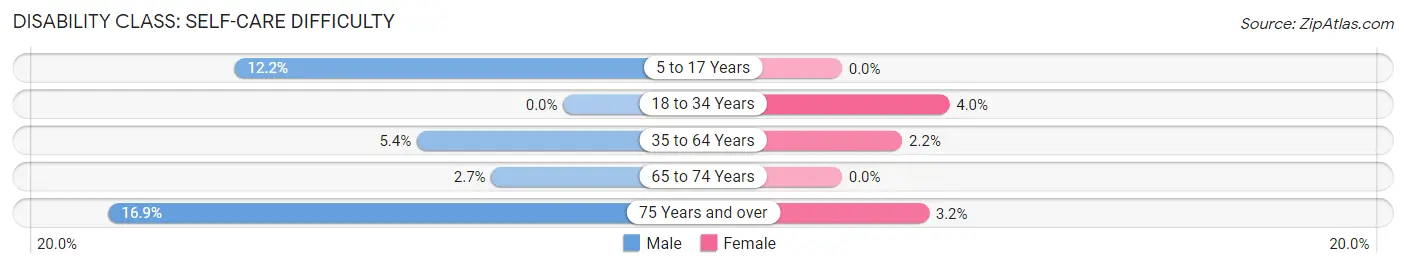
| Age Bracket | Male | Female |
| 5 to 17 Years | 25 (12.2%) | 0 (0.0%) |
| 18 to 34 Years | 0 (0.0%) | 15 (4.0%) |
| 35 to 64 Years | 37 (5.4%) | 19 (2.2%) |
| 65 to 74 Years | 8 (2.7%) | 0 (0.0%) |
| 75 Years and over | 26 (16.9%) | 5 (3.2%) |
Technology Access in Copperopolis
Computing Device Access in Copperopolis
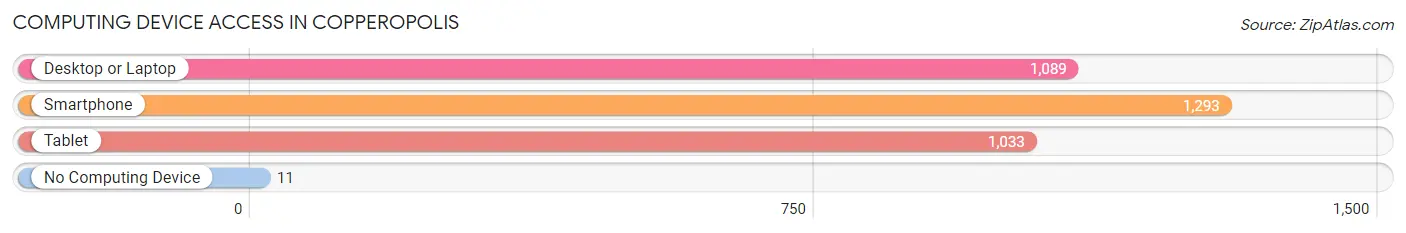
| Device Type | # Households | % Households |
| Desktop or Laptop | 1,089 | 80.5% |
| Smartphone | 1,293 | 95.6% |
| Tablet | 1,033 | 76.4% |
| No Computing Device | 11 | 0.8% |
| Total | 1,352 | 100.0% |
Internet Access in Copperopolis
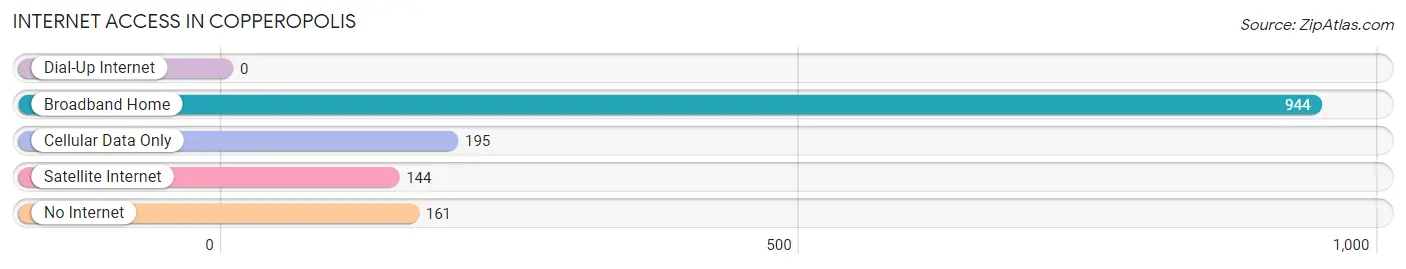
| Internet Type | # Households | % Households |
| Dial-Up Internet | 0 | 0.0% |
| Broadband Home | 944 | 69.8% |
| Cellular Data Only | 195 | 14.4% |
| Satellite Internet | 144 | 10.6% |
| No Internet | 161 | 11.9% |
| Total | 1,352 | 100.0% |
Copperopolis Summary
Copperopolis is a small town located in Calaveras County, California, United States. It is situated in the foothills of the Sierra Nevada Mountains, about 40 miles southeast of Stockton. The town was founded in 1852 and was named after the copper mines that were located in the area. The town has a population of about 1,500 people and is known for its historic buildings, scenic views, and outdoor activities.
History
Copperopolis was founded in 1852 by a group of miners who were looking for copper ore. The town was named after the copper mines that were located in the area. The town quickly grew and by 1854, it had a population of over 1,000 people. The town was home to several businesses, including a hotel, saloon, and general store.
In the late 1800s, the town experienced a decline in population due to the decline of the copper mining industry. However, the town was able to survive due to its location on the main stagecoach route between Stockton and Sonora. The town also became a popular destination for tourists who wanted to experience the scenic views of the Sierra Nevada Mountains.
In the early 1900s, the town experienced a resurgence in population due to the construction of the Copperopolis Railroad. The railroad connected the town to Stockton and allowed for the transportation of goods and people. The railroad also allowed for the development of the town’s tourism industry.
Geography
Copperopolis is located in Calaveras County, California, United States. It is situated in the foothills of the Sierra Nevada Mountains, about 40 miles southeast of Stockton. The town is located at an elevation of 1,845 feet and has a total area of 1.2 square miles.
The town is surrounded by rolling hills and is home to several lakes, including Lake Tulloch and Lake Don Pedro. The town is also home to several parks, including Copperopolis Town Square Park and Copperopolis Community Park.
Economy
The economy of Copperopolis is largely based on tourism and outdoor recreation. The town is home to several businesses, including restaurants, hotels, and retail stores. The town is also home to several wineries and vineyards, which attract visitors from all over the world.
The town is also home to several manufacturing companies, including a copper smelting plant and a copper wire manufacturing plant. The town is also home to several mining companies, which extract copper ore from the surrounding hills.
Demographics
As of the 2010 census, the population of Copperopolis was 1,521. The town has a population density of 1,250 people per square mile. The median age of the population is 44.7 years, and the median household income is $50,000.
The town is predominantly white, with a population that is 94.3% white, 1.2% Hispanic or Latino, 0.7% Asian, 0.2% African American, and 0.1% Native American. The town is also home to a small population of Native Americans, who make up 0.1% of the population.
Conclusion
Copperopolis is a small town located in Calaveras County, California, United States. It is situated in the foothills of the Sierra Nevada Mountains, about 40 miles southeast of Stockton. The town was founded in 1852 and was named after the copper mines that were located in the area. The town has a population of about 1,500 people and is known for its historic buildings, scenic views, and outdoor activities. The economy of Copperopolis is largely based on tourism and outdoor recreation. The town is predominantly white, with a population that is 94.3% white, 1.2% Hispanic or Latino, 0.7% Asian, 0.2% African American, and 0.1% Native American.
Common Questions
What is Per Capita Income in Copperopolis?
Per Capita income in Copperopolis is $42,347.
What is the Median Family Income in Copperopolis?
Median Family Income in Copperopolis is $103,159.
What is the Median Household income in Copperopolis?
Median Household Income in Copperopolis is $96,250.
What is Income or Wage Gap in Copperopolis?
Income or Wage Gap in Copperopolis is 40.5%.
Women in Copperopolis earn 59.5 cents for every dollar earned by a man.
What is Inequality or Gini Index in Copperopolis?
Inequality or Gini Index in Copperopolis is 0.41.
What is the Total Population of Copperopolis?
Total Population of Copperopolis is 3,819.
What is the Total Male Population of Copperopolis?
Total Male Population of Copperopolis is 1,772.
What is the Total Female Population of Copperopolis?
Total Female Population of Copperopolis is 2,047.
What is the Ratio of Males per 100 Females in Copperopolis?
There are 86.57 Males per 100 Females in Copperopolis.
What is the Ratio of Females per 100 Males in Copperopolis?
There are 115.52 Females per 100 Males in Copperopolis.
What is the Median Population Age in Copperopolis?
Median Population Age in Copperopolis is 43.7 Years.
What is the Average Family Size in Copperopolis
Average Family Size in Copperopolis is 3.2 People.
What is the Average Household Size in Copperopolis
Average Household Size in Copperopolis is 2.8 People.
How Large is the Labor Force in Copperopolis?
There are 1,679 People in the Labor Forcein in Copperopolis.
What is the Percentage of People in the Labor Force in Copperopolis?
54.2% of People are in the Labor Force in Copperopolis.
What is the Unemployment Rate in Copperopolis?
Unemployment Rate in Copperopolis is 9.5%.