San Andreas, CA Map & Demographics
San Andreas Map
San Andreas Overview
$20,068
PER CAPITA INCOME
$37,174
AVG FAMILY INCOME
$36,450
AVG HOUSEHOLD INCOME
0.52
INEQUALITY / GINI INDEX
2,936
TOTAL POPULATION
1,524
MALE POPULATION
1,412
FEMALE POPULATION
107.93
MALES / 100 FEMALES
92.65
FEMALES / 100 MALES
38.2
MEDIAN AGE
2.9
AVG FAMILY SIZE
2.6
AVG HOUSEHOLD SIZE
859
LABOR FORCE [ PEOPLE ]
34.4%
PERCENT IN LABOR FORCE
2.0%
UNEMPLOYMENT RATE
San Andreas Zip Codes
San Andreas Area Codes
Income in San Andreas
Income Overview in San Andreas
Per Capita Income in San Andreas is $20,068, while median incomes of families and households are $37,174 and $36,450 respectively.
| Characteristic | Number | Measure |
| Per Capita Income | 2,936 | $20,068 |
| Median Family Income | 700 | $37,174 |
| Mean Family Income | 700 | $57,230 |
| Median Household Income | 1,053 | $36,450 |
| Mean Household Income | 1,053 | $50,908 |
| Income Deficit | 700 | $0 |
| Wage / Income Gap (%) | 2,936 | 0.00% |
| Wage / Income Gap ($) | 2,936 | 100.00¢ per $1 |
| Gini / Inequality Index | 2,936 | 0.52 |
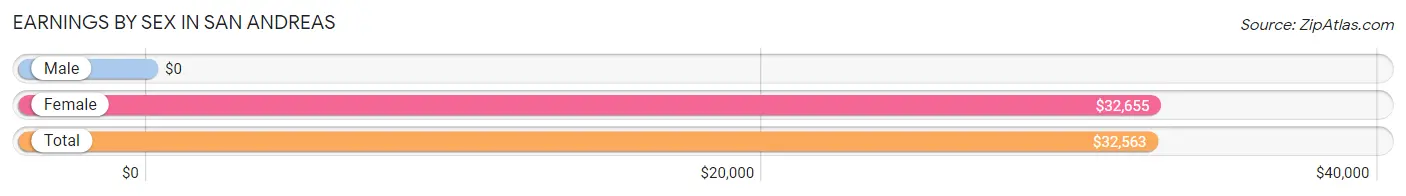
Earnings by Sex in San Andreas
| Sex | Number | Average Earnings |
| Male | 569 (56.0%) | $0 |
| Female | 447 (44.0%) | $32,655 |
| Total | 1,016 (100.0%) | $32,563 |
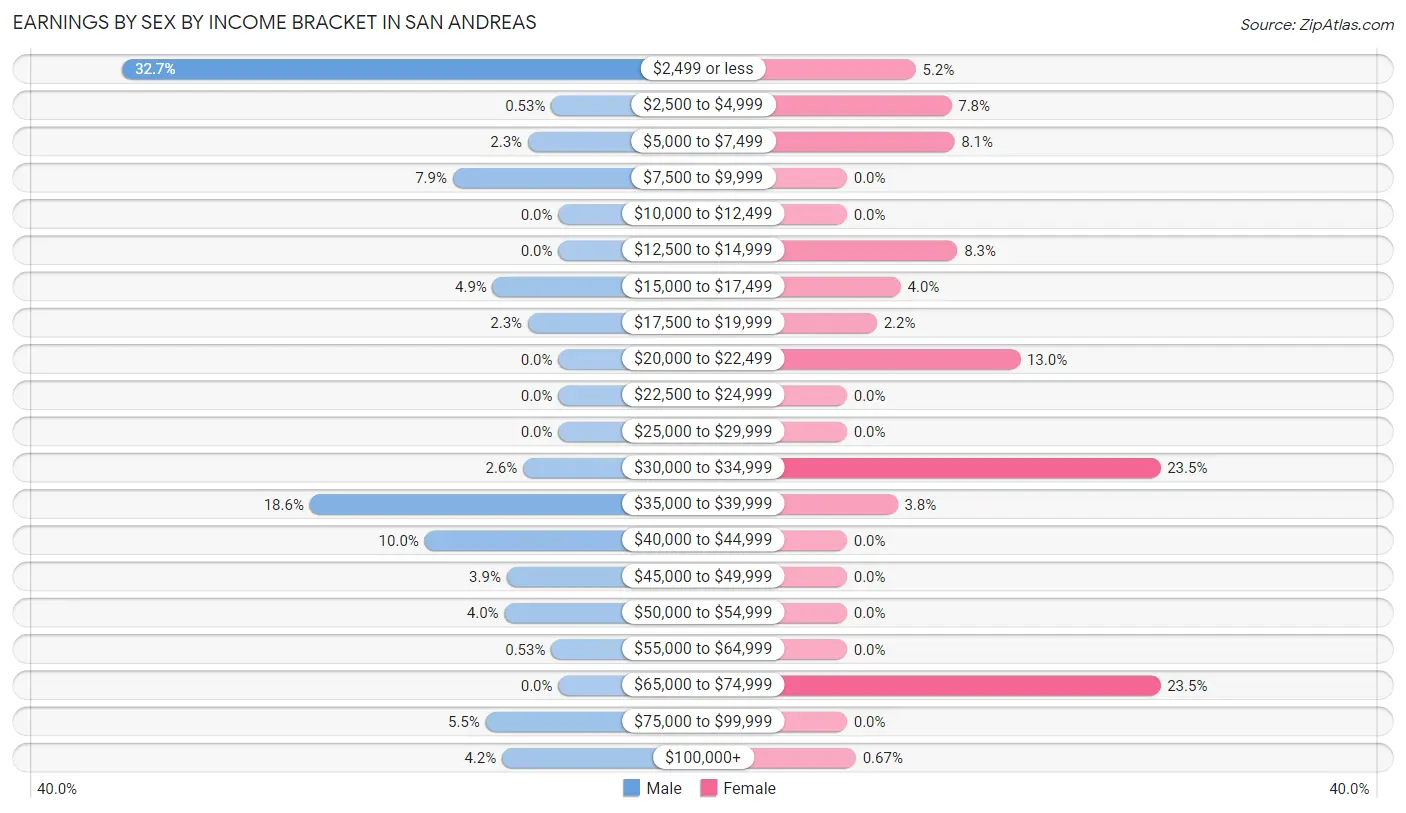
Earnings by Sex by Income Bracket in San Andreas
The most common earnings brackets in San Andreas are $2,499 or less for men (186 | 32.7%) and $30,000 to $34,999 for women (105 | 23.5%).
| Income | Male | Female |
| $2,499 or less | 186 (32.7%) | 23 (5.1%) |
| $2,500 to $4,999 | 3 (0.5%) | 35 (7.8%) |
| $5,000 to $7,499 | 13 (2.3%) | 36 (8.1%) |
| $7,500 to $9,999 | 45 (7.9%) | 0 (0.0%) |
| $10,000 to $12,499 | 0 (0.0%) | 0 (0.0%) |
| $12,500 to $14,999 | 0 (0.0%) | 37 (8.3%) |
| $15,000 to $17,499 | 28 (4.9%) | 18 (4.0%) |
| $17,500 to $19,999 | 13 (2.3%) | 10 (2.2%) |
| $20,000 to $22,499 | 0 (0.0%) | 58 (13.0%) |
| $22,500 to $24,999 | 0 (0.0%) | 0 (0.0%) |
| $25,000 to $29,999 | 0 (0.0%) | 0 (0.0%) |
| $30,000 to $34,999 | 15 (2.6%) | 105 (23.5%) |
| $35,000 to $39,999 | 106 (18.6%) | 17 (3.8%) |
| $40,000 to $44,999 | 57 (10.0%) | 0 (0.0%) |
| $45,000 to $49,999 | 22 (3.9%) | 0 (0.0%) |
| $50,000 to $54,999 | 23 (4.0%) | 0 (0.0%) |
| $55,000 to $64,999 | 3 (0.5%) | 0 (0.0%) |
| $65,000 to $74,999 | 0 (0.0%) | 105 (23.5%) |
| $75,000 to $99,999 | 31 (5.4%) | 0 (0.0%) |
| $100,000+ | 24 (4.2%) | 3 (0.7%) |
| Total | 569 (100.0%) | 447 (100.0%) |
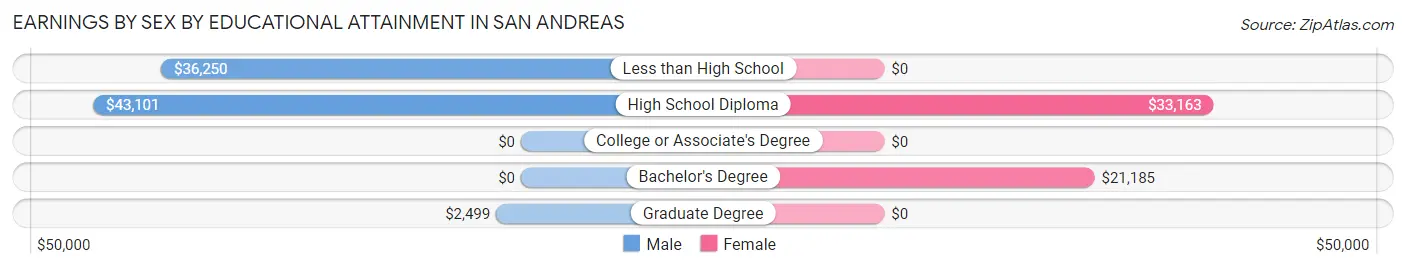
Earnings by Sex by Educational Attainment in San Andreas
Average earnings in San Andreas are $35,641 for men and $32,869 for women, a difference of 7.8%. Men with an educational attainment of high school diploma enjoy the highest average annual earnings of $43,101, while those with graduate degree education earn the least with $2,499. Women with an educational attainment of high school diploma earn the most with the average annual earnings of $33,163, while those with bachelor's degree education have the smallest earnings of $21,185.
| Educational Attainment | Male Income | Female Income |
| Less than High School | $36,250 | $0 |
| High School Diploma | $43,101 | $33,163 |
| College or Associate's Degree | - | - |
| Bachelor's Degree | - | - |
| Graduate Degree | $2,499 | $0 |
| Total | $35,641 | $32,869 |
Family Income in San Andreas
Family Income Brackets in San Andreas
According to the San Andreas family income data, there are 171 families falling into the $35,000 to $49,999 income range, which is the most common income bracket and makes up 24.4% of all families.
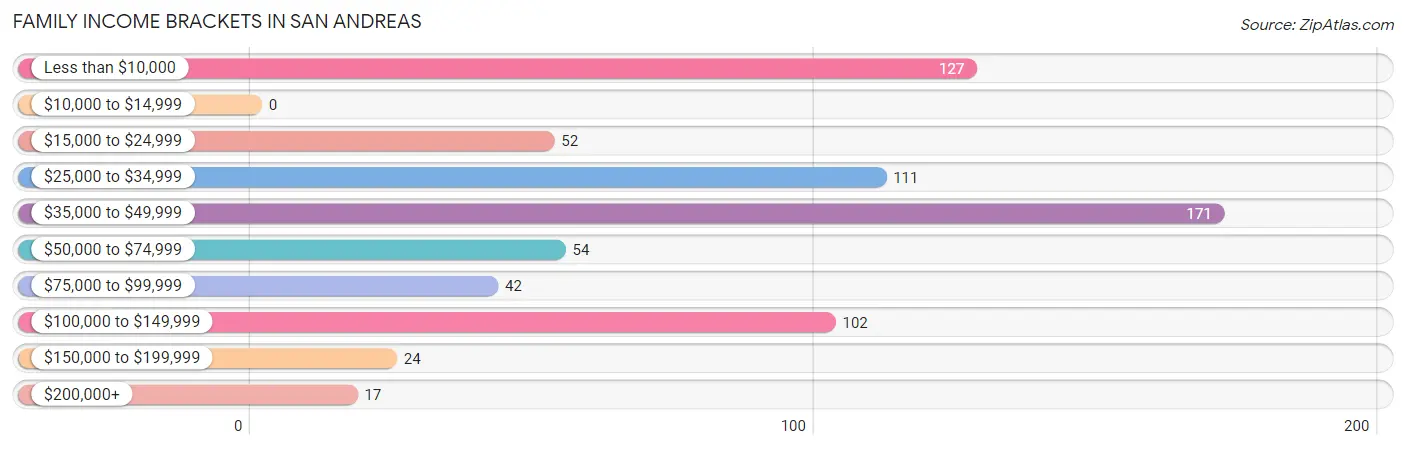
| Income Bracket | # Families | % Families |
| Less than $10,000 | 127 | 18.1% |
| $10,000 to $14,999 | 0 | 0.0% |
| $15,000 to $24,999 | 52 | 7.4% |
| $25,000 to $34,999 | 111 | 15.9% |
| $35,000 to $49,999 | 171 | 24.4% |
| $50,000 to $74,999 | 54 | 7.7% |
| $75,000 to $99,999 | 42 | 6.0% |
| $100,000 to $149,999 | 102 | 14.6% |
| $150,000 to $199,999 | 24 | 3.4% |
| $200,000+ | 17 | 2.4% |
Family Income by Famaliy Size in San Andreas
3-person families (193 | 27.6%) account for the highest median family income in San Andreas with $37,423 per family, while 3-person families (193 | 27.6%) have the highest median income of $12,474 per family member.
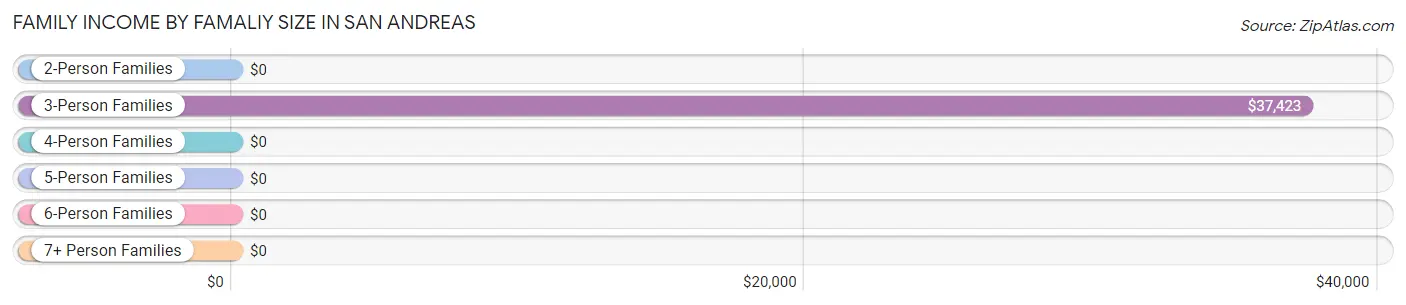
| Income Bracket | # Families | Median Income |
| 2-Person Families | 340 (48.6%) | $0 |
| 3-Person Families | 193 (27.6%) | $37,423 |
| 4-Person Families | 29 (4.1%) | $0 |
| 5-Person Families | 37 (5.3%) | $0 |
| 6-Person Families | 101 (14.4%) | $0 |
| 7+ Person Families | 0 (0.0%) | $0 |
| Total | 700 (100.0%) | $37,174 |
Family Income by Number of Earners in San Andreas
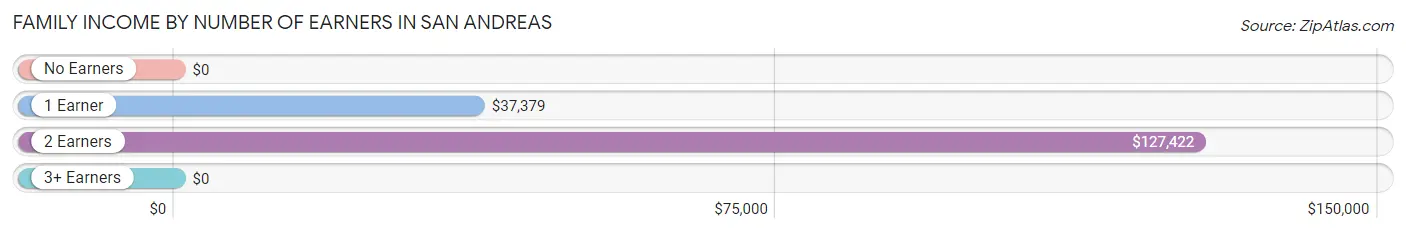
| Number of Earners | # Families | Median Income |
| No Earners | 249 (35.6%) | $0 |
| 1 Earner | 216 (30.9%) | $37,379 |
| 2 Earners | 185 (26.4%) | $127,422 |
| 3+ Earners | 50 (7.1%) | $0 |
| Total | 700 (100.0%) | $37,174 |
Household Income in San Andreas
Household Income Brackets in San Andreas
With 166 households falling in the category, the less than $10,000 income range is the most frequent in San Andreas, accounting for 15.8% of all households. In contrast, only 17 households (1.6%) fall into the $200,000+ income bracket, making it the least populous group.
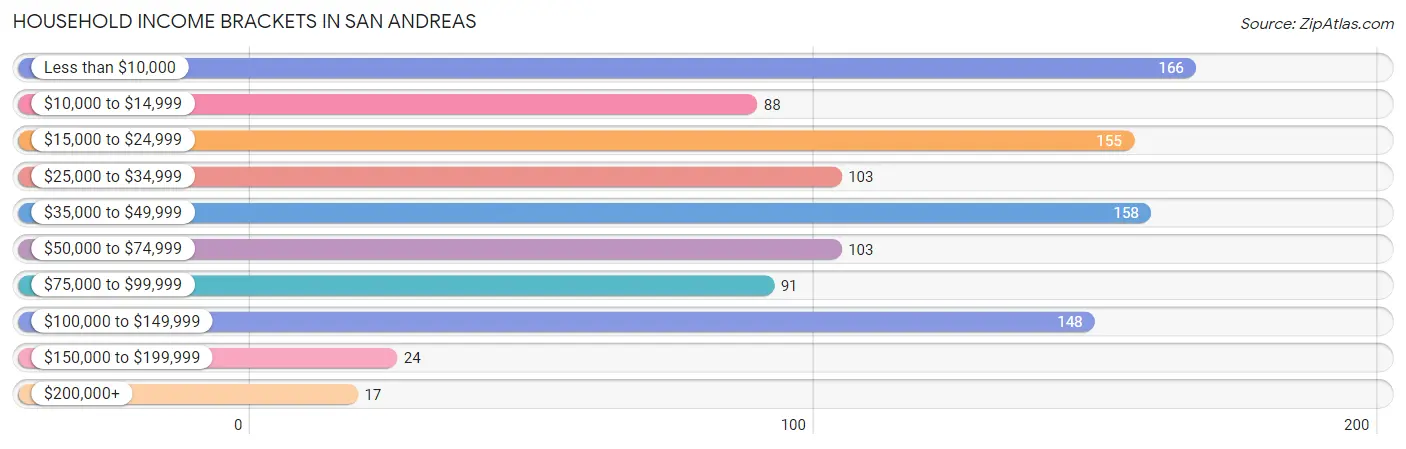
| Income Bracket | # Households | % Households |
| Less than $10,000 | 166 | 15.8% |
| $10,000 to $14,999 | 88 | 8.4% |
| $15,000 to $24,999 | 155 | 14.7% |
| $25,000 to $34,999 | 103 | 9.8% |
| $35,000 to $49,999 | 158 | 15.0% |
| $50,000 to $74,999 | 103 | 9.8% |
| $75,000 to $99,999 | 91 | 8.6% |
| $100,000 to $149,999 | 148 | 14.1% |
| $150,000 to $199,999 | 24 | 2.3% |
| $200,000+ | 17 | 1.6% |
Household Income by Householder Age in San Andreas
The median household income in San Andreas is $36,450, with the highest median household income of $53,842 found in the 25 to 44 years age bracket for the primary householder. A total of 297 households (28.2%) fall into this category.
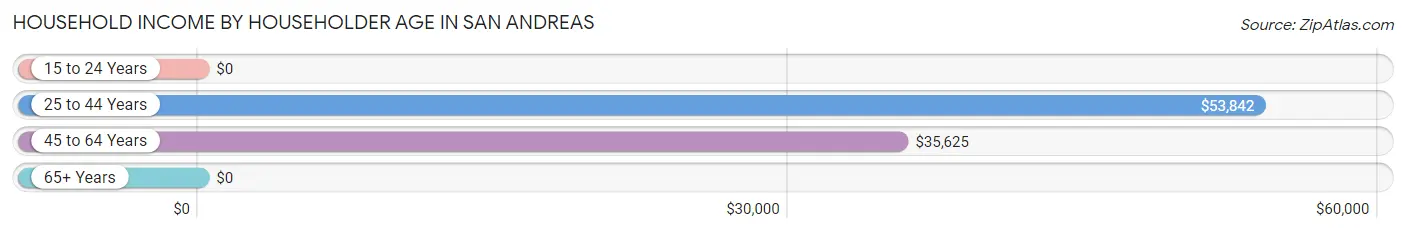
| Income Bracket | # Households | Median Income |
| 15 to 24 Years | 0 (0.0%) | $0 |
| 25 to 44 Years | 297 (28.2%) | $53,842 |
| 45 to 64 Years | 330 (31.3%) | $35,625 |
| 65+ Years | 426 (40.5%) | $0 |
| Total | 1,053 (100.0%) | $36,450 |
Poverty in San Andreas
Income Below Poverty by Sex and Age in San Andreas
With 44.7% poverty level for males and 29.8% for females among the residents of San Andreas, 6 to 11 year old males and 45 to 54 year old females are the most vulnerable to poverty, with 32 males (100.0%) and 74 females (76.3%) in their respective age groups living below the poverty level.
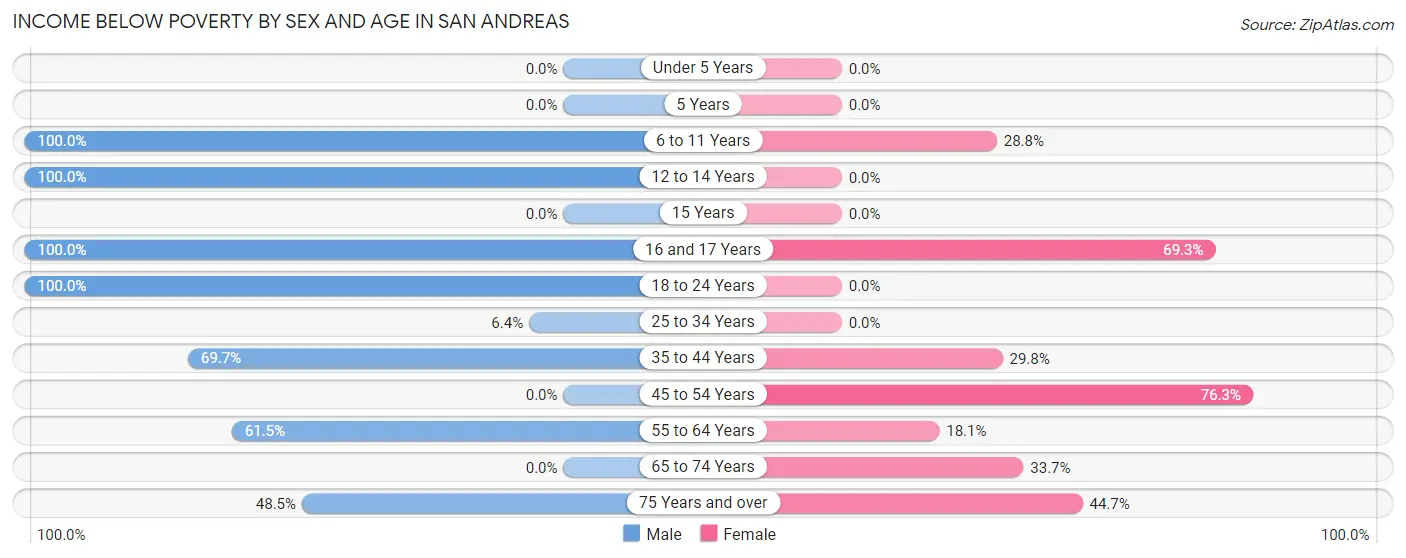
| Age Bracket | Male | Female |
| Under 5 Years | 0 (0.0%) | 0 (0.0%) |
| 5 Years | 0 (0.0%) | 0 (0.0%) |
| 6 to 11 Years | 32 (100.0%) | 42 (28.8%) |
| 12 to 14 Years | 38 (100.0%) | 0 (0.0%) |
| 15 Years | 0 (0.0%) | 0 (0.0%) |
| 16 and 17 Years | 78 (100.0%) | 61 (69.3%) |
| 18 to 24 Years | 131 (100.0%) | 0 (0.0%) |
| 25 to 34 Years | 15 (6.4%) | 0 (0.0%) |
| 35 to 44 Years | 108 (69.7%) | 54 (29.8%) |
| 45 to 54 Years | 0 (0.0%) | 74 (76.3%) |
| 55 to 64 Years | 152 (61.5%) | 19 (18.1%) |
| 65 to 74 Years | 0 (0.0%) | 91 (33.7%) |
| 75 Years and over | 83 (48.5%) | 63 (44.7%) |
| Total | 637 (44.7%) | 404 (29.8%) |
Income Above Poverty by Sex and Age in San Andreas
According to the poverty statistics in San Andreas, males aged under 5 years and females aged under 5 years are the age groups that are most secure financially, with 100.0% of males and 100.0% of females in these age groups living above the poverty line.
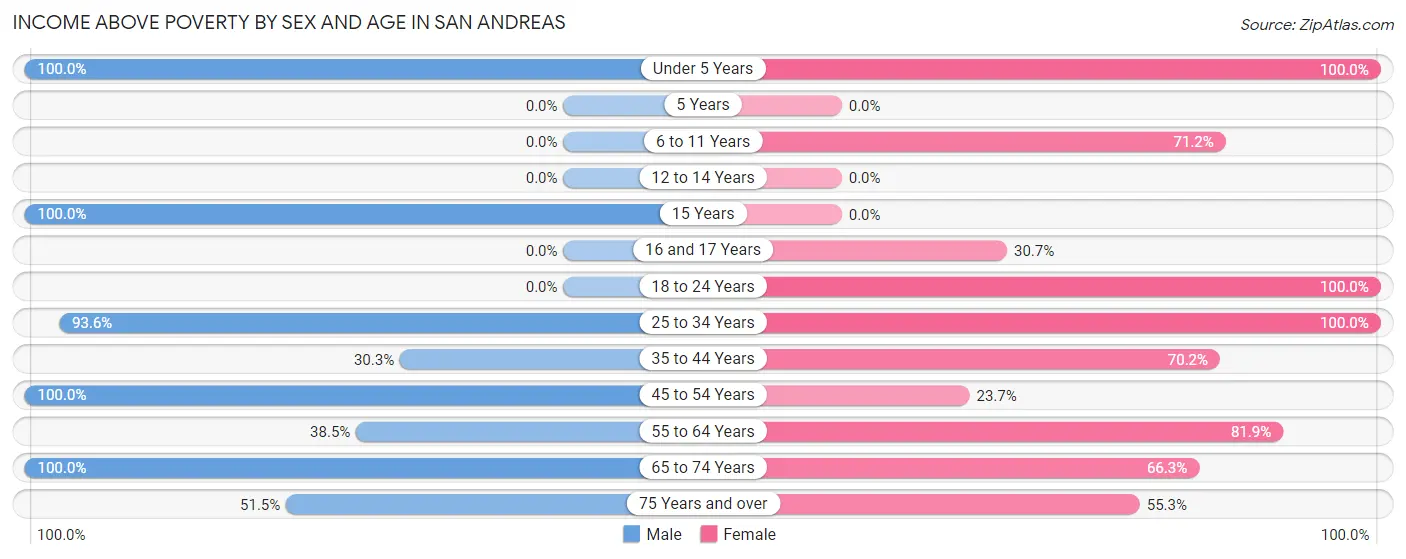
| Age Bracket | Male | Female |
| Under 5 Years | 90 (100.0%) | 90 (100.0%) |
| 5 Years | 0 (0.0%) | 0 (0.0%) |
| 6 to 11 Years | 0 (0.0%) | 104 (71.2%) |
| 12 to 14 Years | 0 (0.0%) | 0 (0.0%) |
| 15 Years | 43 (100.0%) | 0 (0.0%) |
| 16 and 17 Years | 0 (0.0%) | 27 (30.7%) |
| 18 to 24 Years | 0 (0.0%) | 18 (100.0%) |
| 25 to 34 Years | 220 (93.6%) | 218 (100.0%) |
| 35 to 44 Years | 47 (30.3%) | 127 (70.2%) |
| 45 to 54 Years | 59 (100.0%) | 23 (23.7%) |
| 55 to 64 Years | 95 (38.5%) | 86 (81.9%) |
| 65 to 74 Years | 145 (100.0%) | 179 (66.3%) |
| 75 Years and over | 88 (51.5%) | 78 (55.3%) |
| Total | 787 (55.3%) | 950 (70.2%) |
Income Below Poverty Among Married-Couple Families in San Andreas
The poverty statistics for married-couple families in San Andreas show that 38.5% or 203 of the total 528 families live below the poverty line. Families with 3 or 4 children have the highest poverty rate of 61.1%, comprising of 58 families. On the other hand, families with no children have the lowest poverty rate of 28.2%, which includes 102 families.
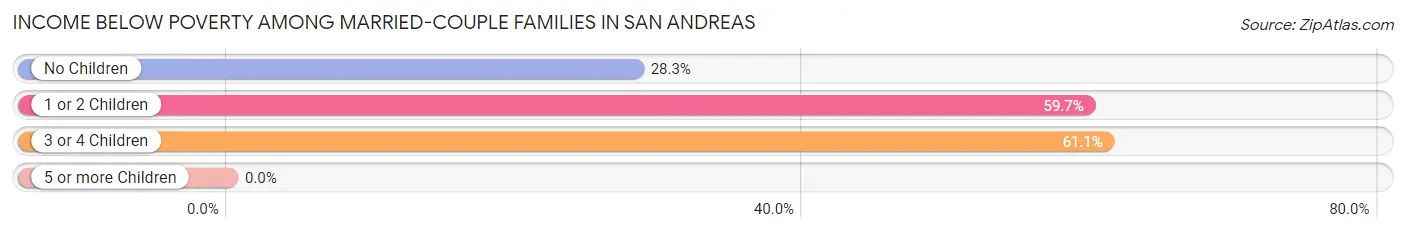
| Children | Above Poverty | Below Poverty |
| No Children | 259 (71.8%) | 102 (28.2%) |
| 1 or 2 Children | 29 (40.3%) | 43 (59.7%) |
| 3 or 4 Children | 37 (39.0%) | 58 (61.1%) |
| 5 or more Children | 0 (0.0%) | 0 (0.0%) |
| Total | 325 (61.6%) | 203 (38.5%) |
Income Below Poverty Among Single-Parent Households in San Andreas
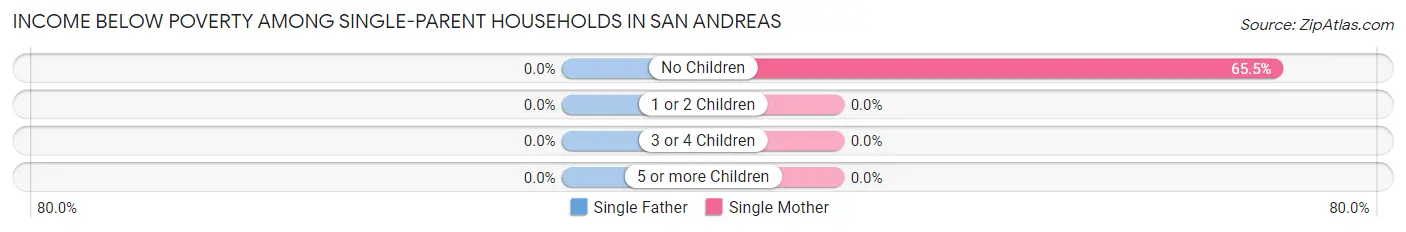
| Children | Single Father | Single Mother |
| No Children | 0 (0.0%) | 19 (65.5%) |
| 1 or 2 Children | 0 (0.0%) | 0 (0.0%) |
| 3 or 4 Children | 0 (0.0%) | 0 (0.0%) |
| 5 or more Children | 0 (0.0%) | 0 (0.0%) |
| Total | 0 (0.0%) | 19 (15.0%) |
Income Below Poverty Among Married-Couple vs Single-Parent Households in San Andreas
The poverty data for San Andreas shows that 203 of the married-couple family households (38.5%) and 19 of the single-parent households (11.1%) are living below the poverty level. Within the married-couple family households, those with 3 or 4 children have the highest poverty rate, with 58 households (61.1%) falling below the poverty line. Among the single-parent households, those with no children have the highest poverty rate, with 19 household (35.8%) living below poverty.
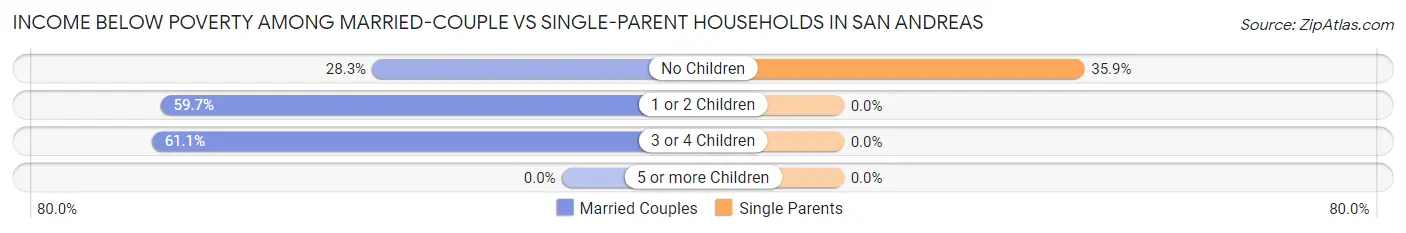
| Children | Married-Couple Families | Single-Parent Households |
| No Children | 102 (28.2%) | 19 (35.8%) |
| 1 or 2 Children | 43 (59.7%) | 0 (0.0%) |
| 3 or 4 Children | 58 (61.1%) | 0 (0.0%) |
| 5 or more Children | 0 (0.0%) | 0 (0.0%) |
| Total | 203 (38.5%) | 19 (11.1%) |
Race in San Andreas
The most populous races in San Andreas are White / Caucasian (2,532 | 86.2%), Hispanic or Latino (866 | 29.5%), and Some other Race (139 | 4.7%).
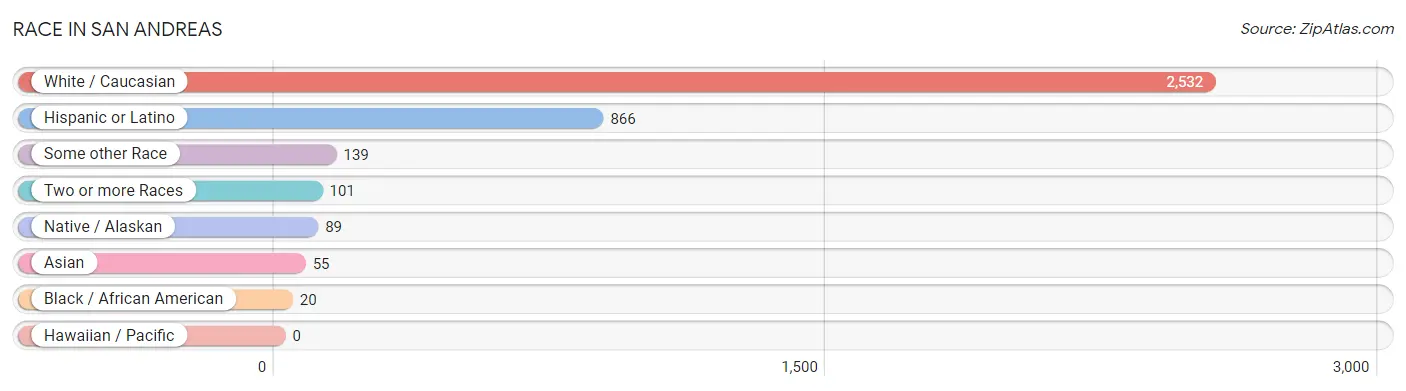
| Race | # Population | % Population |
| Asian | 55 | 1.9% |
| Black / African American | 20 | 0.7% |
| Hawaiian / Pacific | 0 | 0.0% |
| Hispanic or Latino | 866 | 29.5% |
| Native / Alaskan | 89 | 3.0% |
| White / Caucasian | 2,532 | 86.2% |
| Two or more Races | 101 | 3.4% |
| Some other Race | 139 | 4.7% |
| Total | 2,936 | 100.0% |
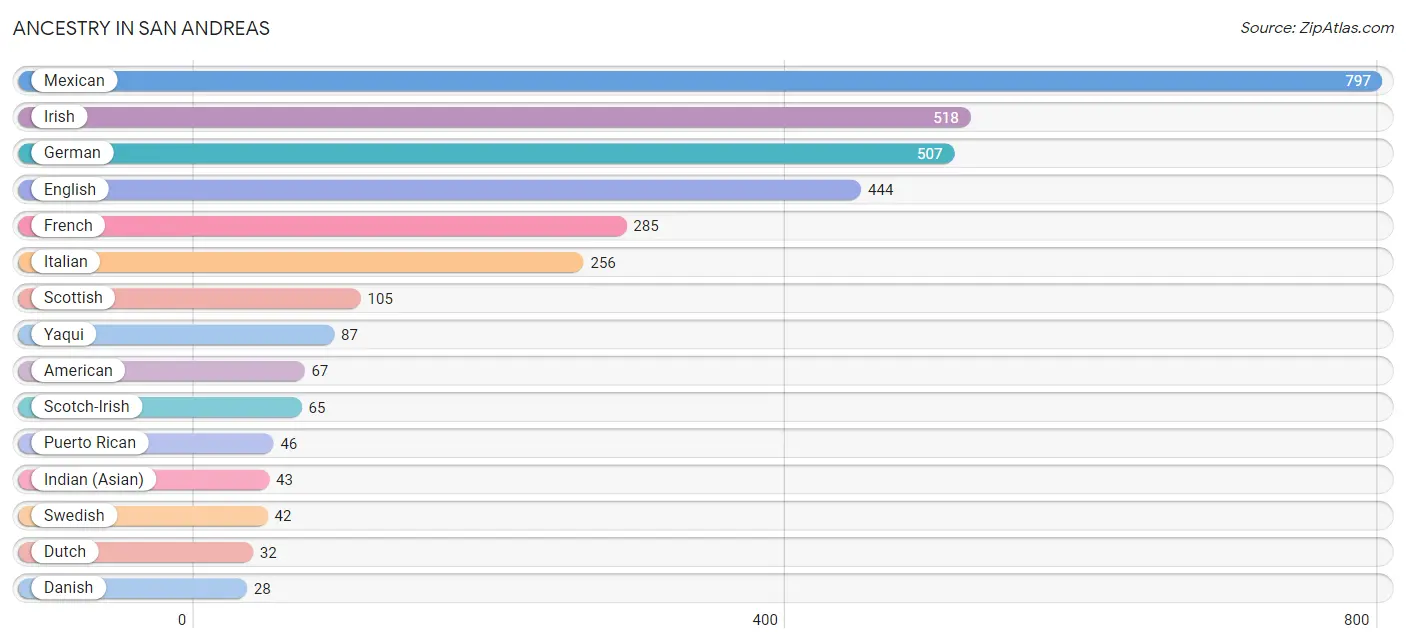
Ancestry in San Andreas
The most populous ancestries reported in San Andreas are Mexican (797 | 27.2%), Irish (518 | 17.6%), German (507 | 17.3%), English (444 | 15.1%), and French (285 | 9.7%), together accounting for 86.9% of all San Andreas residents.
| Ancestry | # Population | % Population |
| American | 67 | 2.3% |
| Bhutanese | 6 | 0.2% |
| Blackfeet | 3 | 0.1% |
| British | 10 | 0.3% |
| Central American | 23 | 0.8% |
| Croatian | 22 | 0.7% |
| Danish | 28 | 0.9% |
| Dutch | 32 | 1.1% |
| English | 444 | 15.1% |
| European | 9 | 0.3% |
| Finnish | 14 | 0.5% |
| French | 285 | 9.7% |
| German | 507 | 17.3% |
| Greek | 24 | 0.8% |
| Indian (Asian) | 43 | 1.5% |
| Irish | 518 | 17.6% |
| Italian | 256 | 8.7% |
| Korean | 6 | 0.2% |
| Mexican | 797 | 27.2% |
| Norwegian | 6 | 0.2% |
| Polish | 5 | 0.2% |
| Portuguese | 3 | 0.1% |
| Puerto Rican | 46 | 1.6% |
| Salvadoran | 23 | 0.8% |
| Scandinavian | 5 | 0.2% |
| Scotch-Irish | 65 | 2.2% |
| Scottish | 105 | 3.6% |
| Sri Lankan | 3 | 0.1% |
| Swedish | 42 | 1.4% |
| Swiss | 3 | 0.1% |
| Ukrainian | 5 | 0.2% |
| Welsh | 14 | 0.5% |
| Yaqui | 87 | 3.0% | View All 33 Rows |
Immigrants in San Andreas
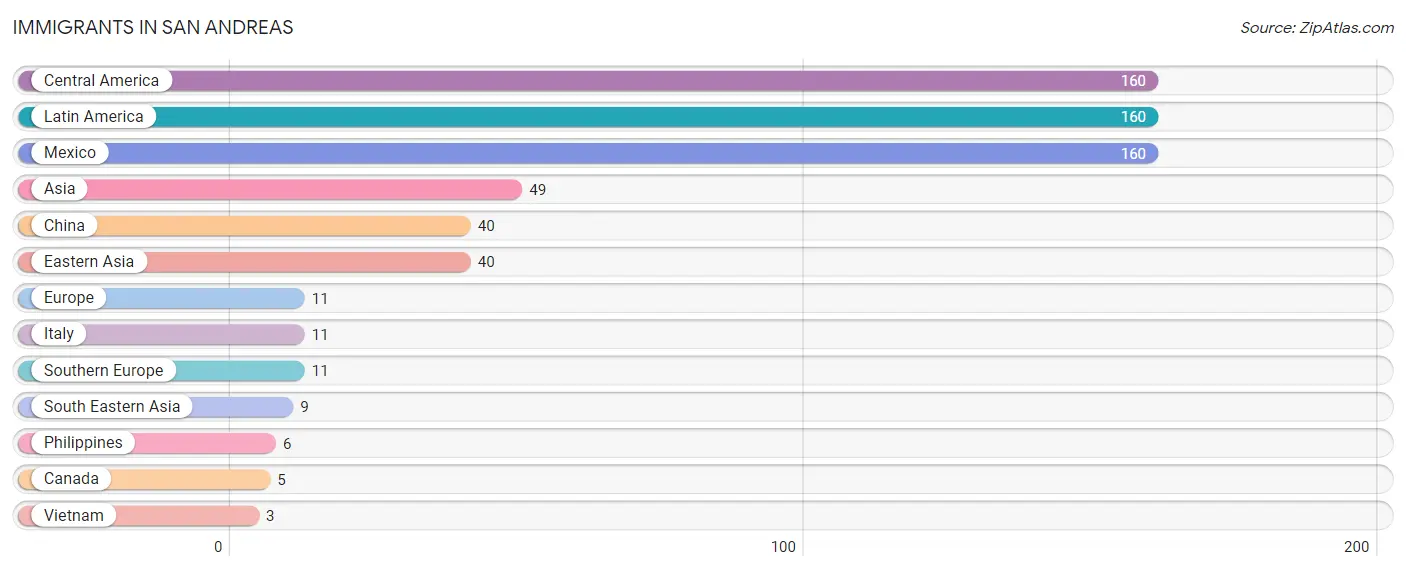
The most numerous immigrant groups reported in San Andreas came from Central America (160 | 5.4%), Latin America (160 | 5.4%), Mexico (160 | 5.4%), Asia (49 | 1.7%), and China (40 | 1.4%), together accounting for 19.4% of all San Andreas residents.
| Immigration Origin | # Population | % Population |
| Asia | 49 | 1.7% |
| Canada | 5 | 0.2% |
| Central America | 160 | 5.4% |
| China | 40 | 1.4% |
| Eastern Asia | 40 | 1.4% |
| Europe | 11 | 0.4% |
| Italy | 11 | 0.4% |
| Latin America | 160 | 5.4% |
| Mexico | 160 | 5.4% |
| Philippines | 6 | 0.2% |
| South Eastern Asia | 9 | 0.3% |
| Southern Europe | 11 | 0.4% |
| Vietnam | 3 | 0.1% | View All 13 Rows |
Sex and Age in San Andreas
Sex and Age in San Andreas
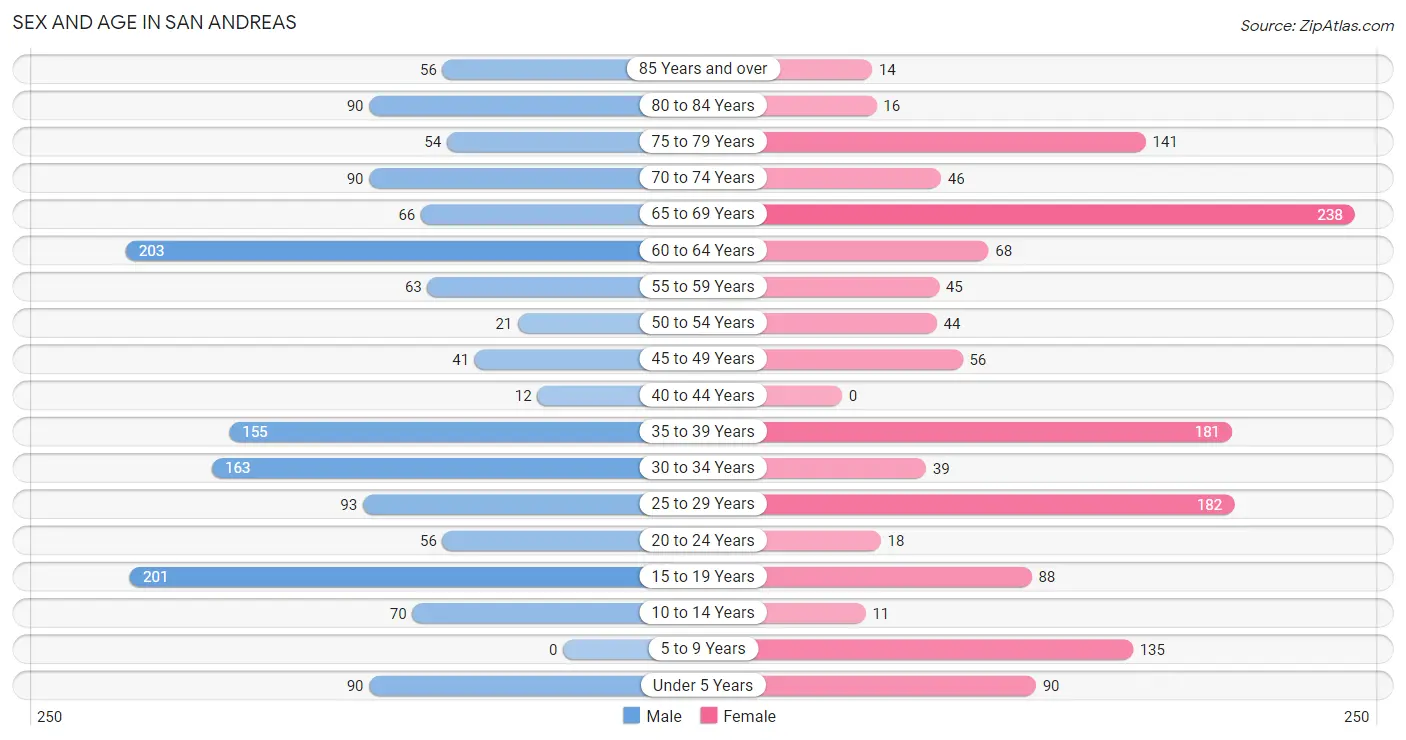
The most populous age groups in San Andreas are 60 to 64 Years (203 | 13.3%) for men and 65 to 69 Years (238 | 16.9%) for women.
| Age Bracket | Male | Female |
| Under 5 Years | 90 (5.9%) | 90 (6.4%) |
| 5 to 9 Years | 0 (0.0%) | 135 (9.6%) |
| 10 to 14 Years | 70 (4.6%) | 11 (0.8%) |
| 15 to 19 Years | 201 (13.2%) | 88 (6.2%) |
| 20 to 24 Years | 56 (3.7%) | 18 (1.3%) |
| 25 to 29 Years | 93 (6.1%) | 182 (12.9%) |
| 30 to 34 Years | 163 (10.7%) | 39 (2.8%) |
| 35 to 39 Years | 155 (10.2%) | 181 (12.8%) |
| 40 to 44 Years | 12 (0.8%) | 0 (0.0%) |
| 45 to 49 Years | 41 (2.7%) | 56 (4.0%) |
| 50 to 54 Years | 21 (1.4%) | 44 (3.1%) |
| 55 to 59 Years | 63 (4.1%) | 45 (3.2%) |
| 60 to 64 Years | 203 (13.3%) | 68 (4.8%) |
| 65 to 69 Years | 66 (4.3%) | 238 (16.9%) |
| 70 to 74 Years | 90 (5.9%) | 46 (3.3%) |
| 75 to 79 Years | 54 (3.5%) | 141 (10.0%) |
| 80 to 84 Years | 90 (5.9%) | 16 (1.1%) |
| 85 Years and over | 56 (3.7%) | 14 (1.0%) |
| Total | 1,524 (100.0%) | 1,412 (100.0%) |
Families and Households in San Andreas
Median Family Size in San Andreas
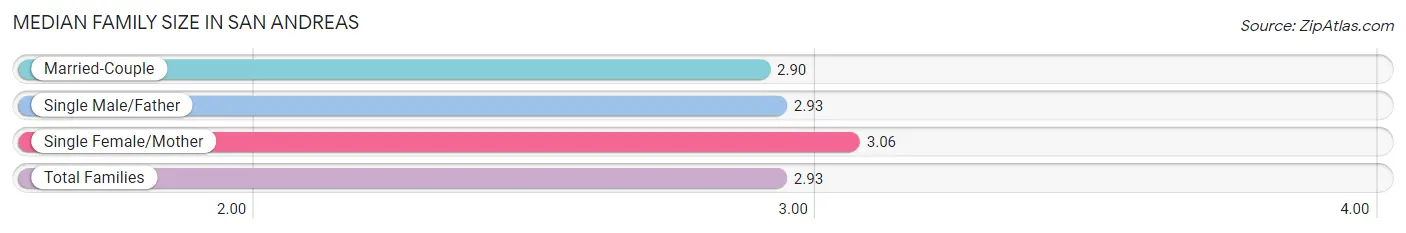
The median family size in San Andreas is 2.93 persons per family, with single female/mother families (127 | 18.1%) accounting for the largest median family size of 3.06 persons per family. On the other hand, married-couple families (528 | 75.4%) represent the smallest median family size with 2.90 persons per family.
| Family Type | # Families | Family Size |
| Married-Couple | 528 (75.4%) | 2.90 |
| Single Male/Father | 45 (6.4%) | 2.93 |
| Single Female/Mother | 127 (18.1%) | 3.06 |
| Total Families | 700 (100.0%) | 2.93 |
Median Household Size in San Andreas
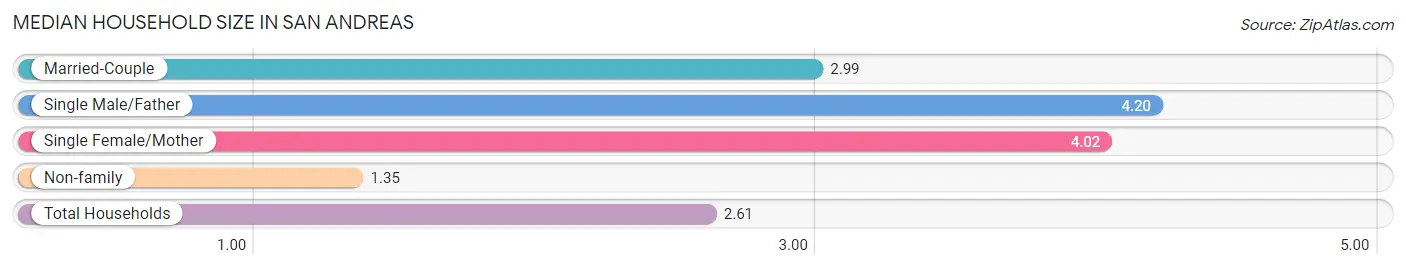
The median household size in San Andreas is 2.61 persons per household, with single male/father households (45 | 4.3%) accounting for the largest median household size of 4.2 persons per household. non-family households (353 | 33.5%) represent the smallest median household size with 1.35 persons per household.
| Household Type | # Households | Household Size |
| Married-Couple | 528 (50.1%) | 2.99 |
| Single Male/Father | 45 (4.3%) | 4.20 |
| Single Female/Mother | 127 (12.1%) | 4.02 |
| Non-family | 353 (33.5%) | 1.35 |
| Total Households | 1,053 (100.0%) | 2.61 |
Household Size by Marriage Status in San Andreas
Out of a total of 1,053 households in San Andreas, 700 (66.5%) are family households, while 353 (33.5%) are nonfamily households. The most numerous type of family households are 2-person households, comprising 306, and the most common type of nonfamily households are 1-person households, comprising 290.
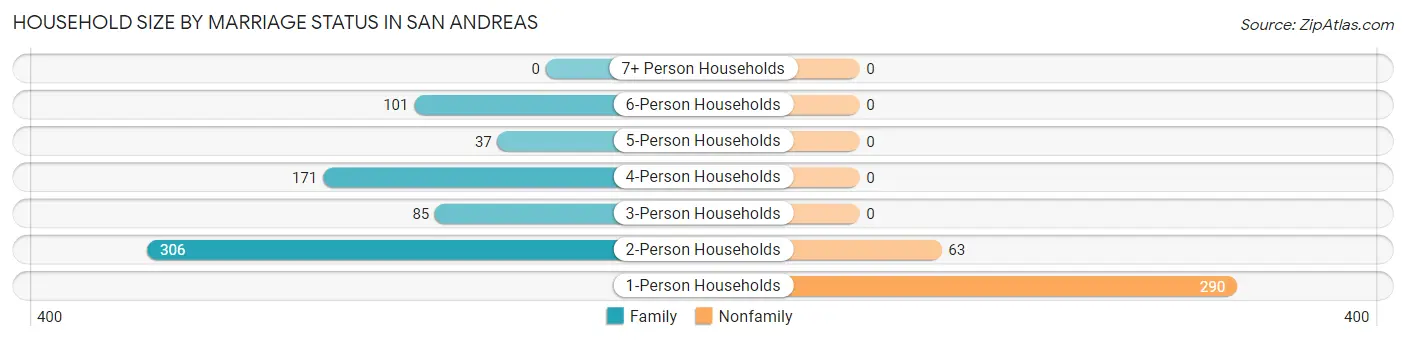
| Household Size | Family Households | Nonfamily Households |
| 1-Person Households | - | 290 (27.5%) |
| 2-Person Households | 306 (29.1%) | 63 (6.0%) |
| 3-Person Households | 85 (8.1%) | 0 (0.0%) |
| 4-Person Households | 171 (16.2%) | 0 (0.0%) |
| 5-Person Households | 37 (3.5%) | 0 (0.0%) |
| 6-Person Households | 101 (9.6%) | 0 (0.0%) |
| 7+ Person Households | 0 (0.0%) | 0 (0.0%) |
| Total | 700 (66.5%) | 353 (33.5%) |
Female Fertility in San Andreas
Fertility by Age in San Andreas
| Age Bracket | Women with Births | Births / 1,000 Women |
| 15 to 19 years | 0 (0.0%) | 0.0 |
| 20 to 34 years | 0 (0.0%) | 0.0 |
| 35 to 50 years | 0 (0.0%) | 0.0 |
| Total | 0 (0.0%) | 0.0 |
Fertility by Age by Marriage Status in San Andreas
| Age Bracket | Married | Unmarried |
| 15 to 19 years | 0 (0.0%) | 0 (0.0%) |
| 20 to 34 years | 0 (0.0%) | 0 (0.0%) |
| 35 to 50 years | 0 (0.0%) | 0 (0.0%) |
| Total | 0 (0.0%) | 0 (0.0%) |
Fertility by Education in San Andreas
| Educational Attainment | Women with Births | Births / 1,000 Women |
| Less than High School | 0 (0.0%) | 0.0 |
| High School Diploma | 0 (0.0%) | 0.0 |
| College or Associate's Degree | 0 (0.0%) | 0.0 |
| Bachelor's Degree | 0 (0.0%) | 0.0 |
| Graduate Degree | 0 (0.0%) | 0.0 |
| Total | 0 (0.0%) | 0.0 |
Fertility by Education by Marriage Status in San Andreas
| Educational Attainment | Married | Unmarried |
| Less than High School | 0 (0.0%) | 0 (0.0%) |
| High School Diploma | 0 (0.0%) | 0 (0.0%) |
| College or Associate's Degree | 0 (0.0%) | 0 (0.0%) |
| Bachelor's Degree | 0 (0.0%) | 0 (0.0%) |
| Graduate Degree | 0 (0.0%) | 0 (0.0%) |
| Total | 0 (0.0%) | 0 (0.0%) |
Employment Characteristics in San Andreas
Employment by Class of Employer in San Andreas
Among the 822 employed individuals in San Andreas, private company employees (349 | 42.5%), local government employees (308 | 37.5%), and self-employed (not incorporated) (90 | 11.0%) make up the most common classes of employment.
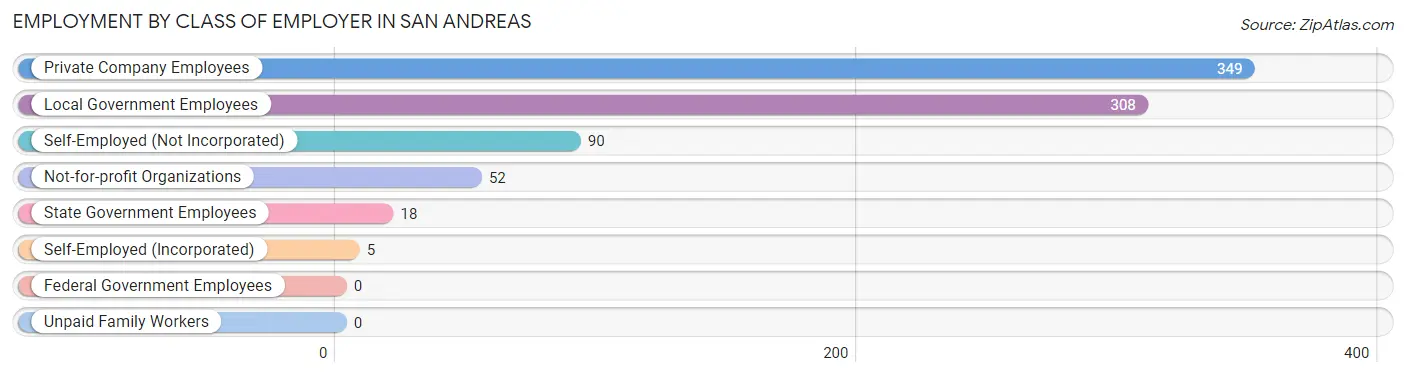
| Employer Class | # Employees | % Employees |
| Private Company Employees | 349 | 42.5% |
| Self-Employed (Incorporated) | 5 | 0.6% |
| Self-Employed (Not Incorporated) | 90 | 11.0% |
| Not-for-profit Organizations | 52 | 6.3% |
| Local Government Employees | 308 | 37.5% |
| State Government Employees | 18 | 2.2% |
| Federal Government Employees | 0 | 0.0% |
| Unpaid Family Workers | 0 | 0.0% |
| Total | 822 | 100.0% |
Employment Status by Age in San Andreas
According to the labor force statistics for San Andreas, out of the total population over 16 years of age (2,497), 34.4% or 859 individuals are in the labor force, with 2.0% or 17 of them unemployed. The age group with the highest labor force participation rate is 30 to 34 years, with 84.2% or 170 individuals in the labor force. Within the labor force, the 35 to 44 years age range has the highest percentage of unemployed individuals, with 8.9% or 17 of them being unemployed.
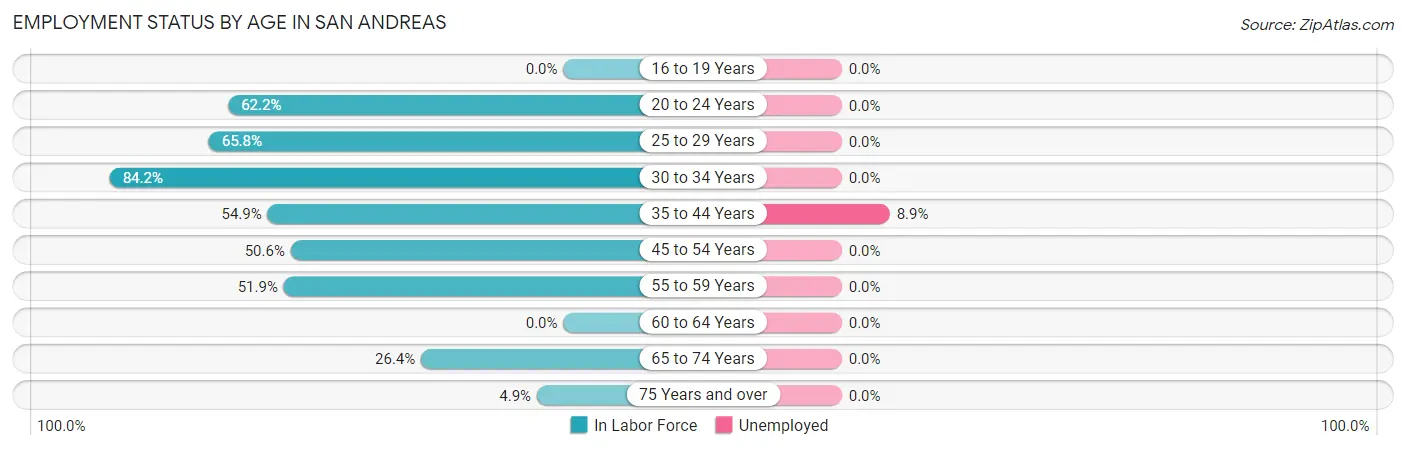
| Age Bracket | In Labor Force | Unemployed |
| 16 to 19 Years | 0 (0.0%) | 0 (0.0%) |
| 20 to 24 Years | 46 (62.2%) | 0 (0.0%) |
| 25 to 29 Years | 181 (65.8%) | 0 (0.0%) |
| 30 to 34 Years | 170 (84.2%) | 0 (0.0%) |
| 35 to 44 Years | 191 (54.9%) | 17 (8.9%) |
| 45 to 54 Years | 82 (50.6%) | 0 (0.0%) |
| 55 to 59 Years | 56 (51.9%) | 0 (0.0%) |
| 60 to 64 Years | 0 (0.0%) | 0 (0.0%) |
| 65 to 74 Years | 116 (26.4%) | 0 (0.0%) |
| 75 Years and over | 18 (4.9%) | 0 (0.0%) |
| Total | 859 (34.4%) | 17 (2.0%) |
Employment Status by Educational Attainment in San Andreas
According to labor force statistics for San Andreas, 49.8% of individuals (680) out of the total population between 25 and 64 years of age (1,366) are in the labor force, with 2.5% or 17 of them being unemployed. The group with the highest labor force participation rate are those with the educational attainment of college / associate degree, with 65.4% or 428 individuals in the labor force. Within the labor force, individuals with college / associate degree education have the highest percentage of unemployment, with 4.0% or 17 of them being unemployed.
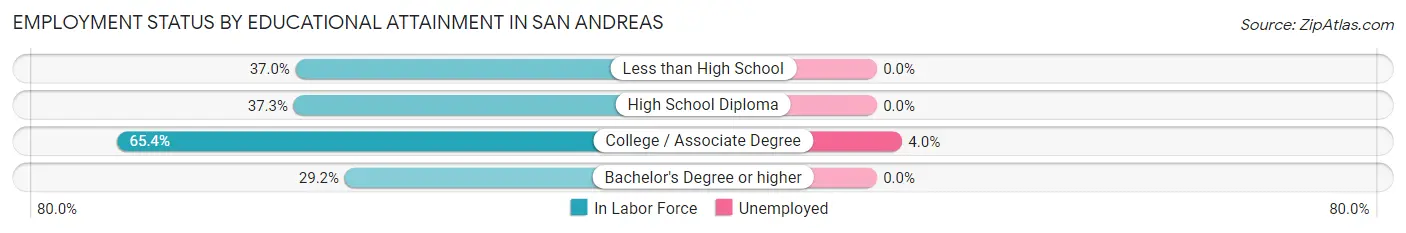
| Educational Attainment | In Labor Force | Unemployed |
| Less than High School | 50 (37.0%) | 0 (0.0%) |
| High School Diploma | 155 (37.3%) | 0 (0.0%) |
| College / Associate Degree | 428 (65.4%) | 26 (4.0%) |
| Bachelor's Degree or higher | 47 (29.2%) | 0 (0.0%) |
| Total | 680 (49.8%) | 34 (2.5%) |
Employment Occupations by Sex in San Andreas
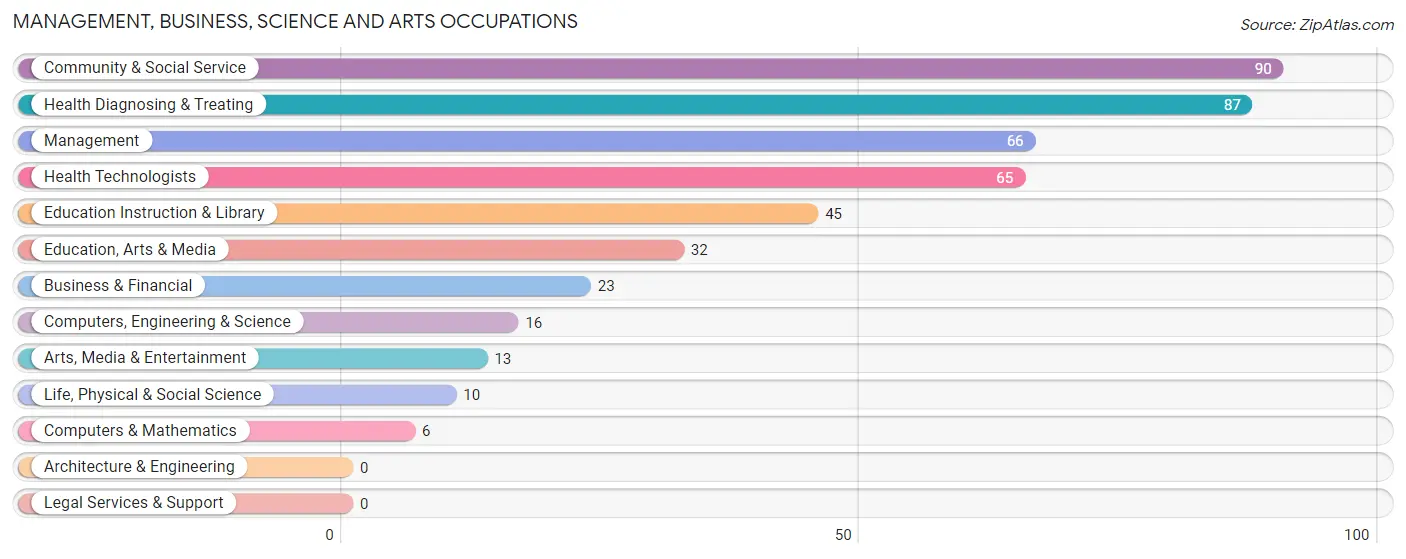
Management, Business, Science and Arts Occupations
The most common Management, Business, Science and Arts occupations in San Andreas are Community & Social Service (90 | 10.7%), Health Diagnosing & Treating (87 | 10.3%), Management (66 | 7.8%), Health Technologists (65 | 7.7%), and Education Instruction & Library (45 | 5.3%).
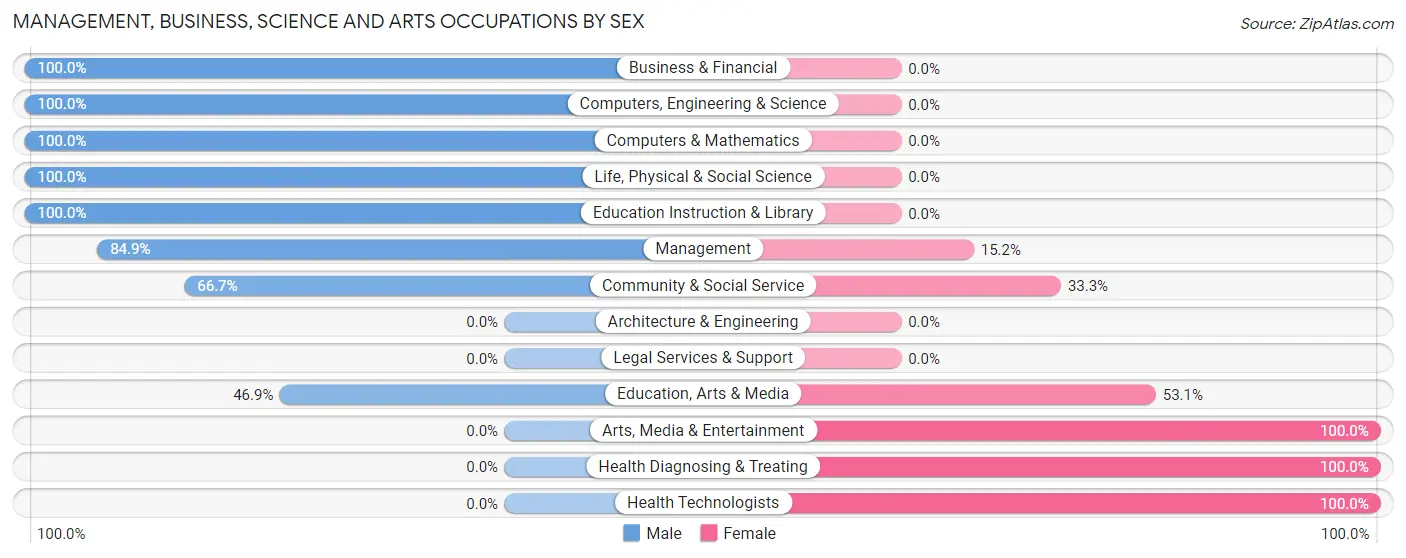
Management, Business, Science and Arts Occupations by Sex
Within the Management, Business, Science and Arts occupations in San Andreas, the most male-oriented occupations are Business & Financial (100.0%), Computers, Engineering & Science (100.0%), and Computers & Mathematics (100.0%), while the most female-oriented occupations are Arts, Media & Entertainment (100.0%), Health Diagnosing & Treating (100.0%), and Health Technologists (100.0%).
| Occupation | Male | Female |
| Management | 56 (84.9%) | 10 (15.1%) |
| Business & Financial | 23 (100.0%) | 0 (0.0%) |
| Computers, Engineering & Science | 16 (100.0%) | 0 (0.0%) |
| Computers & Mathematics | 6 (100.0%) | 0 (0.0%) |
| Architecture & Engineering | 0 (0.0%) | 0 (0.0%) |
| Life, Physical & Social Science | 10 (100.0%) | 0 (0.0%) |
| Community & Social Service | 60 (66.7%) | 30 (33.3%) |
| Education, Arts & Media | 15 (46.9%) | 17 (53.1%) |
| Legal Services & Support | 0 (0.0%) | 0 (0.0%) |
| Education Instruction & Library | 45 (100.0%) | 0 (0.0%) |
| Arts, Media & Entertainment | 0 (0.0%) | 13 (100.0%) |
| Health Diagnosing & Treating | 0 (0.0%) | 87 (100.0%) |
| Health Technologists | 0 (0.0%) | 65 (100.0%) |
| Total (Category) | 155 (55.0%) | 127 (45.0%) |
| Total (Overall) | 428 (50.8%) | 415 (49.2%) |
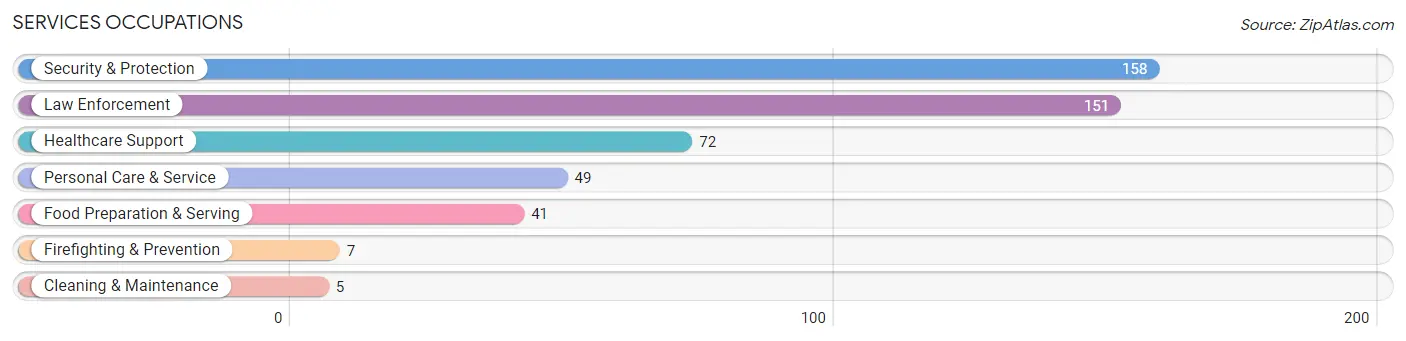
Services Occupations
The most common Services occupations in San Andreas are Security & Protection (158 | 18.7%), Law Enforcement (151 | 17.9%), Healthcare Support (72 | 8.5%), Personal Care & Service (49 | 5.8%), and Food Preparation & Serving (41 | 4.9%).
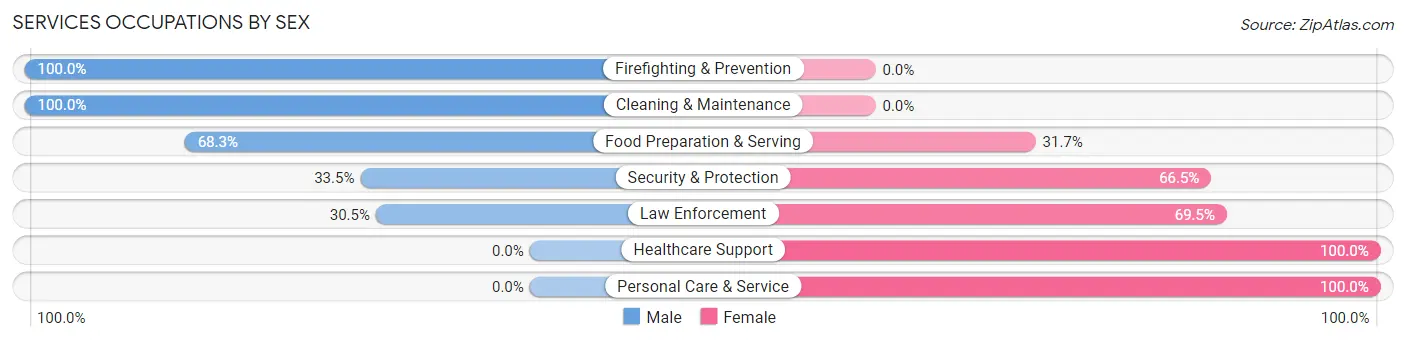
Services Occupations by Sex
Within the Services occupations in San Andreas, the most male-oriented occupations are Firefighting & Prevention (100.0%), Cleaning & Maintenance (100.0%), and Food Preparation & Serving (68.3%), while the most female-oriented occupations are Healthcare Support (100.0%), Personal Care & Service (100.0%), and Law Enforcement (69.5%).
| Occupation | Male | Female |
| Healthcare Support | 0 (0.0%) | 72 (100.0%) |
| Security & Protection | 53 (33.5%) | 105 (66.5%) |
| Firefighting & Prevention | 7 (100.0%) | 0 (0.0%) |
| Law Enforcement | 46 (30.5%) | 105 (69.5%) |
| Food Preparation & Serving | 28 (68.3%) | 13 (31.7%) |
| Cleaning & Maintenance | 5 (100.0%) | 0 (0.0%) |
| Personal Care & Service | 0 (0.0%) | 49 (100.0%) |
| Total (Category) | 86 (26.5%) | 239 (73.5%) |
| Total (Overall) | 428 (50.8%) | 415 (49.2%) |
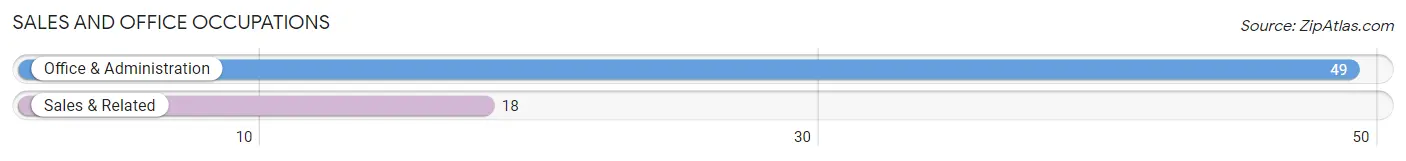
Sales and Office Occupations
The most common Sales and Office occupations in San Andreas are Office & Administration (49 | 5.8%), and Sales & Related (18 | 2.1%).
Sales and Office Occupations by Sex
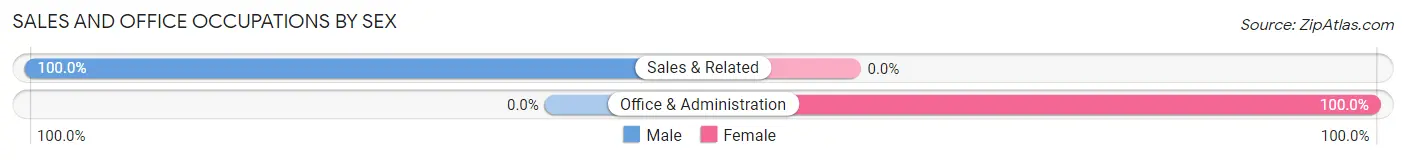
| Occupation | Male | Female |
| Sales & Related | 18 (100.0%) | 0 (0.0%) |
| Office & Administration | 0 (0.0%) | 49 (100.0%) |
| Total (Category) | 18 (26.9%) | 49 (73.1%) |
| Total (Overall) | 428 (50.8%) | 415 (49.2%) |
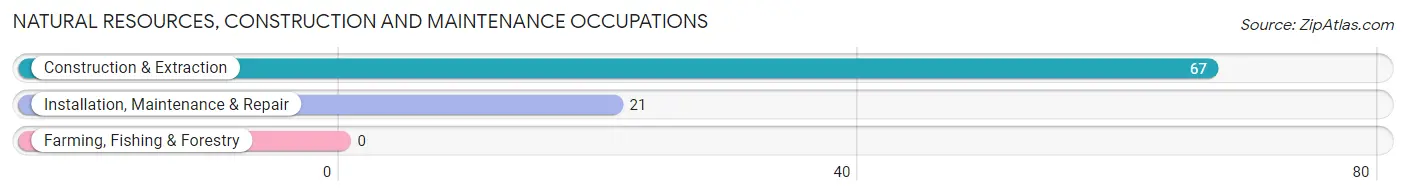
Natural Resources, Construction and Maintenance Occupations
The most common Natural Resources, Construction and Maintenance occupations in San Andreas are Construction & Extraction (67 | 8.0%), and Installation, Maintenance & Repair (21 | 2.5%).
Natural Resources, Construction and Maintenance Occupations by Sex
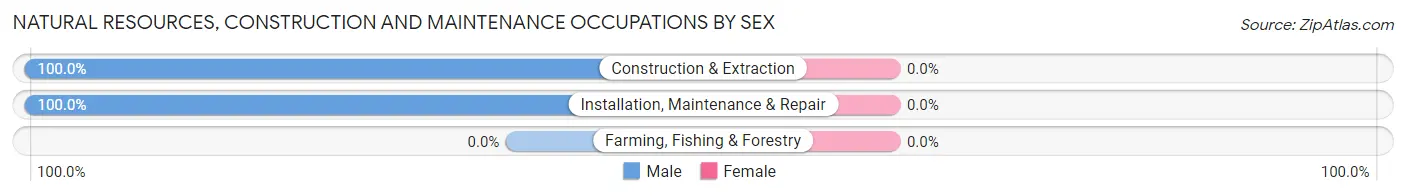
| Occupation | Male | Female |
| Farming, Fishing & Forestry | 0 (0.0%) | 0 (0.0%) |
| Construction & Extraction | 67 (100.0%) | 0 (0.0%) |
| Installation, Maintenance & Repair | 21 (100.0%) | 0 (0.0%) |
| Total (Category) | 88 (100.0%) | 0 (0.0%) |
| Total (Overall) | 428 (50.8%) | 415 (49.2%) |
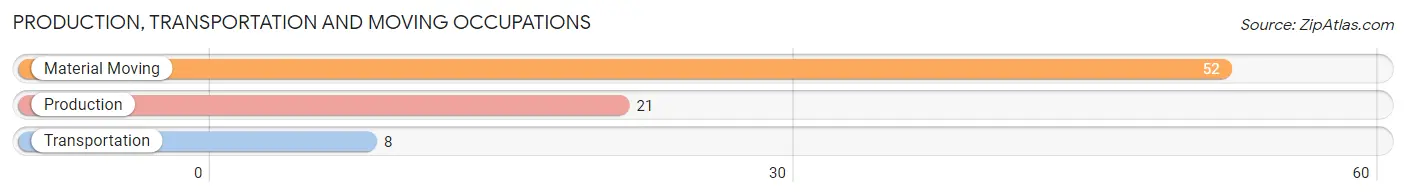
Production, Transportation and Moving Occupations
The most common Production, Transportation and Moving occupations in San Andreas are Material Moving (52 | 6.2%), Production (21 | 2.5%), and Transportation (8 | 0.9%).
Production, Transportation and Moving Occupations by Sex
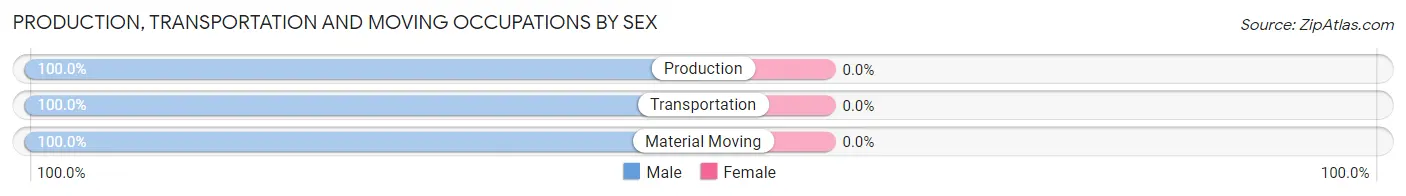
| Occupation | Male | Female |
| Production | 21 (100.0%) | 0 (0.0%) |
| Transportation | 8 (100.0%) | 0 (0.0%) |
| Material Moving | 52 (100.0%) | 0 (0.0%) |
| Total (Category) | 81 (100.0%) | 0 (0.0%) |
| Total (Overall) | 428 (50.8%) | 415 (49.2%) |
Employment Industries by Sex in San Andreas
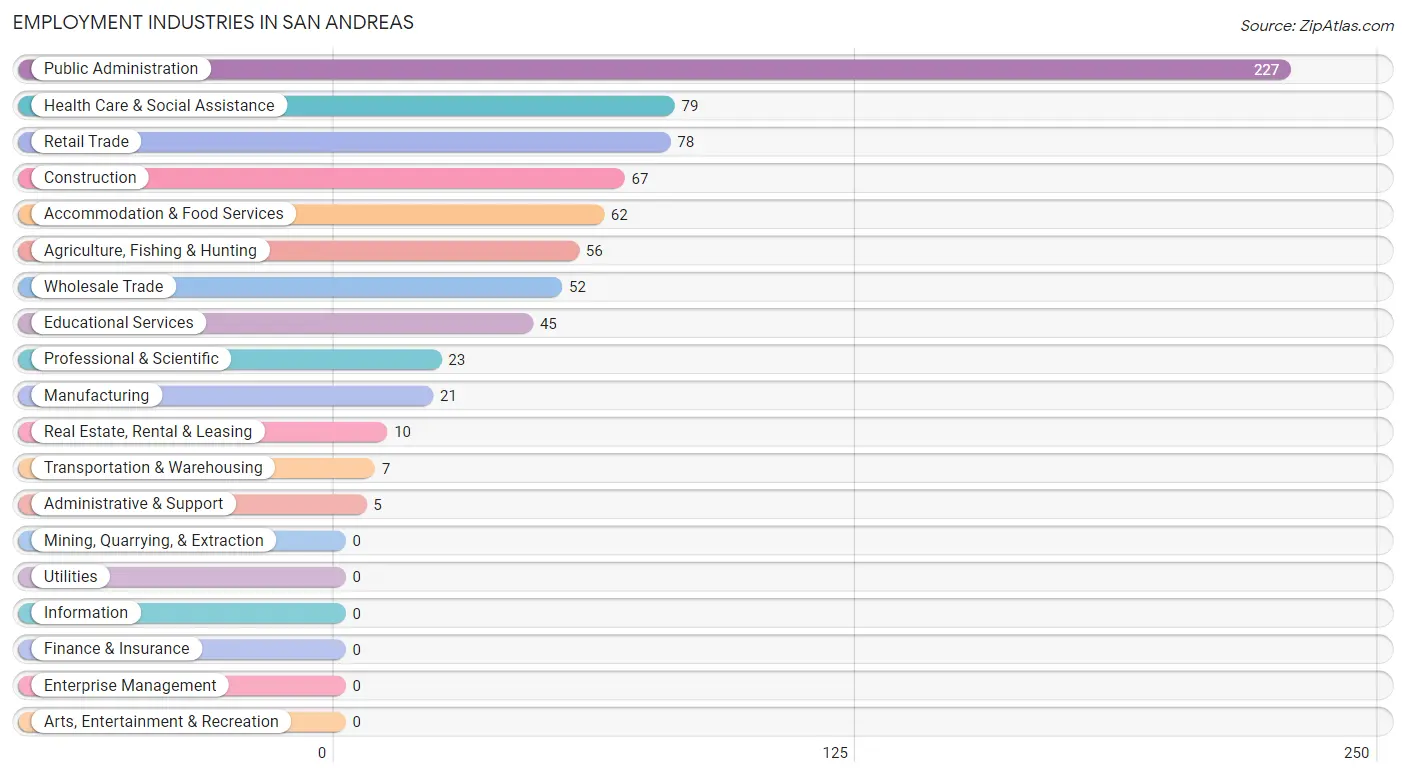
Employment Industries in San Andreas
The major employment industries in San Andreas include Public Administration (227 | 26.9%), Health Care & Social Assistance (79 | 9.4%), Retail Trade (78 | 9.2%), Construction (67 | 8.0%), and Accommodation & Food Services (62 | 7.3%).
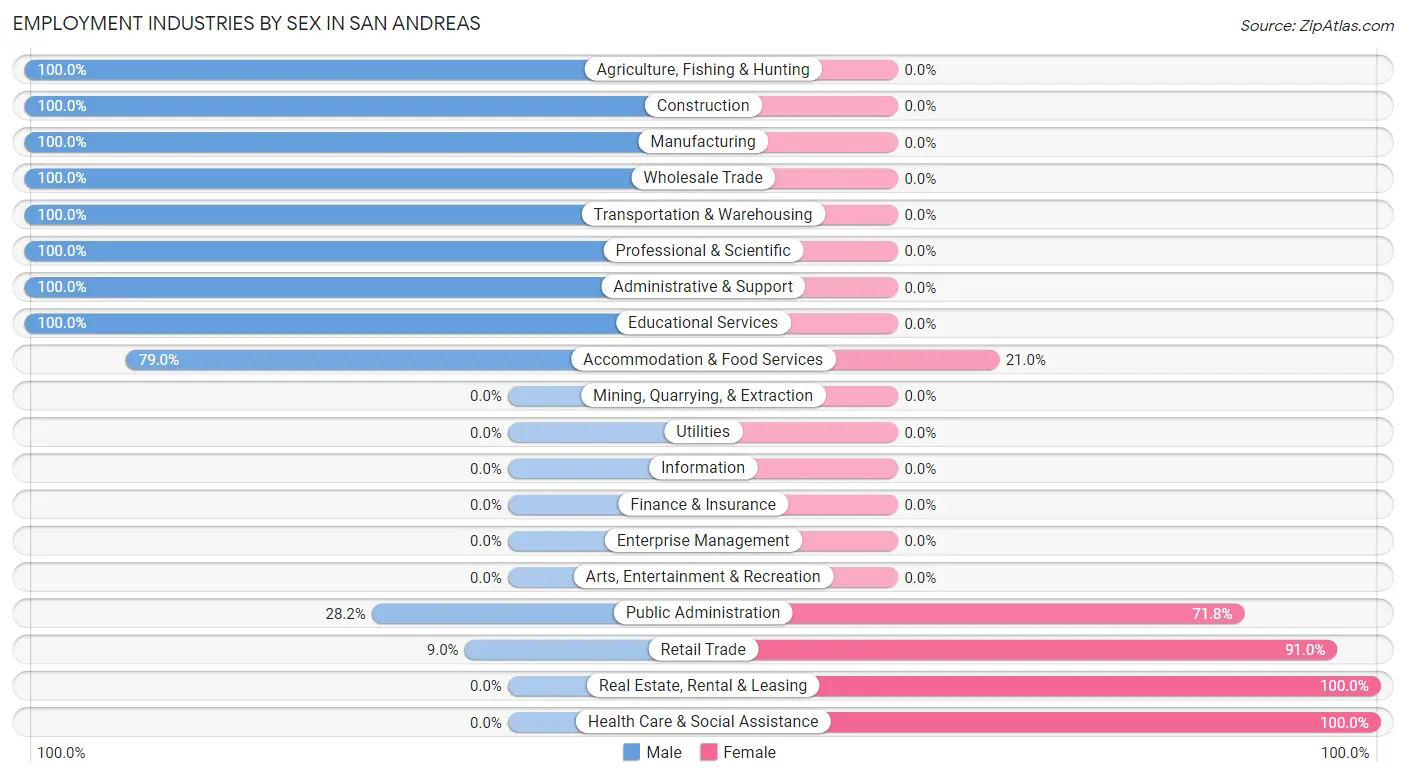
Employment Industries by Sex in San Andreas
The San Andreas industries that see more men than women are Agriculture, Fishing & Hunting (100.0%), Construction (100.0%), and Manufacturing (100.0%), whereas the industries that tend to have a higher number of women are Real Estate, Rental & Leasing (100.0%), Health Care & Social Assistance (100.0%), and Retail Trade (91.0%).
| Industry | Male | Female |
| Agriculture, Fishing & Hunting | 56 (100.0%) | 0 (0.0%) |
| Mining, Quarrying, & Extraction | 0 (0.0%) | 0 (0.0%) |
| Construction | 67 (100.0%) | 0 (0.0%) |
| Manufacturing | 21 (100.0%) | 0 (0.0%) |
| Wholesale Trade | 52 (100.0%) | 0 (0.0%) |
| Retail Trade | 7 (9.0%) | 71 (91.0%) |
| Transportation & Warehousing | 7 (100.0%) | 0 (0.0%) |
| Utilities | 0 (0.0%) | 0 (0.0%) |
| Information | 0 (0.0%) | 0 (0.0%) |
| Finance & Insurance | 0 (0.0%) | 0 (0.0%) |
| Real Estate, Rental & Leasing | 0 (0.0%) | 10 (100.0%) |
| Professional & Scientific | 23 (100.0%) | 0 (0.0%) |
| Enterprise Management | 0 (0.0%) | 0 (0.0%) |
| Administrative & Support | 5 (100.0%) | 0 (0.0%) |
| Educational Services | 45 (100.0%) | 0 (0.0%) |
| Health Care & Social Assistance | 0 (0.0%) | 79 (100.0%) |
| Arts, Entertainment & Recreation | 0 (0.0%) | 0 (0.0%) |
| Accommodation & Food Services | 49 (79.0%) | 13 (21.0%) |
| Public Administration | 64 (28.2%) | 163 (71.8%) |
| Total | 428 (50.8%) | 415 (49.2%) |
Education in San Andreas
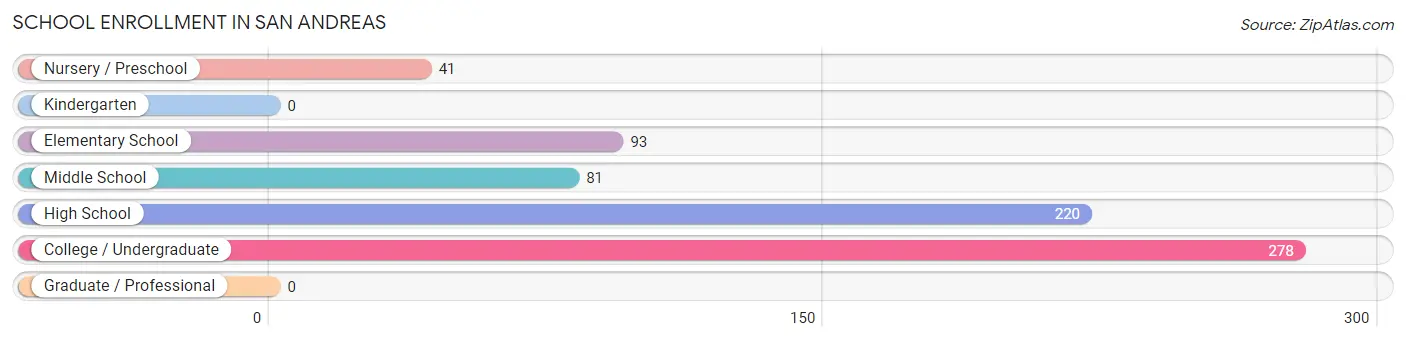
School Enrollment in San Andreas
The most common levels of schooling among the 713 students in San Andreas are college / undergraduate (278 | 39.0%), high school (220 | 30.9%), and elementary school (93 | 13.0%).
| School Level | # Students | % Students |
| Nursery / Preschool | 41 | 5.8% |
| Kindergarten | 0 | 0.0% |
| Elementary School | 93 | 13.0% |
| Middle School | 81 | 11.4% |
| High School | 220 | 30.9% |
| College / Undergraduate | 278 | 39.0% |
| Graduate / Professional | 0 | 0.0% |
| Total | 713 | 100.0% |
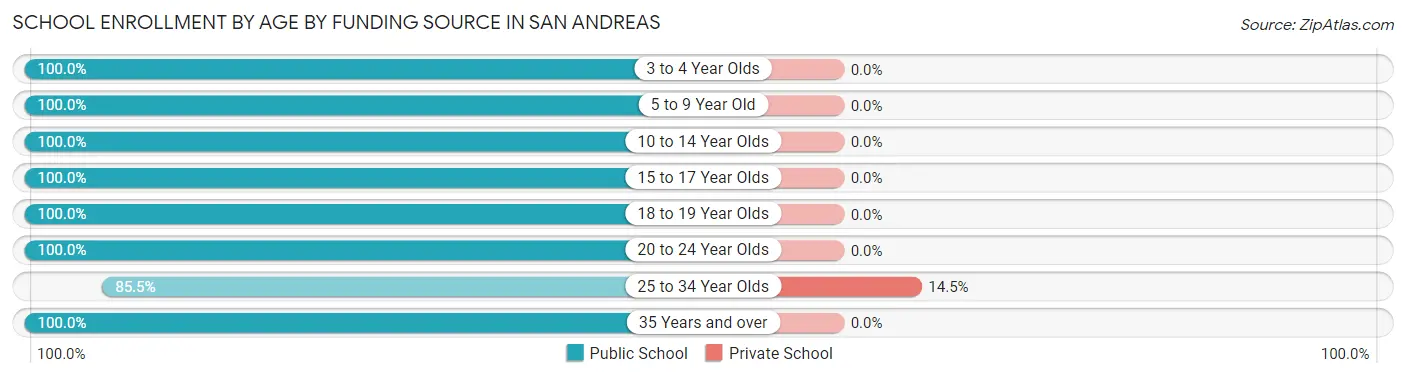
School Enrollment by Age by Funding Source in San Andreas
Out of a total of 713 students who are enrolled in schools in San Andreas, 21 (2.9%) attend a private institution, while the remaining 692 (97.1%) are enrolled in public schools. The age group of 25 to 34 year olds has the highest likelihood of being enrolled in private schools, with 21 (14.5% in the age bracket) enrolled. Conversely, the age group of 3 to 4 year olds has the lowest likelihood of being enrolled in a private school, with 41 (100.0% in the age bracket) attending a public institution.
| Age Bracket | Public School | Private School |
| 3 to 4 Year Olds | 41 (100.0%) | 0 (0.0%) |
| 5 to 9 Year Old | 93 (100.0%) | 0 (0.0%) |
| 10 to 14 Year Olds | 81 (100.0%) | 0 (0.0%) |
| 15 to 17 Year Olds | 209 (100.0%) | 0 (0.0%) |
| 18 to 19 Year Olds | 77 (100.0%) | 0 (0.0%) |
| 20 to 24 Year Olds | 26 (100.0%) | 0 (0.0%) |
| 25 to 34 Year Olds | 124 (85.5%) | 21 (14.5%) |
| 35 Years and over | 41 (100.0%) | 0 (0.0%) |
| Total | 692 (97.1%) | 21 (2.9%) |
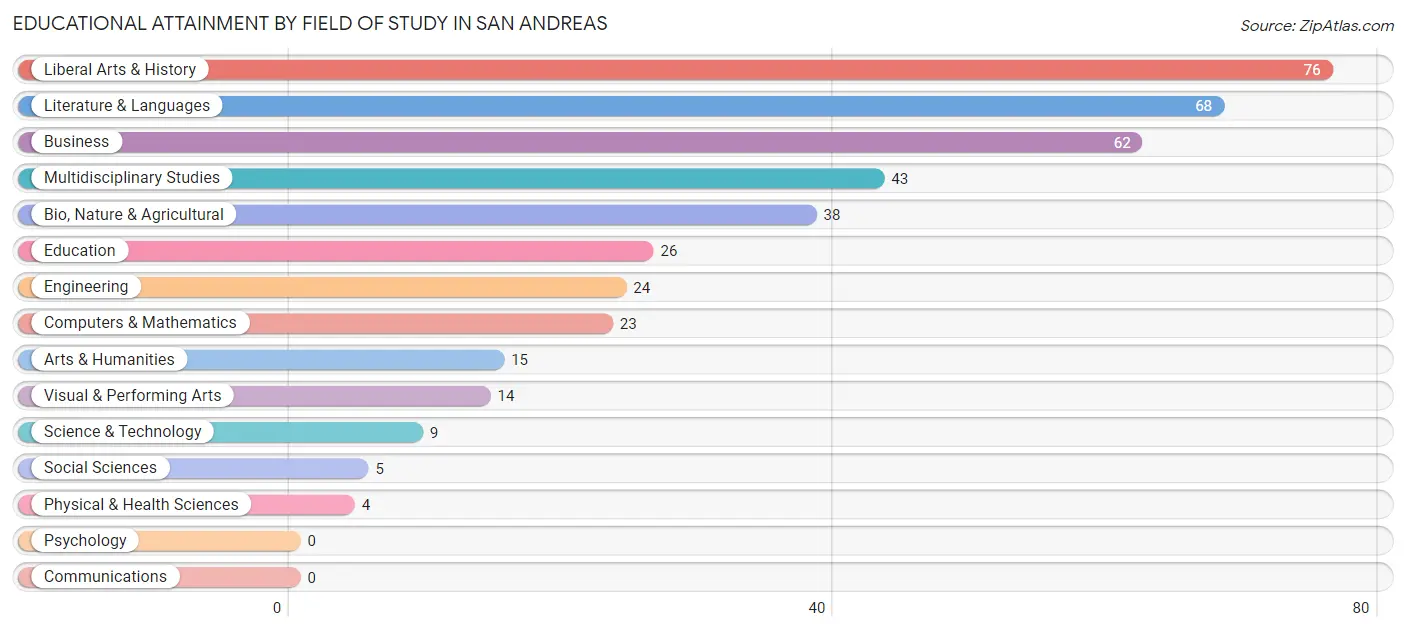
Educational Attainment by Field of Study in San Andreas
Liberal arts & history (76 | 18.7%), literature & languages (68 | 16.7%), business (62 | 15.2%), multidisciplinary studies (43 | 10.6%), and bio, nature & agricultural (38 | 9.3%) are the most common fields of study among 407 individuals in San Andreas who have obtained a bachelor's degree or higher.
| Field of Study | # Graduates | % Graduates |
| Computers & Mathematics | 23 | 5.7% |
| Bio, Nature & Agricultural | 38 | 9.3% |
| Physical & Health Sciences | 4 | 1.0% |
| Psychology | 0 | 0.0% |
| Social Sciences | 5 | 1.2% |
| Engineering | 24 | 5.9% |
| Multidisciplinary Studies | 43 | 10.6% |
| Science & Technology | 9 | 2.2% |
| Business | 62 | 15.2% |
| Education | 26 | 6.4% |
| Literature & Languages | 68 | 16.7% |
| Liberal Arts & History | 76 | 18.7% |
| Visual & Performing Arts | 14 | 3.4% |
| Communications | 0 | 0.0% |
| Arts & Humanities | 15 | 3.7% |
| Total | 407 | 100.0% |
Transportation & Commute in San Andreas
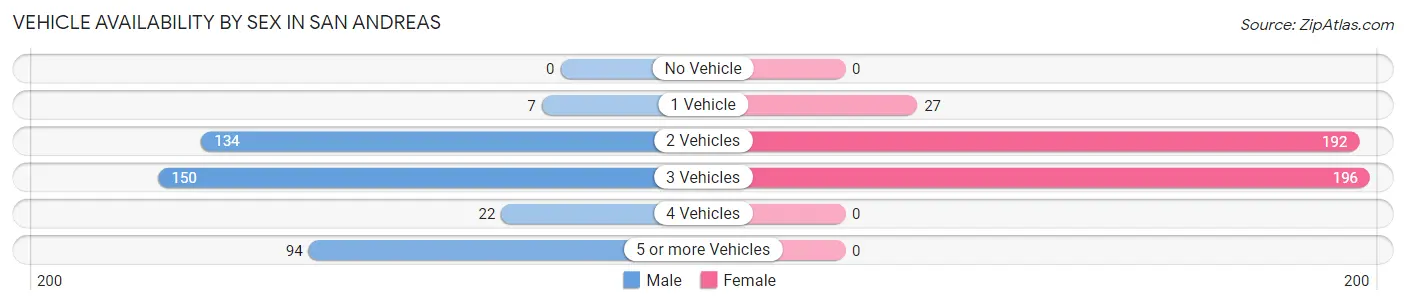
Vehicle Availability by Sex in San Andreas
The most prevalent vehicle ownership categories in San Andreas are males with 3 vehicles (150, accounting for 36.9%) and females with 3 vehicles (196, making up 36.1%).
| Vehicles Available | Male | Female |
| No Vehicle | 0 (0.0%) | 0 (0.0%) |
| 1 Vehicle | 7 (1.7%) | 27 (6.5%) |
| 2 Vehicles | 134 (32.9%) | 192 (46.3%) |
| 3 Vehicles | 150 (36.9%) | 196 (47.2%) |
| 4 Vehicles | 22 (5.4%) | 0 (0.0%) |
| 5 or more Vehicles | 94 (23.1%) | 0 (0.0%) |
| Total | 407 (100.0%) | 415 (100.0%) |
Commute Time in San Andreas
The most frequently occuring commute durations in San Andreas are 5 to 9 minutes (186 commuters, 28.5%), 90 or more minutes (80 commuters, 12.3%), and 15 to 19 minutes (77 commuters, 11.8%).
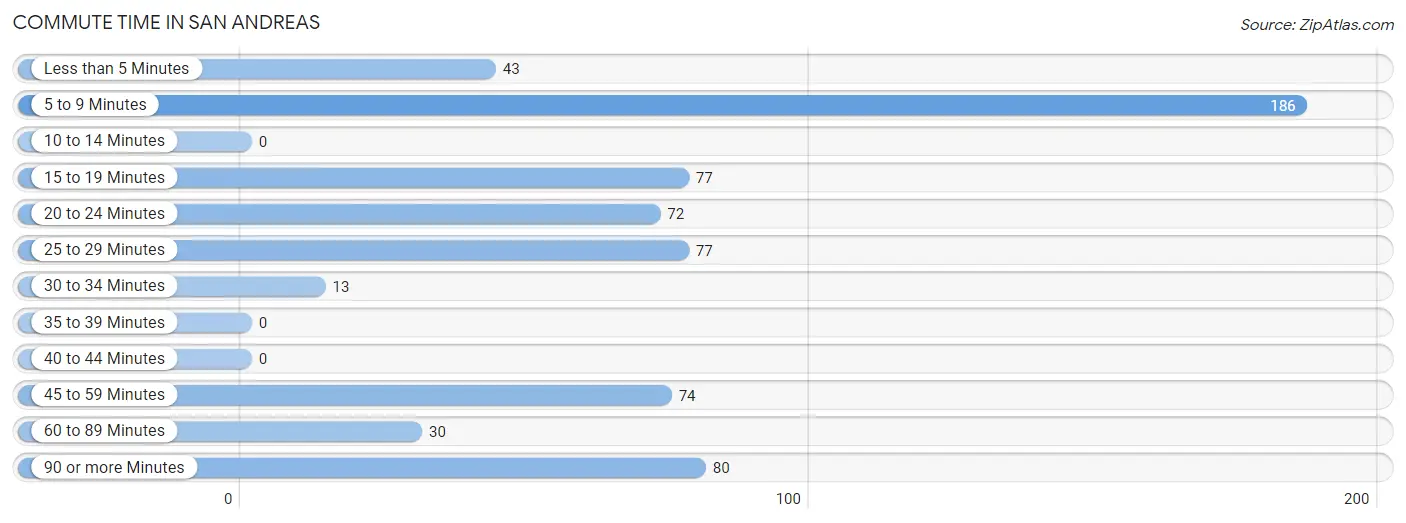
| Commute Time | # Commuters | % Commuters |
| Less than 5 Minutes | 43 | 6.6% |
| 5 to 9 Minutes | 186 | 28.5% |
| 10 to 14 Minutes | 0 | 0.0% |
| 15 to 19 Minutes | 77 | 11.8% |
| 20 to 24 Minutes | 72 | 11.0% |
| 25 to 29 Minutes | 77 | 11.8% |
| 30 to 34 Minutes | 13 | 2.0% |
| 35 to 39 Minutes | 0 | 0.0% |
| 40 to 44 Minutes | 0 | 0.0% |
| 45 to 59 Minutes | 74 | 11.4% |
| 60 to 89 Minutes | 30 | 4.6% |
| 90 or more Minutes | 80 | 12.3% |
Commute Time by Sex in San Andreas
The most common commute times in San Andreas are 90 or more minutes (80 commuters, 20.3%) for males and 5 to 9 minutes (140 commuters, 54.3%) for females.
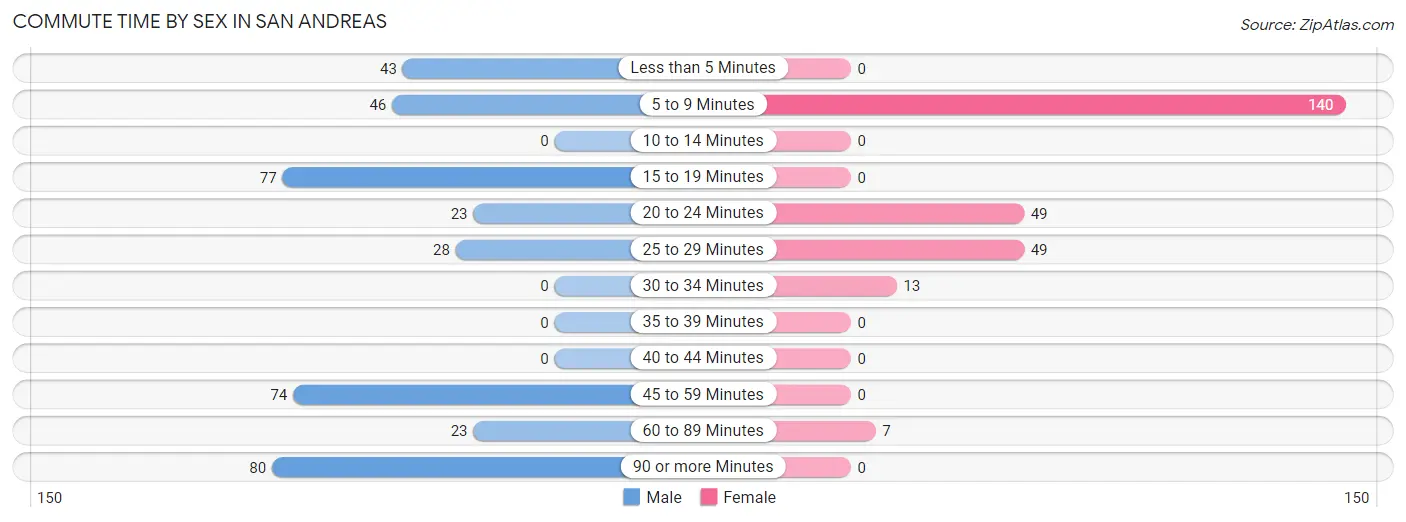
| Commute Time | Male | Female |
| Less than 5 Minutes | 43 (10.9%) | 0 (0.0%) |
| 5 to 9 Minutes | 46 (11.7%) | 140 (54.3%) |
| 10 to 14 Minutes | 0 (0.0%) | 0 (0.0%) |
| 15 to 19 Minutes | 77 (19.5%) | 0 (0.0%) |
| 20 to 24 Minutes | 23 (5.8%) | 49 (19.0%) |
| 25 to 29 Minutes | 28 (7.1%) | 49 (19.0%) |
| 30 to 34 Minutes | 0 (0.0%) | 13 (5.0%) |
| 35 to 39 Minutes | 0 (0.0%) | 0 (0.0%) |
| 40 to 44 Minutes | 0 (0.0%) | 0 (0.0%) |
| 45 to 59 Minutes | 74 (18.8%) | 0 (0.0%) |
| 60 to 89 Minutes | 23 (5.8%) | 7 (2.7%) |
| 90 or more Minutes | 80 (20.3%) | 0 (0.0%) |
Time of Departure to Work by Sex in San Andreas
The most frequent times of departure to work in San Andreas are 12:00 AM to 4:59 AM (175, 44.4%) for males and 9:00 AM to 9:59 AM (112, 43.4%) for females.
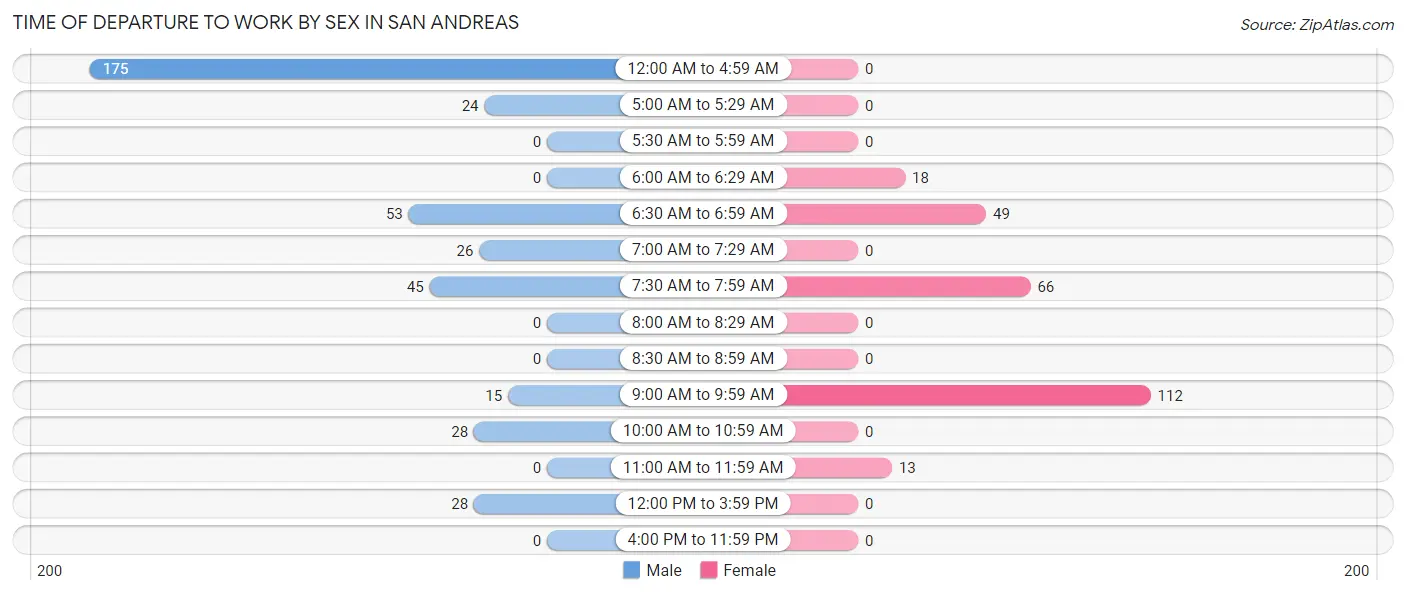
| Time of Departure | Male | Female |
| 12:00 AM to 4:59 AM | 175 (44.4%) | 0 (0.0%) |
| 5:00 AM to 5:29 AM | 24 (6.1%) | 0 (0.0%) |
| 5:30 AM to 5:59 AM | 0 (0.0%) | 0 (0.0%) |
| 6:00 AM to 6:29 AM | 0 (0.0%) | 18 (7.0%) |
| 6:30 AM to 6:59 AM | 53 (13.5%) | 49 (19.0%) |
| 7:00 AM to 7:29 AM | 26 (6.6%) | 0 (0.0%) |
| 7:30 AM to 7:59 AM | 45 (11.4%) | 66 (25.6%) |
| 8:00 AM to 8:29 AM | 0 (0.0%) | 0 (0.0%) |
| 8:30 AM to 8:59 AM | 0 (0.0%) | 0 (0.0%) |
| 9:00 AM to 9:59 AM | 15 (3.8%) | 112 (43.4%) |
| 10:00 AM to 10:59 AM | 28 (7.1%) | 0 (0.0%) |
| 11:00 AM to 11:59 AM | 0 (0.0%) | 13 (5.0%) |
| 12:00 PM to 3:59 PM | 28 (7.1%) | 0 (0.0%) |
| 4:00 PM to 11:59 PM | 0 (0.0%) | 0 (0.0%) |
| Total | 394 (100.0%) | 258 (100.0%) |
Housing Occupancy in San Andreas
Occupancy by Ownership in San Andreas
Of the total 1,053 dwellings in San Andreas, owner-occupied units account for 691 (65.6%), while renter-occupied units make up 362 (34.4%).
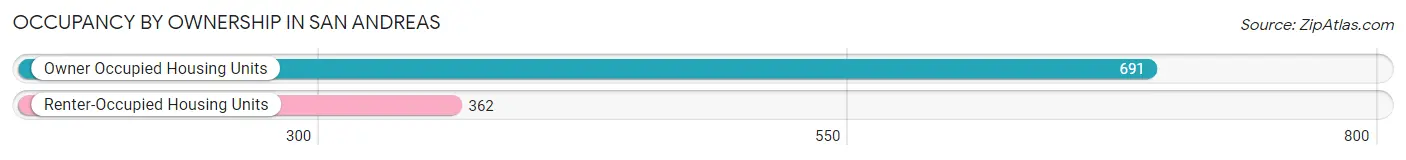
| Occupancy | # Housing Units | % Housing Units |
| Owner Occupied Housing Units | 691 | 65.6% |
| Renter-Occupied Housing Units | 362 | 34.4% |
| Total Occupied Housing Units | 1,053 | 100.0% |
Occupancy by Household Size in San Andreas
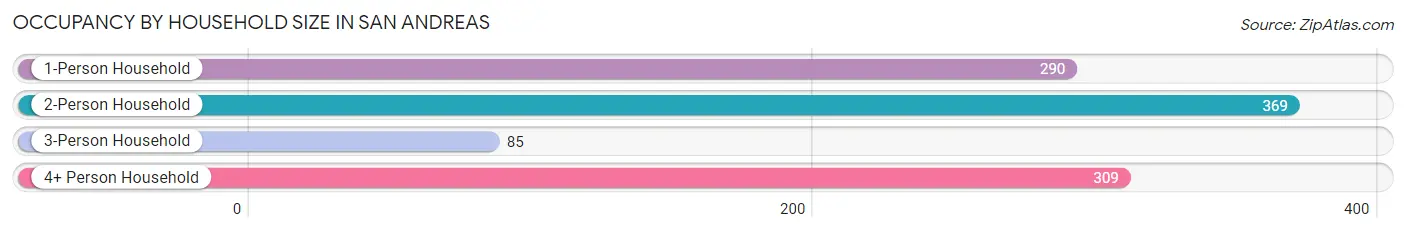
| Household Size | # Housing Units | % Housing Units |
| 1-Person Household | 290 | 27.5% |
| 2-Person Household | 369 | 35.0% |
| 3-Person Household | 85 | 8.1% |
| 4+ Person Household | 309 | 29.3% |
| Total Housing Units | 1,053 | 100.0% |
Occupancy by Ownership by Household Size in San Andreas
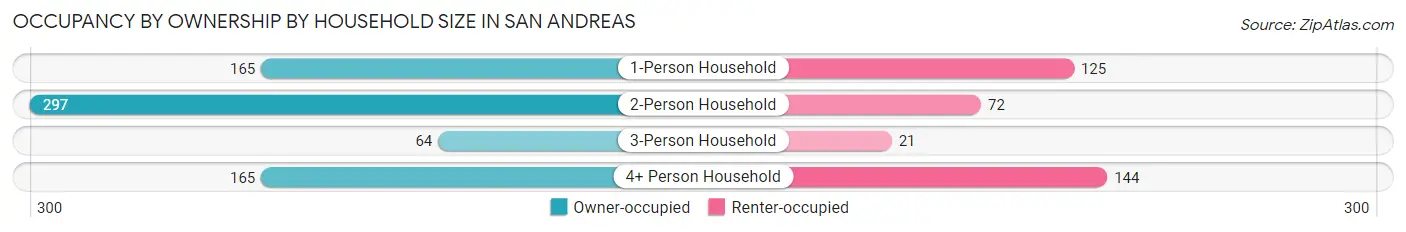
| Household Size | Owner-occupied | Renter-occupied |
| 1-Person Household | 165 (56.9%) | 125 (43.1%) |
| 2-Person Household | 297 (80.5%) | 72 (19.5%) |
| 3-Person Household | 64 (75.3%) | 21 (24.7%) |
| 4+ Person Household | 165 (53.4%) | 144 (46.6%) |
| Total Housing Units | 691 (65.6%) | 362 (34.4%) |
Occupancy by Educational Attainment in San Andreas
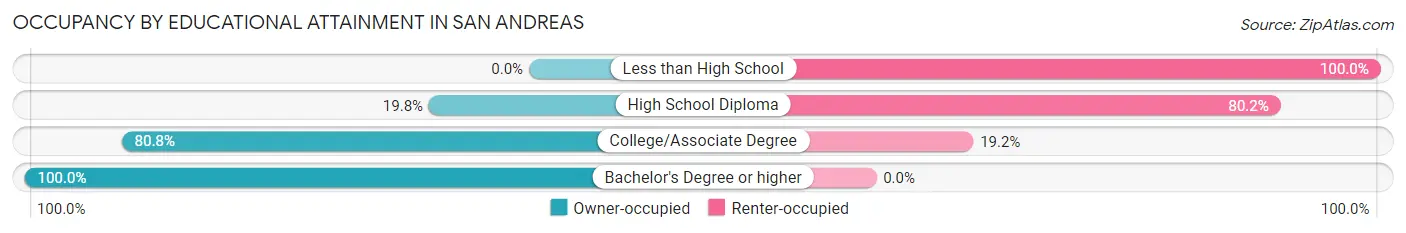
| Household Size | Owner-occupied | Renter-occupied |
| Less than High School | 0 (0.0%) | 58 (100.0%) |
| High School Diploma | 49 (19.8%) | 198 (80.2%) |
| College/Associate Degree | 445 (80.8%) | 106 (19.2%) |
| Bachelor's Degree or higher | 197 (100.0%) | 0 (0.0%) |
Occupancy by Age of Householder in San Andreas
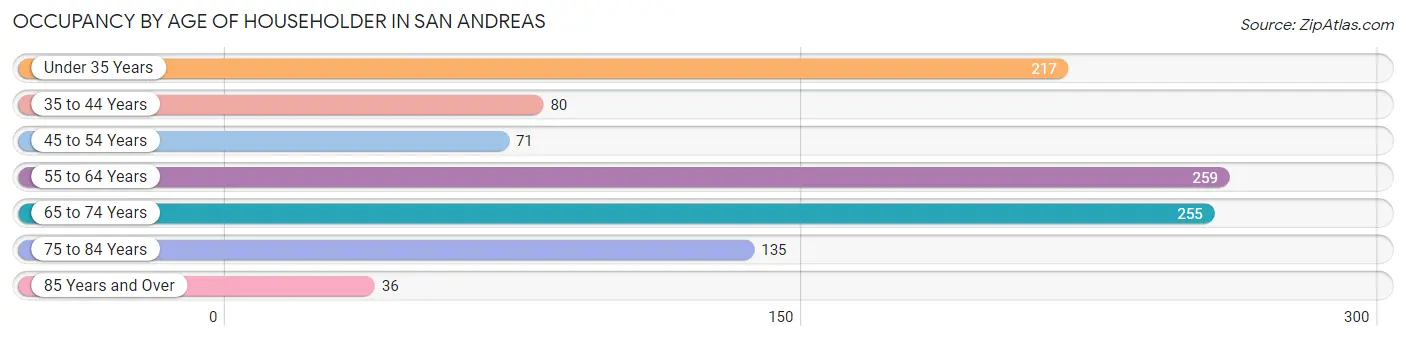
| Age Bracket | # Households | % Households |
| Under 35 Years | 217 | 20.6% |
| 35 to 44 Years | 80 | 7.6% |
| 45 to 54 Years | 71 | 6.7% |
| 55 to 64 Years | 259 | 24.6% |
| 65 to 74 Years | 255 | 24.2% |
| 75 to 84 Years | 135 | 12.8% |
| 85 Years and Over | 36 | 3.4% |
| Total | 1,053 | 100.0% |
Housing Finances in San Andreas
Median Income by Occupancy in San Andreas
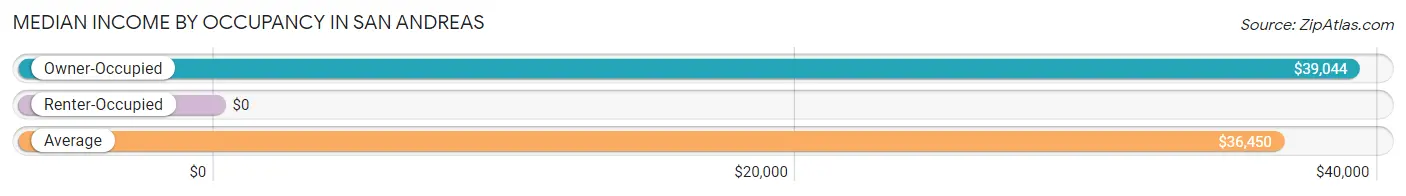
| Occupancy Type | # Households | Median Income |
| Owner-Occupied | 691 (65.6%) | $39,044 |
| Renter-Occupied | 362 (34.4%) | $0 |
| Average | 1,053 (100.0%) | $36,450 |
Occupancy by Householder Income Bracket in San Andreas
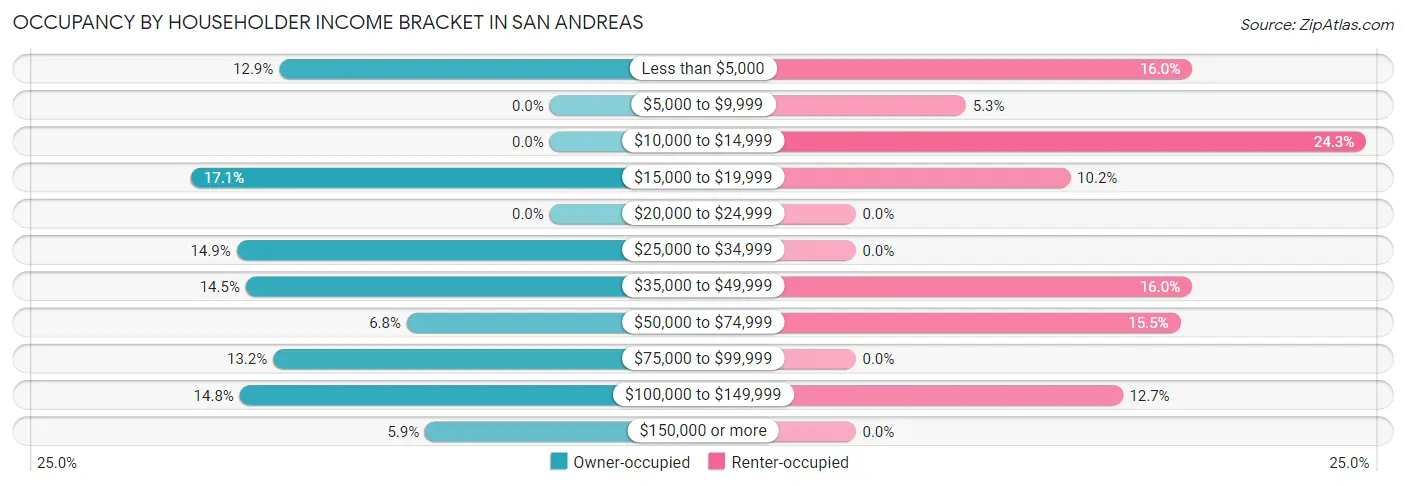
| Income Bracket | Owner-occupied | Renter-occupied |
| Less than $5,000 | 89 (12.9%) | 58 (16.0%) |
| $5,000 to $9,999 | 0 (0.0%) | 19 (5.2%) |
| $10,000 to $14,999 | 0 (0.0%) | 88 (24.3%) |
| $15,000 to $19,999 | 118 (17.1%) | 37 (10.2%) |
| $20,000 to $24,999 | 0 (0.0%) | 0 (0.0%) |
| $25,000 to $34,999 | 103 (14.9%) | 0 (0.0%) |
| $35,000 to $49,999 | 100 (14.5%) | 58 (16.0%) |
| $50,000 to $74,999 | 47 (6.8%) | 56 (15.5%) |
| $75,000 to $99,999 | 91 (13.2%) | 0 (0.0%) |
| $100,000 to $149,999 | 102 (14.8%) | 46 (12.7%) |
| $150,000 or more | 41 (5.9%) | 0 (0.0%) |
| Total | 691 (100.0%) | 362 (100.0%) |
Monthly Housing Cost Tiers in San Andreas
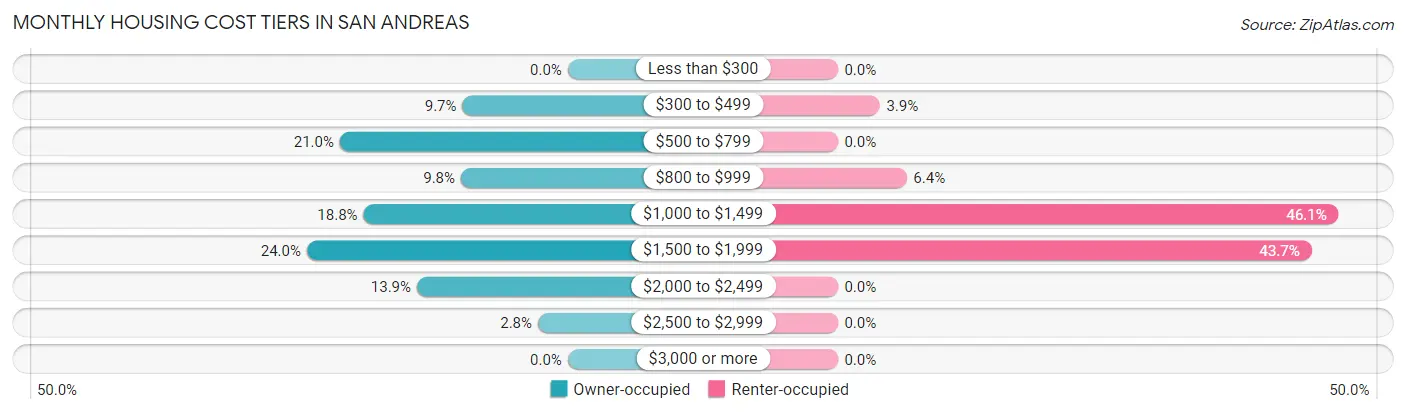
| Monthly Cost | Owner-occupied | Renter-occupied |
| Less than $300 | 0 (0.0%) | 0 (0.0%) |
| $300 to $499 | 67 (9.7%) | 14 (3.9%) |
| $500 to $799 | 145 (21.0%) | 0 (0.0%) |
| $800 to $999 | 68 (9.8%) | 23 (6.4%) |
| $1,000 to $1,499 | 130 (18.8%) | 167 (46.1%) |
| $1,500 to $1,999 | 166 (24.0%) | 158 (43.6%) |
| $2,000 to $2,499 | 96 (13.9%) | 0 (0.0%) |
| $2,500 to $2,999 | 19 (2.8%) | 0 (0.0%) |
| $3,000 or more | 0 (0.0%) | 0 (0.0%) |
| Total | 691 (100.0%) | 362 (100.0%) |
Physical Housing Characteristics in San Andreas
Housing Structures in San Andreas
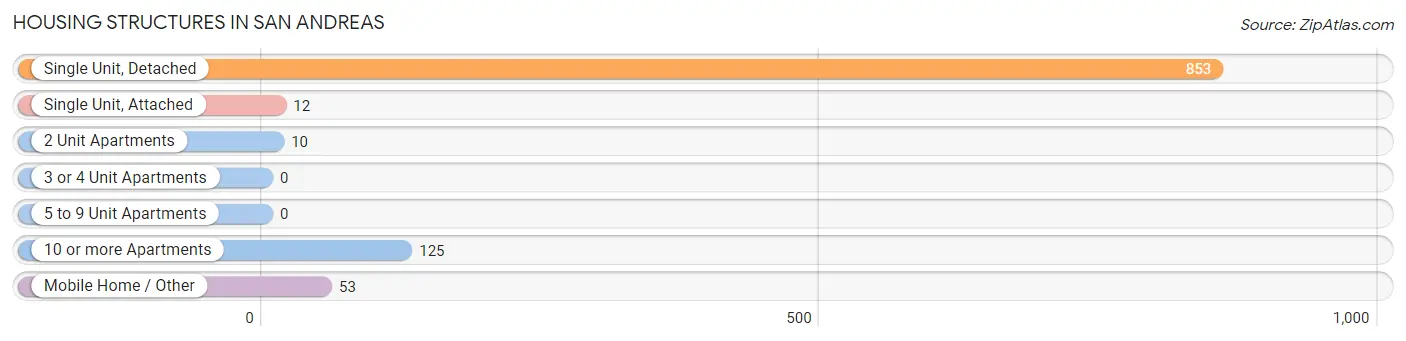
| Structure Type | # Housing Units | % Housing Units |
| Single Unit, Detached | 853 | 81.0% |
| Single Unit, Attached | 12 | 1.1% |
| 2 Unit Apartments | 10 | 0.9% |
| 3 or 4 Unit Apartments | 0 | 0.0% |
| 5 to 9 Unit Apartments | 0 | 0.0% |
| 10 or more Apartments | 125 | 11.9% |
| Mobile Home / Other | 53 | 5.0% |
| Total | 1,053 | 100.0% |
Housing Structures by Occupancy in San Andreas
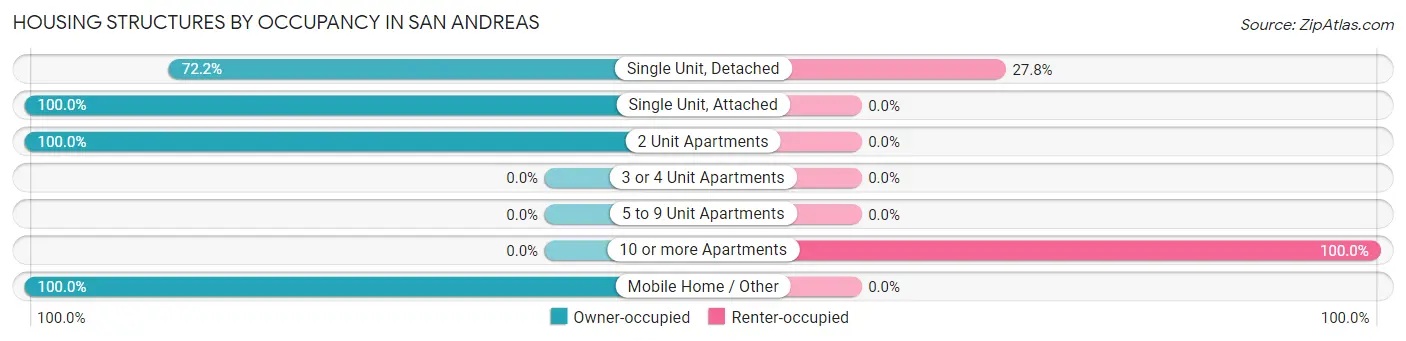
| Structure Type | Owner-occupied | Renter-occupied |
| Single Unit, Detached | 616 (72.2%) | 237 (27.8%) |
| Single Unit, Attached | 12 (100.0%) | 0 (0.0%) |
| 2 Unit Apartments | 10 (100.0%) | 0 (0.0%) |
| 3 or 4 Unit Apartments | 0 (0.0%) | 0 (0.0%) |
| 5 to 9 Unit Apartments | 0 (0.0%) | 0 (0.0%) |
| 10 or more Apartments | 0 (0.0%) | 125 (100.0%) |
| Mobile Home / Other | 53 (100.0%) | 0 (0.0%) |
| Total | 691 (65.6%) | 362 (34.4%) |
Housing Structures by Number of Rooms in San Andreas
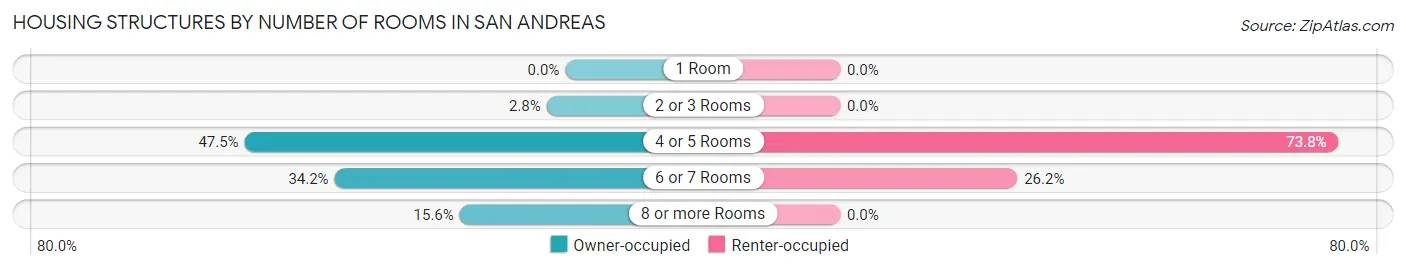
| Number of Rooms | Owner-occupied | Renter-occupied |
| 1 Room | 0 (0.0%) | 0 (0.0%) |
| 2 or 3 Rooms | 19 (2.8%) | 0 (0.0%) |
| 4 or 5 Rooms | 328 (47.5%) | 267 (73.8%) |
| 6 or 7 Rooms | 236 (34.2%) | 95 (26.2%) |
| 8 or more Rooms | 108 (15.6%) | 0 (0.0%) |
| Total | 691 (100.0%) | 362 (100.0%) |
Housing Structure by Heating Type in San Andreas
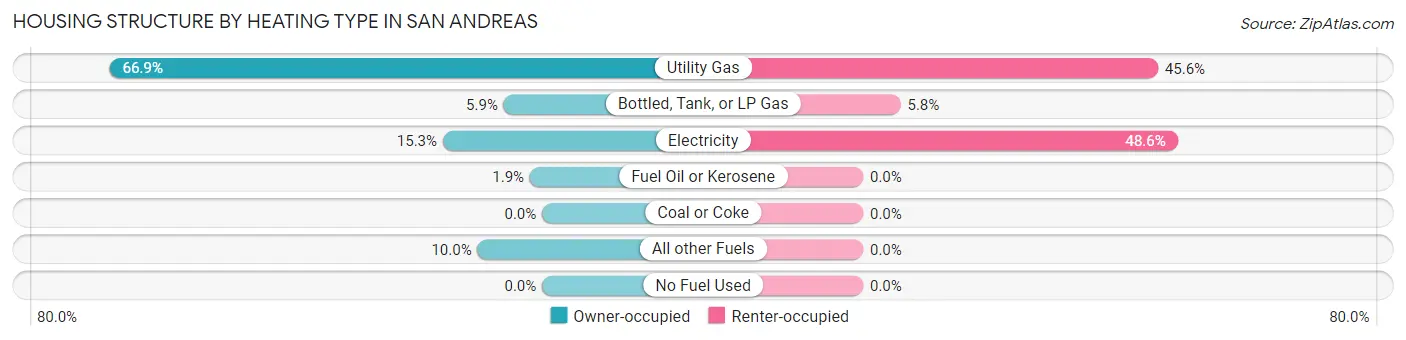
| Heating Type | Owner-occupied | Renter-occupied |
| Utility Gas | 462 (66.9%) | 165 (45.6%) |
| Bottled, Tank, or LP Gas | 41 (5.9%) | 21 (5.8%) |
| Electricity | 106 (15.3%) | 176 (48.6%) |
| Fuel Oil or Kerosene | 13 (1.9%) | 0 (0.0%) |
| Coal or Coke | 0 (0.0%) | 0 (0.0%) |
| All other Fuels | 69 (10.0%) | 0 (0.0%) |
| No Fuel Used | 0 (0.0%) | 0 (0.0%) |
| Total | 691 (100.0%) | 362 (100.0%) |
Household Vehicle Usage in San Andreas
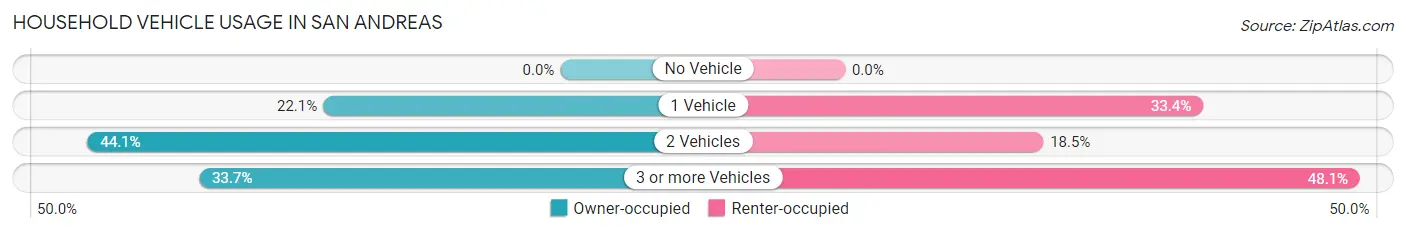
| Vehicles per Household | Owner-occupied | Renter-occupied |
| No Vehicle | 0 (0.0%) | 0 (0.0%) |
| 1 Vehicle | 153 (22.1%) | 121 (33.4%) |
| 2 Vehicles | 305 (44.1%) | 67 (18.5%) |
| 3 or more Vehicles | 233 (33.7%) | 174 (48.1%) |
| Total | 691 (100.0%) | 362 (100.0%) |
Real Estate & Mortgages in San Andreas
Real Estate and Mortgage Overview in San Andreas
| Characteristic | Without Mortgage | With Mortgage |
| Housing Units | 339 | 352 |
| Median Property Value | $392,000 | $354,800 |
| Median Household Income | - | - |
| Monthly Housing Costs | $673 | $0 |
| Real Estate Taxes | $2,574 | $0 |
Property Value by Mortgage Status in San Andreas
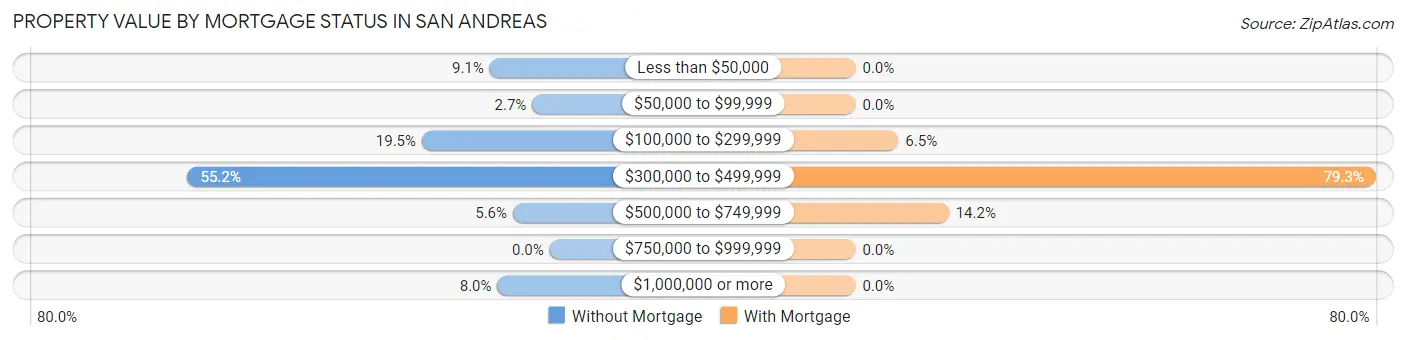
| Property Value | Without Mortgage | With Mortgage |
| Less than $50,000 | 31 (9.1%) | 0 (0.0%) |
| $50,000 to $99,999 | 9 (2.6%) | 0 (0.0%) |
| $100,000 to $299,999 | 66 (19.5%) | 23 (6.5%) |
| $300,000 to $499,999 | 187 (55.2%) | 279 (79.3%) |
| $500,000 to $749,999 | 19 (5.6%) | 50 (14.2%) |
| $750,000 to $999,999 | 0 (0.0%) | 0 (0.0%) |
| $1,000,000 or more | 27 (8.0%) | 0 (0.0%) |
| Total | 339 (100.0%) | 352 (100.0%) |
Household Income by Mortgage Status in San Andreas
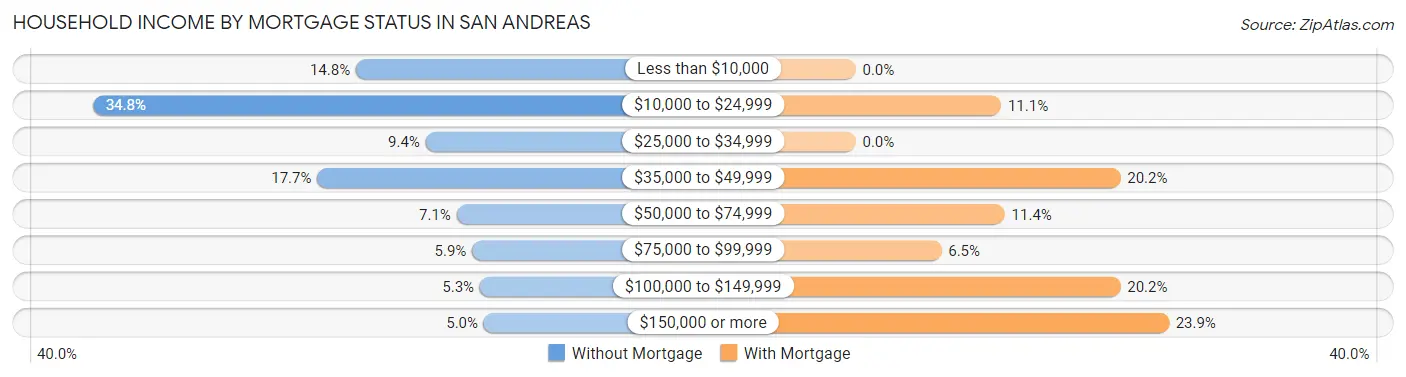
| Household Income | Without Mortgage | With Mortgage |
| Less than $10,000 | 50 (14.7%) | 0 (0.0%) |
| $10,000 to $24,999 | 118 (34.8%) | 39 (11.1%) |
| $25,000 to $34,999 | 32 (9.4%) | 0 (0.0%) |
| $35,000 to $49,999 | 60 (17.7%) | 71 (20.2%) |
| $50,000 to $74,999 | 24 (7.1%) | 40 (11.4%) |
| $75,000 to $99,999 | 20 (5.9%) | 23 (6.5%) |
| $100,000 to $149,999 | 18 (5.3%) | 71 (20.2%) |
| $150,000 or more | 17 (5.0%) | 84 (23.9%) |
| Total | 339 (100.0%) | 352 (100.0%) |
Property Value to Household Income Ratio in San Andreas
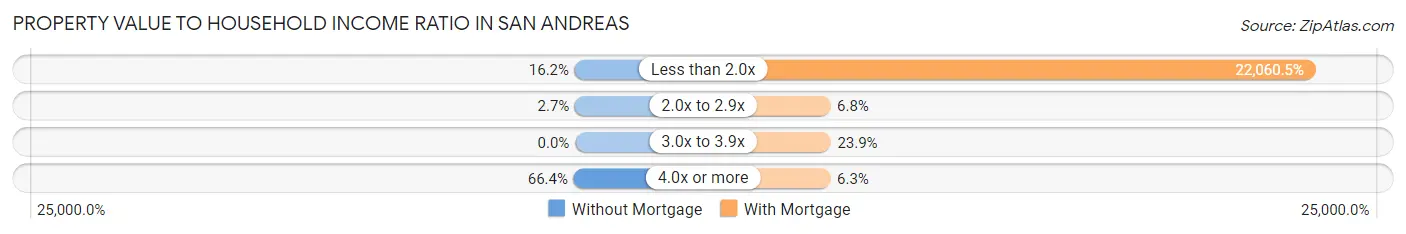
| Value-to-Income Ratio | Without Mortgage | With Mortgage |
| Less than 2.0x | 55 (16.2%) | 77,653 (22,060.5%) |
| 2.0x to 2.9x | 9 (2.6%) | 24 (6.8%) |
| 3.0x to 3.9x | 0 (0.0%) | 84 (23.9%) |
| 4.0x or more | 225 (66.4%) | 22 (6.2%) |
| Total | 339 (100.0%) | 352 (100.0%) |
Real Estate Taxes by Mortgage Status in San Andreas
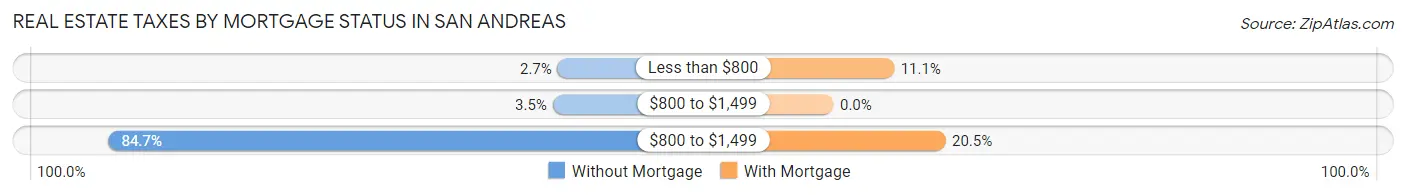
| Property Taxes | Without Mortgage | With Mortgage |
| Less than $800 | 9 (2.6%) | 39 (11.1%) |
| $800 to $1,499 | 12 (3.5%) | 0 (0.0%) |
| $800 to $1,499 | 287 (84.7%) | 72 (20.4%) |
| Total | 339 (100.0%) | 352 (100.0%) |
Health & Disability in San Andreas
Health Insurance Coverage by Age in San Andreas
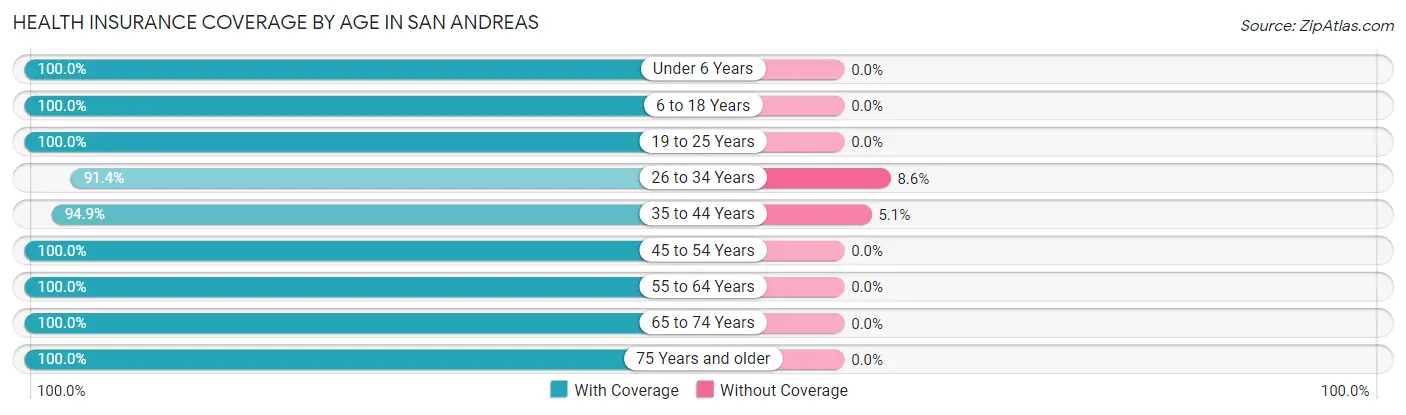
| Age Bracket | With Coverage | Without Coverage |
| Under 6 Years | 180 (100.0%) | 0 (0.0%) |
| 6 to 18 Years | 502 (100.0%) | 0 (0.0%) |
| 19 to 25 Years | 72 (100.0%) | 0 (0.0%) |
| 26 to 34 Years | 414 (91.4%) | 39 (8.6%) |
| 35 to 44 Years | 319 (94.9%) | 17 (5.1%) |
| 45 to 54 Years | 156 (100.0%) | 0 (0.0%) |
| 55 to 64 Years | 352 (100.0%) | 0 (0.0%) |
| 65 to 74 Years | 415 (100.0%) | 0 (0.0%) |
| 75 Years and older | 312 (100.0%) | 0 (0.0%) |
| Total | 2,722 (98.0%) | 56 (2.0%) |
Health Insurance Coverage by Citizenship Status in San Andreas
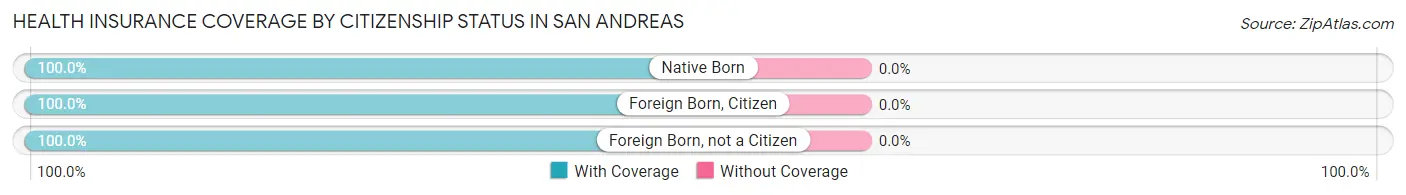
| Citizenship Status | With Coverage | Without Coverage |
| Native Born | 180 (100.0%) | 0 (0.0%) |
| Foreign Born, Citizen | 502 (100.0%) | 0 (0.0%) |
| Foreign Born, not a Citizen | 72 (100.0%) | 0 (0.0%) |
Health Insurance Coverage by Household Income in San Andreas
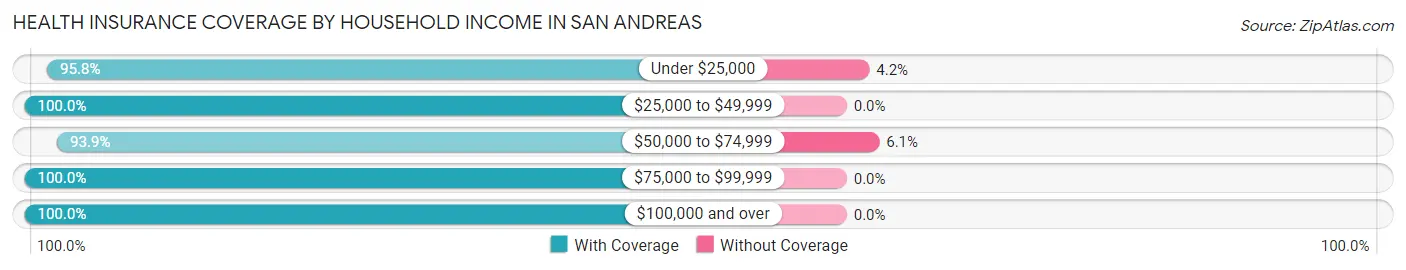
| Household Income | With Coverage | Without Coverage |
| Under $25,000 | 769 (95.8%) | 34 (4.2%) |
| $25,000 to $49,999 | 775 (100.0%) | 0 (0.0%) |
| $50,000 to $74,999 | 339 (93.9%) | 22 (6.1%) |
| $75,000 to $99,999 | 293 (100.0%) | 0 (0.0%) |
| $100,000 and over | 519 (100.0%) | 0 (0.0%) |
Public vs Private Health Insurance Coverage by Age in San Andreas
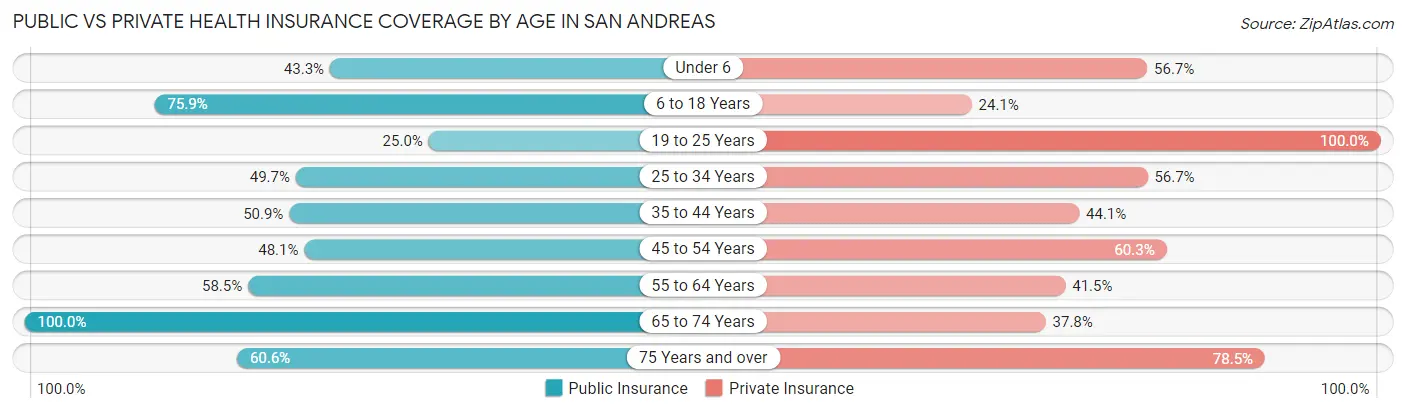
| Age Bracket | Public Insurance | Private Insurance |
| Under 6 | 78 (43.3%) | 102 (56.7%) |
| 6 to 18 Years | 381 (75.9%) | 121 (24.1%) |
| 19 to 25 Years | 18 (25.0%) | 72 (100.0%) |
| 25 to 34 Years | 225 (49.7%) | 257 (56.7%) |
| 35 to 44 Years | 171 (50.9%) | 148 (44.1%) |
| 45 to 54 Years | 75 (48.1%) | 94 (60.3%) |
| 55 to 64 Years | 206 (58.5%) | 146 (41.5%) |
| 65 to 74 Years | 415 (100.0%) | 157 (37.8%) |
| 75 Years and over | 189 (60.6%) | 245 (78.5%) |
| Total | 1,758 (63.3%) | 1,342 (48.3%) |
Disability Status by Sex by Age in San Andreas
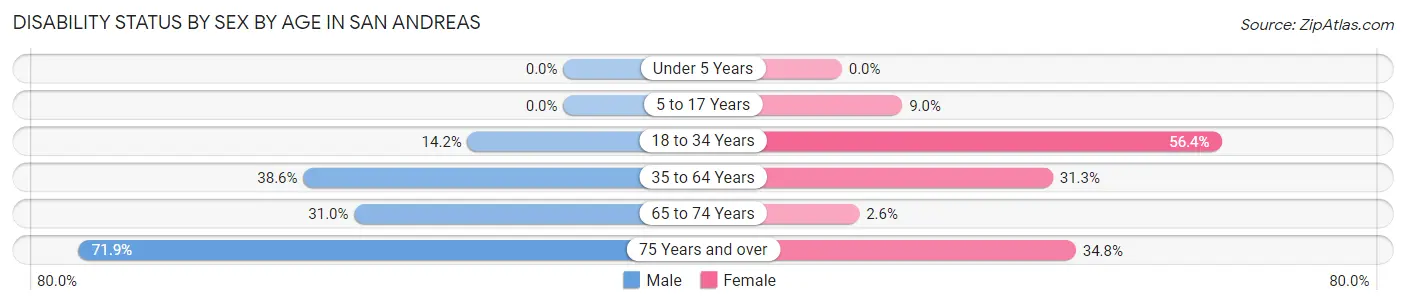
| Age Bracket | Male | Female |
| Under 5 Years | 0 (0.0%) | 0 (0.0%) |
| 5 to 17 Years | 0 (0.0%) | 21 (9.0%) |
| 18 to 34 Years | 52 (14.2%) | 133 (56.4%) |
| 35 to 64 Years | 178 (38.6%) | 120 (31.3%) |
| 65 to 74 Years | 45 (31.0%) | 7 (2.6%) |
| 75 Years and over | 123 (71.9%) | 49 (34.7%) |
Disability Class by Sex by Age in San Andreas
Disability Class: Hearing Difficulty
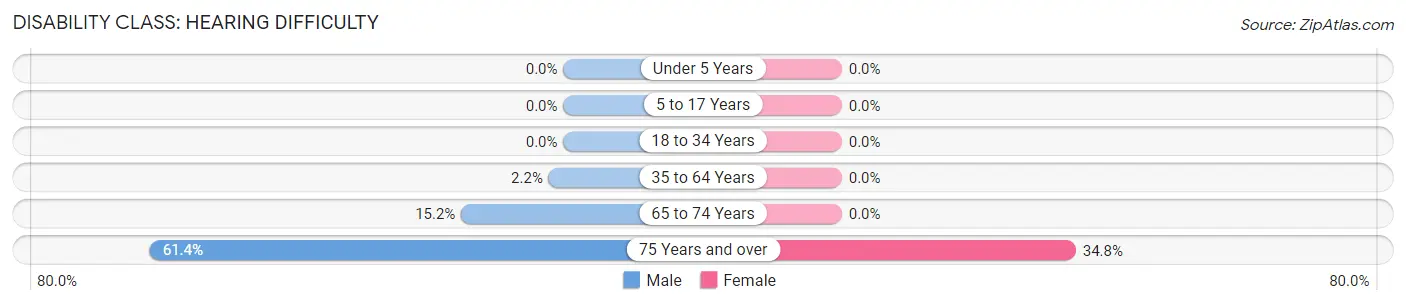
| Age Bracket | Male | Female |
| Under 5 Years | 0 (0.0%) | 0 (0.0%) |
| 5 to 17 Years | 0 (0.0%) | 0 (0.0%) |
| 18 to 34 Years | 0 (0.0%) | 0 (0.0%) |
| 35 to 64 Years | 10 (2.2%) | 0 (0.0%) |
| 65 to 74 Years | 22 (15.2%) | 0 (0.0%) |
| 75 Years and over | 105 (61.4%) | 49 (34.7%) |
Disability Class: Vision Difficulty
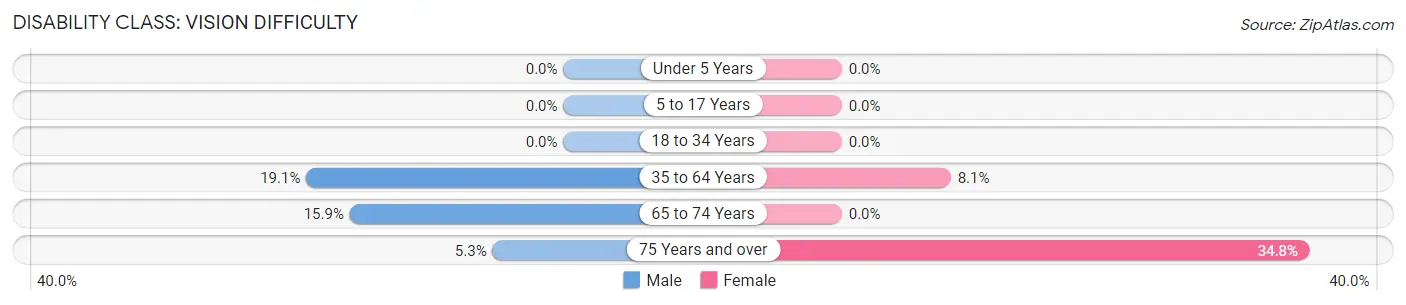
| Age Bracket | Male | Female |
| Under 5 Years | 0 (0.0%) | 0 (0.0%) |
| 5 to 17 Years | 0 (0.0%) | 0 (0.0%) |
| 18 to 34 Years | 0 (0.0%) | 0 (0.0%) |
| 35 to 64 Years | 88 (19.1%) | 31 (8.1%) |
| 65 to 74 Years | 23 (15.9%) | 0 (0.0%) |
| 75 Years and over | 9 (5.3%) | 49 (34.7%) |
Disability Class: Cognitive Difficulty
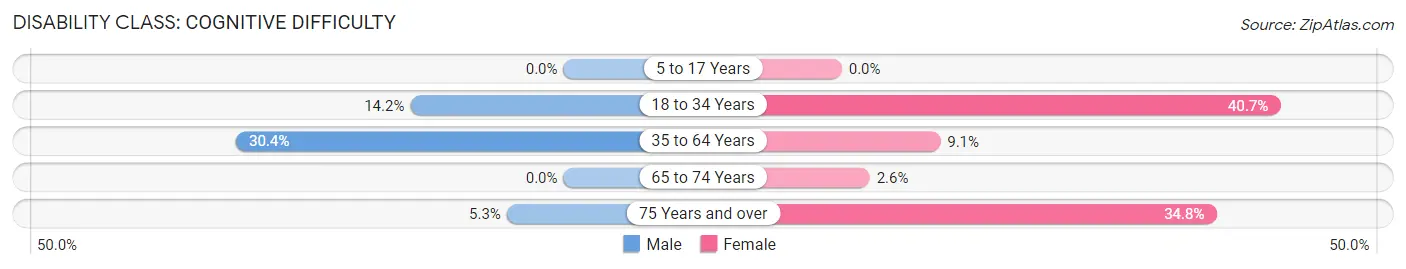
| Age Bracket | Male | Female |
| 5 to 17 Years | 0 (0.0%) | 0 (0.0%) |
| 18 to 34 Years | 52 (14.2%) | 96 (40.7%) |
| 35 to 64 Years | 140 (30.4%) | 35 (9.1%) |
| 65 to 74 Years | 0 (0.0%) | 7 (2.6%) |
| 75 Years and over | 9 (5.3%) | 49 (34.7%) |
Disability Class: Ambulatory Difficulty
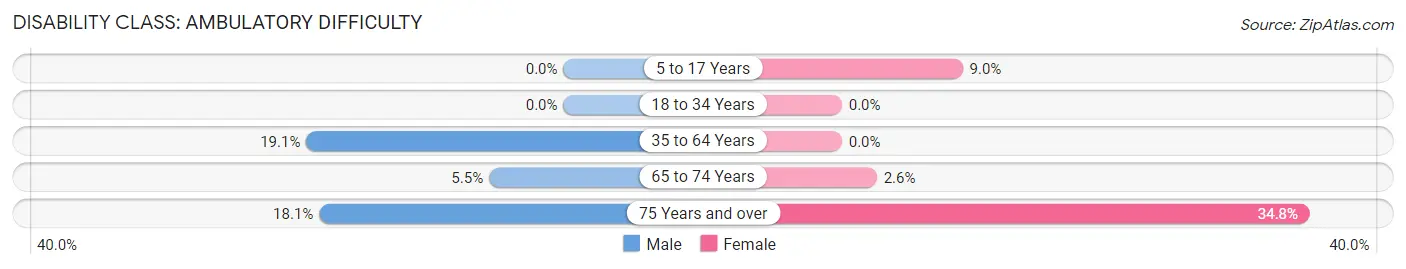
| Age Bracket | Male | Female |
| 5 to 17 Years | 0 (0.0%) | 21 (9.0%) |
| 18 to 34 Years | 0 (0.0%) | 0 (0.0%) |
| 35 to 64 Years | 88 (19.1%) | 0 (0.0%) |
| 65 to 74 Years | 8 (5.5%) | 7 (2.6%) |
| 75 Years and over | 31 (18.1%) | 49 (34.7%) |
Disability Class: Self-Care Difficulty
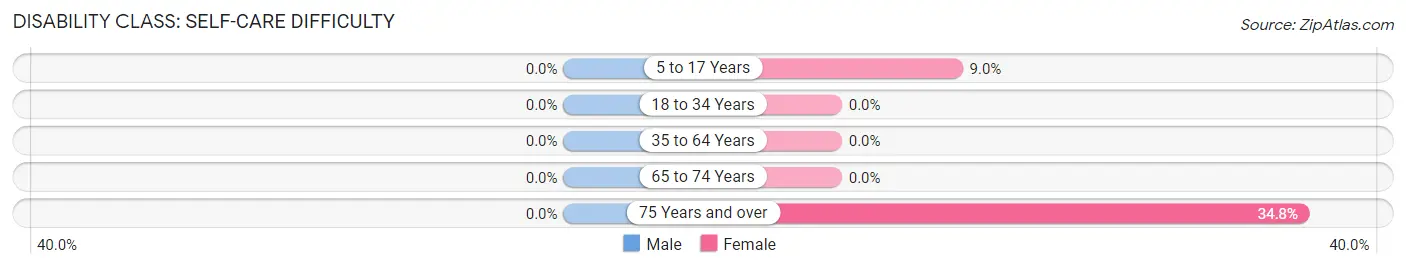
| Age Bracket | Male | Female |
| 5 to 17 Years | 0 (0.0%) | 21 (9.0%) |
| 18 to 34 Years | 0 (0.0%) | 0 (0.0%) |
| 35 to 64 Years | 0 (0.0%) | 0 (0.0%) |
| 65 to 74 Years | 0 (0.0%) | 0 (0.0%) |
| 75 Years and over | 0 (0.0%) | 49 (34.7%) |
Technology Access in San Andreas
Computing Device Access in San Andreas
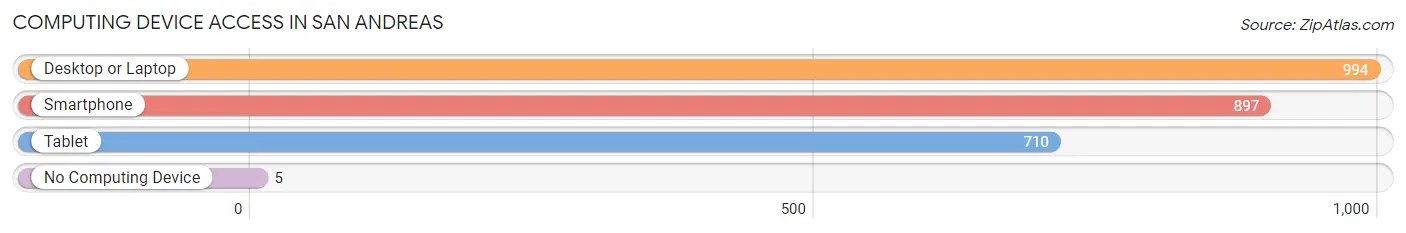
| Device Type | # Households | % Households |
| Desktop or Laptop | 994 | 94.4% |
| Smartphone | 897 | 85.2% |
| Tablet | 710 | 67.4% |
| No Computing Device | 5 | 0.5% |
| Total | 1,053 | 100.0% |
Internet Access in San Andreas
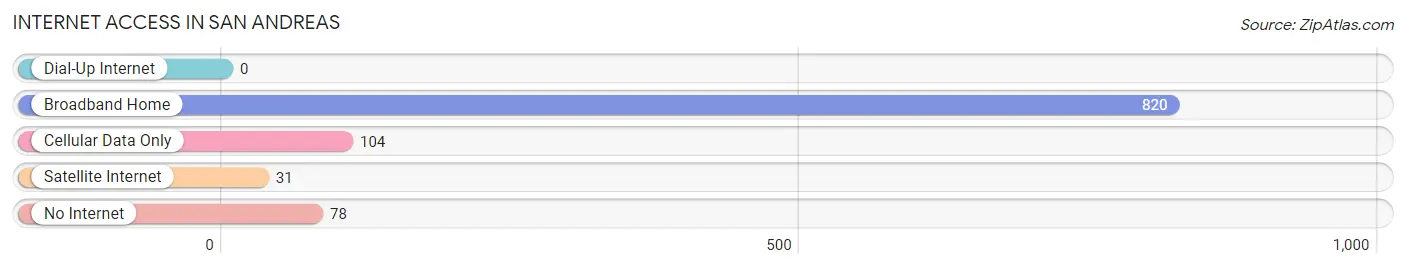
| Internet Type | # Households | % Households |
| Dial-Up Internet | 0 | 0.0% |
| Broadband Home | 820 | 77.9% |
| Cellular Data Only | 104 | 9.9% |
| Satellite Internet | 31 | 2.9% |
| No Internet | 78 | 7.4% |
| Total | 1,053 | 100.0% |
San Andreas Summary
San Andreas is a small city located in Calaveras County, California. It is situated in the foothills of the Sierra Nevada Mountains, approximately 60 miles southeast of Sacramento. The city has a population of approximately 2,500 people and covers an area of 1.7 square miles.
History
San Andreas was founded in 1848 by Mexican miners who were searching for gold. The city was named after Saint Andrew, the patron saint of miners. The city was incorporated in 1851 and quickly became a hub for the gold mining industry. During the Gold Rush, San Andreas was a major supply center for miners and prospectors.
In the late 19th century, San Andreas began to transition from a mining town to an agricultural center. The city was home to several large farms and ranches, and the local economy was largely based on the production of wheat, barley, and other grains.
Geography
San Andreas is located in the foothills of the Sierra Nevada Mountains, approximately 60 miles southeast of Sacramento. The city is situated at an elevation of 1,200 feet and is surrounded by rolling hills and oak-studded valleys. The city is located in a temperate climate zone, with hot summers and mild winters.
The city is home to several parks and recreational areas, including San Andreas Lake, which is a popular spot for fishing and boating. The city is also home to several historic sites, including the San Andreas Historical Museum and the San Andreas Cemetery.
Economy
San Andreas is a small city with a population of approximately 2,500 people. The local economy is largely based on agriculture, with the city being home to several large farms and ranches. The city is also home to several small businesses, including restaurants, retail stores, and service providers.
The city is home to several large employers, including the San Andreas Unified School District, the Calaveras County Sheriff’s Office, and the San Andreas Medical Center. The city is also home to several small businesses, including restaurants, retail stores, and service providers.
Demographics
As of the 2010 census, the population of San Andreas was 2,500 people. The racial makeup of the city was 87.2% White, 0.8% African American, 0.8% Native American, 0.4% Asian, 0.2% Pacific Islander, 8.4% from other races, and 2.0% from two or more races. Hispanic or Latino of any race were 16.4% of the population.
The median household income in San Andreas was $41,250, and the median family income was $48,750. The per capita income for the city was $20,945. About 11.2% of families and 14.2% of the population were below the poverty line, including 19.2% of those under age 18 and 8.2% of those age 65 or over.
San Andreas is a small city with a rich history and a diverse population. The city is home to several large employers and small businesses, and the local economy is largely based on agriculture. The city is also home to several parks and recreational areas, making it a great place to live and work.
Common Questions
What is Per Capita Income in San Andreas?
Per Capita income in San Andreas is $20,068.
What is the Median Family Income in San Andreas?
Median Family Income in San Andreas is $37,174.
What is the Median Household income in San Andreas?
Median Household Income in San Andreas is $36,450.
What is Inequality or Gini Index in San Andreas?
Inequality or Gini Index in San Andreas is 0.52.
What is the Total Population of San Andreas?
Total Population of San Andreas is 2,936.
What is the Total Male Population of San Andreas?
Total Male Population of San Andreas is 1,524.
What is the Total Female Population of San Andreas?
Total Female Population of San Andreas is 1,412.
What is the Ratio of Males per 100 Females in San Andreas?
There are 107.93 Males per 100 Females in San Andreas.
What is the Ratio of Females per 100 Males in San Andreas?
There are 92.65 Females per 100 Males in San Andreas.
What is the Median Population Age in San Andreas?
Median Population Age in San Andreas is 38.2 Years.
What is the Average Family Size in San Andreas
Average Family Size in San Andreas is 2.9 People.
What is the Average Household Size in San Andreas
Average Household Size in San Andreas is 2.6 People.
How Large is the Labor Force in San Andreas?
There are 859 People in the Labor Forcein in San Andreas.
What is the Percentage of People in the Labor Force in San Andreas?
34.4% of People are in the Labor Force in San Andreas.
What is the Unemployment Rate in San Andreas?
Unemployment Rate in San Andreas is 2.0%.