Cities with the Highest Percentage of Population Employed in Security & Protection in Maryland
RELATED REPORTS & OPTIONS
Security & Protection
Maryland
Compare Cities
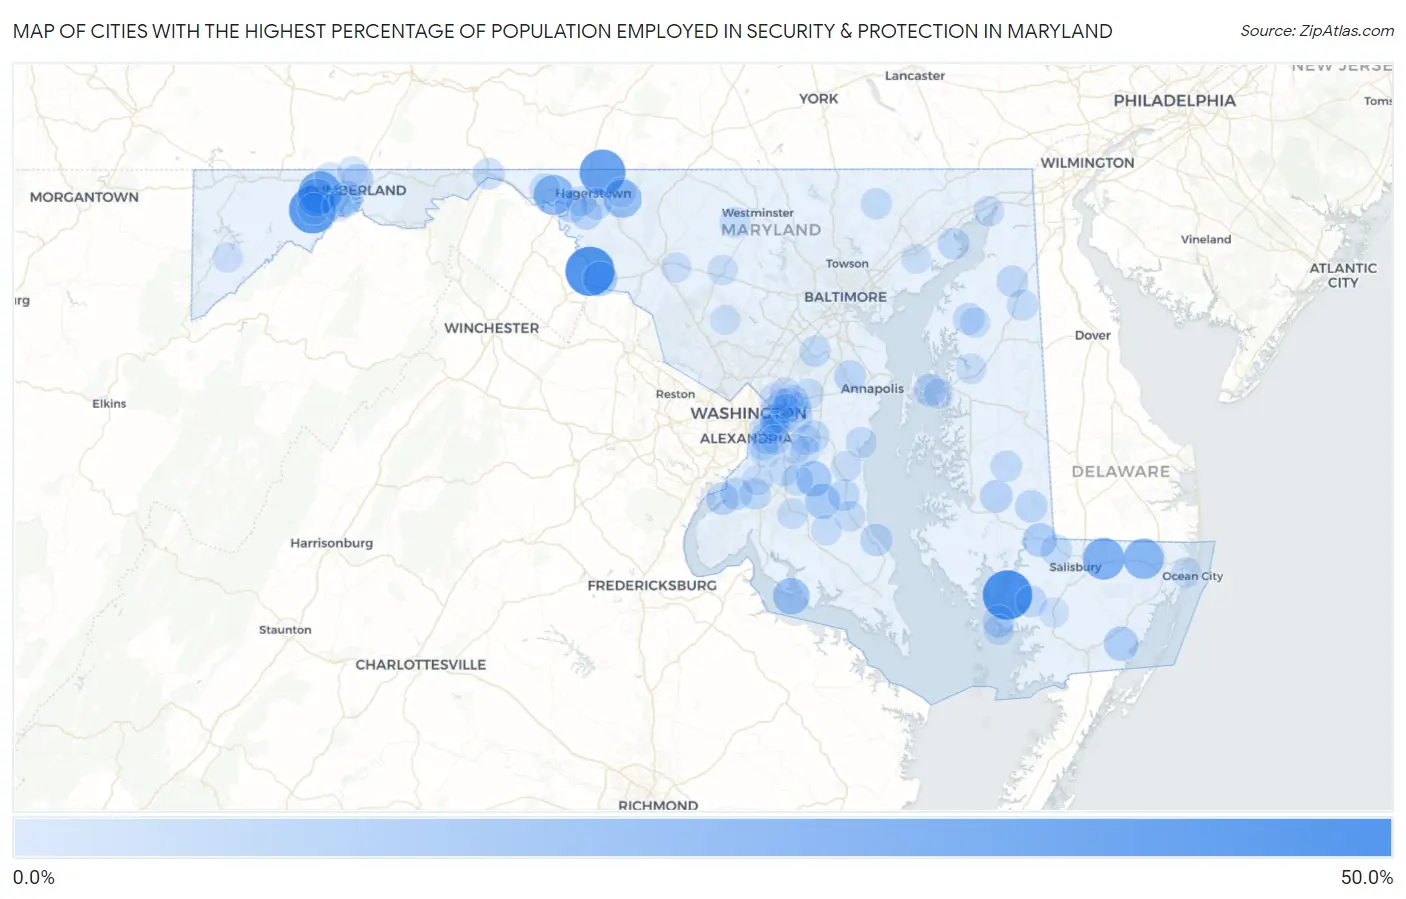
Map of Cities with the Highest Percentage of Population Employed in Security & Protection in Maryland
0.0%
50.0%
Cities with the Highest Percentage of Population Employed in Security & Protection in Maryland
| City | % Employed | vs State | vs National | |
| 1. | Nanticoke | 43.6% | 2.8%(+40.8)#1 | 2.1%(+41.5)#50 |
| 2. | Dargan | 42.9% | 2.8%(+40.1)#2 | 2.1%(+40.7)#53 |
| 3. | Gilmore | 38.2% | 2.8%(+35.5)#3 | 2.1%(+36.1)#67 |
| 4. | Reid | 36.1% | 2.8%(+33.3)#4 | 2.1%(+34.0)#80 |
| 5. | Grahamtown | 29.8% | 2.8%(+27.0)#5 | 2.1%(+27.6)#118 |
| 6. | Parsonsburg | 27.5% | 2.8%(+24.7)#6 | 2.1%(+25.3)#146 |
| 7. | Whaleyville | 25.0% | 2.8%(+22.2)#7 | 2.1%(+22.9)#180 |
| 8. | Charlton | 24.4% | 2.8%(+21.6)#8 | 2.1%(+22.3)#196 |
| 9. | Pondsville | 20.6% | 2.8%(+17.8)#9 | 2.1%(+18.5)#263 |
| 10. | Shaft | 20.1% | 2.8%(+17.3)#10 | 2.1%(+18.0)#270 |
| 11. | Cobb Island | 17.6% | 2.8%(+14.8)#11 | 2.1%(+15.5)#345 |
| 12. | Baden | 15.3% | 2.8%(+12.5)#12 | 2.1%(+13.2)#471 |
| 13. | Aquasco | 14.8% | 2.8%(+12.0)#13 | 2.1%(+12.7)#495 |
| 14. | Garretts Mill | 13.8% | 2.8%(+11.0)#14 | 2.1%(+11.6)#585 |
| 15. | Girdletree | 13.4% | 2.8%(+10.6)#15 | 2.1%(+11.3)#621 |
| 16. | Mardela Springs | 12.8% | 2.8%(+10.0)#16 | 2.1%(+10.7)#679 |
| 17. | Bowling Green | 11.4% | 2.8%(+8.61)#17 | 2.1%(+9.26)#850 |
| 18. | Ten Mile Creek | 11.3% | 2.8%(+8.53)#18 | 2.1%(+9.18)#858 |
| 19. | Temple Hills | 10.4% | 2.8%(+7.64)#19 | 2.1%(+8.29)#1,021 |
| 20. | Largo | 10.4% | 2.8%(+7.57)#20 | 2.1%(+8.22)#1,034 |
| 21. | Indian Head | 10.1% | 2.8%(+7.28)#21 | 2.1%(+7.93)#1,084 |
| 22. | Williamsport | 9.9% | 2.8%(+7.15)#22 | 2.1%(+7.80)#1,106 |
| 23. | Secretary | 9.8% | 2.8%(+7.01)#23 | 2.1%(+7.66)#1,139 |
| 24. | Kent Narrows | 9.8% | 2.8%(+6.96)#24 | 2.1%(+7.61)#1,148 |
| 25. | Brookview | 9.5% | 2.8%(+6.73)#25 | 2.1%(+7.38)#1,196 |
| 26. | Long Beach | 9.5% | 2.8%(+6.70)#26 | 2.1%(+7.35)#1,197 |
| 27. | Springdale | 9.4% | 2.8%(+6.56)#27 | 2.1%(+7.21)#1,234 |
| 28. | Bryans Road | 9.3% | 2.8%(+6.50)#28 | 2.1%(+7.15)#1,245 |
| 29. | Potomac Park | 9.1% | 2.8%(+6.31)#29 | 2.1%(+6.96)#1,287 |
| 30. | Chance | 9.1% | 2.8%(+6.29)#30 | 2.1%(+6.94)#1,295 |
| 31. | Abingdon | 9.0% | 2.8%(+6.20)#31 | 2.1%(+6.85)#1,336 |
| 32. | Crownsville | 8.7% | 2.8%(+5.94)#32 | 2.1%(+6.59)#1,420 |
| 33. | St James | 8.5% | 2.8%(+5.73)#33 | 2.1%(+6.38)#1,477 |
| 34. | Bowmans Addition | 8.4% | 2.8%(+5.62)#34 | 2.1%(+6.27)#1,513 |
| 35. | Funkstown | 8.4% | 2.8%(+5.57)#35 | 2.1%(+6.22)#1,526 |
| 36. | Midland | 8.3% | 2.8%(+5.48)#36 | 2.1%(+6.13)#1,564 |
| 37. | Fairmount Heights | 8.2% | 2.8%(+5.42)#37 | 2.1%(+6.07)#1,580 |
| 38. | Chestertown | 8.2% | 2.8%(+5.42)#38 | 2.1%(+6.07)#1,583 |
| 39. | Hancock | 8.2% | 2.8%(+5.38)#39 | 2.1%(+6.03)#1,598 |
| 40. | Aberdeen Proving Ground | 8.1% | 2.8%(+5.34)#40 | 2.1%(+5.99)#1,608 |
| 41. | Huntingtown | 8.1% | 2.8%(+5.31)#41 | 2.1%(+5.96)#1,616 |
| 42. | Galena | 8.1% | 2.8%(+5.26)#42 | 2.1%(+5.91)#1,636 |
| 43. | Mount Vernon | 8.0% | 2.8%(+5.24)#43 | 2.1%(+5.89)#1,645 |
| 44. | Bensville | 7.8% | 2.8%(+4.98)#44 | 2.1%(+5.63)#1,733 |
| 45. | Upper Marlboro | 7.6% | 2.8%(+4.83)#45 | 2.1%(+5.48)#1,786 |
| 46. | Hebron | 7.6% | 2.8%(+4.79)#46 | 2.1%(+5.44)#1,805 |
| 47. | Fort Meade | 7.6% | 2.8%(+4.75)#47 | 2.1%(+5.40)#1,825 |
| 48. | Capitol Heights | 7.5% | 2.8%(+4.73)#48 | 2.1%(+5.38)#1,840 |
| 49. | Millington | 7.5% | 2.8%(+4.73)#49 | 2.1%(+5.38)#1,843 |
| 50. | Hillcrest Heights | 7.5% | 2.8%(+4.72)#50 | 2.1%(+5.37)#1,846 |
| 51. | Cedarville | 7.5% | 2.8%(+4.69)#51 | 2.1%(+5.34)#1,859 |
| 52. | Preston | 7.5% | 2.8%(+4.69)#52 | 2.1%(+5.34)#1,860 |
| 53. | Jarrettsville | 7.0% | 2.8%(+4.23)#53 | 2.1%(+4.88)#2,062 |
| 54. | New Windsor | 6.8% | 2.8%(+4.03)#54 | 2.1%(+4.68)#2,173 |
| 55. | Clear Spring | 6.8% | 2.8%(+3.99)#55 | 2.1%(+4.64)#2,190 |
| 56. | Wildewood | 6.8% | 2.8%(+3.98)#56 | 2.1%(+4.63)#2,194 |
| 57. | Deale | 6.7% | 2.8%(+3.93)#57 | 2.1%(+4.58)#2,231 |
| 58. | Oxon Hill | 6.6% | 2.8%(+3.81)#58 | 2.1%(+4.46)#2,301 |
| 59. | Prince Frederick | 6.4% | 2.8%(+3.64)#59 | 2.1%(+4.29)#2,400 |
| 60. | Silver Hill | 6.4% | 2.8%(+3.59)#60 | 2.1%(+4.24)#2,432 |
| 61. | Walker Mill | 6.4% | 2.8%(+3.58)#61 | 2.1%(+4.23)#2,446 |
| 62. | Cresaptown | 6.4% | 2.8%(+3.57)#62 | 2.1%(+4.22)#2,453 |
| 63. | Centreville | 6.4% | 2.8%(+3.56)#63 | 2.1%(+4.21)#2,464 |
| 64. | Bryantown | 6.3% | 2.8%(+3.54)#64 | 2.1%(+4.19)#2,477 |
| 65. | Accokeek | 6.3% | 2.8%(+3.46)#65 | 2.1%(+4.11)#2,519 |
| 66. | Owings | 6.2% | 2.8%(+3.42)#66 | 2.1%(+4.07)#2,549 |
| 67. | Golden Beach | 6.2% | 2.8%(+3.38)#67 | 2.1%(+4.02)#2,574 |
| 68. | Lake Arbor | 6.1% | 2.8%(+3.27)#68 | 2.1%(+3.91)#2,649 |
| 69. | Halfway | 6.0% | 2.8%(+3.21)#69 | 2.1%(+3.86)#2,703 |
| 70. | Charlestown | 6.0% | 2.8%(+3.17)#70 | 2.1%(+3.82)#2,728 |
| 71. | Friendly | 6.0% | 2.8%(+3.17)#71 | 2.1%(+3.82)#2,740 |
| 72. | Deal Island | 6.0% | 2.8%(+3.15)#72 | 2.1%(+3.80)#2,751 |
| 73. | Kingstown | 5.9% | 2.8%(+3.12)#73 | 2.1%(+3.77)#2,780 |
| 74. | Mount Savage | 5.9% | 2.8%(+3.11)#74 | 2.1%(+3.76)#2,790 |
| 75. | Suitland | 5.9% | 2.8%(+3.10)#75 | 2.1%(+3.75)#2,793 |
| 76. | Fairwood | 5.9% | 2.8%(+3.10)#76 | 2.1%(+3.75)#2,800 |
| 77. | Queensland | 5.9% | 2.8%(+3.08)#77 | 2.1%(+3.73)#2,832 |
| 78. | New Carrollton | 5.8% | 2.8%(+3.00)#78 | 2.1%(+3.65)#2,881 |
| 79. | Bartonsville | 5.8% | 2.8%(+2.96)#79 | 2.1%(+3.61)#2,925 |
| 80. | Romancoke | 5.7% | 2.8%(+2.87)#80 | 2.1%(+3.52)#2,994 |
| 81. | Landover | 5.7% | 2.8%(+2.87)#81 | 2.1%(+3.52)#2,995 |
| 82. | Mount Airy | 5.6% | 2.8%(+2.84)#82 | 2.1%(+3.49)#3,025 |
| 83. | Coral Hills | 5.6% | 2.8%(+2.77)#83 | 2.1%(+3.42)#3,089 |
| 84. | West Ocean City | 5.5% | 2.8%(+2.75)#84 | 2.1%(+3.40)#3,119 |
| 85. | Rosaryville | 5.5% | 2.8%(+2.70)#85 | 2.1%(+3.35)#3,161 |
| 86. | Grasonville | 5.5% | 2.8%(+2.67)#86 | 2.1%(+3.32)#3,198 |
| 87. | Deer Park | 5.3% | 2.8%(+2.54)#87 | 2.1%(+3.18)#3,324 |
| 88. | Marlton | 5.3% | 2.8%(+2.51)#88 | 2.1%(+3.16)#3,356 |
| 89. | Ellerslie | 5.3% | 2.8%(+2.51)#89 | 2.1%(+3.15)#3,364 |
| 90. | Brandywine | 5.3% | 2.8%(+2.48)#90 | 2.1%(+3.13)#3,396 |
| 91. | Edgewood | 5.3% | 2.8%(+2.47)#91 | 2.1%(+3.12)#3,402 |
| 92. | Glenarden | 5.2% | 2.8%(+2.44)#92 | 2.1%(+3.09)#3,437 |
| 93. | Laytonsville | 5.0% | 2.8%(+2.16)#93 | 2.1%(+2.81)#3,735 |
| 94. | Princess Anne | 5.0% | 2.8%(+2.15)#94 | 2.1%(+2.80)#3,740 |
| 95. | Summerfield | 4.9% | 2.8%(+2.14)#95 | 2.1%(+2.79)#3,756 |
| 96. | Camp Springs | 4.9% | 2.8%(+2.14)#96 | 2.1%(+2.79)#3,764 |
| 97. | Green Valley | 4.9% | 2.8%(+2.12)#97 | 2.1%(+2.77)#3,792 |
| 98. | Cedar Heights | 4.9% | 2.8%(+2.08)#98 | 2.1%(+2.73)#3,833 |
| 99. | Bladensburg | 4.9% | 2.8%(+2.06)#99 | 2.1%(+2.71)#3,867 |
| 100. | Cavetown | 4.8% | 2.8%(+2.05)#100 | 2.1%(+2.69)#3,880 |
Common Questions
What are the Top 10 Cities with the Highest Percentage of Population Employed in Security & Protection in Maryland?
Top 10 Cities with the Highest Percentage of Population Employed in Security & Protection in Maryland are:
#1
43.6%
#2
42.9%
#3
38.2%
#4
36.1%
#5
29.8%
#6
27.5%
#7
25.0%
#8
24.4%
#9
20.6%
#10
20.1%
What city has the Highest Percentage of Population Employed in Security & Protection in Maryland?
Nanticoke has the Highest Percentage of Population Employed in Security & Protection in Maryland with 43.6%.
What is the Percentage of Population Employed in Security & Protection in the State of Maryland?
Percentage of Population Employed in Security & Protection in Maryland is 2.8%.
What is the Percentage of Population Employed in Security & Protection in the United States?
Percentage of Population Employed in Security & Protection in the United States is 2.1%.