Ridgemark, CA Map & Demographics
Ridgemark Map
Ridgemark Overview
$63,428
PER CAPITA INCOME
$147,969
AVG FAMILY INCOME
$125,388
AVG HOUSEHOLD INCOME
43.4%
WAGE / INCOME GAP [ % ]
56.6¢/ $1
WAGE / INCOME GAP [ $ ]
0.42
INEQUALITY / GINI INDEX
3,022
TOTAL POPULATION
1,476
MALE POPULATION
1,546
FEMALE POPULATION
95.47
MALES / 100 FEMALES
104.74
FEMALES / 100 MALES
48.1
MEDIAN AGE
2.9
AVG FAMILY SIZE
2.5
AVG HOUSEHOLD SIZE
1,550
LABOR FORCE [ PEOPLE ]
59.4%
PERCENT IN LABOR FORCE
7.6%
UNEMPLOYMENT RATE
Income in Ridgemark
Income Overview in Ridgemark
Per Capita Income in Ridgemark is $63,428, while median incomes of families and households are $147,969 and $125,388 respectively.
| Characteristic | Number | Measure |
| Per Capita Income | 3,022 | $63,428 |
| Median Family Income | 859 | $147,969 |
| Mean Family Income | 859 | $172,718 |
| Median Household Income | 1,181 | $125,388 |
| Mean Household Income | 1,181 | $156,676 |
| Income Deficit | 859 | $0 |
| Wage / Income Gap (%) | 3,022 | 43.42% |
| Wage / Income Gap ($) | 3,022 | 56.58¢ per $1 |
| Gini / Inequality Index | 3,022 | 0.42 |
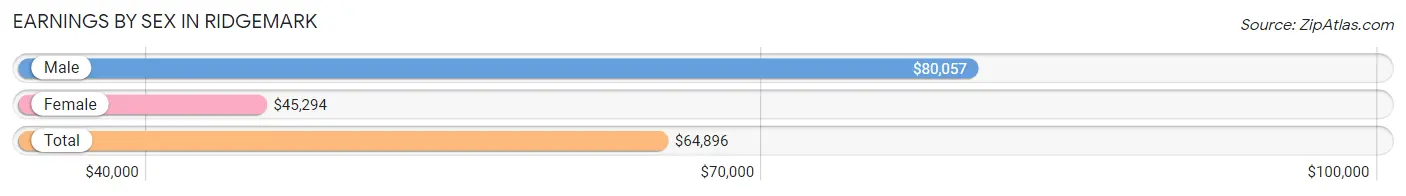
Earnings by Sex in Ridgemark
Average Earnings in Ridgemark are $64,896, $80,057 for men and $45,294 for women, a difference of 43.4%.
| Sex | Number | Average Earnings |
| Male | 808 (51.6%) | $80,057 |
| Female | 758 (48.4%) | $45,294 |
| Total | 1,566 (100.0%) | $64,896 |
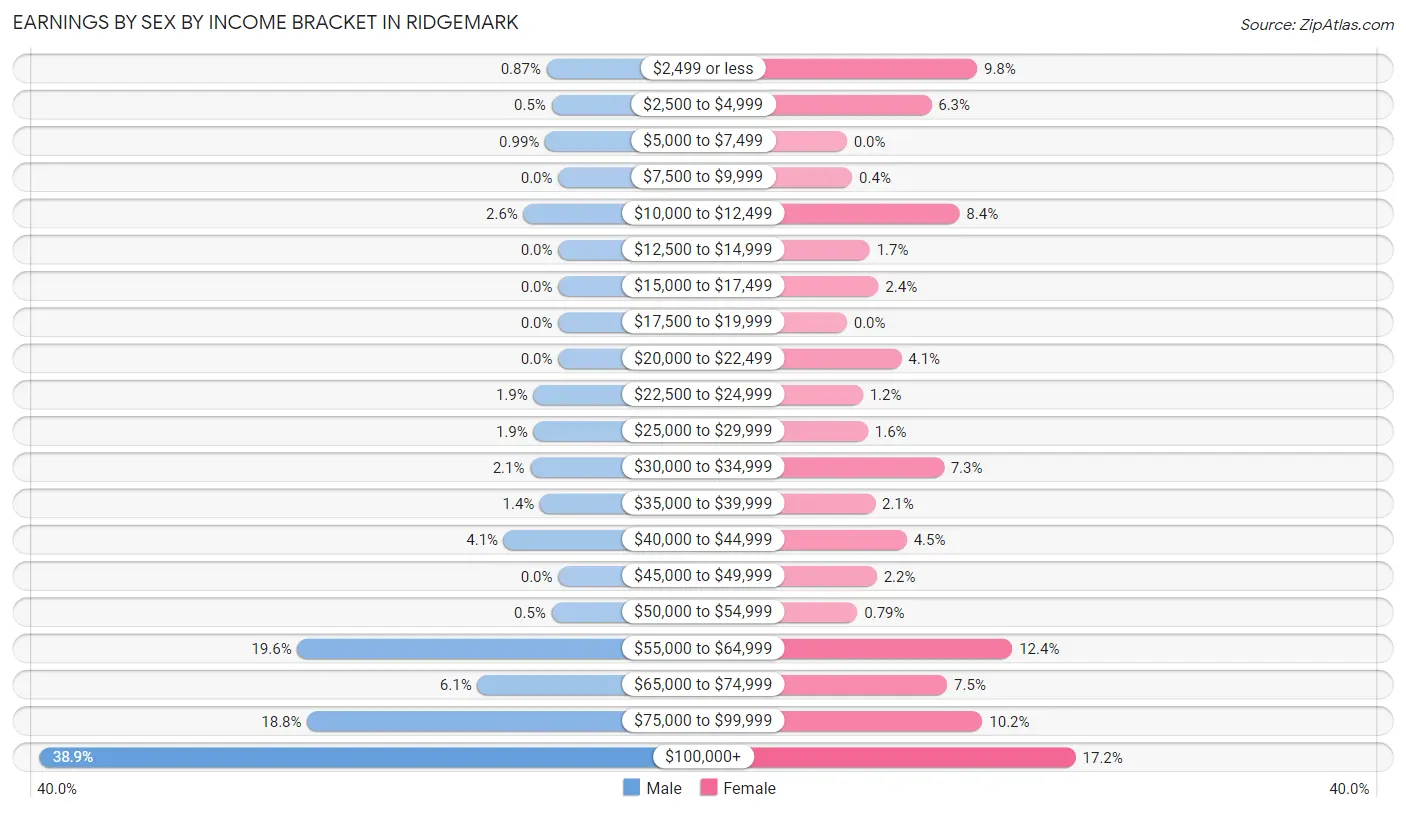
Earnings by Sex by Income Bracket in Ridgemark
The most common earnings brackets in Ridgemark are $100,000+ for men (314 | 38.9%) and $100,000+ for women (130 | 17.2%).
| Income | Male | Female |
| $2,499 or less | 7 (0.9%) | 74 (9.8%) |
| $2,500 to $4,999 | 4 (0.5%) | 48 (6.3%) |
| $5,000 to $7,499 | 8 (1.0%) | 0 (0.0%) |
| $7,500 to $9,999 | 0 (0.0%) | 3 (0.4%) |
| $10,000 to $12,499 | 21 (2.6%) | 64 (8.4%) |
| $12,500 to $14,999 | 0 (0.0%) | 13 (1.7%) |
| $15,000 to $17,499 | 0 (0.0%) | 18 (2.4%) |
| $17,500 to $19,999 | 0 (0.0%) | 0 (0.0%) |
| $20,000 to $22,499 | 0 (0.0%) | 31 (4.1%) |
| $22,500 to $24,999 | 15 (1.9%) | 9 (1.2%) |
| $25,000 to $29,999 | 15 (1.9%) | 12 (1.6%) |
| $30,000 to $34,999 | 17 (2.1%) | 55 (7.3%) |
| $35,000 to $39,999 | 11 (1.4%) | 16 (2.1%) |
| $40,000 to $44,999 | 33 (4.1%) | 34 (4.5%) |
| $45,000 to $49,999 | 0 (0.0%) | 17 (2.2%) |
| $50,000 to $54,999 | 4 (0.5%) | 6 (0.8%) |
| $55,000 to $64,999 | 158 (19.6%) | 94 (12.4%) |
| $65,000 to $74,999 | 49 (6.1%) | 57 (7.5%) |
| $75,000 to $99,999 | 152 (18.8%) | 77 (10.2%) |
| $100,000+ | 314 (38.9%) | 130 (17.2%) |
| Total | 808 (100.0%) | 758 (100.0%) |
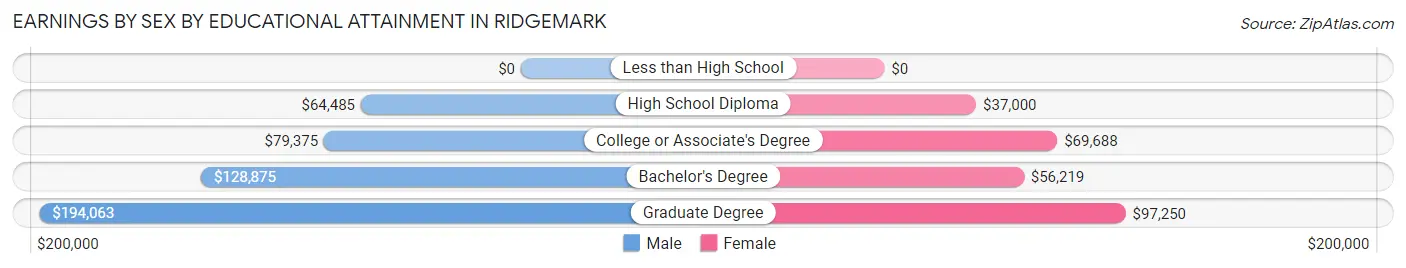
Earnings by Sex by Educational Attainment in Ridgemark
Average earnings in Ridgemark are $81,705 for men and $56,925 for women, a difference of 30.3%. Men with an educational attainment of graduate degree enjoy the highest average annual earnings of $194,063, while those with high school diploma education earn the least with $64,485. Women with an educational attainment of graduate degree earn the most with the average annual earnings of $97,250, while those with high school diploma education have the smallest earnings of $37,000.
| Educational Attainment | Male Income | Female Income |
| Less than High School | - | - |
| High School Diploma | $64,485 | $37,000 |
| College or Associate's Degree | $79,375 | $69,688 |
| Bachelor's Degree | $128,875 | $56,219 |
| Graduate Degree | $194,063 | $97,250 |
| Total | $81,705 | $56,925 |
Family Income in Ridgemark
Family Income Brackets in Ridgemark
According to the Ridgemark family income data, there are 246 families falling into the $200,000+ income range, which is the most common income bracket and makes up 28.6% of all families. Conversely, the $25,000 to $34,999 income bracket is the least frequent group with only 2 families (0.2%) belonging to this category.
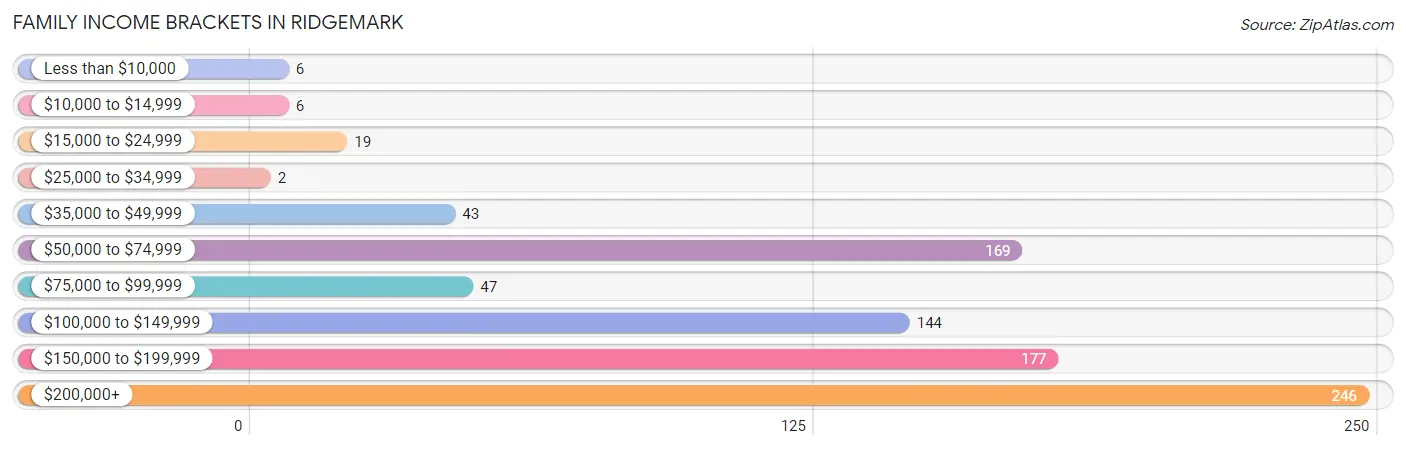
| Income Bracket | # Families | % Families |
| Less than $10,000 | 6 | 0.7% |
| $10,000 to $14,999 | 6 | 0.7% |
| $15,000 to $24,999 | 19 | 2.2% |
| $25,000 to $34,999 | 2 | 0.2% |
| $35,000 to $49,999 | 43 | 5.0% |
| $50,000 to $74,999 | 169 | 19.7% |
| $75,000 to $99,999 | 47 | 5.5% |
| $100,000 to $149,999 | 144 | 16.8% |
| $150,000 to $199,999 | 177 | 20.6% |
| $200,000+ | 246 | 28.6% |
Family Income by Famaliy Size in Ridgemark
6-person families (8 | 0.9%) account for the highest median family income in Ridgemark with $246,250 per family, while 3-person families (134 | 15.6%) have the highest median income of $57,932 per family member.
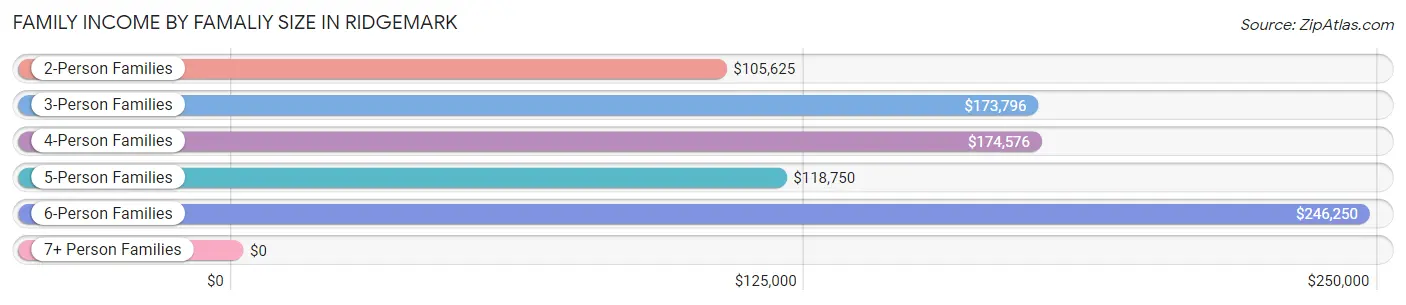
| Income Bracket | # Families | Median Income |
| 2-Person Families | 525 (61.1%) | $105,625 |
| 3-Person Families | 134 (15.6%) | $173,796 |
| 4-Person Families | 144 (16.8%) | $174,576 |
| 5-Person Families | 42 (4.9%) | $118,750 |
| 6-Person Families | 8 (0.9%) | $246,250 |
| 7+ Person Families | 6 (0.7%) | $0 |
| Total | 859 (100.0%) | $147,969 |
Family Income by Number of Earners in Ridgemark
The median family income in Ridgemark is $147,969, with families comprising 2 earners (177) having the highest median family income of $230,313, while families with no earners (179) have the lowest median family income of $62,336, accounting for 20.6% and 20.8% of families, respectively.
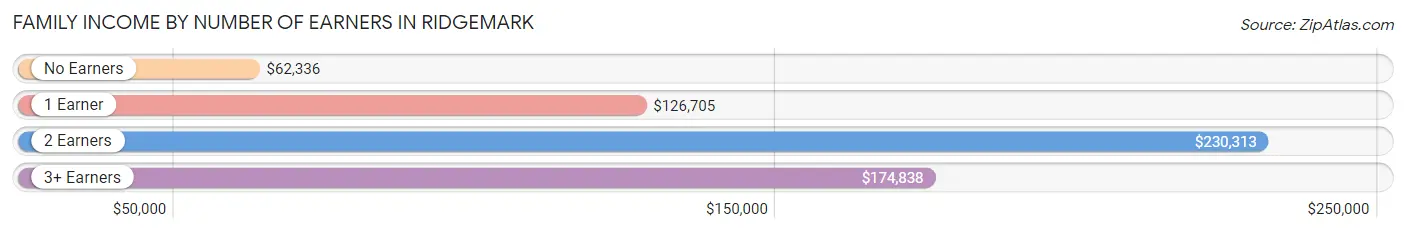
| Number of Earners | # Families | Median Income |
| No Earners | 179 (20.8%) | $62,336 |
| 1 Earner | 338 (39.4%) | $126,705 |
| 2 Earners | 177 (20.6%) | $230,313 |
| 3+ Earners | 165 (19.2%) | $174,838 |
| Total | 859 (100.0%) | $147,969 |
Household Income in Ridgemark
Household Income Brackets in Ridgemark
With 276 households falling in the category, the $200,000+ income range is the most frequent in Ridgemark, accounting for 23.4% of all households. In contrast, only 6 households (0.5%) fall into the $10,000 to $14,999 income bracket, making it the least populous group.
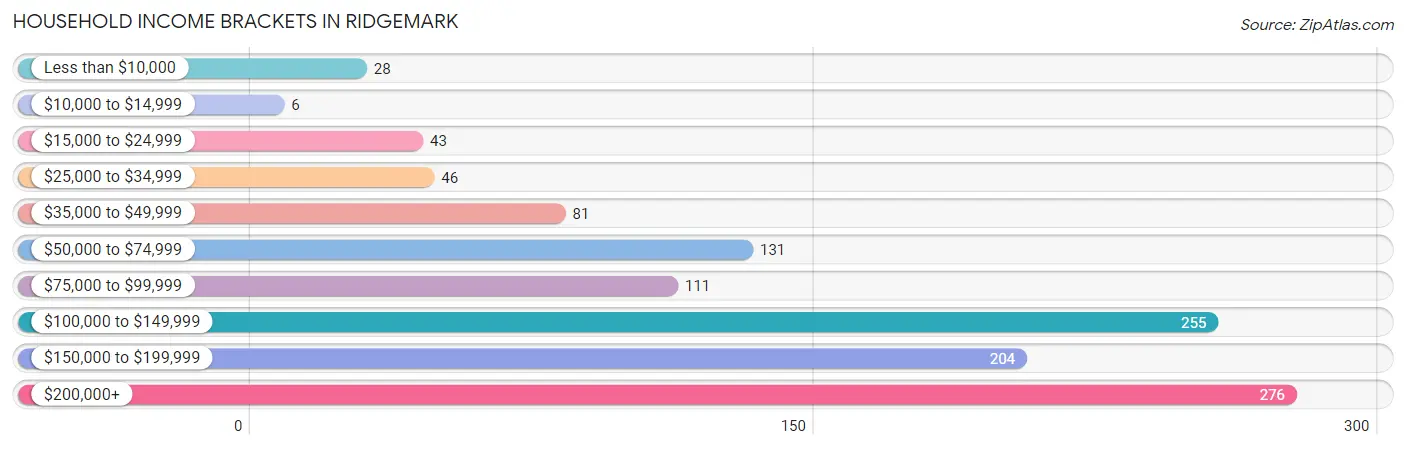
| Income Bracket | # Households | % Households |
| Less than $10,000 | 28 | 2.4% |
| $10,000 to $14,999 | 6 | 0.5% |
| $15,000 to $24,999 | 43 | 3.6% |
| $25,000 to $34,999 | 46 | 3.9% |
| $35,000 to $49,999 | 81 | 6.9% |
| $50,000 to $74,999 | 131 | 11.1% |
| $75,000 to $99,999 | 111 | 9.4% |
| $100,000 to $149,999 | 255 | 21.6% |
| $150,000 to $199,999 | 204 | 17.3% |
| $200,000+ | 276 | 23.4% |
Household Income by Householder Age in Ridgemark
The median household income in Ridgemark is $125,388, with the highest median household income of $172,942 found in the 45 to 64 years age bracket for the primary householder. A total of 511 households (43.3%) fall into this category. Meanwhile, the 15 to 24 years age bracket for the primary householder has the lowest median household income of $0, with 13 households (1.1%) in this group.
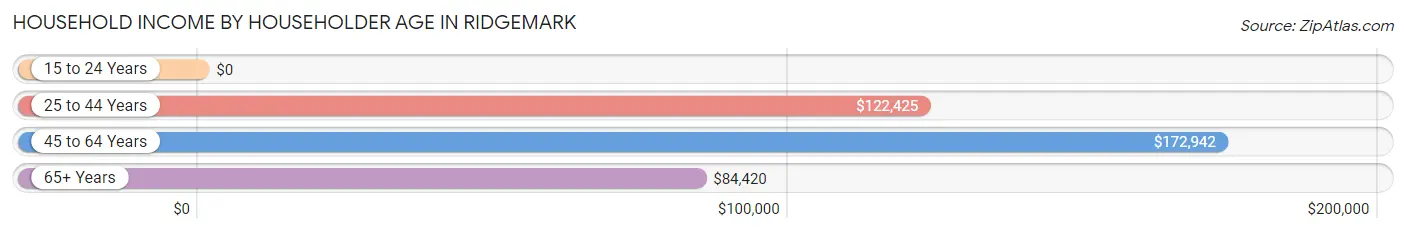
| Income Bracket | # Households | Median Income |
| 15 to 24 Years | 13 (1.1%) | $0 |
| 25 to 44 Years | 206 (17.4%) | $122,425 |
| 45 to 64 Years | 511 (43.3%) | $172,942 |
| 65+ Years | 451 (38.2%) | $84,420 |
| Total | 1,181 (100.0%) | $125,388 |
Poverty in Ridgemark
Income Below Poverty by Sex and Age in Ridgemark
With 2.9% poverty level for males and 5.1% for females among the residents of Ridgemark, 75 year old and over males and 12 to 14 year old females are the most vulnerable to poverty, with 24 males (12.1%) and 5 females (55.6%) in their respective age groups living below the poverty level.
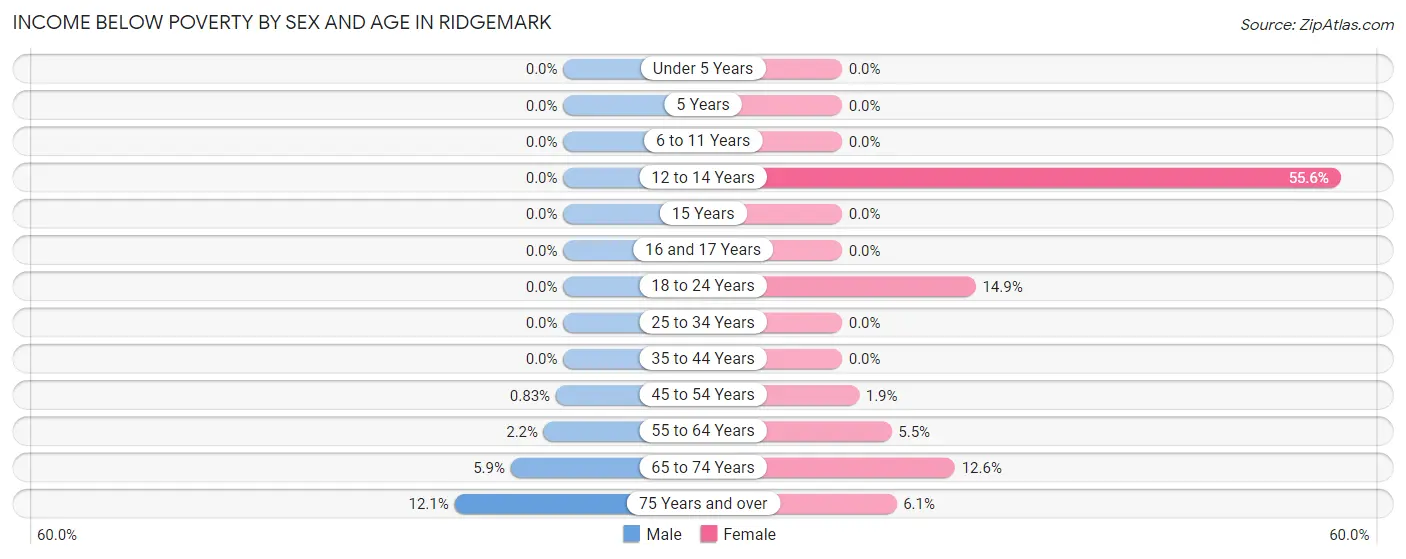
| Age Bracket | Male | Female |
| Under 5 Years | 0 (0.0%) | 0 (0.0%) |
| 5 Years | 0 (0.0%) | 0 (0.0%) |
| 6 to 11 Years | 0 (0.0%) | 0 (0.0%) |
| 12 to 14 Years | 0 (0.0%) | 5 (55.6%) |
| 15 Years | 0 (0.0%) | 0 (0.0%) |
| 16 and 17 Years | 0 (0.0%) | 0 (0.0%) |
| 18 to 24 Years | 0 (0.0%) | 28 (14.9%) |
| 25 to 34 Years | 0 (0.0%) | 0 (0.0%) |
| 35 to 44 Years | 0 (0.0%) | 0 (0.0%) |
| 45 to 54 Years | 2 (0.8%) | 5 (1.9%) |
| 55 to 64 Years | 6 (2.2%) | 8 (5.5%) |
| 65 to 74 Years | 10 (5.9%) | 20 (12.6%) |
| 75 Years and over | 24 (12.1%) | 12 (6.1%) |
| Total | 42 (2.9%) | 78 (5.1%) |
Income Above Poverty by Sex and Age in Ridgemark
According to the poverty statistics in Ridgemark, males aged under 5 years and females aged under 5 years are the age groups that are most secure financially, with 100.0% of males and 100.0% of females in these age groups living above the poverty line.
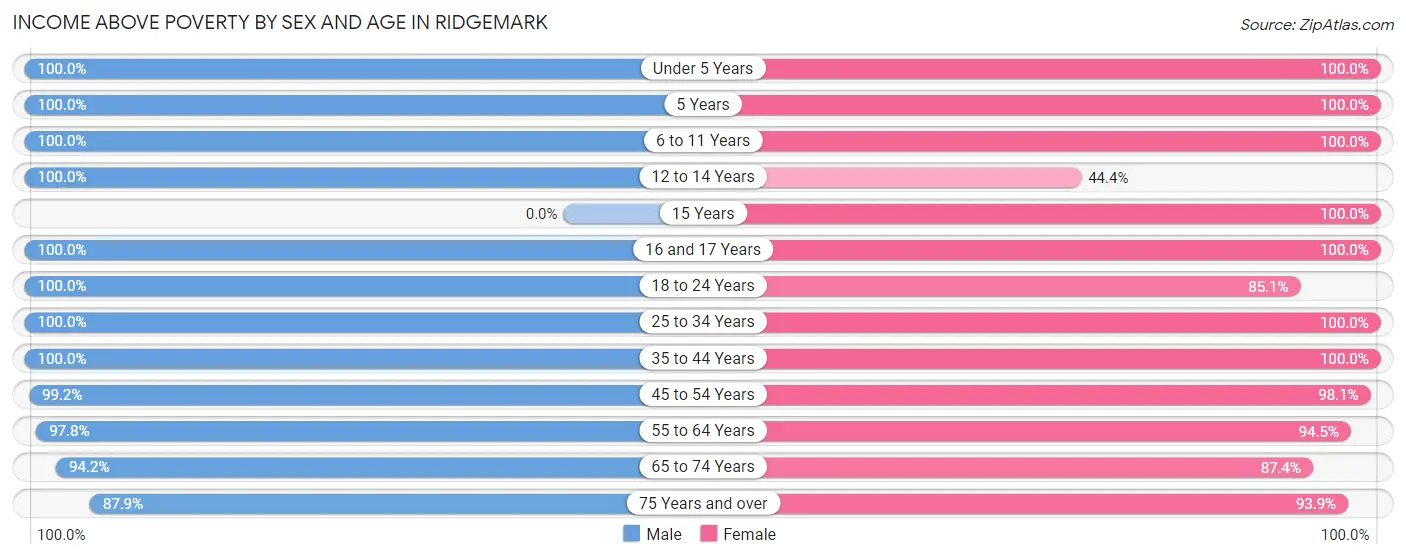
| Age Bracket | Male | Female |
| Under 5 Years | 30 (100.0%) | 64 (100.0%) |
| 5 Years | 16 (100.0%) | 61 (100.0%) |
| 6 to 11 Years | 91 (100.0%) | 61 (100.0%) |
| 12 to 14 Years | 61 (100.0%) | 4 (44.4%) |
| 15 Years | 0 (0.0%) | 20 (100.0%) |
| 16 and 17 Years | 47 (100.0%) | 106 (100.0%) |
| 18 to 24 Years | 78 (100.0%) | 160 (85.1%) |
| 25 to 34 Years | 156 (100.0%) | 165 (100.0%) |
| 35 to 44 Years | 111 (100.0%) | 106 (100.0%) |
| 45 to 54 Years | 239 (99.2%) | 259 (98.1%) |
| 55 to 64 Years | 270 (97.8%) | 137 (94.5%) |
| 65 to 74 Years | 161 (94.2%) | 139 (87.4%) |
| 75 Years and over | 174 (87.9%) | 186 (93.9%) |
| Total | 1,434 (97.2%) | 1,468 (95.0%) |
Income Below Poverty Among Married-Couple Families in Ridgemark
The poverty statistics for married-couple families in Ridgemark show that 3.3% or 23 of the total 695 families live below the poverty line. Families with no children have the highest poverty rate of 4.8%, comprising of 23 families. On the other hand, families with 1 or 2 children have the lowest poverty rate of 0.0%, which includes 0 families.
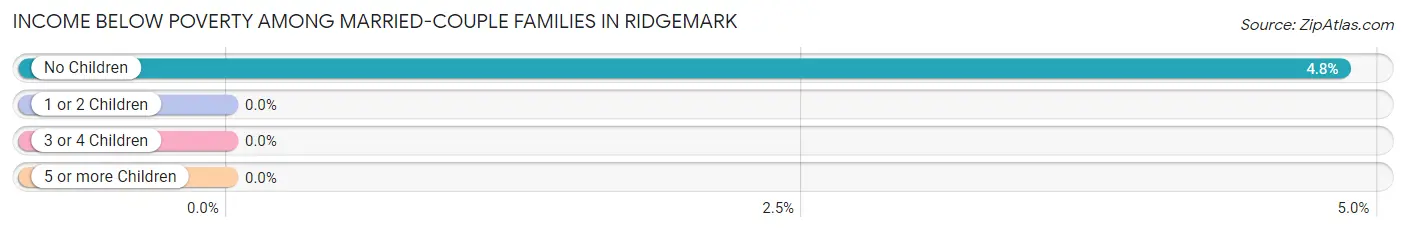
| Children | Above Poverty | Below Poverty |
| No Children | 452 (95.2%) | 23 (4.8%) |
| 1 or 2 Children | 186 (100.0%) | 0 (0.0%) |
| 3 or 4 Children | 34 (100.0%) | 0 (0.0%) |
| 5 or more Children | 0 (0.0%) | 0 (0.0%) |
| Total | 672 (96.7%) | 23 (3.3%) |
Income Below Poverty Among Single-Parent Households in Ridgemark
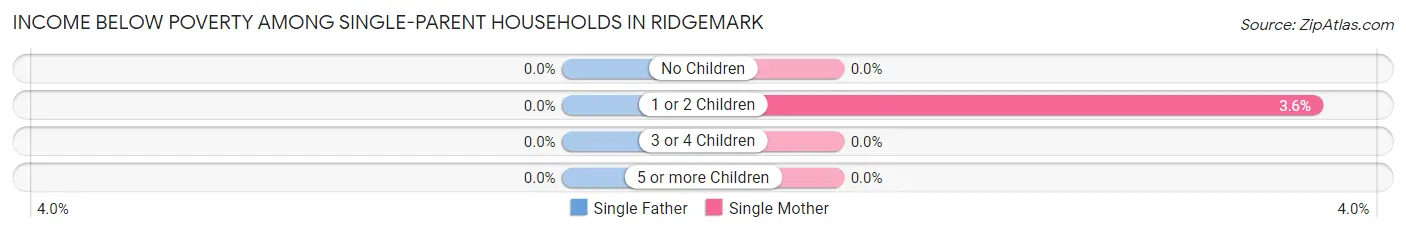
| Children | Single Father | Single Mother |
| No Children | 0 (0.0%) | 0 (0.0%) |
| 1 or 2 Children | 0 (0.0%) | 3 (3.6%) |
| 3 or 4 Children | 0 (0.0%) | 0 (0.0%) |
| 5 or more Children | 0 (0.0%) | 0 (0.0%) |
| Total | 0 (0.0%) | 3 (2.5%) |
Income Below Poverty Among Married-Couple vs Single-Parent Households in Ridgemark
The poverty data for Ridgemark shows that 23 of the married-couple family households (3.3%) and 3 of the single-parent households (1.8%) are living below the poverty level. Within the married-couple family households, those with no children have the highest poverty rate, with 23 households (4.8%) falling below the poverty line. Among the single-parent households, those with 1 or 2 children have the highest poverty rate, with 3 household (2.6%) living below poverty.
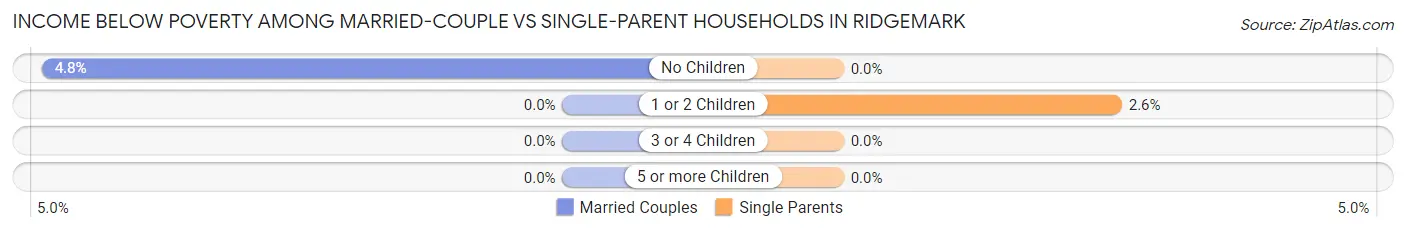
| Children | Married-Couple Families | Single-Parent Households |
| No Children | 23 (4.8%) | 0 (0.0%) |
| 1 or 2 Children | 0 (0.0%) | 3 (2.6%) |
| 3 or 4 Children | 0 (0.0%) | 0 (0.0%) |
| 5 or more Children | 0 (0.0%) | 0 (0.0%) |
| Total | 23 (3.3%) | 3 (1.8%) |
Race in Ridgemark
The most populous races in Ridgemark are White / Caucasian (2,338 | 77.4%), Hispanic or Latino (1,081 | 35.8%), and Two or more Races (495 | 16.4%).
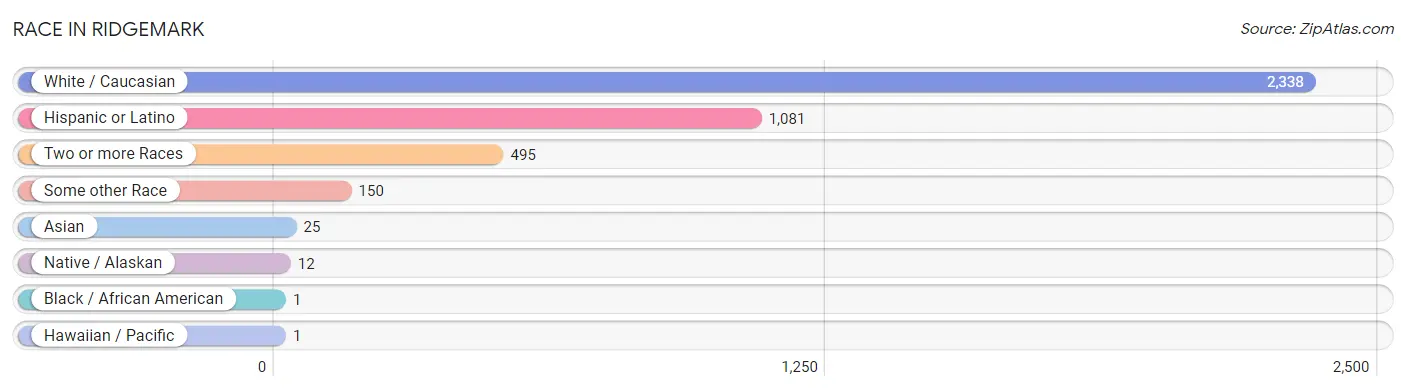
| Race | # Population | % Population |
| Asian | 25 | 0.8% |
| Black / African American | 1 | 0.0% |
| Hawaiian / Pacific | 1 | 0.0% |
| Hispanic or Latino | 1,081 | 35.8% |
| Native / Alaskan | 12 | 0.4% |
| White / Caucasian | 2,338 | 77.4% |
| Two or more Races | 495 | 16.4% |
| Some other Race | 150 | 5.0% |
| Total | 3,022 | 100.0% |
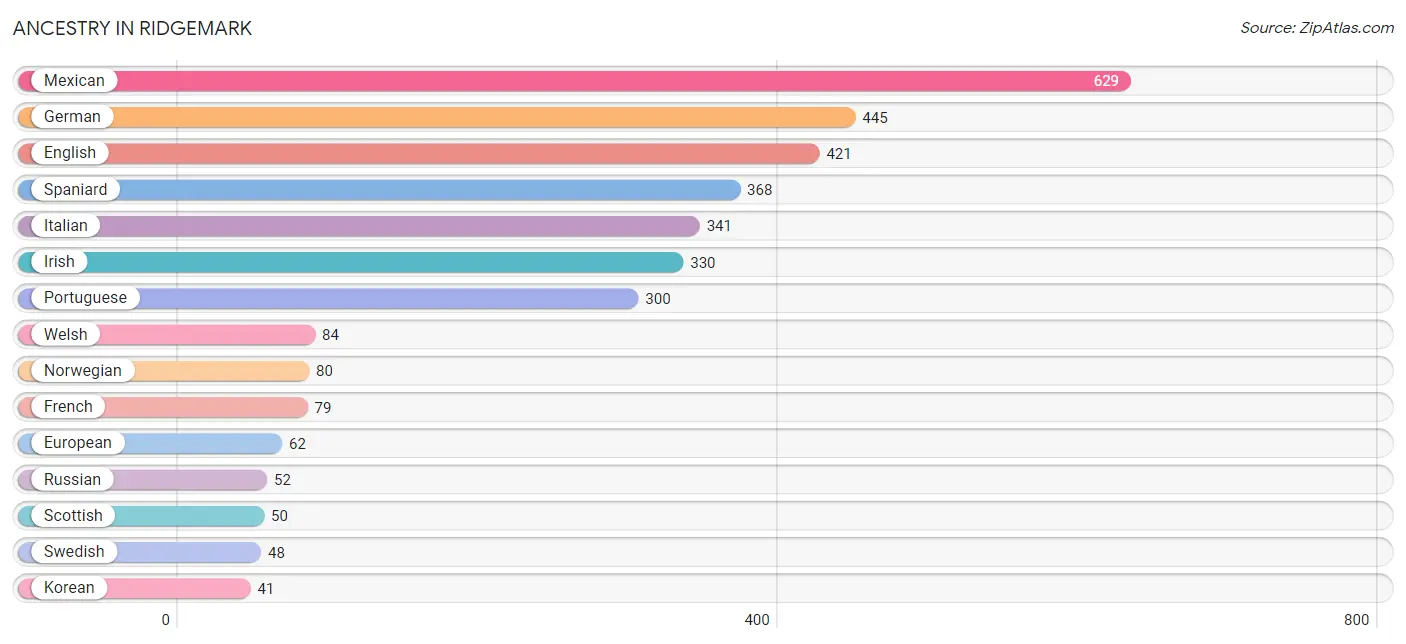
Ancestry in Ridgemark
The most populous ancestries reported in Ridgemark are Mexican (629 | 20.8%), German (445 | 14.7%), English (421 | 13.9%), Spaniard (368 | 12.2%), and Italian (341 | 11.3%), together accounting for 72.9% of all Ridgemark residents.
| Ancestry | # Population | % Population |
| African | 1 | 0.0% |
| American | 36 | 1.2% |
| Arab | 17 | 0.6% |
| Argentinean | 4 | 0.1% |
| Austrian | 4 | 0.1% |
| Bhutanese | 25 | 0.8% |
| British | 28 | 0.9% |
| Burmese | 23 | 0.8% |
| Central American | 28 | 0.9% |
| Central American Indian | 3 | 0.1% |
| Cherokee | 10 | 0.3% |
| Cuban | 3 | 0.1% |
| Czech | 9 | 0.3% |
| Danish | 17 | 0.6% |
| Dutch | 9 | 0.3% |
| English | 421 | 13.9% |
| European | 62 | 2.1% |
| French | 79 | 2.6% |
| French Canadian | 8 | 0.3% |
| German | 445 | 14.7% |
| Greek | 5 | 0.2% |
| Guatemalan | 16 | 0.5% |
| Indian (Asian) | 16 | 0.5% |
| Irish | 330 | 10.9% |
| Italian | 341 | 11.3% |
| Korean | 41 | 1.4% |
| Lebanese | 10 | 0.3% |
| Mexican | 629 | 20.8% |
| Native Hawaiian | 15 | 0.5% |
| Northern European | 27 | 0.9% |
| Norwegian | 80 | 2.6% |
| Panamanian | 7 | 0.2% |
| Peruvian | 3 | 0.1% |
| Polish | 32 | 1.1% |
| Portuguese | 300 | 9.9% |
| Puerto Rican | 17 | 0.6% |
| Russian | 52 | 1.7% |
| Salvadoran | 3 | 0.1% |
| Scandinavian | 31 | 1.0% |
| Scotch-Irish | 5 | 0.2% |
| Scottish | 50 | 1.7% |
| Sioux | 14 | 0.5% |
| Slovak | 18 | 0.6% |
| South American | 7 | 0.2% |
| Spaniard | 368 | 12.2% |
| Spanish | 12 | 0.4% |
| Sri Lankan | 8 | 0.3% |
| Subsaharan African | 1 | 0.0% |
| Swedish | 48 | 1.6% |
| Swiss | 28 | 0.9% |
| Thai | 6 | 0.2% |
| Ukrainian | 7 | 0.2% |
| Welsh | 84 | 2.8% |
| West Indian | 3 | 0.1% | View All 54 Rows |
Immigrants in Ridgemark
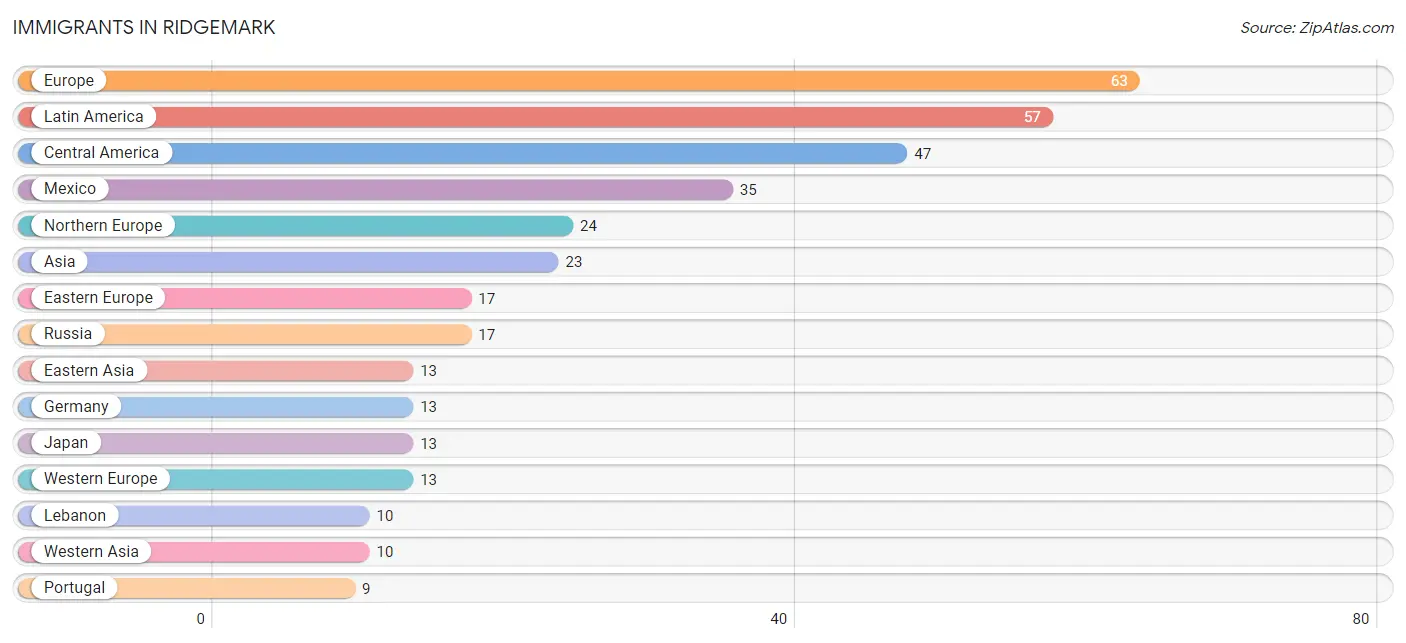
The most numerous immigrant groups reported in Ridgemark came from Europe (63 | 2.1%), Latin America (57 | 1.9%), Central America (47 | 1.6%), Mexico (35 | 1.2%), and Northern Europe (24 | 0.8%), together accounting for 7.5% of all Ridgemark residents.
| Immigration Origin | # Population | % Population |
| Argentina | 4 | 0.1% |
| Asia | 23 | 0.8% |
| Azores | 7 | 0.2% |
| Canada | 8 | 0.3% |
| Caribbean | 3 | 0.1% |
| Central America | 47 | 1.6% |
| Cuba | 3 | 0.1% |
| Eastern Asia | 13 | 0.4% |
| Eastern Europe | 17 | 0.6% |
| El Salvador | 3 | 0.1% |
| Europe | 63 | 2.1% |
| Germany | 13 | 0.4% |
| Guatemala | 2 | 0.1% |
| Ireland | 2 | 0.1% |
| Japan | 13 | 0.4% |
| Latin America | 57 | 1.9% |
| Lebanon | 10 | 0.3% |
| Mexico | 35 | 1.2% |
| Northern Europe | 24 | 0.8% |
| Panama | 7 | 0.2% |
| Peru | 3 | 0.1% |
| Portugal | 9 | 0.3% |
| Russia | 17 | 0.6% |
| South America | 7 | 0.2% |
| Southern Europe | 9 | 0.3% |
| Western Asia | 10 | 0.3% |
| Western Europe | 13 | 0.4% | View All 27 Rows |
Sex and Age in Ridgemark
Sex and Age in Ridgemark
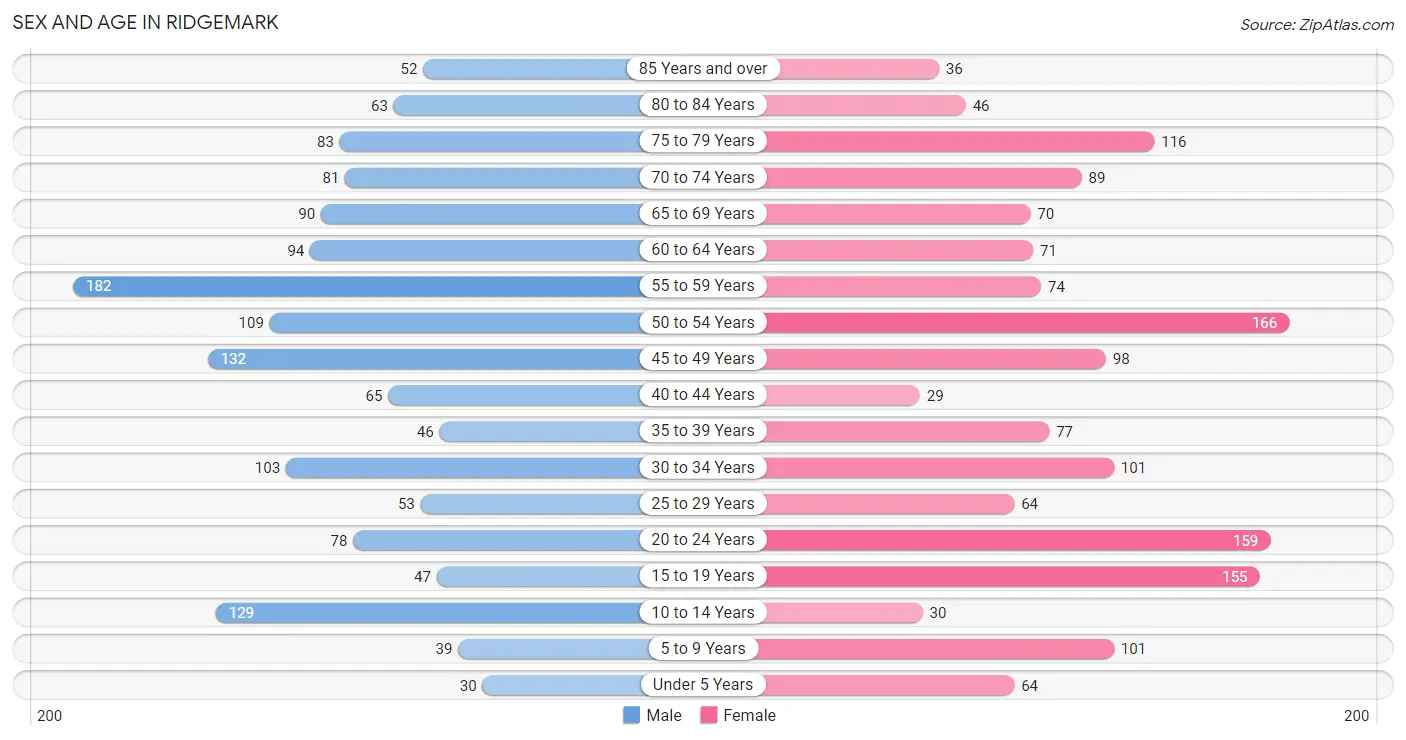
The most populous age groups in Ridgemark are 55 to 59 Years (182 | 12.3%) for men and 50 to 54 Years (166 | 10.7%) for women.
| Age Bracket | Male | Female |
| Under 5 Years | 30 (2.0%) | 64 (4.1%) |
| 5 to 9 Years | 39 (2.6%) | 101 (6.5%) |
| 10 to 14 Years | 129 (8.7%) | 30 (1.9%) |
| 15 to 19 Years | 47 (3.2%) | 155 (10.0%) |
| 20 to 24 Years | 78 (5.3%) | 159 (10.3%) |
| 25 to 29 Years | 53 (3.6%) | 64 (4.1%) |
| 30 to 34 Years | 103 (7.0%) | 101 (6.5%) |
| 35 to 39 Years | 46 (3.1%) | 77 (5.0%) |
| 40 to 44 Years | 65 (4.4%) | 29 (1.9%) |
| 45 to 49 Years | 132 (8.9%) | 98 (6.3%) |
| 50 to 54 Years | 109 (7.4%) | 166 (10.7%) |
| 55 to 59 Years | 182 (12.3%) | 74 (4.8%) |
| 60 to 64 Years | 94 (6.4%) | 71 (4.6%) |
| 65 to 69 Years | 90 (6.1%) | 70 (4.5%) |
| 70 to 74 Years | 81 (5.5%) | 89 (5.8%) |
| 75 to 79 Years | 83 (5.6%) | 116 (7.5%) |
| 80 to 84 Years | 63 (4.3%) | 46 (3.0%) |
| 85 Years and over | 52 (3.5%) | 36 (2.3%) |
| Total | 1,476 (100.0%) | 1,546 (100.0%) |
Families and Households in Ridgemark
Median Family Size in Ridgemark
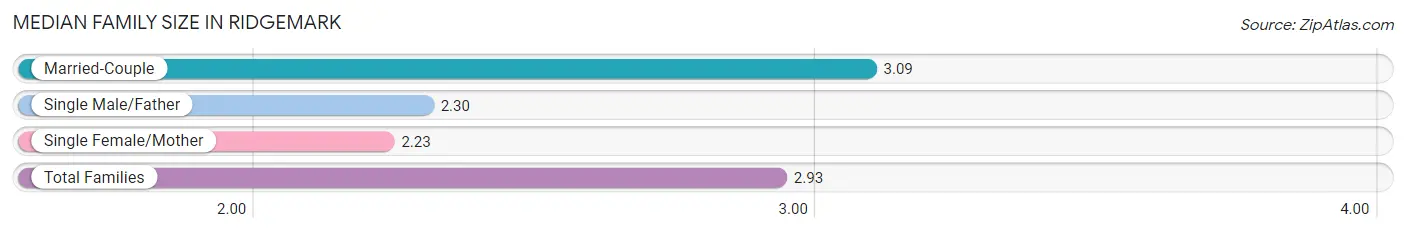
The median family size in Ridgemark is 2.93 persons per family, with married-couple families (695 | 80.9%) accounting for the largest median family size of 3.09 persons per family. On the other hand, single female/mother families (121 | 14.1%) represent the smallest median family size with 2.23 persons per family.
| Family Type | # Families | Family Size |
| Married-Couple | 695 (80.9%) | 3.09 |
| Single Male/Father | 43 (5.0%) | 2.30 |
| Single Female/Mother | 121 (14.1%) | 2.23 |
| Total Families | 859 (100.0%) | 2.93 |
Median Household Size in Ridgemark
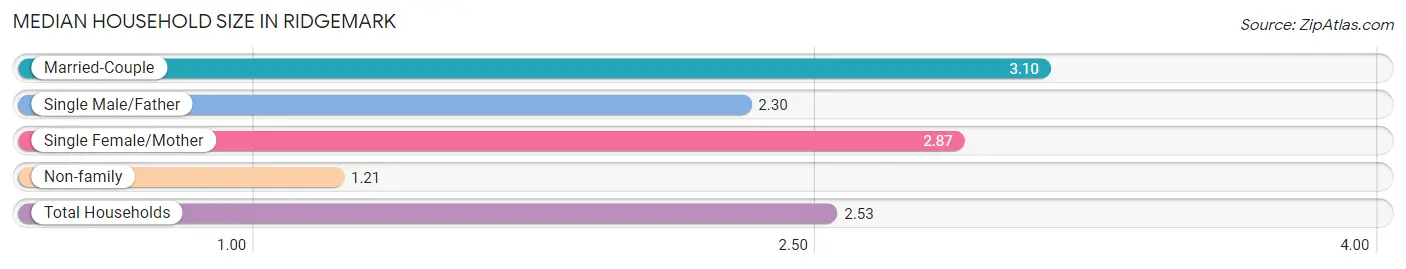
The median household size in Ridgemark is 2.53 persons per household, with married-couple households (695 | 58.9%) accounting for the largest median household size of 3.1 persons per household. non-family households (322 | 27.3%) represent the smallest median household size with 1.21 persons per household.
| Household Type | # Households | Household Size |
| Married-Couple | 695 (58.9%) | 3.10 |
| Single Male/Father | 43 (3.6%) | 2.30 |
| Single Female/Mother | 121 (10.2%) | 2.87 |
| Non-family | 322 (27.3%) | 1.21 |
| Total Households | 1,181 (100.0%) | 2.53 |
Household Size by Marriage Status in Ridgemark
Out of a total of 1,181 households in Ridgemark, 859 (72.7%) are family households, while 322 (27.3%) are nonfamily households. The most numerous type of family households are 2-person households, comprising 451, and the most common type of nonfamily households are 1-person households, comprising 274.
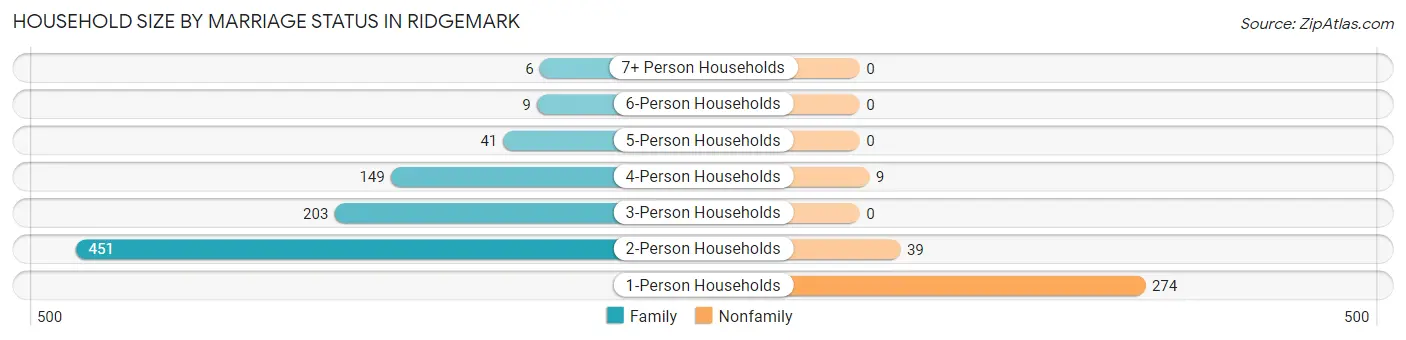
| Household Size | Family Households | Nonfamily Households |
| 1-Person Households | - | 274 (23.2%) |
| 2-Person Households | 451 (38.2%) | 39 (3.3%) |
| 3-Person Households | 203 (17.2%) | 0 (0.0%) |
| 4-Person Households | 149 (12.6%) | 9 (0.8%) |
| 5-Person Households | 41 (3.5%) | 0 (0.0%) |
| 6-Person Households | 9 (0.8%) | 0 (0.0%) |
| 7+ Person Households | 6 (0.5%) | 0 (0.0%) |
| Total | 859 (72.7%) | 322 (27.3%) |
Female Fertility in Ridgemark
Fertility by Age in Ridgemark
| Age Bracket | Women with Births | Births / 1,000 Women |
| 15 to 19 years | 0 (0.0%) | 0.0 |
| 20 to 34 years | 0 (0.0%) | 0.0 |
| 35 to 50 years | 0 (0.0%) | 0.0 |
| Total | 0 (0.0%) | 0.0 |
Fertility by Age by Marriage Status in Ridgemark
| Age Bracket | Married | Unmarried |
| 15 to 19 years | 0 (0.0%) | 0 (0.0%) |
| 20 to 34 years | 0 (0.0%) | 0 (0.0%) |
| 35 to 50 years | 0 (0.0%) | 0 (0.0%) |
| Total | 0 (0.0%) | 0 (0.0%) |
Fertility by Education in Ridgemark
| Educational Attainment | Women with Births | Births / 1,000 Women |
| Less than High School | 0 (0.0%) | 0.0 |
| High School Diploma | 0 (0.0%) | 0.0 |
| College or Associate's Degree | 0 (0.0%) | 0.0 |
| Bachelor's Degree | 0 (0.0%) | 0.0 |
| Graduate Degree | 0 (0.0%) | 0.0 |
| Total | 0 (0.0%) | 0.0 |
Fertility by Education by Marriage Status in Ridgemark
| Educational Attainment | Married | Unmarried |
| Less than High School | 0 (0.0%) | 0 (0.0%) |
| High School Diploma | 0 (0.0%) | 0 (0.0%) |
| College or Associate's Degree | 0 (0.0%) | 0 (0.0%) |
| Bachelor's Degree | 0 (0.0%) | 0 (0.0%) |
| Graduate Degree | 0 (0.0%) | 0 (0.0%) |
| Total | 0 (0.0%) | 0 (0.0%) |
Employment Characteristics in Ridgemark
Employment by Class of Employer in Ridgemark
Among the 1,406 employed individuals in Ridgemark, private company employees (850 | 60.5%), local government employees (217 | 15.4%), and self-employed (not incorporated) (111 | 7.9%) make up the most common classes of employment.
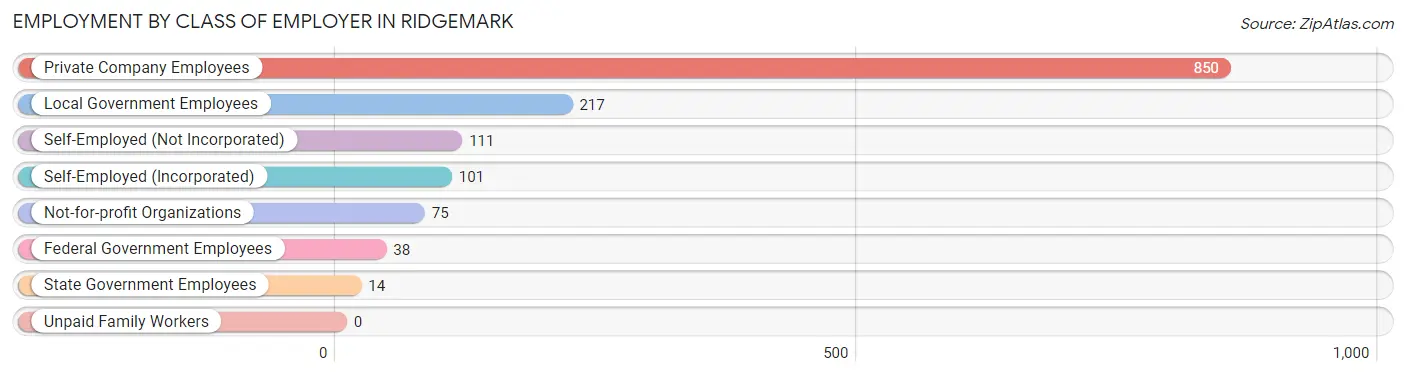
| Employer Class | # Employees | % Employees |
| Private Company Employees | 850 | 60.5% |
| Self-Employed (Incorporated) | 101 | 7.2% |
| Self-Employed (Not Incorporated) | 111 | 7.9% |
| Not-for-profit Organizations | 75 | 5.3% |
| Local Government Employees | 217 | 15.4% |
| State Government Employees | 14 | 1.0% |
| Federal Government Employees | 38 | 2.7% |
| Unpaid Family Workers | 0 | 0.0% |
| Total | 1,406 | 100.0% |
Employment Status by Age in Ridgemark
According to the labor force statistics for Ridgemark, out of the total population over 16 years of age (2,609), 59.4% or 1,550 individuals are in the labor force, with 7.6% or 118 of them unemployed. The age group with the highest labor force participation rate is 25 to 29 years, with 93.2% or 109 individuals in the labor force. Within the labor force, the 30 to 34 years age range has the highest percentage of unemployed individuals, with 35.9% or 66 of them being unemployed.
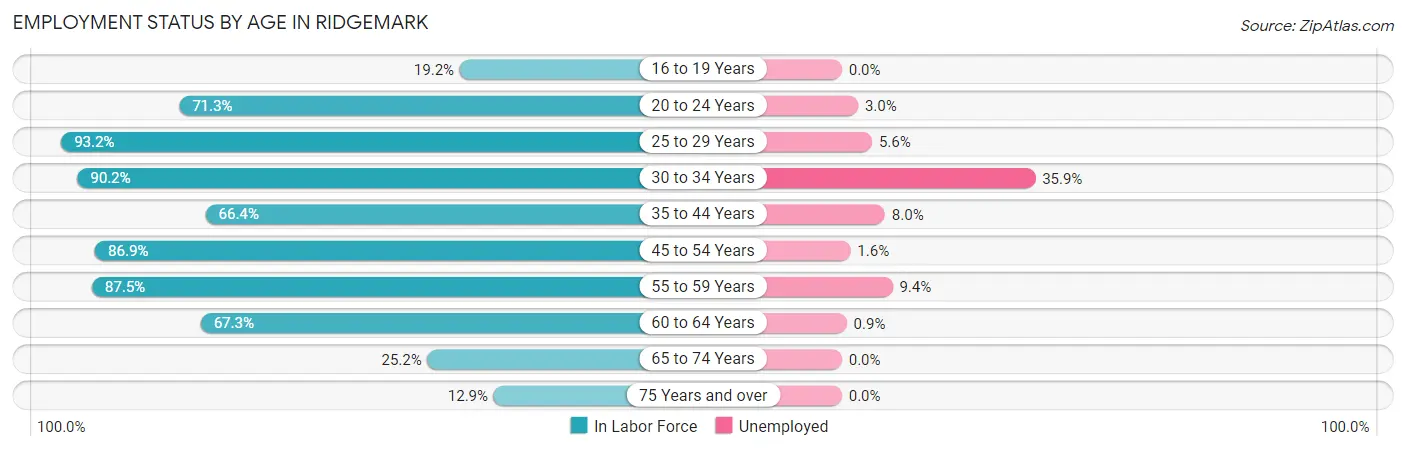
| Age Bracket | In Labor Force | Unemployed |
| 16 to 19 Years | 35 (19.2%) | 0 (0.0%) |
| 20 to 24 Years | 169 (71.3%) | 5 (3.0%) |
| 25 to 29 Years | 109 (93.2%) | 6 (5.6%) |
| 30 to 34 Years | 184 (90.2%) | 66 (35.9%) |
| 35 to 44 Years | 144 (66.4%) | 12 (8.0%) |
| 45 to 54 Years | 439 (86.9%) | 7 (1.6%) |
| 55 to 59 Years | 224 (87.5%) | 21 (9.4%) |
| 60 to 64 Years | 111 (67.3%) | 1 (0.9%) |
| 65 to 74 Years | 83 (25.2%) | 0 (0.0%) |
| 75 Years and over | 51 (12.9%) | 0 (0.0%) |
| Total | 1,550 (59.4%) | 118 (7.6%) |
Employment Status by Educational Attainment in Ridgemark
According to labor force statistics for Ridgemark, 82.7% of individuals (1,211) out of the total population between 25 and 64 years of age (1,464) are in the labor force, with 9.3% or 113 of them being unemployed. The group with the highest labor force participation rate are those with the educational attainment of bachelor's degree or higher, with 93.9% or 474 individuals in the labor force. Within the labor force, individuals with less than high school education have the highest percentage of unemployment, with 47.6% or 10 of them being unemployed.
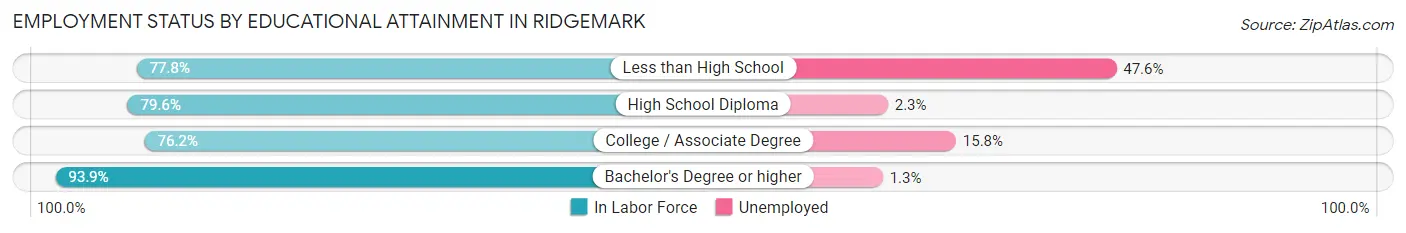
| Educational Attainment | In Labor Force | Unemployed |
| Less than High School | 21 (77.8%) | 13 (47.6%) |
| High School Diploma | 133 (79.6%) | 4 (2.3%) |
| College / Associate Degree | 583 (76.2%) | 121 (15.8%) |
| Bachelor's Degree or higher | 474 (93.9%) | 7 (1.3%) |
| Total | 1,211 (82.7%) | 136 (9.3%) |
Employment Occupations by Sex in Ridgemark
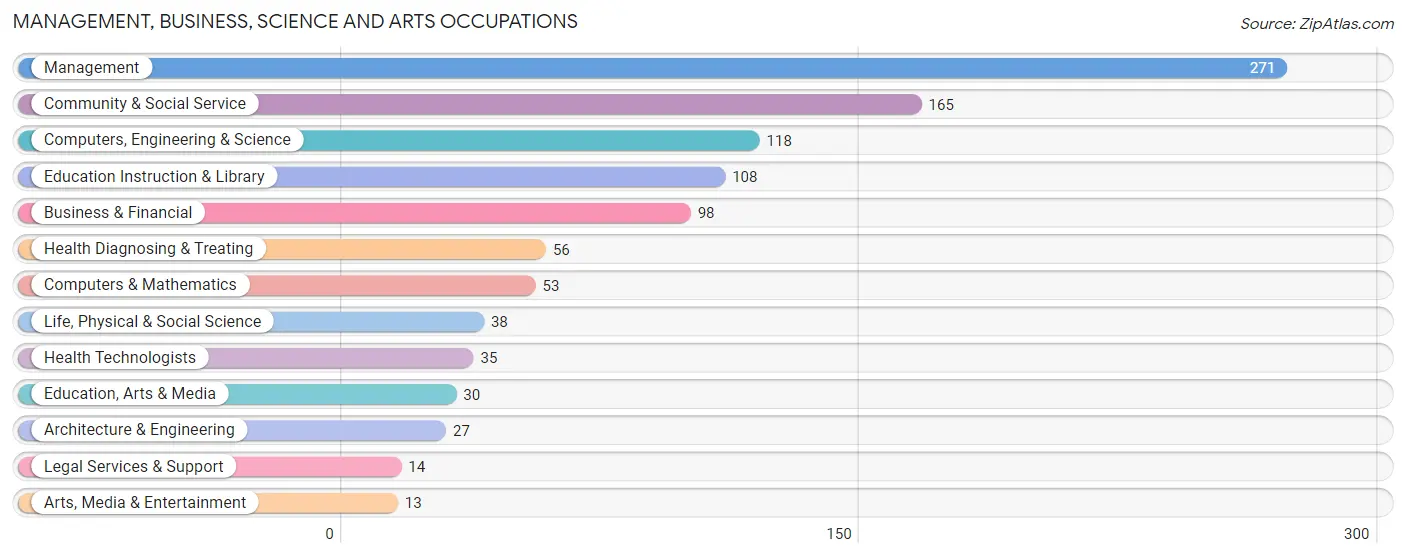
Management, Business, Science and Arts Occupations
The most common Management, Business, Science and Arts occupations in Ridgemark are Management (271 | 19.2%), Community & Social Service (165 | 11.7%), Computers, Engineering & Science (118 | 8.4%), Education Instruction & Library (108 | 7.6%), and Business & Financial (98 | 6.9%).
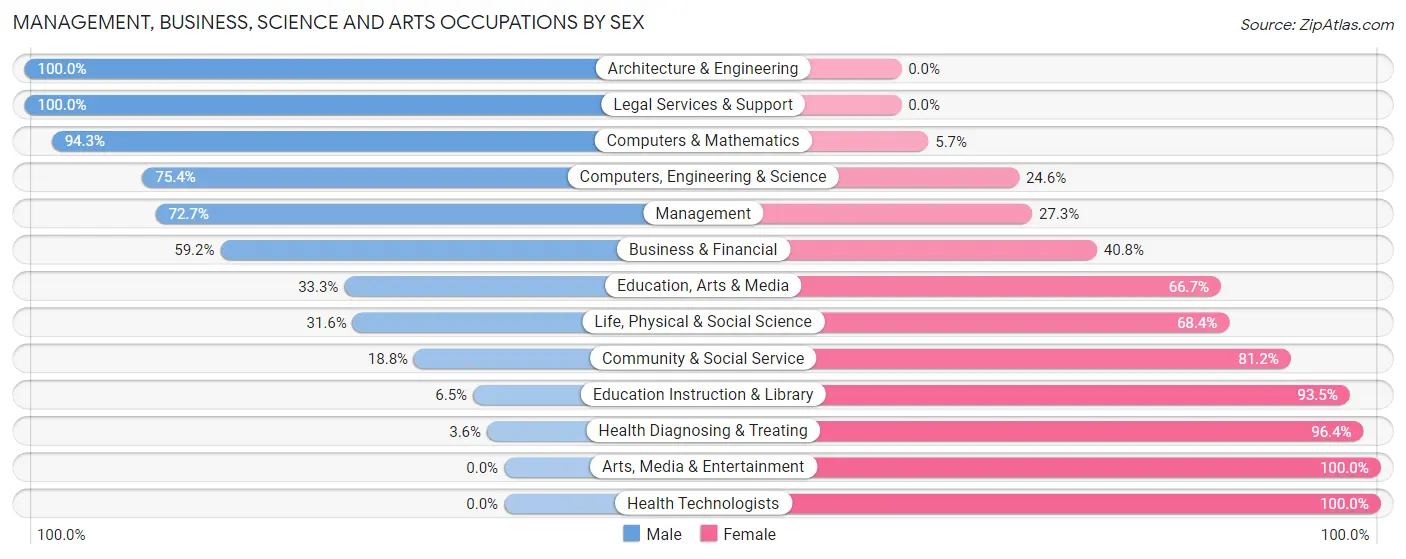
Management, Business, Science and Arts Occupations by Sex
Within the Management, Business, Science and Arts occupations in Ridgemark, the most male-oriented occupations are Architecture & Engineering (100.0%), Legal Services & Support (100.0%), and Computers & Mathematics (94.3%), while the most female-oriented occupations are Arts, Media & Entertainment (100.0%), Health Technologists (100.0%), and Health Diagnosing & Treating (96.4%).
| Occupation | Male | Female |
| Management | 197 (72.7%) | 74 (27.3%) |
| Business & Financial | 58 (59.2%) | 40 (40.8%) |
| Computers, Engineering & Science | 89 (75.4%) | 29 (24.6%) |
| Computers & Mathematics | 50 (94.3%) | 3 (5.7%) |
| Architecture & Engineering | 27 (100.0%) | 0 (0.0%) |
| Life, Physical & Social Science | 12 (31.6%) | 26 (68.4%) |
| Community & Social Service | 31 (18.8%) | 134 (81.2%) |
| Education, Arts & Media | 10 (33.3%) | 20 (66.7%) |
| Legal Services & Support | 14 (100.0%) | 0 (0.0%) |
| Education Instruction & Library | 7 (6.5%) | 101 (93.5%) |
| Arts, Media & Entertainment | 0 (0.0%) | 13 (100.0%) |
| Health Diagnosing & Treating | 2 (3.6%) | 54 (96.4%) |
| Health Technologists | 0 (0.0%) | 35 (100.0%) |
| Total (Category) | 377 (53.2%) | 331 (46.8%) |
| Total (Overall) | 709 (50.2%) | 703 (49.8%) |
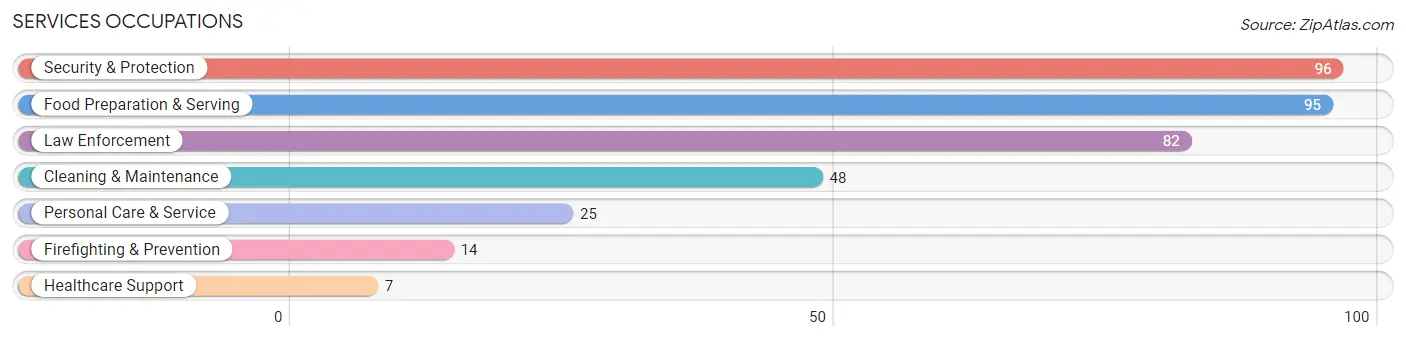
Services Occupations
The most common Services occupations in Ridgemark are Security & Protection (96 | 6.8%), Food Preparation & Serving (95 | 6.7%), Law Enforcement (82 | 5.8%), Cleaning & Maintenance (48 | 3.4%), and Personal Care & Service (25 | 1.8%).
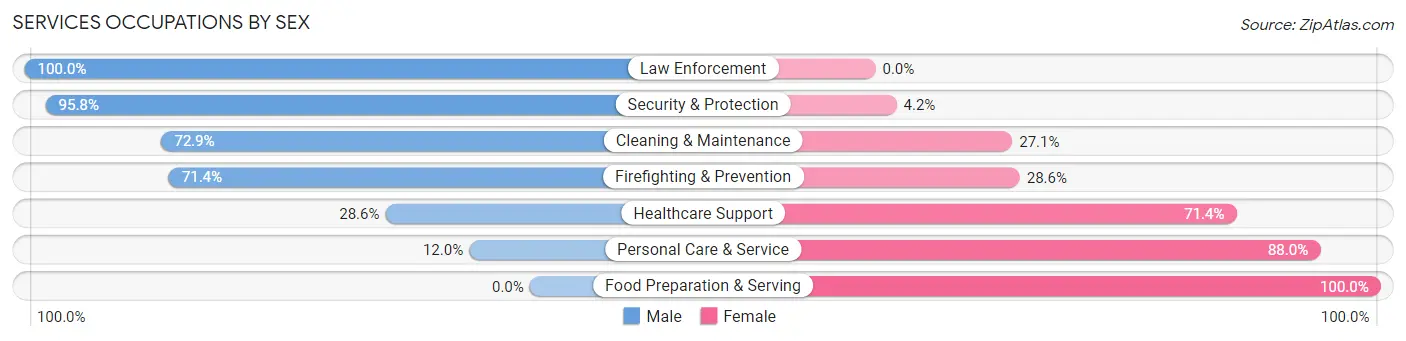
Services Occupations by Sex
Within the Services occupations in Ridgemark, the most male-oriented occupations are Law Enforcement (100.0%), Security & Protection (95.8%), and Cleaning & Maintenance (72.9%), while the most female-oriented occupations are Food Preparation & Serving (100.0%), Personal Care & Service (88.0%), and Healthcare Support (71.4%).
| Occupation | Male | Female |
| Healthcare Support | 2 (28.6%) | 5 (71.4%) |
| Security & Protection | 92 (95.8%) | 4 (4.2%) |
| Firefighting & Prevention | 10 (71.4%) | 4 (28.6%) |
| Law Enforcement | 82 (100.0%) | 0 (0.0%) |
| Food Preparation & Serving | 0 (0.0%) | 95 (100.0%) |
| Cleaning & Maintenance | 35 (72.9%) | 13 (27.1%) |
| Personal Care & Service | 3 (12.0%) | 22 (88.0%) |
| Total (Category) | 132 (48.7%) | 139 (51.3%) |
| Total (Overall) | 709 (50.2%) | 703 (49.8%) |
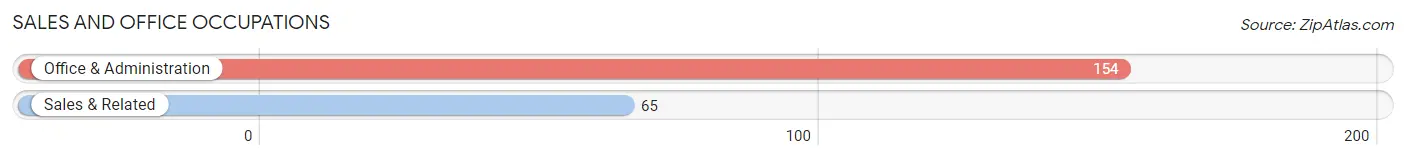
Sales and Office Occupations
The most common Sales and Office occupations in Ridgemark are Office & Administration (154 | 10.9%), and Sales & Related (65 | 4.6%).
Sales and Office Occupations by Sex
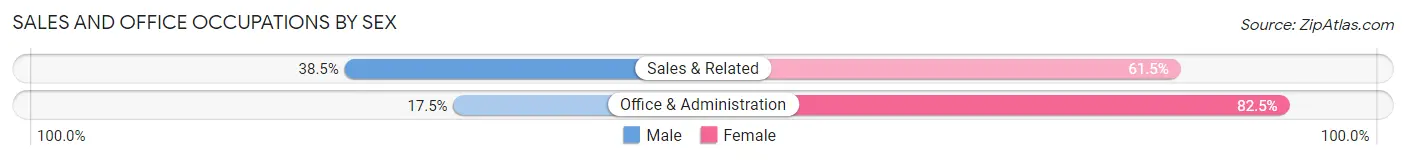
| Occupation | Male | Female |
| Sales & Related | 25 (38.5%) | 40 (61.5%) |
| Office & Administration | 27 (17.5%) | 127 (82.5%) |
| Total (Category) | 52 (23.7%) | 167 (76.3%) |
| Total (Overall) | 709 (50.2%) | 703 (49.8%) |
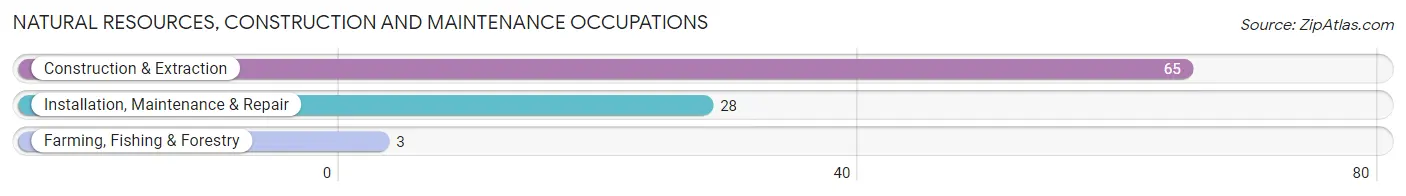
Natural Resources, Construction and Maintenance Occupations
The most common Natural Resources, Construction and Maintenance occupations in Ridgemark are Construction & Extraction (65 | 4.6%), Installation, Maintenance & Repair (28 | 2.0%), and Farming, Fishing & Forestry (3 | 0.2%).
Natural Resources, Construction and Maintenance Occupations by Sex
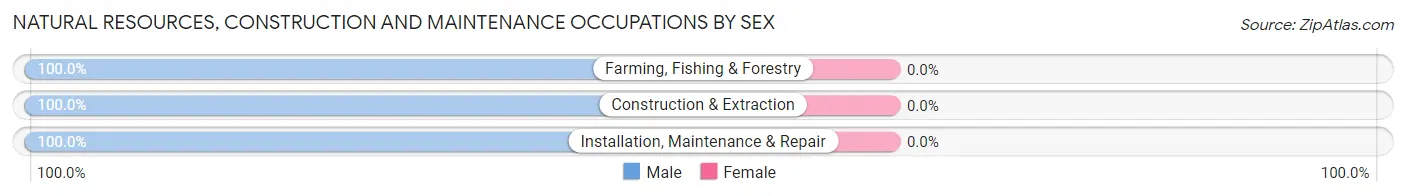
| Occupation | Male | Female |
| Farming, Fishing & Forestry | 3 (100.0%) | 0 (0.0%) |
| Construction & Extraction | 65 (100.0%) | 0 (0.0%) |
| Installation, Maintenance & Repair | 28 (100.0%) | 0 (0.0%) |
| Total (Category) | 96 (100.0%) | 0 (0.0%) |
| Total (Overall) | 709 (50.2%) | 703 (49.8%) |
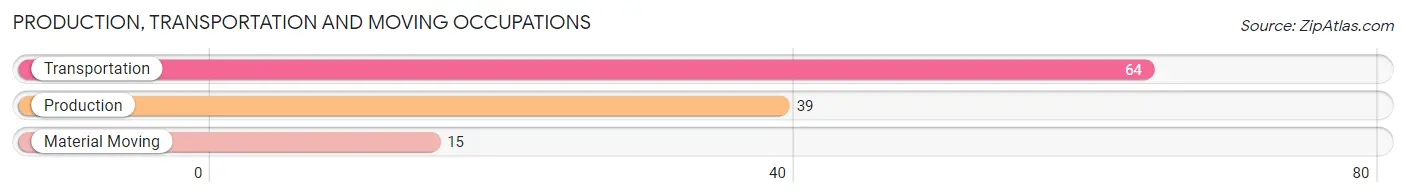
Production, Transportation and Moving Occupations
The most common Production, Transportation and Moving occupations in Ridgemark are Transportation (64 | 4.5%), Production (39 | 2.8%), and Material Moving (15 | 1.1%).
Production, Transportation and Moving Occupations by Sex
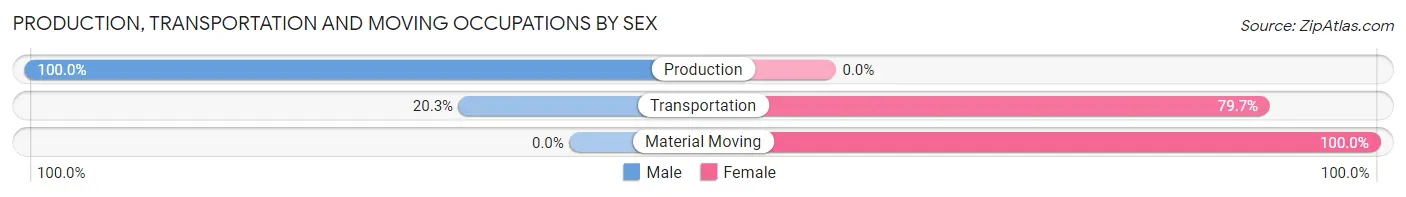
| Occupation | Male | Female |
| Production | 39 (100.0%) | 0 (0.0%) |
| Transportation | 13 (20.3%) | 51 (79.7%) |
| Material Moving | 0 (0.0%) | 15 (100.0%) |
| Total (Category) | 52 (44.1%) | 66 (55.9%) |
| Total (Overall) | 709 (50.2%) | 703 (49.8%) |
Employment Industries by Sex in Ridgemark
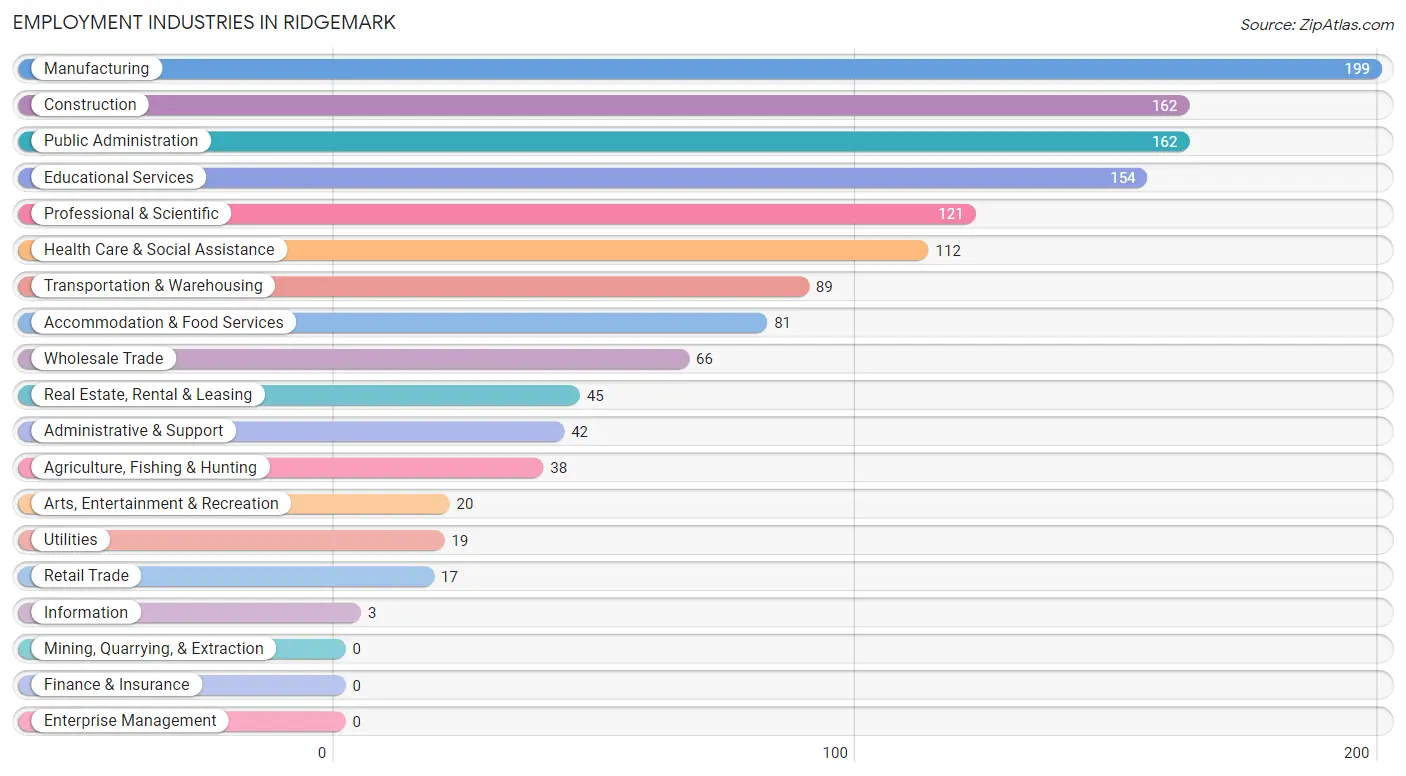
Employment Industries in Ridgemark
The major employment industries in Ridgemark include Manufacturing (199 | 14.1%), Construction (162 | 11.5%), Public Administration (162 | 11.5%), Educational Services (154 | 10.9%), and Professional & Scientific (121 | 8.6%).
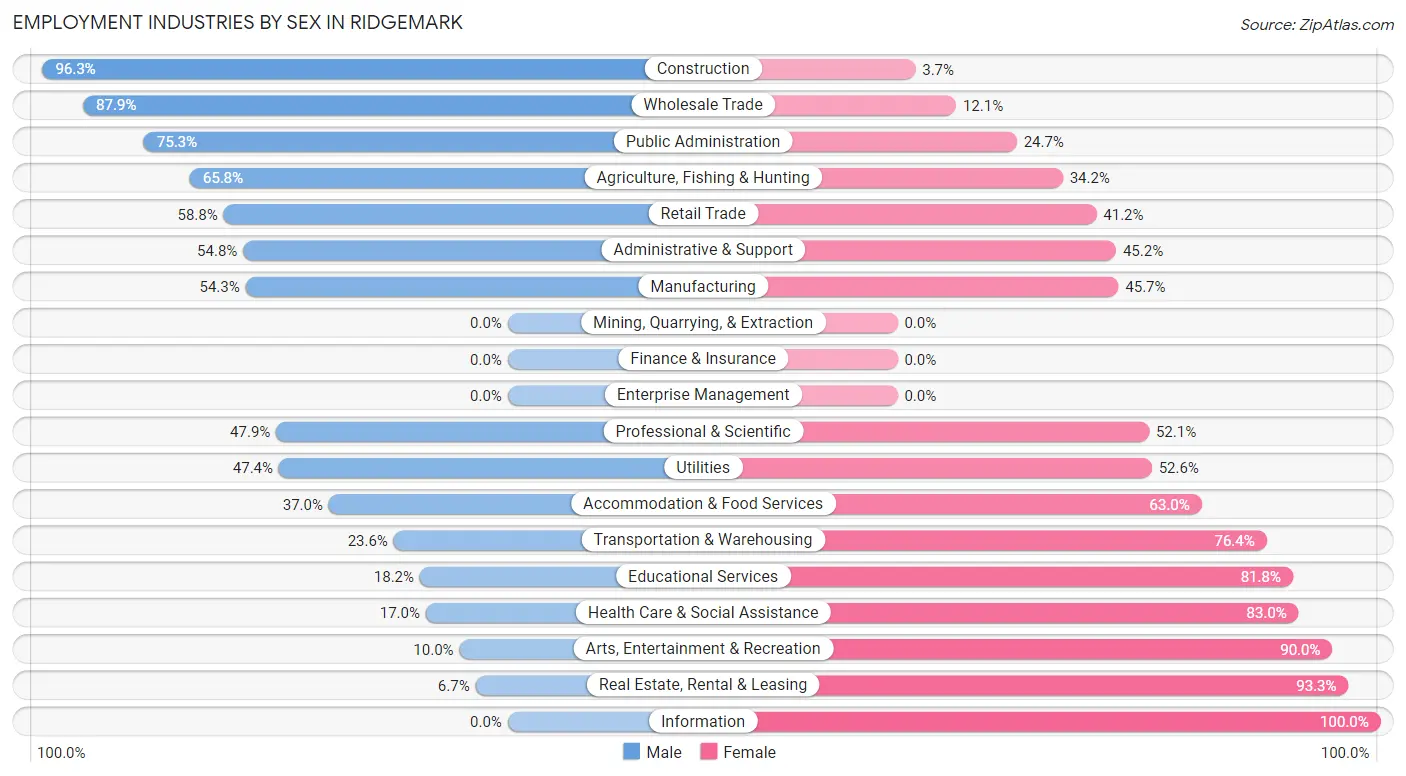
Employment Industries by Sex in Ridgemark
The Ridgemark industries that see more men than women are Construction (96.3%), Wholesale Trade (87.9%), and Public Administration (75.3%), whereas the industries that tend to have a higher number of women are Information (100.0%), Real Estate, Rental & Leasing (93.3%), and Arts, Entertainment & Recreation (90.0%).
| Industry | Male | Female |
| Agriculture, Fishing & Hunting | 25 (65.8%) | 13 (34.2%) |
| Mining, Quarrying, & Extraction | 0 (0.0%) | 0 (0.0%) |
| Construction | 156 (96.3%) | 6 (3.7%) |
| Manufacturing | 108 (54.3%) | 91 (45.7%) |
| Wholesale Trade | 58 (87.9%) | 8 (12.1%) |
| Retail Trade | 10 (58.8%) | 7 (41.2%) |
| Transportation & Warehousing | 21 (23.6%) | 68 (76.4%) |
| Utilities | 9 (47.4%) | 10 (52.6%) |
| Information | 0 (0.0%) | 3 (100.0%) |
| Finance & Insurance | 0 (0.0%) | 0 (0.0%) |
| Real Estate, Rental & Leasing | 3 (6.7%) | 42 (93.3%) |
| Professional & Scientific | 58 (47.9%) | 63 (52.1%) |
| Enterprise Management | 0 (0.0%) | 0 (0.0%) |
| Administrative & Support | 23 (54.8%) | 19 (45.2%) |
| Educational Services | 28 (18.2%) | 126 (81.8%) |
| Health Care & Social Assistance | 19 (17.0%) | 93 (83.0%) |
| Arts, Entertainment & Recreation | 2 (10.0%) | 18 (90.0%) |
| Accommodation & Food Services | 30 (37.0%) | 51 (63.0%) |
| Public Administration | 122 (75.3%) | 40 (24.7%) |
| Total | 709 (50.2%) | 703 (49.8%) |
Education in Ridgemark
School Enrollment in Ridgemark
The most common levels of schooling among the 643 students in Ridgemark are high school (196 | 30.5%), college / undergraduate (160 | 24.9%), and middle school (134 | 20.8%).
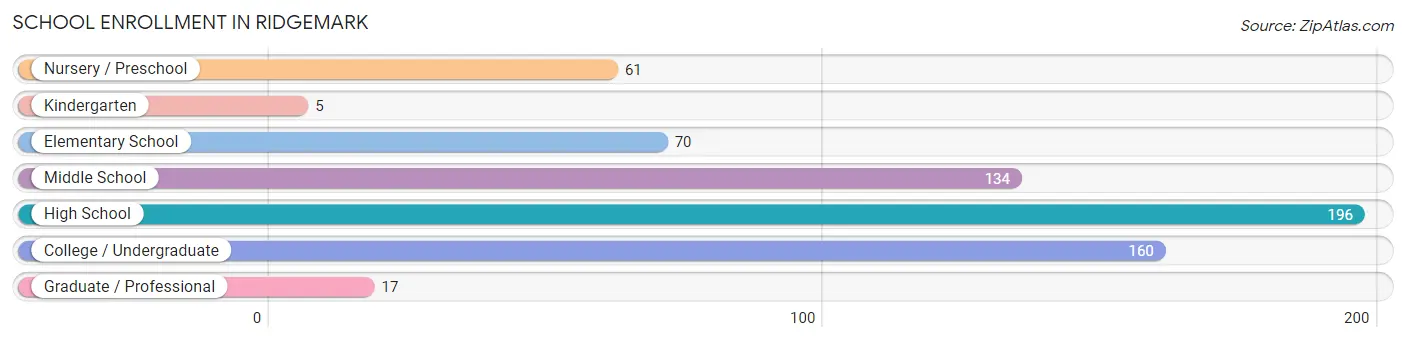
| School Level | # Students | % Students |
| Nursery / Preschool | 61 | 9.5% |
| Kindergarten | 5 | 0.8% |
| Elementary School | 70 | 10.9% |
| Middle School | 134 | 20.8% |
| High School | 196 | 30.5% |
| College / Undergraduate | 160 | 24.9% |
| Graduate / Professional | 17 | 2.6% |
| Total | 643 | 100.0% |
School Enrollment by Age by Funding Source in Ridgemark
Out of a total of 643 students who are enrolled in schools in Ridgemark, 130 (20.2%) attend a private institution, while the remaining 513 (79.8%) are enrolled in public schools. The age group of 5 to 9 year old has the highest likelihood of being enrolled in private schools, with 67 (54.0% in the age bracket) enrolled. Conversely, the age group of 15 to 17 year olds has the lowest likelihood of being enrolled in a private school, with 173 (100.0% in the age bracket) attending a public institution.
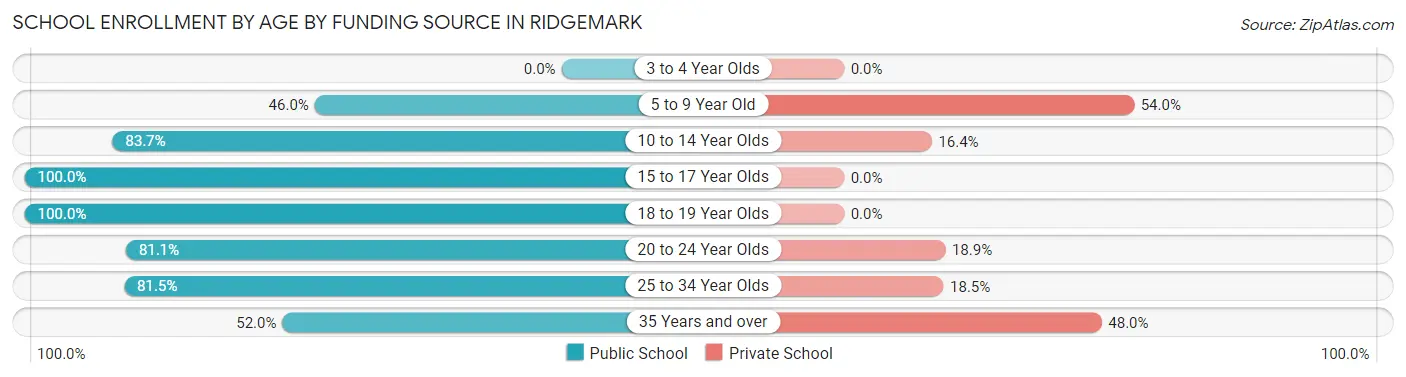
| Age Bracket | Public School | Private School |
| 3 to 4 Year Olds | 0 (0.0%) | 0 (0.0%) |
| 5 to 9 Year Old | 57 (46.0%) | 67 (54.0%) |
| 10 to 14 Year Olds | 133 (83.7%) | 26 (16.4%) |
| 15 to 17 Year Olds | 173 (100.0%) | 0 (0.0%) |
| 18 to 19 Year Olds | 29 (100.0%) | 0 (0.0%) |
| 20 to 24 Year Olds | 86 (81.1%) | 20 (18.9%) |
| 25 to 34 Year Olds | 22 (81.5%) | 5 (18.5%) |
| 35 Years and over | 13 (52.0%) | 12 (48.0%) |
| Total | 513 (79.8%) | 130 (20.2%) |
Educational Attainment by Field of Study in Ridgemark
Business (171 | 20.2%), bio, nature & agricultural (107 | 12.7%), liberal arts & history (97 | 11.5%), arts & humanities (83 | 9.8%), and engineering (58 | 6.9%) are the most common fields of study among 846 individuals in Ridgemark who have obtained a bachelor's degree or higher.
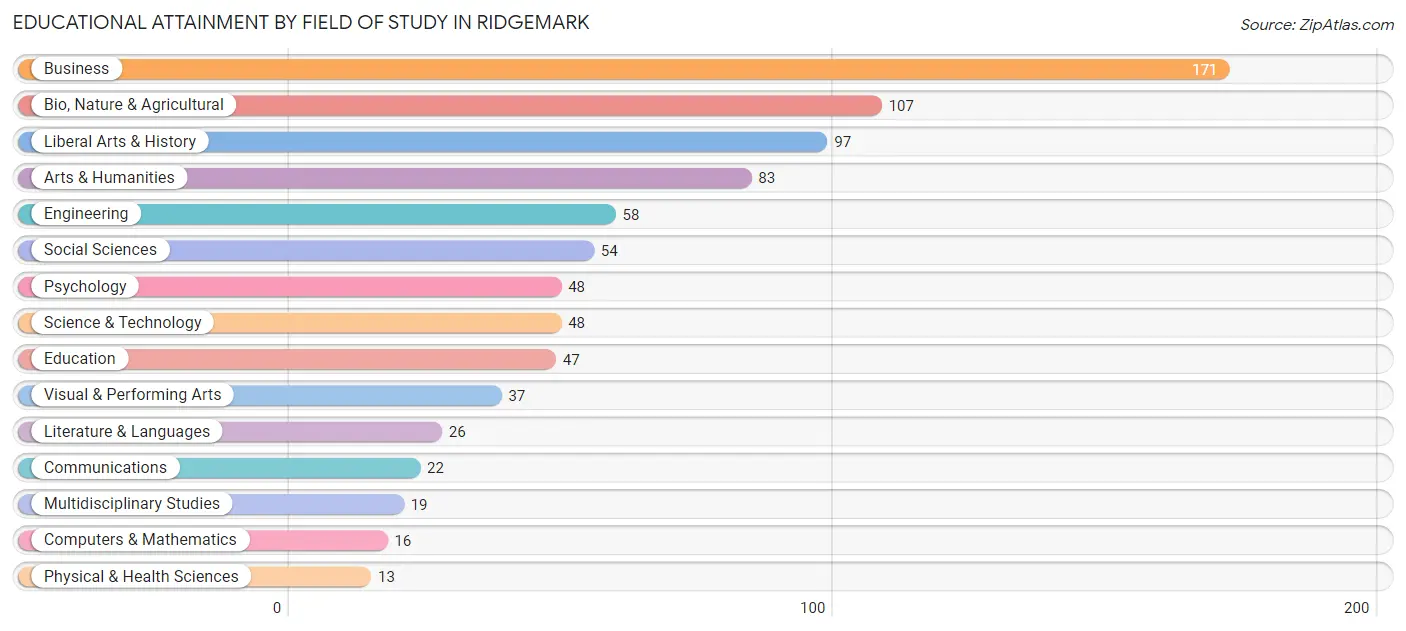
| Field of Study | # Graduates | % Graduates |
| Computers & Mathematics | 16 | 1.9% |
| Bio, Nature & Agricultural | 107 | 12.7% |
| Physical & Health Sciences | 13 | 1.5% |
| Psychology | 48 | 5.7% |
| Social Sciences | 54 | 6.4% |
| Engineering | 58 | 6.9% |
| Multidisciplinary Studies | 19 | 2.2% |
| Science & Technology | 48 | 5.7% |
| Business | 171 | 20.2% |
| Education | 47 | 5.6% |
| Literature & Languages | 26 | 3.1% |
| Liberal Arts & History | 97 | 11.5% |
| Visual & Performing Arts | 37 | 4.4% |
| Communications | 22 | 2.6% |
| Arts & Humanities | 83 | 9.8% |
| Total | 846 | 100.0% |
Transportation & Commute in Ridgemark
Vehicle Availability by Sex in Ridgemark
The most prevalent vehicle ownership categories in Ridgemark are males with 2 vehicles (233, accounting for 33.1%) and females with 2 vehicles (354, making up 33.5%).
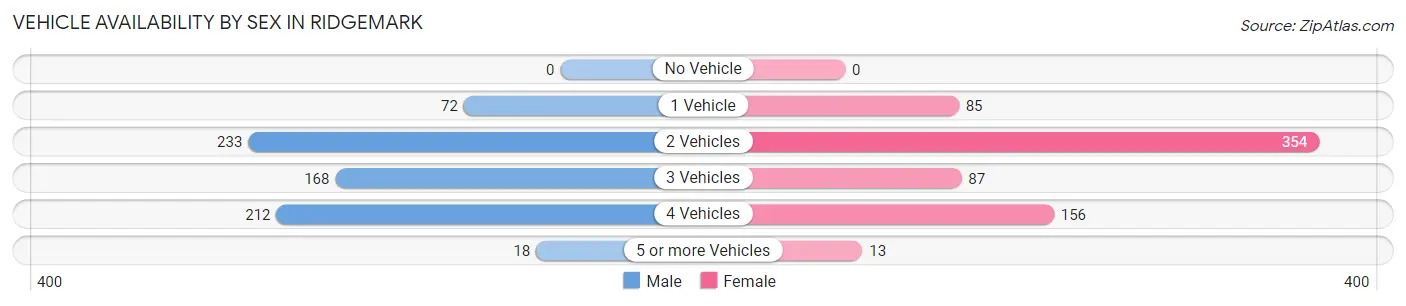
| Vehicles Available | Male | Female |
| No Vehicle | 0 (0.0%) | 0 (0.0%) |
| 1 Vehicle | 72 (10.2%) | 85 (12.2%) |
| 2 Vehicles | 233 (33.1%) | 354 (50.9%) |
| 3 Vehicles | 168 (23.9%) | 87 (12.5%) |
| 4 Vehicles | 212 (30.2%) | 156 (22.5%) |
| 5 or more Vehicles | 18 (2.6%) | 13 (1.9%) |
| Total | 703 (100.0%) | 695 (100.0%) |
Commute Time in Ridgemark
The most frequently occuring commute durations in Ridgemark are 60 to 89 minutes (308 commuters, 26.5%), 15 to 19 minutes (161 commuters, 13.9%), and 45 to 59 minutes (150 commuters, 12.9%).
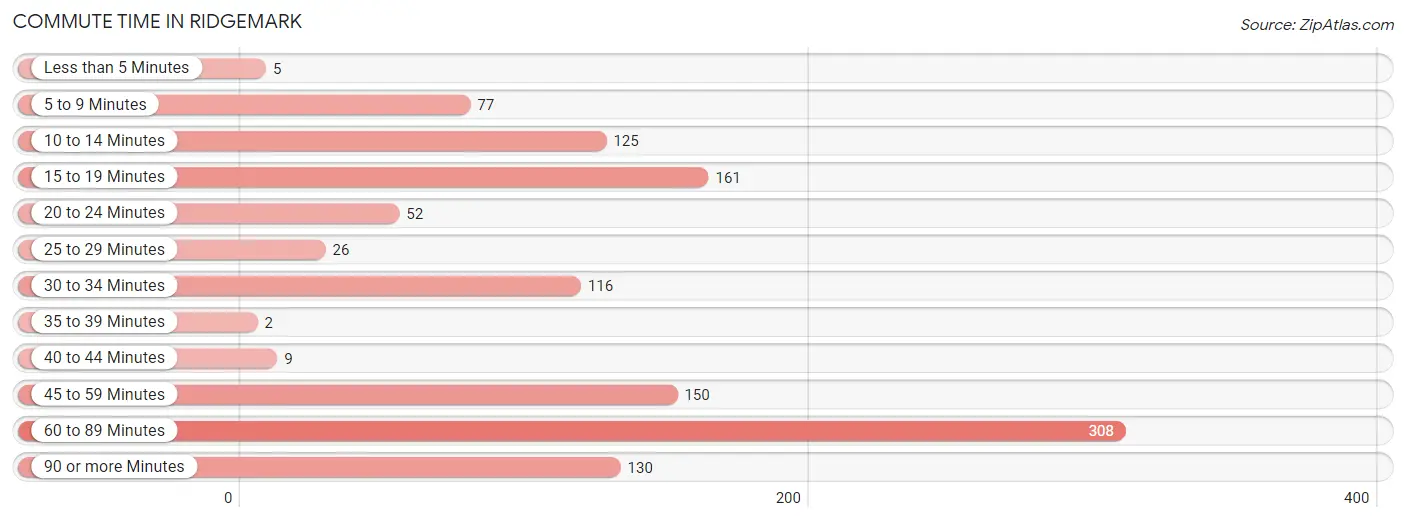
| Commute Time | # Commuters | % Commuters |
| Less than 5 Minutes | 5 | 0.4% |
| 5 to 9 Minutes | 77 | 6.6% |
| 10 to 14 Minutes | 125 | 10.8% |
| 15 to 19 Minutes | 161 | 13.9% |
| 20 to 24 Minutes | 52 | 4.5% |
| 25 to 29 Minutes | 26 | 2.2% |
| 30 to 34 Minutes | 116 | 10.0% |
| 35 to 39 Minutes | 2 | 0.2% |
| 40 to 44 Minutes | 9 | 0.8% |
| 45 to 59 Minutes | 150 | 12.9% |
| 60 to 89 Minutes | 308 | 26.5% |
| 90 or more Minutes | 130 | 11.2% |
Commute Time by Sex in Ridgemark
The most common commute times in Ridgemark are 60 to 89 minutes (206 commuters, 35.3%) for males and 15 to 19 minutes (145 commuters, 25.1%) for females.
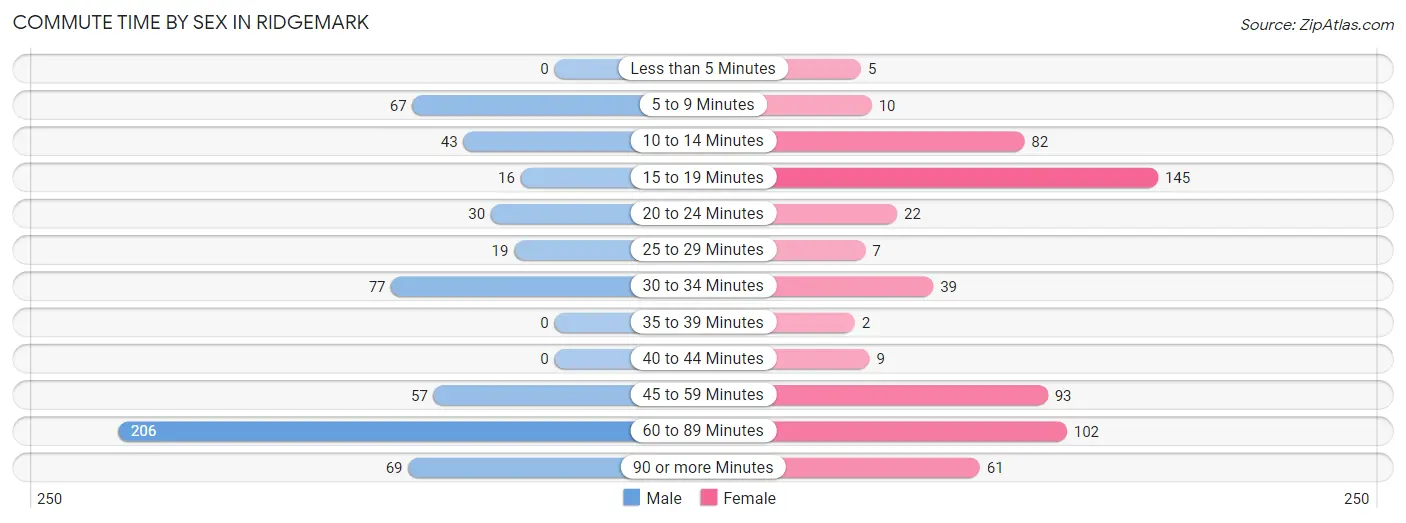
| Commute Time | Male | Female |
| Less than 5 Minutes | 0 (0.0%) | 5 (0.9%) |
| 5 to 9 Minutes | 67 (11.5%) | 10 (1.7%) |
| 10 to 14 Minutes | 43 (7.4%) | 82 (14.2%) |
| 15 to 19 Minutes | 16 (2.7%) | 145 (25.1%) |
| 20 to 24 Minutes | 30 (5.1%) | 22 (3.8%) |
| 25 to 29 Minutes | 19 (3.3%) | 7 (1.2%) |
| 30 to 34 Minutes | 77 (13.2%) | 39 (6.8%) |
| 35 to 39 Minutes | 0 (0.0%) | 2 (0.4%) |
| 40 to 44 Minutes | 0 (0.0%) | 9 (1.6%) |
| 45 to 59 Minutes | 57 (9.8%) | 93 (16.1%) |
| 60 to 89 Minutes | 206 (35.3%) | 102 (17.7%) |
| 90 or more Minutes | 69 (11.8%) | 61 (10.6%) |
Time of Departure to Work by Sex in Ridgemark
The most frequent times of departure to work in Ridgemark are 6:30 AM to 6:59 AM (124, 21.2%) for males and 9:00 AM to 9:59 AM (106, 18.4%) for females.
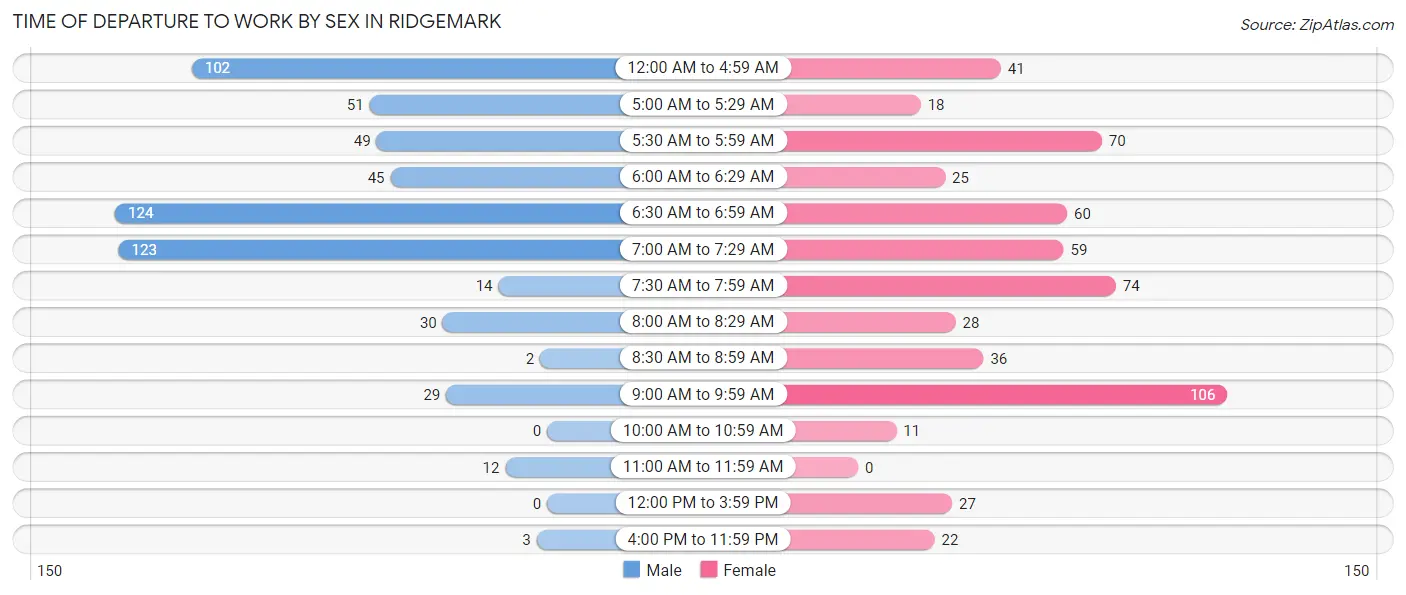
| Time of Departure | Male | Female |
| 12:00 AM to 4:59 AM | 102 (17.5%) | 41 (7.1%) |
| 5:00 AM to 5:29 AM | 51 (8.7%) | 18 (3.1%) |
| 5:30 AM to 5:59 AM | 49 (8.4%) | 70 (12.1%) |
| 6:00 AM to 6:29 AM | 45 (7.7%) | 25 (4.3%) |
| 6:30 AM to 6:59 AM | 124 (21.2%) | 60 (10.4%) |
| 7:00 AM to 7:29 AM | 123 (21.1%) | 59 (10.2%) |
| 7:30 AM to 7:59 AM | 14 (2.4%) | 74 (12.8%) |
| 8:00 AM to 8:29 AM | 30 (5.1%) | 28 (4.9%) |
| 8:30 AM to 8:59 AM | 2 (0.3%) | 36 (6.2%) |
| 9:00 AM to 9:59 AM | 29 (5.0%) | 106 (18.4%) |
| 10:00 AM to 10:59 AM | 0 (0.0%) | 11 (1.9%) |
| 11:00 AM to 11:59 AM | 12 (2.1%) | 0 (0.0%) |
| 12:00 PM to 3:59 PM | 0 (0.0%) | 27 (4.7%) |
| 4:00 PM to 11:59 PM | 3 (0.5%) | 22 (3.8%) |
| Total | 584 (100.0%) | 577 (100.0%) |
Housing Occupancy in Ridgemark
Occupancy by Ownership in Ridgemark
Of the total 1,181 dwellings in Ridgemark, owner-occupied units account for 888 (75.2%), while renter-occupied units make up 293 (24.8%).
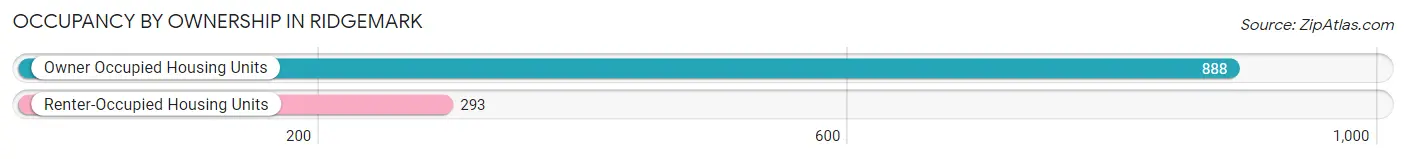
| Occupancy | # Housing Units | % Housing Units |
| Owner Occupied Housing Units | 888 | 75.2% |
| Renter-Occupied Housing Units | 293 | 24.8% |
| Total Occupied Housing Units | 1,181 | 100.0% |
Occupancy by Household Size in Ridgemark
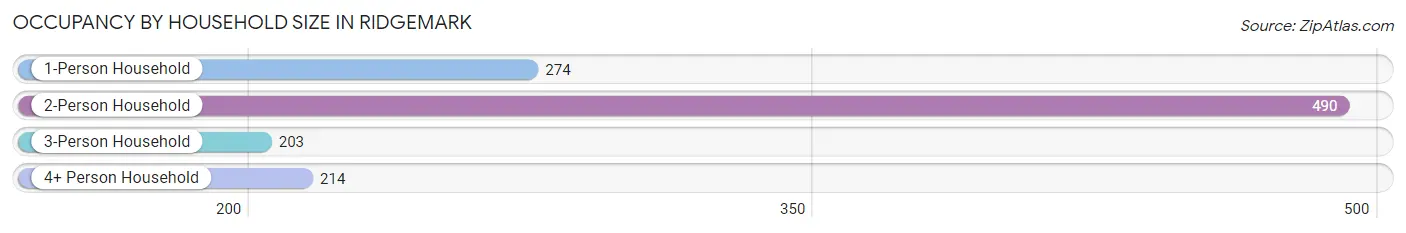
| Household Size | # Housing Units | % Housing Units |
| 1-Person Household | 274 | 23.2% |
| 2-Person Household | 490 | 41.5% |
| 3-Person Household | 203 | 17.2% |
| 4+ Person Household | 214 | 18.1% |
| Total Housing Units | 1,181 | 100.0% |
Occupancy by Ownership by Household Size in Ridgemark
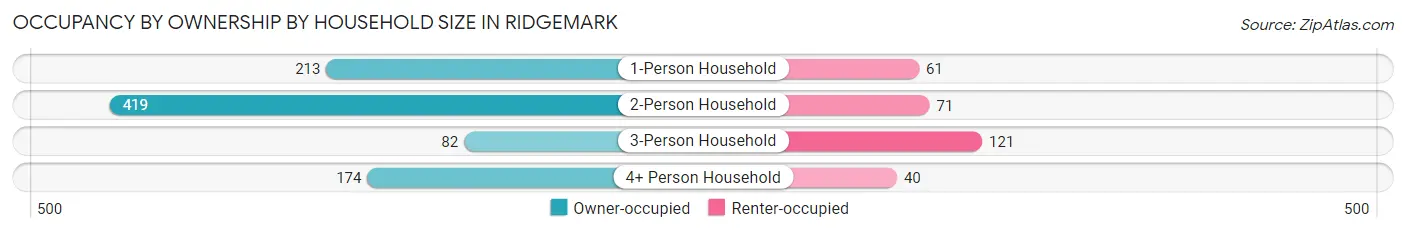
| Household Size | Owner-occupied | Renter-occupied |
| 1-Person Household | 213 (77.7%) | 61 (22.3%) |
| 2-Person Household | 419 (85.5%) | 71 (14.5%) |
| 3-Person Household | 82 (40.4%) | 121 (59.6%) |
| 4+ Person Household | 174 (81.3%) | 40 (18.7%) |
| Total Housing Units | 888 (75.2%) | 293 (24.8%) |
Occupancy by Educational Attainment in Ridgemark
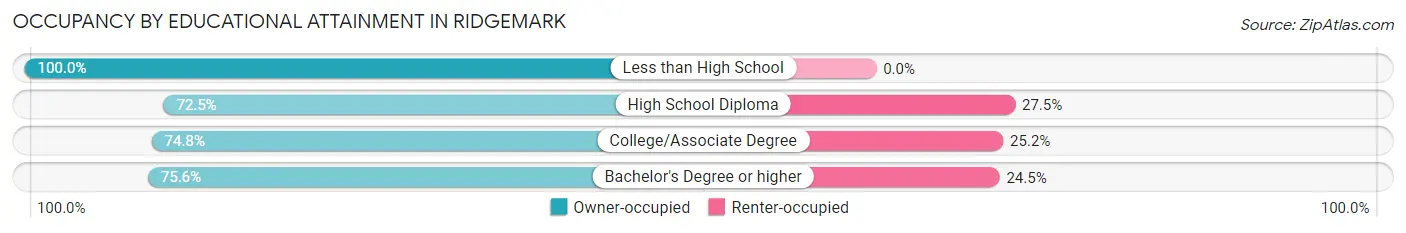
| Household Size | Owner-occupied | Renter-occupied |
| Less than High School | 17 (100.0%) | 0 (0.0%) |
| High School Diploma | 100 (72.5%) | 38 (27.5%) |
| College/Associate Degree | 425 (74.8%) | 143 (25.2%) |
| Bachelor's Degree or higher | 346 (75.5%) | 112 (24.4%) |
Occupancy by Age of Householder in Ridgemark
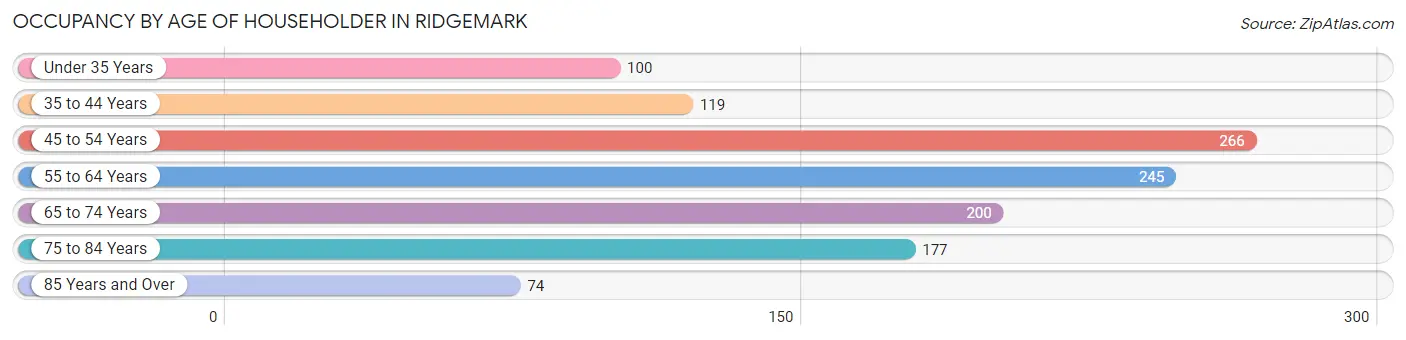
| Age Bracket | # Households | % Households |
| Under 35 Years | 100 | 8.5% |
| 35 to 44 Years | 119 | 10.1% |
| 45 to 54 Years | 266 | 22.5% |
| 55 to 64 Years | 245 | 20.7% |
| 65 to 74 Years | 200 | 16.9% |
| 75 to 84 Years | 177 | 15.0% |
| 85 Years and Over | 74 | 6.3% |
| Total | 1,181 | 100.0% |
Housing Finances in Ridgemark
Median Income by Occupancy in Ridgemark
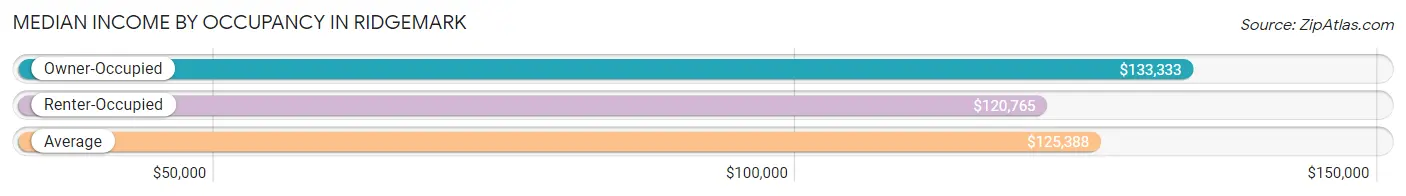
| Occupancy Type | # Households | Median Income |
| Owner-Occupied | 888 (75.2%) | $133,333 |
| Renter-Occupied | 293 (24.8%) | $120,765 |
| Average | 1,181 (100.0%) | $125,388 |
Occupancy by Householder Income Bracket in Ridgemark
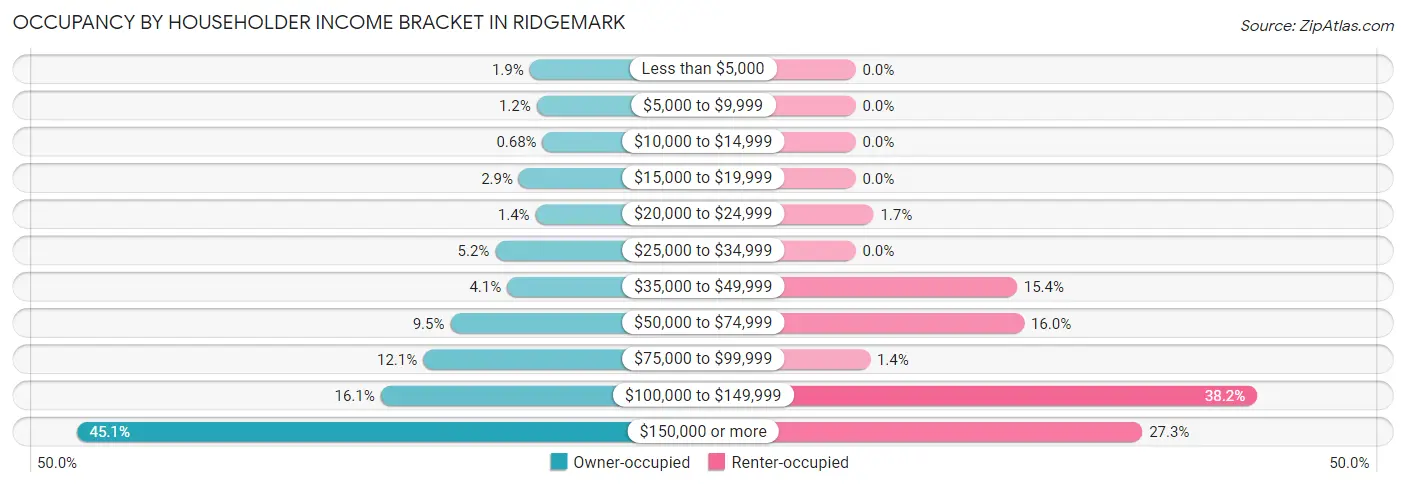
| Income Bracket | Owner-occupied | Renter-occupied |
| Less than $5,000 | 17 (1.9%) | 0 (0.0%) |
| $5,000 to $9,999 | 11 (1.2%) | 0 (0.0%) |
| $10,000 to $14,999 | 6 (0.7%) | 0 (0.0%) |
| $15,000 to $19,999 | 26 (2.9%) | 0 (0.0%) |
| $20,000 to $24,999 | 12 (1.3%) | 5 (1.7%) |
| $25,000 to $34,999 | 46 (5.2%) | 0 (0.0%) |
| $35,000 to $49,999 | 36 (4.1%) | 45 (15.4%) |
| $50,000 to $74,999 | 84 (9.5%) | 47 (16.0%) |
| $75,000 to $99,999 | 107 (12.0%) | 4 (1.4%) |
| $100,000 to $149,999 | 143 (16.1%) | 112 (38.2%) |
| $150,000 or more | 400 (45.1%) | 80 (27.3%) |
| Total | 888 (100.0%) | 293 (100.0%) |
Monthly Housing Cost Tiers in Ridgemark
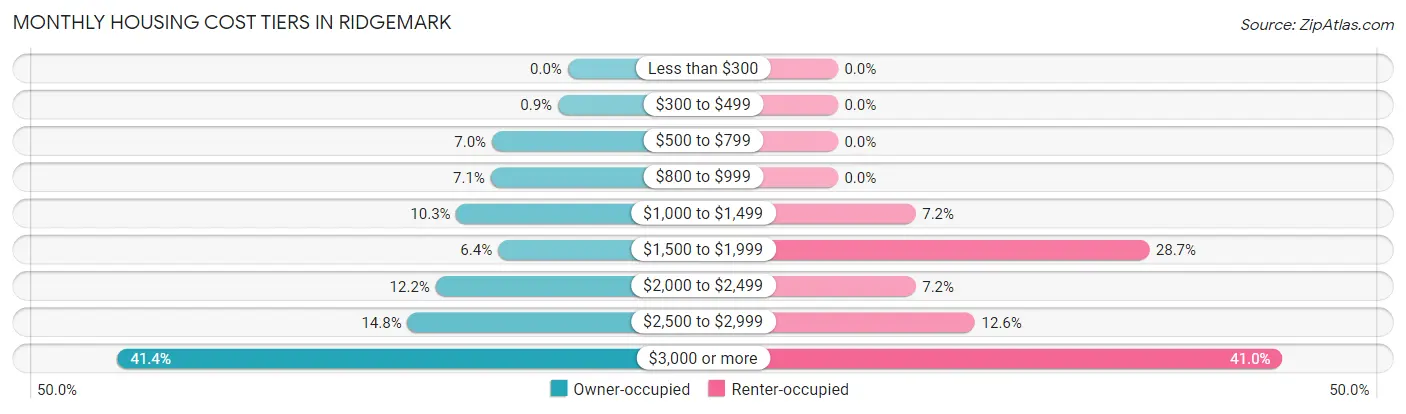
| Monthly Cost | Owner-occupied | Renter-occupied |
| Less than $300 | 0 (0.0%) | 0 (0.0%) |
| $300 to $499 | 8 (0.9%) | 0 (0.0%) |
| $500 to $799 | 62 (7.0%) | 0 (0.0%) |
| $800 to $999 | 63 (7.1%) | 0 (0.0%) |
| $1,000 to $1,499 | 91 (10.2%) | 21 (7.2%) |
| $1,500 to $1,999 | 57 (6.4%) | 84 (28.7%) |
| $2,000 to $2,499 | 108 (12.2%) | 21 (7.2%) |
| $2,500 to $2,999 | 131 (14.7%) | 37 (12.6%) |
| $3,000 or more | 368 (41.4%) | 120 (41.0%) |
| Total | 888 (100.0%) | 293 (100.0%) |
Physical Housing Characteristics in Ridgemark
Housing Structures in Ridgemark
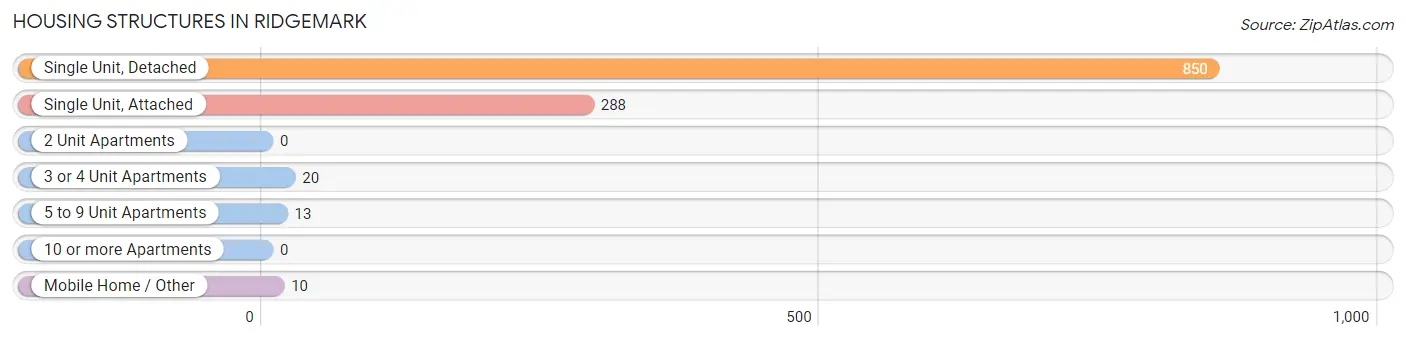
| Structure Type | # Housing Units | % Housing Units |
| Single Unit, Detached | 850 | 72.0% |
| Single Unit, Attached | 288 | 24.4% |
| 2 Unit Apartments | 0 | 0.0% |
| 3 or 4 Unit Apartments | 20 | 1.7% |
| 5 to 9 Unit Apartments | 13 | 1.1% |
| 10 or more Apartments | 0 | 0.0% |
| Mobile Home / Other | 10 | 0.9% |
| Total | 1,181 | 100.0% |
Housing Structures by Occupancy in Ridgemark
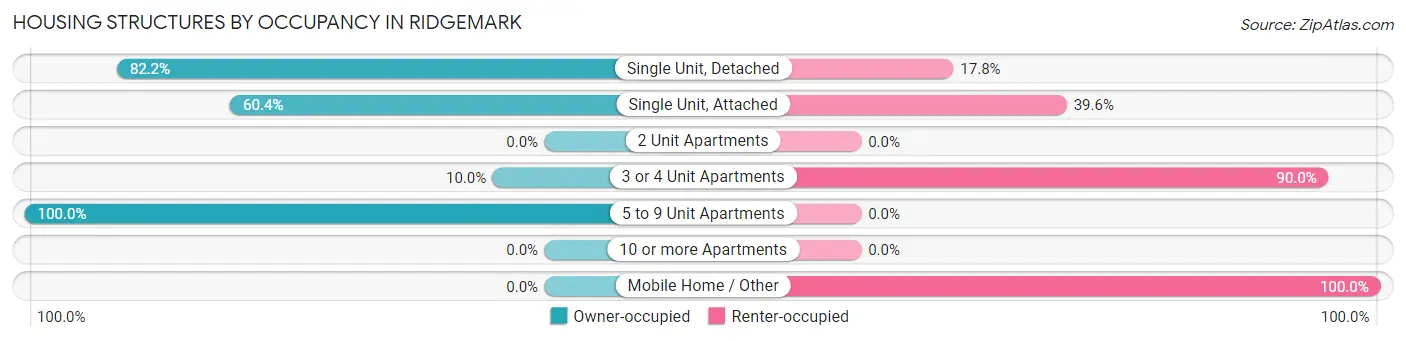
| Structure Type | Owner-occupied | Renter-occupied |
| Single Unit, Detached | 699 (82.2%) | 151 (17.8%) |
| Single Unit, Attached | 174 (60.4%) | 114 (39.6%) |
| 2 Unit Apartments | 0 (0.0%) | 0 (0.0%) |
| 3 or 4 Unit Apartments | 2 (10.0%) | 18 (90.0%) |
| 5 to 9 Unit Apartments | 13 (100.0%) | 0 (0.0%) |
| 10 or more Apartments | 0 (0.0%) | 0 (0.0%) |
| Mobile Home / Other | 0 (0.0%) | 10 (100.0%) |
| Total | 888 (75.2%) | 293 (24.8%) |
Housing Structures by Number of Rooms in Ridgemark
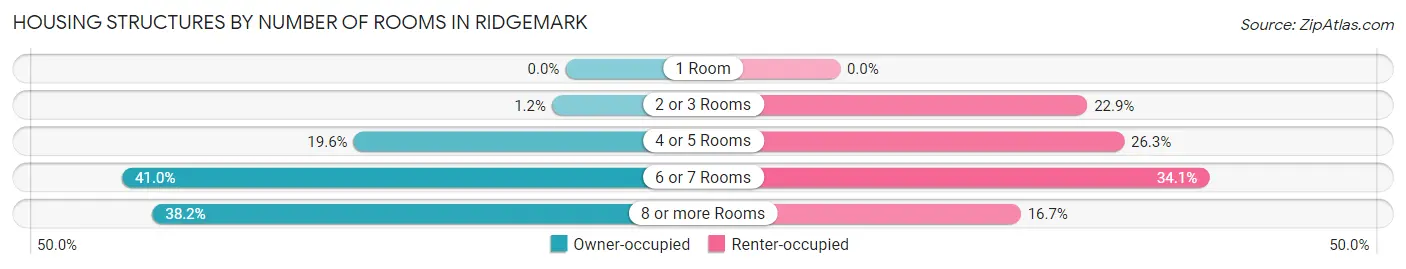
| Number of Rooms | Owner-occupied | Renter-occupied |
| 1 Room | 0 (0.0%) | 0 (0.0%) |
| 2 or 3 Rooms | 11 (1.2%) | 67 (22.9%) |
| 4 or 5 Rooms | 174 (19.6%) | 77 (26.3%) |
| 6 or 7 Rooms | 364 (41.0%) | 100 (34.1%) |
| 8 or more Rooms | 339 (38.2%) | 49 (16.7%) |
| Total | 888 (100.0%) | 293 (100.0%) |
Housing Structure by Heating Type in Ridgemark
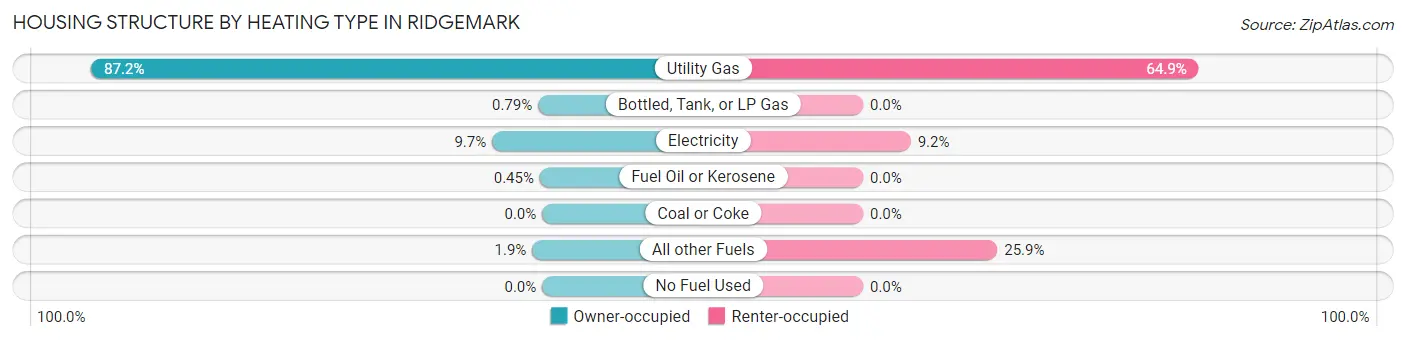
| Heating Type | Owner-occupied | Renter-occupied |
| Utility Gas | 774 (87.2%) | 190 (64.8%) |
| Bottled, Tank, or LP Gas | 7 (0.8%) | 0 (0.0%) |
| Electricity | 86 (9.7%) | 27 (9.2%) |
| Fuel Oil or Kerosene | 4 (0.4%) | 0 (0.0%) |
| Coal or Coke | 0 (0.0%) | 0 (0.0%) |
| All other Fuels | 17 (1.9%) | 76 (25.9%) |
| No Fuel Used | 0 (0.0%) | 0 (0.0%) |
| Total | 888 (100.0%) | 293 (100.0%) |
Household Vehicle Usage in Ridgemark
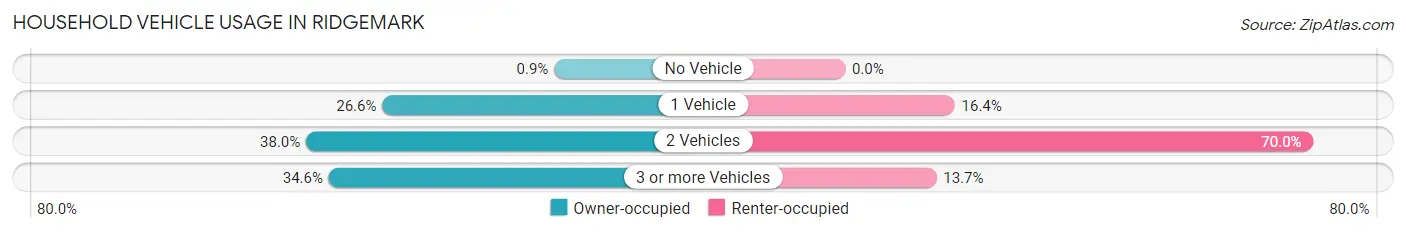
| Vehicles per Household | Owner-occupied | Renter-occupied |
| No Vehicle | 8 (0.9%) | 0 (0.0%) |
| 1 Vehicle | 236 (26.6%) | 48 (16.4%) |
| 2 Vehicles | 337 (38.0%) | 205 (70.0%) |
| 3 or more Vehicles | 307 (34.6%) | 40 (13.7%) |
| Total | 888 (100.0%) | 293 (100.0%) |
Real Estate & Mortgages in Ridgemark
Real Estate and Mortgage Overview in Ridgemark
| Characteristic | Without Mortgage | With Mortgage |
| Housing Units | 231 | 657 |
| Median Property Value | $697,900 | $763,800 |
| Median Household Income | $59,028 | $361 |
| Monthly Housing Costs | $920 | $368 |
| Real Estate Taxes | $5,990 | $7 |
Property Value by Mortgage Status in Ridgemark
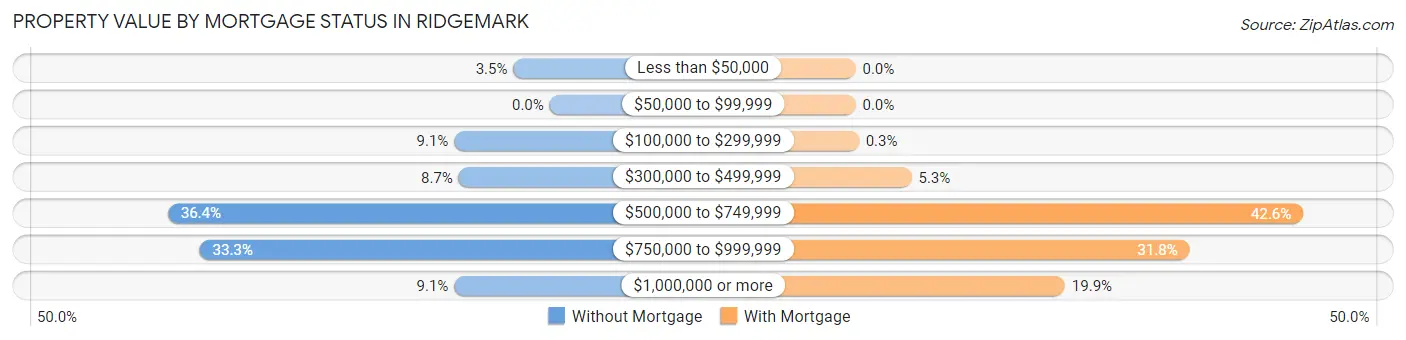
| Property Value | Without Mortgage | With Mortgage |
| Less than $50,000 | 8 (3.5%) | 0 (0.0%) |
| $50,000 to $99,999 | 0 (0.0%) | 0 (0.0%) |
| $100,000 to $299,999 | 21 (9.1%) | 2 (0.3%) |
| $300,000 to $499,999 | 20 (8.7%) | 35 (5.3%) |
| $500,000 to $749,999 | 84 (36.4%) | 280 (42.6%) |
| $750,000 to $999,999 | 77 (33.3%) | 209 (31.8%) |
| $1,000,000 or more | 21 (9.1%) | 131 (19.9%) |
| Total | 231 (100.0%) | 657 (100.0%) |
Household Income by Mortgage Status in Ridgemark
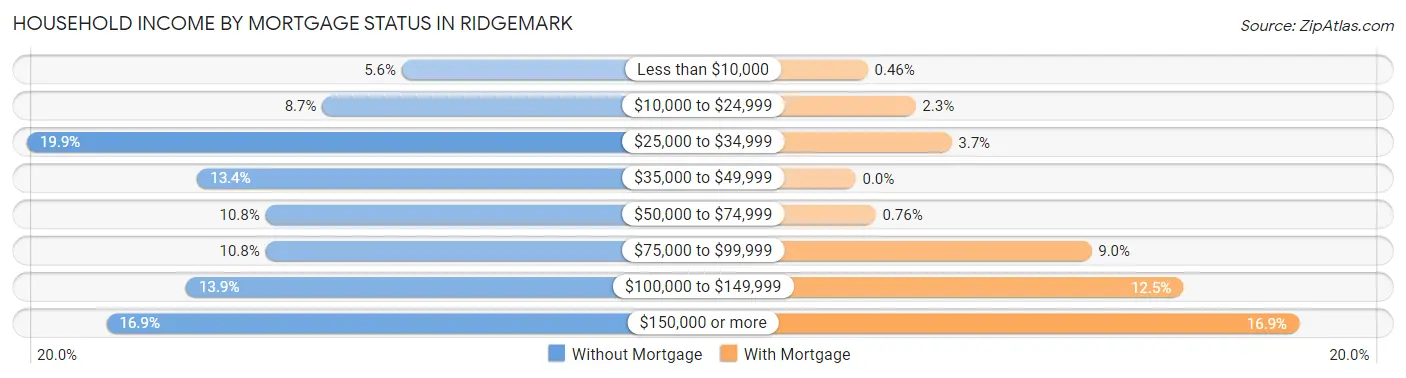
| Household Income | Without Mortgage | With Mortgage |
| Less than $10,000 | 13 (5.6%) | 3 (0.5%) |
| $10,000 to $24,999 | 20 (8.7%) | 15 (2.3%) |
| $25,000 to $34,999 | 46 (19.9%) | 24 (3.6%) |
| $35,000 to $49,999 | 31 (13.4%) | 0 (0.0%) |
| $50,000 to $74,999 | 25 (10.8%) | 5 (0.8%) |
| $75,000 to $99,999 | 25 (10.8%) | 59 (9.0%) |
| $100,000 to $149,999 | 32 (13.9%) | 82 (12.5%) |
| $150,000 or more | 39 (16.9%) | 111 (16.9%) |
| Total | 231 (100.0%) | 657 (100.0%) |
Property Value to Household Income Ratio in Ridgemark
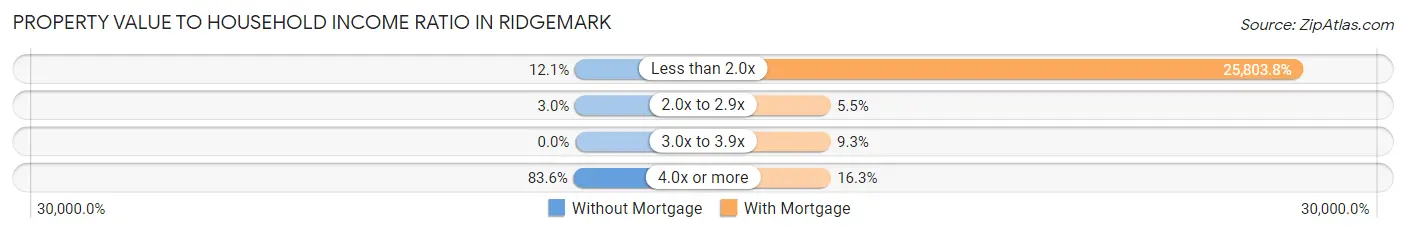
| Value-to-Income Ratio | Without Mortgage | With Mortgage |
| Less than 2.0x | 28 (12.1%) | 169,531 (25,803.8%) |
| 2.0x to 2.9x | 7 (3.0%) | 36 (5.5%) |
| 3.0x to 3.9x | 0 (0.0%) | 61 (9.3%) |
| 4.0x or more | 193 (83.6%) | 107 (16.3%) |
| Total | 231 (100.0%) | 657 (100.0%) |
Real Estate Taxes by Mortgage Status in Ridgemark
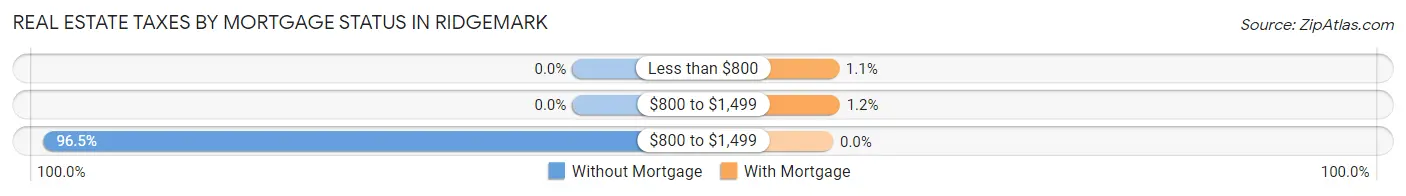
| Property Taxes | Without Mortgage | With Mortgage |
| Less than $800 | 0 (0.0%) | 7 (1.1%) |
| $800 to $1,499 | 0 (0.0%) | 8 (1.2%) |
| $800 to $1,499 | 223 (96.5%) | 0 (0.0%) |
| Total | 231 (100.0%) | 657 (100.0%) |
Health & Disability in Ridgemark
Health Insurance Coverage by Age in Ridgemark
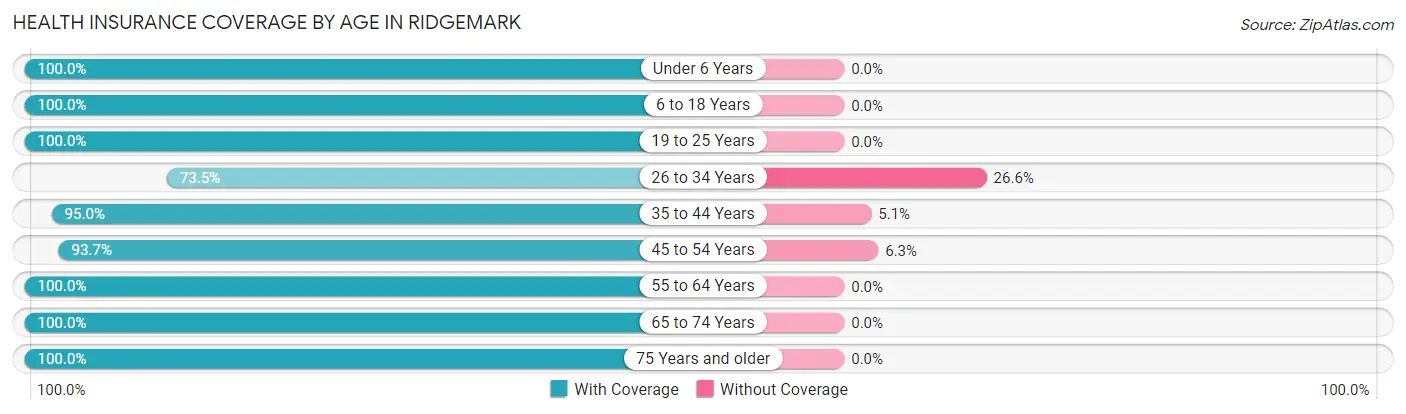
| Age Bracket | With Coverage | Without Coverage |
| Under 6 Years | 171 (100.0%) | 0 (0.0%) |
| 6 to 18 Years | 395 (100.0%) | 0 (0.0%) |
| 19 to 25 Years | 310 (100.0%) | 0 (0.0%) |
| 26 to 34 Years | 202 (73.5%) | 73 (26.6%) |
| 35 to 44 Years | 188 (95.0%) | 10 (5.1%) |
| 45 to 54 Years | 473 (93.7%) | 32 (6.3%) |
| 55 to 64 Years | 421 (100.0%) | 0 (0.0%) |
| 65 to 74 Years | 330 (100.0%) | 0 (0.0%) |
| 75 Years and older | 396 (100.0%) | 0 (0.0%) |
| Total | 2,886 (96.2%) | 115 (3.8%) |
Health Insurance Coverage by Citizenship Status in Ridgemark
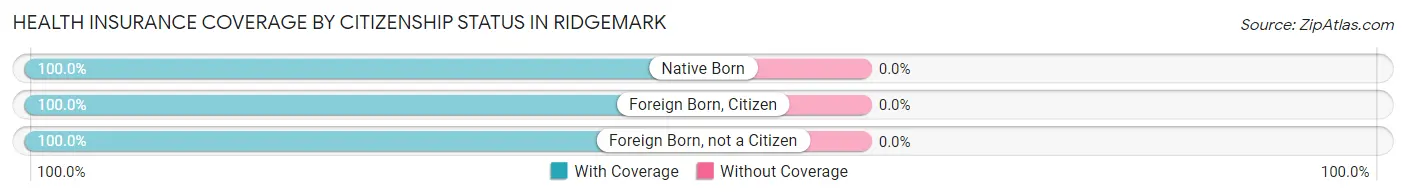
| Citizenship Status | With Coverage | Without Coverage |
| Native Born | 171 (100.0%) | 0 (0.0%) |
| Foreign Born, Citizen | 395 (100.0%) | 0 (0.0%) |
| Foreign Born, not a Citizen | 310 (100.0%) | 0 (0.0%) |
Health Insurance Coverage by Household Income in Ridgemark
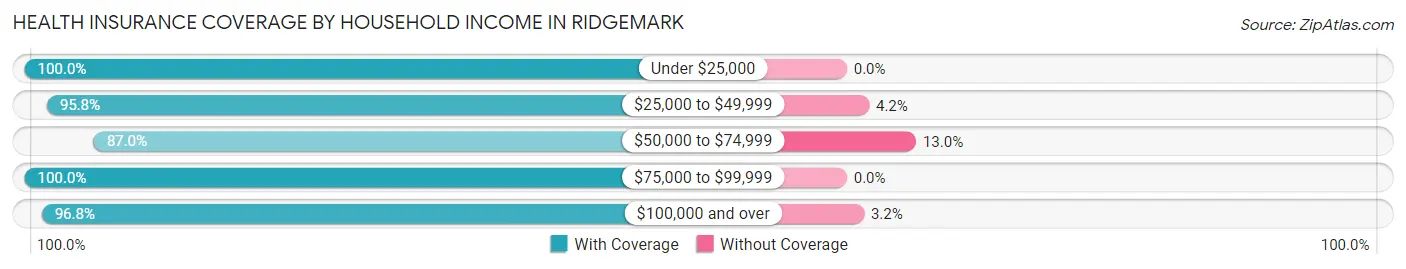
| Household Income | With Coverage | Without Coverage |
| Under $25,000 | 119 (100.0%) | 0 (0.0%) |
| $25,000 to $49,999 | 230 (95.8%) | 10 (4.2%) |
| $50,000 to $74,999 | 215 (87.0%) | 32 (13.0%) |
| $75,000 to $99,999 | 178 (100.0%) | 0 (0.0%) |
| $100,000 and over | 2,113 (96.8%) | 70 (3.2%) |
Public vs Private Health Insurance Coverage by Age in Ridgemark
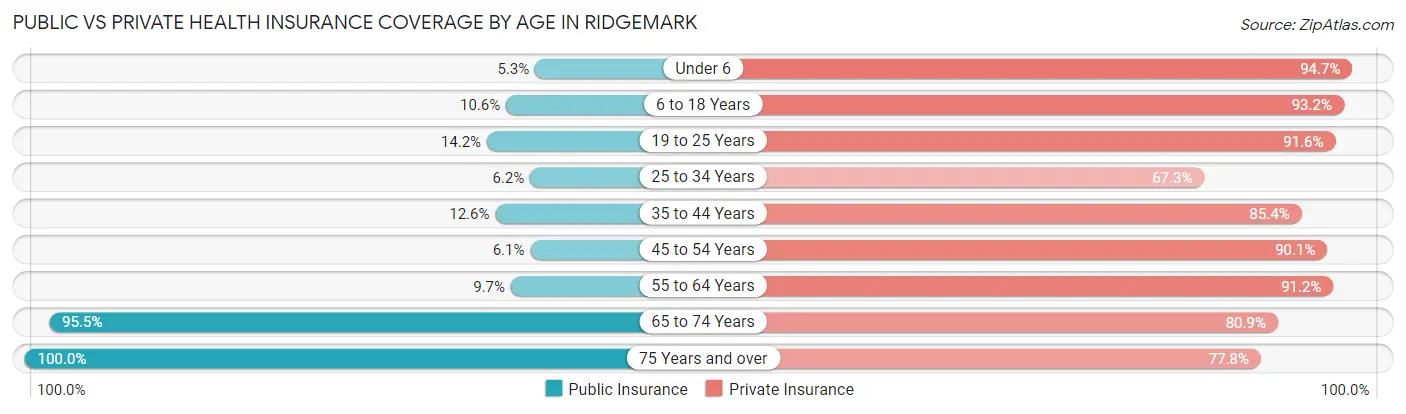
| Age Bracket | Public Insurance | Private Insurance |
| Under 6 | 9 (5.3%) | 162 (94.7%) |
| 6 to 18 Years | 42 (10.6%) | 368 (93.2%) |
| 19 to 25 Years | 44 (14.2%) | 284 (91.6%) |
| 25 to 34 Years | 17 (6.2%) | 185 (67.3%) |
| 35 to 44 Years | 25 (12.6%) | 169 (85.4%) |
| 45 to 54 Years | 31 (6.1%) | 455 (90.1%) |
| 55 to 64 Years | 41 (9.7%) | 384 (91.2%) |
| 65 to 74 Years | 315 (95.5%) | 267 (80.9%) |
| 75 Years and over | 396 (100.0%) | 308 (77.8%) |
| Total | 920 (30.7%) | 2,582 (86.0%) |
Disability Status by Sex by Age in Ridgemark
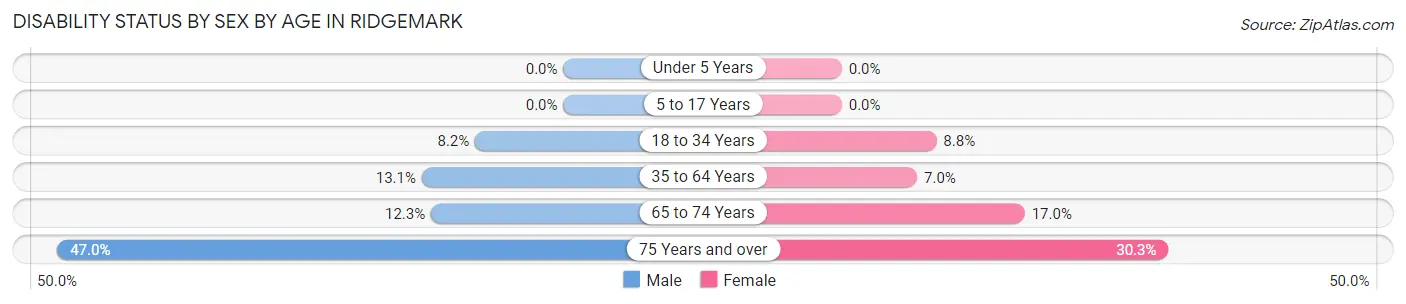
| Age Bracket | Male | Female |
| Under 5 Years | 0 (0.0%) | 0 (0.0%) |
| 5 to 17 Years | 0 (0.0%) | 0 (0.0%) |
| 18 to 34 Years | 19 (8.2%) | 31 (8.8%) |
| 35 to 64 Years | 80 (13.1%) | 36 (7.0%) |
| 65 to 74 Years | 21 (12.3%) | 27 (17.0%) |
| 75 Years and over | 93 (47.0%) | 60 (30.3%) |
Disability Class by Sex by Age in Ridgemark
Disability Class: Hearing Difficulty
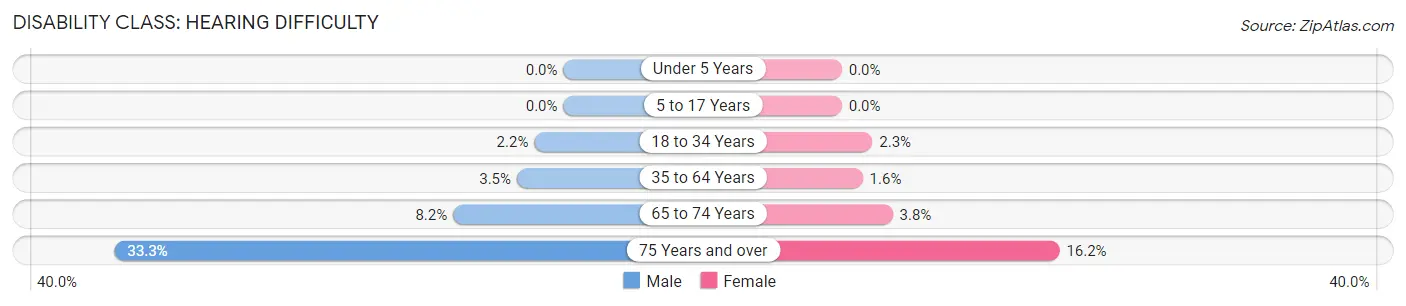
| Age Bracket | Male | Female |
| Under 5 Years | 0 (0.0%) | 0 (0.0%) |
| 5 to 17 Years | 0 (0.0%) | 0 (0.0%) |
| 18 to 34 Years | 5 (2.2%) | 8 (2.3%) |
| 35 to 64 Years | 21 (3.5%) | 8 (1.5%) |
| 65 to 74 Years | 14 (8.2%) | 6 (3.8%) |
| 75 Years and over | 66 (33.3%) | 32 (16.2%) |
Disability Class: Vision Difficulty
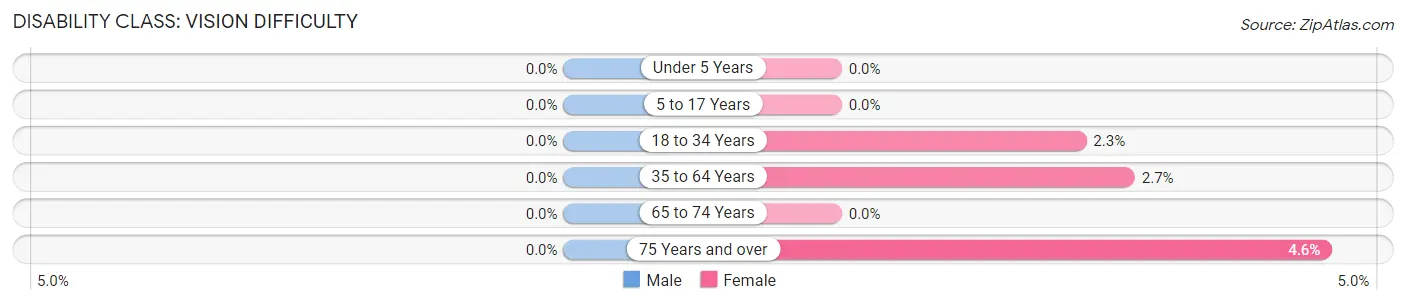
| Age Bracket | Male | Female |
| Under 5 Years | 0 (0.0%) | 0 (0.0%) |
| 5 to 17 Years | 0 (0.0%) | 0 (0.0%) |
| 18 to 34 Years | 0 (0.0%) | 8 (2.3%) |
| 35 to 64 Years | 0 (0.0%) | 14 (2.7%) |
| 65 to 74 Years | 0 (0.0%) | 0 (0.0%) |
| 75 Years and over | 0 (0.0%) | 9 (4.5%) |
Disability Class: Cognitive Difficulty
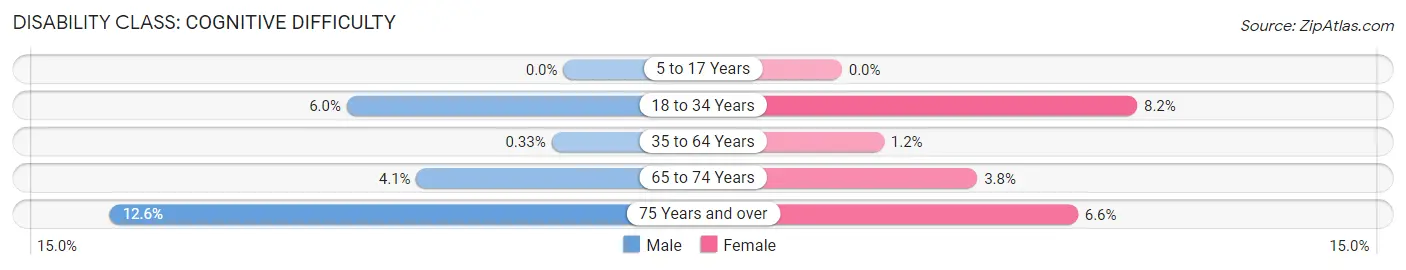
| Age Bracket | Male | Female |
| 5 to 17 Years | 0 (0.0%) | 0 (0.0%) |
| 18 to 34 Years | 14 (6.0%) | 29 (8.2%) |
| 35 to 64 Years | 2 (0.3%) | 6 (1.2%) |
| 65 to 74 Years | 7 (4.1%) | 6 (3.8%) |
| 75 Years and over | 25 (12.6%) | 13 (6.6%) |
Disability Class: Ambulatory Difficulty
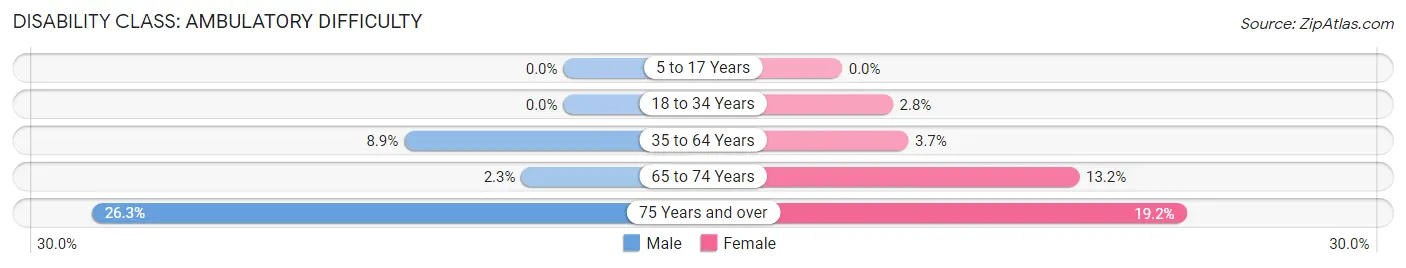
| Age Bracket | Male | Female |
| 5 to 17 Years | 0 (0.0%) | 0 (0.0%) |
| 18 to 34 Years | 0 (0.0%) | 10 (2.8%) |
| 35 to 64 Years | 54 (8.9%) | 19 (3.7%) |
| 65 to 74 Years | 4 (2.3%) | 21 (13.2%) |
| 75 Years and over | 52 (26.3%) | 38 (19.2%) |
Disability Class: Self-Care Difficulty
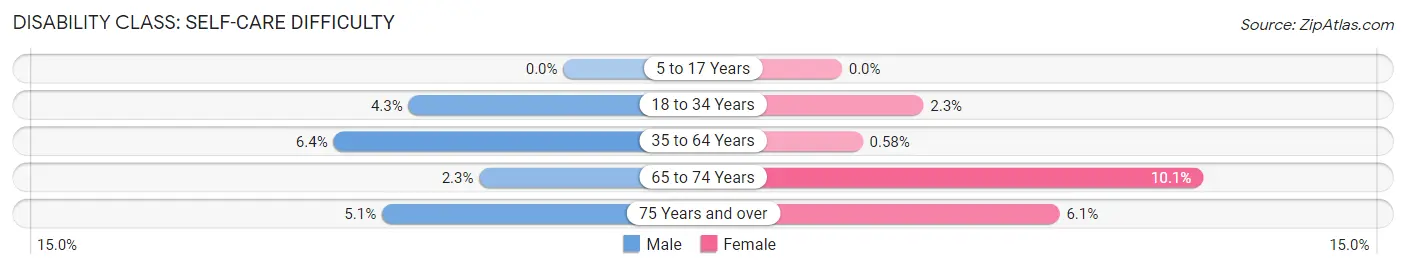
| Age Bracket | Male | Female |
| 5 to 17 Years | 0 (0.0%) | 0 (0.0%) |
| 18 to 34 Years | 10 (4.3%) | 8 (2.3%) |
| 35 to 64 Years | 39 (6.4%) | 3 (0.6%) |
| 65 to 74 Years | 4 (2.3%) | 16 (10.1%) |
| 75 Years and over | 10 (5.1%) | 12 (6.1%) |
Technology Access in Ridgemark
Computing Device Access in Ridgemark
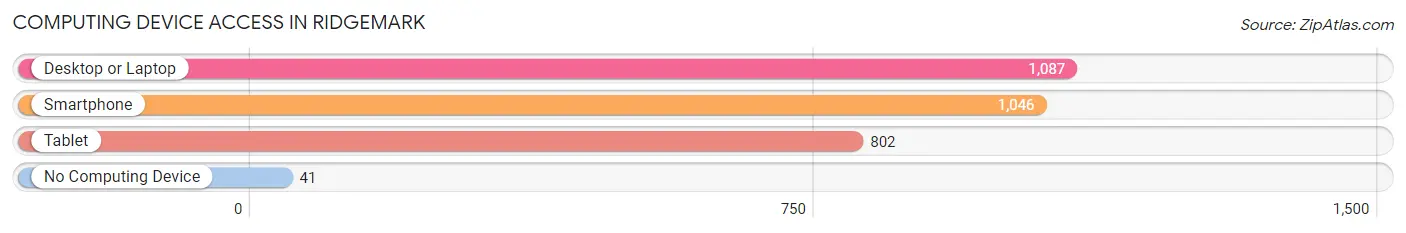
| Device Type | # Households | % Households |
| Desktop or Laptop | 1,087 | 92.0% |
| Smartphone | 1,046 | 88.6% |
| Tablet | 802 | 67.9% |
| No Computing Device | 41 | 3.5% |
| Total | 1,181 | 100.0% |
Internet Access in Ridgemark
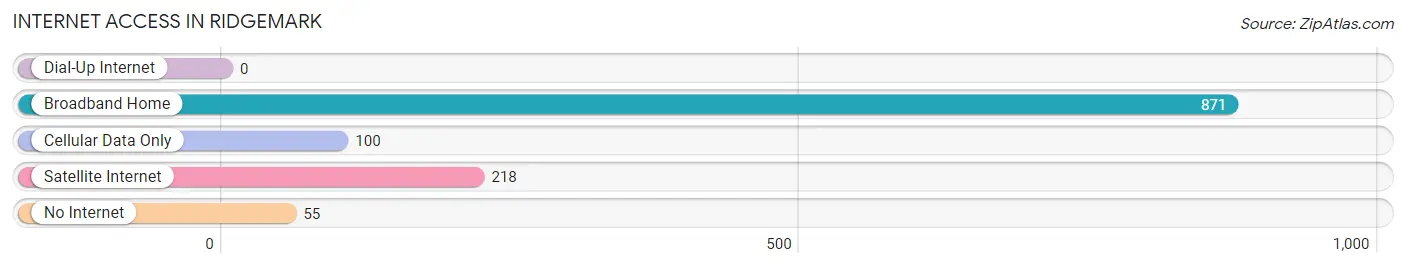
| Internet Type | # Households | % Households |
| Dial-Up Internet | 0 | 0.0% |
| Broadband Home | 871 | 73.8% |
| Cellular Data Only | 100 | 8.5% |
| Satellite Internet | 218 | 18.5% |
| No Internet | 55 | 4.7% |
| Total | 1,181 | 100.0% |
Ridgemark Summary
Ridgemark is a census-designated place (CDP) located in San Benito County, California, United States. The population was 1,845 at the 2010 census, up from 1,717 at the 2000 census. It is located in the San Benito Valley, about 8 miles (13 km) east of Hollister.
Geography
Ridgemark is located at 36 51 17 North 121 20 17 West 36 854722 121 338333
According to the United States Census Bureau, the CDP has a total area of 2.3 square miles (6.0 km2), all of it land.
Demographics
As of the census of 2000, there were 1,717 people, 590 households, and 486 families residing in the CDP. The population density was 745.3 people per square mile (287.7/km2). There were 602 housing units at an average density of 259.7 per square mile (100.2/km2). The racial makeup of the CDP was 68.45% White, 0.35% African American, 0.88% Native American, 0.12% Asian, 0.06% Pacific Islander, 27.17% from other races, and 3.07% from two or more races. Hispanic or Latino of any race were 51.45% of the population.
There were 590 households, out of which 37.6% had children under the age of 18 living with them, 64.6% were married couples living together, 10.2% had a female householder with no husband present, and 19.7% were non-families. 15.6% of all households were made up of individuals, and 6.1% had someone living alone who was 65 years of age or older. The average household size was 2.91 and the average family size was 3.23.
In the CDP, the population was spread out, with 28.2% under the age of 18, 8.2% from 18 to 24, 28.2% from 25 to 44, 24.2% from 45 to 64, and 11.2% who were 65 years of age or older. The median age was 36 years. For every 100 females, there were 97.2 males. For every 100 females age 18 and over, there were 94.2 males.
The median income for a household in the CDP was $50,938, and the median income for a family was $54,821. Males had a median income of $41,250 versus $27,500 for females. The per capita income for the CDP was $19,945. About 6.2% of families and 8.2% of the population were below the poverty line, including 10.2% of those under age 18 and none of those age 65 or over.
Economy
Ridgemark is home to a golf course and resort, which is the main source of employment in the area. The resort includes a golf course, a restaurant, and a hotel. The golf course is a popular destination for golfers from all over the Bay Area.
The area is also home to several wineries, including the Ridgemark Winery, which produces a variety of wines. The winery also offers tours and tastings.
The area is also home to several small businesses, including a grocery store, a hardware store, and a few restaurants.
Education
Ridgemark is served by the San Benito High School District. The district operates two high schools, San Benito High School and Ridgemark High School. The district also operates several elementary and middle schools.
Conclusion
Ridgemark is a census-designated place located in San Benito County, California. The population was 1,845 at the 2010 census, up from 1,717 at the 2000 census. It is located in the San Benito Valley, about 8 miles east of Hollister. The economy of Ridgemark is mainly driven by the golf course and resort, as well as several wineries and small businesses. The area is served by the San Benito High School District, which operates two high schools, San Benito High School and Ridgemark High School, as well as several elementary and middle schools.
Common Questions
What is Per Capita Income in Ridgemark?
Per Capita income in Ridgemark is $63,428.
What is the Median Family Income in Ridgemark?
Median Family Income in Ridgemark is $147,969.
What is the Median Household income in Ridgemark?
Median Household Income in Ridgemark is $125,388.
What is Income or Wage Gap in Ridgemark?
Income or Wage Gap in Ridgemark is 43.4%.
Women in Ridgemark earn 56.6 cents for every dollar earned by a man.
What is Inequality or Gini Index in Ridgemark?
Inequality or Gini Index in Ridgemark is 0.42.
What is the Total Population of Ridgemark?
Total Population of Ridgemark is 3,022.
What is the Total Male Population of Ridgemark?
Total Male Population of Ridgemark is 1,476.
What is the Total Female Population of Ridgemark?
Total Female Population of Ridgemark is 1,546.
What is the Ratio of Males per 100 Females in Ridgemark?
There are 95.47 Males per 100 Females in Ridgemark.
What is the Ratio of Females per 100 Males in Ridgemark?
There are 104.74 Females per 100 Males in Ridgemark.
What is the Median Population Age in Ridgemark?
Median Population Age in Ridgemark is 48.1 Years.
What is the Average Family Size in Ridgemark
Average Family Size in Ridgemark is 2.9 People.
What is the Average Household Size in Ridgemark
Average Household Size in Ridgemark is 2.5 People.
How Large is the Labor Force in Ridgemark?
There are 1,550 People in the Labor Forcein in Ridgemark.
What is the Percentage of People in the Labor Force in Ridgemark?
59.4% of People are in the Labor Force in Ridgemark.
What is the Unemployment Rate in Ridgemark?
Unemployment Rate in Ridgemark is 7.6%.