Cities with the Highest Percentage of Population Employed in Security & Protection in North Dakota
RELATED REPORTS & OPTIONS
Security & Protection
North Dakota
Compare Cities
Map of Cities with the Highest Percentage of Population Employed in Security & Protection in North Dakota
0.0%
50.0%
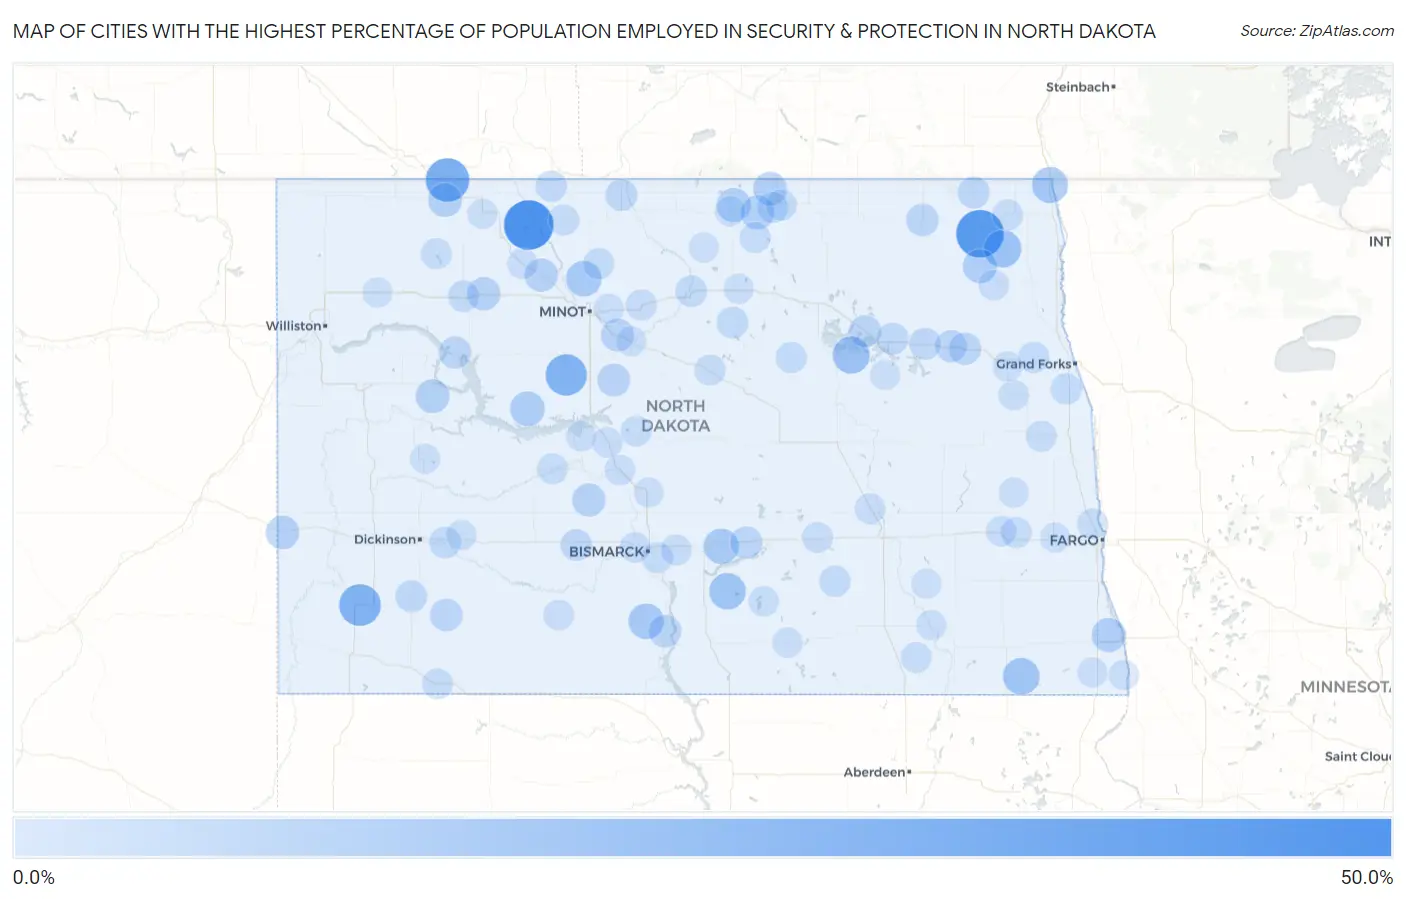
Cities with the Highest Percentage of Population Employed in Security & Protection in North Dakota
| City | % Employed | vs State | vs National | |
| 1. | Tolley | 41.7% | 1.6%(+40.1)#1 | 2.1%(+39.5)#59 |
| 2. | Mountain | 37.5% | 1.6%(+35.9)#2 | 2.1%(+35.4)#72 |
| 3. | Portal | 28.8% | 1.6%(+27.2)#3 | 2.1%(+26.6)#129 |
| 4. | Amidon | 25.0% | 1.6%(+23.4)#4 | 2.1%(+22.9)#186 |
| 5. | Douglas | 24.1% | 1.6%(+22.6)#5 | 2.1%(+22.0)#201 |
| 6. | Crystal | 16.7% | 1.6%(+15.1)#6 | 2.1%(+14.5)#398 |
| 7. | Fort Totten | 15.8% | 1.6%(+14.2)#7 | 2.1%(+13.6)#444 |
| 8. | Rutland | 14.6% | 1.6%(+13.1)#8 | 2.1%(+12.5)#510 |
| 9. | Braddock | 14.3% | 1.6%(+12.7)#9 | 2.1%(+12.1)#551 |
| 10. | Pembina | 13.5% | 1.6%(+11.9)#10 | 2.1%(+11.3)#614 |
| 11. | Solen | 12.5% | 1.6%(+10.9)#11 | 2.1%(+10.4)#715 |
| 12. | Minot Afb | 12.2% | 1.6%(+10.6)#12 | 2.1%(+10.0)#737 |
| 13. | Trenton | 12.1% | 1.6%(+10.5)#13 | 2.1%(+9.93)#749 |
| 14. | Driscoll | 12.0% | 1.6%(+10.4)#14 | 2.1%(+9.85)#761 |
| 15. | White Shield | 10.6% | 1.6%(+9.08)#15 | 2.1%(+8.49)#988 |
| 16. | Dwight | 9.7% | 1.6%(+8.12)#16 | 2.1%(+7.53)#1,161 |
| 17. | Edinburg | 9.5% | 1.6%(+7.96)#17 | 2.1%(+7.38)#1,191 |
| 18. | East Dunseith | 9.4% | 1.6%(+7.87)#18 | 2.1%(+7.29)#1,215 |
| 19. | Shell Valley | 9.2% | 1.6%(+7.65)#19 | 2.1%(+7.06)#1,262 |
| 20. | Lignite | 9.1% | 1.6%(+7.53)#20 | 2.1%(+6.94)#1,299 |
| 21. | Mandaree | 8.8% | 1.6%(+7.26)#21 | 2.1%(+6.68)#1,387 |
| 22. | St John | 8.6% | 1.6%(+7.01)#22 | 2.1%(+6.42)#1,462 |
| 23. | Beach | 8.3% | 1.6%(+6.77)#23 | 2.1%(+6.18)#1,535 |
| 24. | Palermo | 8.1% | 1.6%(+6.50)#24 | 2.1%(+5.92)#1,634 |
| 25. | Carpio | 8.0% | 1.6%(+6.44)#25 | 2.1%(+5.85)#1,661 |
| 26. | Center | 7.8% | 1.6%(+6.27)#26 | 2.1%(+5.68)#1,716 |
| 27. | Sawyer | 7.3% | 1.6%(+5.77)#27 | 2.1%(+5.18)#1,932 |
| 28. | Benedict | 7.1% | 1.6%(+5.58)#28 | 2.1%(+4.99)#2,003 |
| 29. | Cannon Ball | 6.7% | 1.6%(+5.19)#29 | 2.1%(+4.60)#2,206 |
| 30. | Regent | 6.6% | 1.6%(+5.03)#30 | 2.1%(+4.44)#2,309 |
| 31. | Langdon | 6.2% | 1.6%(+4.64)#31 | 2.1%(+4.05)#2,563 |
| 32. | Petersburg | 6.1% | 1.6%(+4.56)#32 | 2.1%(+3.97)#2,612 |
| 33. | Devils Lake | 5.9% | 1.6%(+4.33)#33 | 2.1%(+3.74)#2,805 |
| 34. | New Town | 5.9% | 1.6%(+4.32)#34 | 2.1%(+3.73)#2,833 |
| 35. | Steele | 5.7% | 1.6%(+4.14)#35 | 2.1%(+3.55)#2,967 |
| 36. | Michigan City | 5.6% | 1.6%(+4.07)#36 | 2.1%(+3.49)#3,029 |
| 37. | Crary | 5.5% | 1.6%(+3.89)#37 | 2.1%(+3.31)#3,215 |
| 38. | Walhalla | 5.1% | 1.6%(+3.54)#38 | 2.1%(+2.95)#3,587 |
| 39. | New Salem | 5.1% | 1.6%(+3.49)#39 | 2.1%(+2.91)#3,633 |
| 40. | New England | 5.1% | 1.6%(+3.49)#40 | 2.1%(+2.90)#3,637 |
| 41. | Lakota | 5.0% | 1.6%(+3.40)#41 | 2.1%(+2.82)#3,732 |
| 42. | Westhope | 4.9% | 1.6%(+3.38)#42 | 2.1%(+2.80)#3,751 |
| 43. | Gladstone | 4.8% | 1.6%(+3.23)#43 | 2.1%(+2.65)#3,929 |
| 44. | Balta | 4.8% | 1.6%(+3.20)#44 | 2.1%(+2.61)#3,968 |
| 45. | Towner | 4.5% | 1.6%(+2.94)#45 | 2.1%(+2.35)#4,322 |
| 46. | Stanley | 4.4% | 1.6%(+2.84)#46 | 2.1%(+2.25)#4,464 |
| 47. | Sherwood | 4.2% | 1.6%(+2.61)#47 | 2.1%(+2.02)#4,799 |
| 48. | Gackle | 4.0% | 1.6%(+2.44)#48 | 2.1%(+1.85)#5,098 |
| 49. | Glenburn | 3.9% | 1.6%(+2.32)#49 | 2.1%(+1.74)#5,320 |
| 50. | Maddock | 3.9% | 1.6%(+2.31)#50 | 2.1%(+1.72)#5,359 |
| 51. | Green Acres | 3.8% | 1.6%(+2.24)#51 | 2.1%(+1.65)#5,495 |
| 52. | Grand Forks Afb | 3.7% | 1.6%(+2.18)#52 | 2.1%(+1.59)#5,627 |
| 53. | Thompson | 3.6% | 1.6%(+2.07)#53 | 2.1%(+1.49)#5,856 |
| 54. | Rolla | 3.6% | 1.6%(+2.02)#54 | 2.1%(+1.43)#5,952 |
| 55. | Powers Lake | 3.5% | 1.6%(+1.92)#55 | 2.1%(+1.33)#6,180 |
| 56. | Granville | 3.5% | 1.6%(+1.91)#56 | 2.1%(+1.32)#6,196 |
| 57. | Cavalier | 3.4% | 1.6%(+1.85)#57 | 2.1%(+1.26)#6,358 |
| 58. | Rolette | 3.4% | 1.6%(+1.83)#58 | 2.1%(+1.24)#6,406 |
| 59. | Anamoose | 3.4% | 1.6%(+1.80)#59 | 2.1%(+1.21)#6,473 |
| 60. | Hettinger | 3.2% | 1.6%(+1.65)#60 | 2.1%(+1.07)#6,841 |
| 61. | Mayville | 3.2% | 1.6%(+1.62)#61 | 2.1%(+1.03)#6,933 |
| 62. | Mohall | 3.2% | 1.6%(+1.60)#62 | 2.1%(+1.01)#6,972 |
| 63. | Lincoln | 3.2% | 1.6%(+1.59)#63 | 2.1%(+1.00)#7,009 |
| 64. | Medina | 3.1% | 1.6%(+1.56)#64 | 2.1%(+0.977)#7,083 |
| 65. | Buffalo | 3.1% | 1.6%(+1.52)#65 | 2.1%(+0.929)#7,240 |
| 66. | Turtle Lake | 3.1% | 1.6%(+1.51)#66 | 2.1%(+0.922)#7,259 |
| 67. | Hazen | 3.0% | 1.6%(+1.46)#67 | 2.1%(+0.871)#7,423 |
| 68. | Menoken | 2.9% | 1.6%(+1.38)#68 | 2.1%(+0.793)#7,695 |
| 69. | Harwood | 2.9% | 1.6%(+1.33)#69 | 2.1%(+0.746)#7,838 |
| 70. | Fullerton | 2.9% | 1.6%(+1.30)#70 | 2.1%(+0.709)#7,969 |
| 71. | Carson | 2.8% | 1.6%(+1.24)#71 | 2.1%(+0.649)#8,159 |
| 72. | Buchanan | 2.8% | 1.6%(+1.22)#72 | 2.1%(+0.629)#8,240 |
| 73. | Donnybrook | 2.6% | 1.6%(+1.07)#73 | 2.1%(+0.483)#8,729 |
| 74. | Tower City | 2.6% | 1.6%(+1.02)#74 | 2.1%(+0.429)#8,910 |
| 75. | Mandan | 2.6% | 1.6%(+0.998)#75 | 2.1%(+0.410)#8,984 |
| 76. | Washburn | 2.5% | 1.6%(+0.927)#76 | 2.1%(+0.339)#9,252 |
| 77. | Park River | 2.4% | 1.6%(+0.854)#77 | 2.1%(+0.266)#9,523 |
| 78. | Dunseith | 2.4% | 1.6%(+0.812)#78 | 2.1%(+0.224)#9,710 |
| 79. | Northwood | 2.3% | 1.6%(+0.738)#79 | 2.1%(+0.150)#10,001 |
| 80. | Napoleon | 2.3% | 1.6%(+0.730)#80 | 2.1%(+0.142)#10,041 |
| 81. | Underwood | 2.3% | 1.6%(+0.719)#81 | 2.1%(+0.131)#10,086 |
| 82. | Taylor | 2.2% | 1.6%(+0.637)#82 | 2.1%(+0.049)#10,456 |
| 83. | Bowbells | 2.1% | 1.6%(+0.579)#83 | 2.1%(-0.009)#10,722 |
| 84. | Riverdale | 2.1% | 1.6%(+0.523)#84 | 2.1%(-0.065)#10,972 |
| 85. | Warwick | 2.1% | 1.6%(+0.523)#85 | 2.1%(-0.065)#10,976 |
| 86. | Hankinson | 2.1% | 1.6%(+0.501)#86 | 2.1%(-0.087)#11,082 |
| 87. | Lamoure | 2.1% | 1.6%(+0.501)#87 | 2.1%(-0.087)#11,083 |
| 88. | Fairmount | 2.1% | 1.6%(+0.494)#88 | 2.1%(-0.094)#11,129 |
| 89. | Velva | 2.0% | 1.6%(+0.480)#89 | 2.1%(-0.108)#11,184 |
| 90. | Marion | 2.0% | 1.6%(+0.480)#90 | 2.1%(-0.108)#11,194 |
| 91. | Willow City | 2.0% | 1.6%(+0.480)#91 | 2.1%(-0.108)#11,196 |
| 92. | Wishek | 2.0% | 1.6%(+0.471)#92 | 2.1%(-0.117)#11,231 |
| 93. | Rugby | 2.0% | 1.6%(+0.421)#93 | 2.1%(-0.167)#11,469 |
| 94. | Killdeer | 1.9% | 1.6%(+0.363)#94 | 2.1%(-0.225)#11,760 |
| 95. | Surrey | 1.9% | 1.6%(+0.360)#95 | 2.1%(-0.228)#11,793 |
| 96. | Page | 1.9% | 1.6%(+0.344)#96 | 2.1%(-0.244)#11,862 |
| 97. | Casselton | 1.9% | 1.6%(+0.303)#97 | 2.1%(-0.285)#12,053 |
| 98. | Larimore | 1.9% | 1.6%(+0.300)#98 | 2.1%(-0.288)#12,062 |
| 99. | Wilton | 1.8% | 1.6%(+0.274)#99 | 2.1%(-0.314)#12,196 |
| 100. | Ray | 1.8% | 1.6%(+0.267)#100 | 2.1%(-0.321)#12,239 |
Common Questions
What are the Top 10 Cities with the Highest Percentage of Population Employed in Security & Protection in North Dakota?
Top 10 Cities with the Highest Percentage of Population Employed in Security & Protection in North Dakota are:
What city has the Highest Percentage of Population Employed in Security & Protection in North Dakota?
Tolley has the Highest Percentage of Population Employed in Security & Protection in North Dakota with 41.7%.
What is the Percentage of Population Employed in Security & Protection in the State of North Dakota?
Percentage of Population Employed in Security & Protection in North Dakota is 1.6%.
What is the Percentage of Population Employed in Security & Protection in the United States?
Percentage of Population Employed in Security & Protection in the United States is 2.1%.