Zip Codes with the Highest Percentage of Population Employed in Security & Protection in Irvine, CA
RELATED REPORTS & OPTIONS
Security & Protection
Irvine
Compare Zip Codes
Map of Zip Codes with the Highest Percentage of Population Employed in Security & Protection in Irvine
0.40%
3.3%
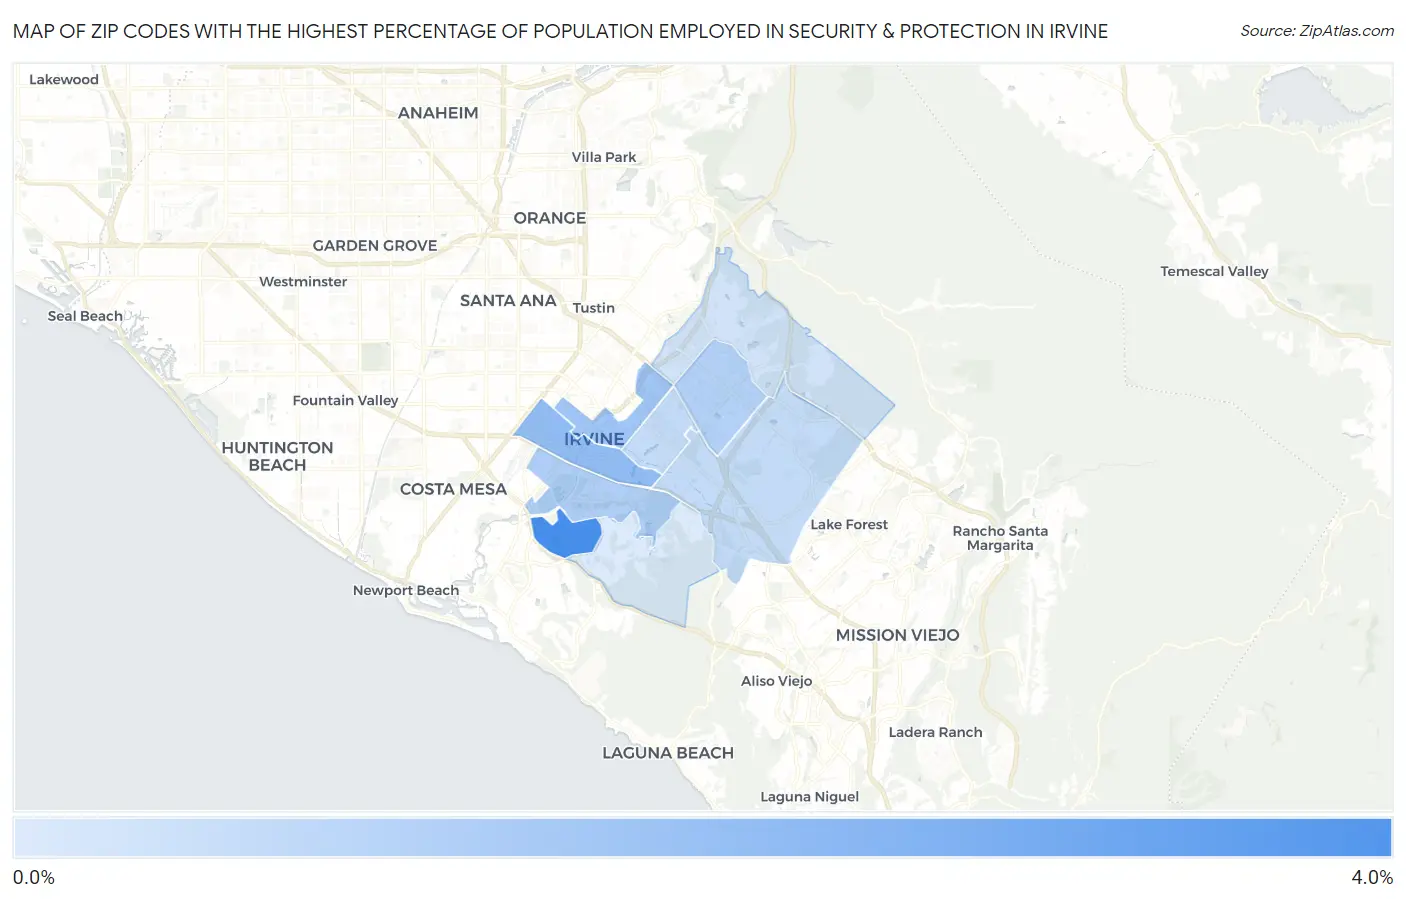
Zip Codes with the Highest Percentage of Population Employed in Security & Protection in Irvine, CA
| Zip Code | % Employed | vs State | vs National | |
| 1. | 92617 | 3.3% | 2.1% (+1.26)#305 | 2.1% (+1.19)#6,121 |
| 2. | 92614 | 1.9% | 2.1% (-0.192)#759 | 2.1% (-0.260)#13,310 |
| 3. | 92606 | 1.6% | 2.1% (-0.501)#908 | 2.1% (-0.569)#15,571 |
| 4. | 92612 | 1.3% | 2.1% (-0.804)#1,061 | 2.1% (-0.871)#17,927 |
| 5. | 92620 | 1.2% | 2.1% (-0.881)#1,099 | 2.1% (-0.949)#18,508 |
| 6. | 92618 | 0.89% | 2.1% (-1.19)#1,226 | 2.1% (-1.26)#20,886 |
| 7. | 92604 | 0.87% | 2.1% (-1.21)#1,227 | 2.1% (-1.28)#20,971 |
| 8. | 92602 | 0.62% | 2.1% (-1.46)#1,316 | 2.1% (-1.53)#22,565 |
| 9. | 92603 | 0.40% | 2.1% (-1.68)#1,367 | 2.1% (-1.75)#23,733 |
1
Common Questions
What are the Top 5 Zip Codes with the Highest Percentage of Population Employed in Security & Protection in Irvine, CA?
Top 5 Zip Codes with the Highest Percentage of Population Employed in Security & Protection in Irvine, CA are:
What zip code has the Highest Percentage of Population Employed in Security & Protection in Irvine, CA?
92617 has the Highest Percentage of Population Employed in Security & Protection in Irvine, CA with 3.3%.
What is the Percentage of Population Employed in Security & Protection in Irvine, CA?
Percentage of Population Employed in Security & Protection in Irvine is 1.2%.
What is the Percentage of Population Employed in Security & Protection in California?
Percentage of Population Employed in Security & Protection in California is 2.1%.
What is the Percentage of Population Employed in Security & Protection in the United States?
Percentage of Population Employed in Security & Protection in the United States is 2.1%.